


Languages
Pages
Legal


Leaching requirement for soil salinity control:Steady-state versus transient models
Dennis L. Corwin a,*, James D. Rhoades b,1, Jirka Simunek c,2
aUSDA-ARS, U.S. Salinity Laboratory, 450 West Big Springs Road, Riverside, CA 92507-4617, United StatesbAgricultural Salinity Consulting, 17065 Harlo Hts., Riverside, CA 92503, United StatescDepartment of Environmental Sciences, University of California, Riverside, CA 92521, United States
a g r i c u l t u r a l w a t e r m a n a g e m e n t 9 0 ( 2 0 0 7 ) 1 6 5 – 1 8 0
a r t i c l e i n f o
Article history:
Accepted 15 February 2007
Published on line 19 March 2007
Keywords:
Imperial valley
Leaching fraction
Irrigation
Drainage
a b s t r a c t
Water scarcity and increased frequency of drought conditions, resulting from erratic
weather attributable to climatic change or alterations in historical weather patterns, have
caused greater scrutiny of irrigated agriculture’s demand on water resources. The tradi-
tional guidelines for the calculation of the crop-specific leaching requirement (LR) of
irrigated soils have fallen under the microscope of scrutiny and criticism because the
commonly used traditional method is believed to erroneously estimate LR due to its
assumption of steady-state flow and disregard for processes such as salt precipitation
and preferential flow. An over-estimation of the LR would result in the application of
excessive amounts of irrigation water and increased salt loads in drainage systems, which
can detrimentally impact the environment and reduce water supplies. The objectives of this
study are (i) to evaluate the appropriateness of the traditional steady-state method for
estimating LR in comparison to the transient method and (ii) to discuss the implications
these findings could have on irrigation guidelines and recommendations, particularly with
respect to California’s Imperial Valley. Steady-state models for calculating LR including the
traditional model, which is an extension of the original U.S. Salinity Laboratory LR model,
WATSUIT model, and water-production-function model were compared to transient mod-
els including TETrans and UNSATCHEM. The calculated LR was lower when determined
using a transient approach than when using a steady-state approach. Transient conditions
and the influence of preferential flow did not have as significant an effect on lowering the LR
as salt precipitation for a representative study of the Imperial Valley using Colorado River
water (EC = 1.23 dS/m) for irrigation. A valley-wide LR of 0.08 for a crop rotation of alfalfa/
alfalfa/alfalfa/alfalfa/wheat/lettuce, as calculated by both WATSUIT and UNSATCHEM, was
concluded to be the most reasonable estimate for the entire Imperial Valley as compared to a
LR of 0.13 by the commonly used traditional method. The reduced LR for the Imperial Valley
would result in a diminished drainage volume of approximately 1.23 � 108 m3 (i.e.,
100,000 ac-ft). The most significant conclusion derived from the comparison is that the
use of the traditional steady-state model for estimating LR needs to be reevaluated.
# 2007 Elsevier B.V. All rights reserved.
avai lab le at www.sc iencedi rec t .com
journal homepage: www.e lsev ier .com/ locate /agwat
* Corresponding author. Tel.: +1 951 369 4819; fax: +1 951 342 4962.E-mail addresses: [email protected] (D.L. Corwin), [email protected] (J.D. Rhoades), [email protected] (J. Simunek).
1 Tel.: +1 951 780 3489.2 Tel.: +1 951 827 7854.
Abbreviations: EC, electrical conductivity; ET, evapotranspiration; LF, leaching fraction; LR, leaching requirement; WPF, water-produc-tion-function0378-3774/$ – see front matter # 2007 Elsevier B.V. All rights reserved.doi:10.1016/j.agwat.2007.02.007
a g r i c u l t u r a l w a t e r m a n a g e m e n t 9 0 ( 2 0 0 7 ) 1 6 5 – 1 8 0166
1. Introduction
The accumulation of excess soluble salts in the root zone of arid
and semi-arid irrigated soils is a widespread problem that
seriously affects crop productivity throughout the world. The
predominant mechanism causing the accumulation of salt in
irrigated agricultural soils is evapotranspiration, which con-
centrates salts in theremaining soil water. Effects of soil salinity
are manifested in loss of stand, reduced plant growth, reduced
yields, and in severe cases, crop failure. Salinity limits water
uptake by plants by reducing the osmotic potential making it
more difficult for the plant to extract water. Some constituents
of salinity may also cause specific-ion toxicity or upset the
nutritional balance of plants. In addition, the salt composition
of the soil water influences the composition of cations on the
exchange complex of soil particles, which influences soil
permeability and tilth. Irrigated agriculture, which accounts
for 35–40% of the world’s total food and fiber, is adversely
affected by soil salinity on roughly half of all irrigated soils
(totaling about 250 million ha) with over 20 million ha severely
affected by salinity worldwide (Rhoades and Loveday, 1990).
To prevent the accumulation of excessive soluble salts in
irrigated soils, more water than required to meet the evapo-
transpiration needs of the crops must pass through the root
zone to leach excessive soluble salts. This additional irrigation
water has typically been expressed as the leaching requirement
(LR). Leaching requirement was originally defined as the
fraction of infiltrated water that must pass through the root
zone to keep soil salinity from exceeding a level that would
significantly reduce crop yield under steady-state conditions
with associated good management and uniformity of leaching
(U.S. Salinity Laboratory Staff, 1954; Rhoades, 1974). Reclama-
tion of inherently saline soils, or of soils allowed to salinize
through under-irrigation and other similarly inappropriate
forms of management (e.g., by fallowing soils for extended
periods of time in the presence of a shallow water table), is not
includedinthe determination of theLR. Rootwaterextractionof
shallow groundwater, runoff, and leaching from effective
precipitation are also not considered.
The relationship between crop yield and seasonal amount of
water required is essential to determine the optimum irrigation
management (Letey et al., 1985). As pointed out by Letey et al.
(1985), LR does not provide sufficient information concerning
optimum irrigation since optimum irrigation is the amount of
water that maximizes profit and maximum profit may not
coincide at all times with maximum yield. For this reason, crop-
water-production-functions have been advocated as a means of
determining theeconomicallyoptimum amountof water that is
needed to prevent excessive accumulation of salts. Never-
theless, LR is still widely used by growers and irrigation
management districts in the southwestern USA and many
other semi-arid regions of the world.
The traditional method used to determine LR was devel-
oped by Rhoades (1974) from the original steady-state LR
model of the U.S. Salinity Laboratory Staff (1954). Steady-state
conditions do not exist under most field situations. This raises
the question of the appropriateness of the traditional method
for more common transient conditions. The traditional
method also ignores the chemical processes of salt precipita-
tion which can, in some cases, significantly reduce levels of
soil salinity within the root zone and, thus, reduce LR.
Furthermore, the traditional method does not account for
preferential flow, which influences water flow and the
efficiency of salt leaching. With these concerns in mind, the
objectives of this study are (i) to evaluate the appropriateness
of the traditional steady-state model for estimating LR in
comparison to other steady-state models and transient
models by establishing if differences exist, the extent of the
differences, and the reasons for the differences, and (ii) to
discuss the implications these findings could have on
irrigation guidelines and recommendations, particularly with
respect to California’s Imperial Valley. If differences occur
between the traditional LR model and more rigorous and
robust transient models, then the assumption of steady-state
is brought into question and a new paradigm may be needed,
particularly for research applications. The comparison of
transient approaches for estimating LR, which account for
processes such as bypass flow or precipitation–dissolution
reactions, with the traditional steady-state approach is
intended to ascertain if the current means of estimating LR
from a functional, steady-state model needs reevaluation and
if a reevaluation is indeed needed, then (i) what is the
weakness in the traditional approach for estimating LR and (ii)
what is the recommended course of action. Other questions
that may affect LR, such as rainfall, irrigation uniformity
resulting from the type of irrigation (e.g., flood, sprinkler, or
drip irrigation), the manner in which spatio-temporal varia-
tion in salinity within the root zone affects crop response and
water uptake, and scale issues are not addressed in the model
comparison. Furthermore, no discussion is given to additional
factors that influence the estimation of LR including (i)
horizontal leaching and subsequent redistribution of salts
for cracking soils when flood irrigation is used, (ii) basing the
LR on the most salt-sensitive crop in a crop rotation, and (iii)
uncertainties in salt-tolerance data developed from experi-
mental plots when applied to field situations, but these are
discussed in Rhoades (1999).
2. Review of leaching requirement methods
The level and distribution of salinity in cropped soils are the
result of time-dependent interactions of rainfall, irrigation,
evapotranspiration, leaching, and drainage. These interac-
tions and relationships involving crop yield, root water
extraction, soil salinity, irrigation, salt-loading, leaching,
and drainage are complicated and are not fully understood
or quantified. Some models have been developed to describe
these interactions and relationships, but few have been tested
and shown to be applicable for the estimation of LR under a
wide variety of field conditions. Moreover, the estimated LR
results of these models have been compared for a given set of
cropping conditions in only one instance. Five different
steady-state LR models were compared against field and plot
experiments by Hoffman (1985) with the model by Hoffman
and van Genuchten (1983) fitting the results best. However,
this comparison involved conditions of high frequency
irrigation, which may not necessarily apply to general
irrigation management in the field. One of the most
comprehensive modeling studies of transient conditions

a g r i c u l t u r a l w a t e r m a n a g e m e n t 9 0 ( 2 0 0 7 ) 1 6 5 – 1 8 0 167
was carried out by Goncalves et al. (2006) who analyzed
transient water flow and solute transport in three soil
lysimeters irrigated with waters of different quality over a
period of 3 years using the HYDRUS-1D (Simunek et al., 2005)
model with implemented major ion chemistry sub-routines
from UNSATCHEM. In this study, HYDRUS-1D successfully
described field measurements of water content, overall
salinity, concentration of individual soluble cations, as well
as the sodium adsorption ratio and exchangeable sodium
percentage. No comparison has been made in the past of
steady-state and transient models for estimating LR.
Five models have been selected to compare and contrast
their estimation of LR to meet our study’s objectives: (i) the
traditional LR model originally developed by the USDA-ARS,
U.S. Salinity Laboratory (U.S. Salinity Laboratory Staff, 1954)
and modified by Rhoades (1974), (ii) WATSUIT (Rhoades and
Merrill, 1976), (iii) water-production-function (WPF) model
(Letey et al., 1985), (iv) TETrans (Corwin et al., 1990), and (v)
UNSATCHEM (Simunek and Suarez, 1994). These models
were specifically selected because they reflect a spectrum of
categories of models ranging from steady-state to transient
models and from functional to mechanistic, they provide
potential insight into the influence of physical and chemical
processes (e.g., precipitation and dissolution, preferential
flow, and plant water uptake) on the estimation of LR, and
they are well-known and understood by the authors. The
traditional LR, WATSUIT, and WPF models are steady-state
models while TETrans and UNSATCHEM are transient
models. The WATSUIT and UNSATCHEM models account
for precipitation and dissolution reactions while the tradi-
tional LR, WPF, and TETrans models do not. The WPF model is
unique in its handling of ET and plant yield as influenced by
matric and osmotic stress. Finally, TETrans is the only model
within the group that accounts for preferential flow. There
are a number of other models that could have been used also,
such as the steady-state model by Hoffman and van
Genuchten model (1983) and the transient models MACRO
by Jarvis (1994) and ENVIRO-GRO by Pang and Letey (1998),
just to name a few. These models were not used in the
comparison because the authors were not as knowledgeable
about and familiar with these models as the five selected
models.
2.1. Steady-state leaching requirement models
Steady-state LR models consist of the original model devel-
oped by the U.S. Salinity Laboratory Staff (1954) and
subsequent models based on steady-state or long-time
average conditions. These models were based on simple
salt-balance concepts, though some refinements were made
to account for salt precipitation and dissolution reactions.
2.1.1. Traditional leaching requirement modelAs originally published in Handbook 60 (U.S. Salinity Labora-
tory Staff, 1954) the original LR model is based on the concept
of leaching fraction (LF) for steady-state conditions with no
precipitation or dissolution and good drainage:
LF ¼ Vdw
Vinf¼ ECiw
ECdw(1)
where Vdw (mm) and Vinf (mm) are the volumes of drainage
water and infiltrating irrigation water, respectively, and ECiw
(dS/m) and ECdw (dS/m) are the electrical conductivities of the
irrigation and drainage water, respectively.
The LR was originally defined by U.S. Salinity Laboratory
Staff (1954) as the lowest value of LF that could be allowed
without ECdw (and thus, inferentially, soil salinity) becoming
excessive for optimum plant growth. Thus, the minimum value
of LF (i.e., LR) would be given when the maximum permissible
salinity level of ECdw (i.e., EC�dw) was inserted into Eq. (1)
resulting in Eq. (2), which is considered the original LR model:
LR ¼ ECiw
EC�dw
(2)
The LR is an estimate of what the LF must be to keep soil
water salinity within tolerable limits for crop production.
Eq. (2) must still include a relationship between plant response
and EC of the bottom of the root zone.
The determination of LR, as originally formulated in Eq. (2),
required the selection of the appropriate value of EC�dw for the
crop in question. Such crop-related values were not known
and would be expected to vary with irrigation water salinity
and irrigation/drainage management. However, data obtained
from controlled studies carried out in test plots utilizing
relatively uniform soil conditions and optimal irrigation and
crop management were available (Bernstein, 1974; Maas and
Hoffman, 1977). These controlled studies related the response
of many crops to average root zone soil salinity in terms of the
EC of the saturation extract, ECe (dS/m), which is approxi-
mately half that of the soil water salinity at field-capacity (U.S.
Salinity Laboratory Staff, 1954). The nearly uniform root zone
ECe values that resulted in 50% yield decreases in forage, field,
and vegetable crops and 10% yield decreases in fruit crops
were originally substituted for EC�dw in Eq. (2) to estimate LR.
No direct evidence or clear reasoning was given to support the
appropriateness of this substitution or the corresponding LR
values. Another inherent assumption in the original approach
used to determine LR is that plants respond primarily to
average root zone soil salinity. This assumption is not always
true. Some evidence for this conclusion is given in Rhoades
and Merrill (1976).
Rhoades (1974) introduced a procedure for determining
appropriate values of EC�dw for use in Eq. (2) using Eq. (3):
EC�dw ¼ 5EC�e � ECiw (3)
where EC�e (dS/m) is the average EC of the saturation extract for
a given crop appropriate to the tolerable degree of yield
depression usually 10% or less and equivalent to the threshold
EC values as defined by Maas (1990). Substitution of Eq. (3) into
Eq. (2) yields Eq. (4), which has become referred to as the
traditional LR model:
LR ¼ ECiw
5EC�e � ECiw(4)
Eq. (4) ties LR to irrigation water salinity and crop tolerance.
The LR values obtained by Eq. (4) (i.e., the traditional LR model)
are lower, especially for salt-tolerant crops, than those
a g r i c u l t u r a l w a t e r m a n a g e m e n t 9 0 ( 2 0 0 7 ) 1 6 5 – 1 8 0168
obtained by Eq. (2) (i.e., the original LR model). The traditional
LR model assumes uniform water applications and does not
adjust for salt precipitation or dissolution, nor does it account
for irrigation frequency effects, upward water flow, water
chemical composition, and salt removal in surface runoff.
2.1.2. WATSUIT modelIn contrast to the traditional steady-state model previously
described, WATSUIT considers the composition of the irriga-
tion water and includes the processes of salt precipitation and
mineral weathering. Salt precipitation and mineral weath-
ering can significantly affect the levels of soil salinity,
depending upon irrigation water composition and LF (Rhoades
et al., 1974). The assumption is made that plant water uptake
occurs from successively deeper quarter-fractions of its root
zone in the ratios of 40/30/20/10. The concentrations of the
major cations and anions in the soil water within an irrigated
root zone are predicted at equilibrium by WATSUIT as a
function of the irrigation water composition, LF, presence or
absence of soil CaCO3, and several alternative amendment
treatments such as gypsum. The WATSUIT model accounts for
the precipitation and dissolution of the two most relevant soil
minerals, calcite and gypsum (Rhoades and Merrill, 1976).
With WATSUIT, the LR is determined by accounting for the
chemistry of the irrigation water and soil mineralogy to
estimate the LF for which the level of average root zone
salinity equals the threshold value for the crop in question
(i.e., the maximum salinity that can be tolerated without
excessive loss in yield). The WATSUIT model also considers
irrigation management in the determination of LR, distin-
guishing between conventional irrigation and high-frequency
forms of irrigation.
In WATSUIT, the effect of salinity on evapotranspiration
(ET; mm) is not taken into account. Rather, it is assumed that
there will be no loss in yield due to salinity and concomitantly
no loss in ET, provided the average root zone salinity does not
exceed the threshold value of salinity (EC�e; dS/m). The same
assumption is also made in the TETrans model, which is
discussed later. The WATSUIT model also assumes uniform
water application and does not account for the effects of
irrigation frequency and upward water flow from a shallow
water table.
2.1.3. Water-production-function modelIn order to calculate drainage volumes and soil salinity under
less than optimum yield conditions, some approach is needed
to reduce ET, thereby increasing LF and drainage, when excess
salinity buildup causes reduced ET by plants. A simplified,
practical model was developed for this purpose by Letey et al.
(1985). This model includes the effects of total water
application on crop yield as well as LF.
The premise of the WPF model is that a unique relationship
exists between yield and ET for a given crop and climate that is
independent of whether the water stress leading to a
reduction in ET is caused by deficit water, excess salinity, or
some combination of the two. Excess salinity will decrease
crop yield due to osmotic stress. This reduced yield ought to be
associated with a decrease in plant size, and thus, a decrease
in ET. For a given amount of irrigation, leaching will increase
as ET decreases, which will reduce the level of soil salinity.
Thus, some point will exist at which values for yield, ET,
leaching, and soil salinity are consistent with one another. The
yield at this point is the yield that can be achieved with a given
irrigation water quantity and salinity; the LF will be dependent
on the salt-tolerance of the crop and irrigation water salinity.
Letey et al. (1985) combined three relationships: (i) yield and
ET, (ii) yield and average root zone salinity (conventional crop
salt-tolerance relations), and (iii) average root zone salinity
and LF to develop an equation that relates yield to the amount
of seasonal applied water of a given salinity for steady-state
conditions. A linear relationship between yield and ET was
assumed in the model. The exponential water uptake relation
of Raats (1974) was used to relate average root zone salinity
and LF assuming steady-state. The resulting equation (given in
Letey et al., 1985) provides a model for predicting salinity,
yield, drainage volume, and the salinity of the water
percolating below the root zone for given quantities of
seasonal applied water of a given salinity for steady-state
conditions. The model assumes uniform water applications
and does not adjust for salt precipitation or dissolution, nor
does it account for effects of irrigation frequency, upward
water flow from a shallow water table, and water composition.
The model was modified (Rhoades et al., 1992) to give results in
terms of relative yield and relative water (in terms of ETmax,
i.e., the non-stressed ET given the crop and climate).
The advantage of this model is that simple calculations and
measurements are used to predict crop yield, drainage
volume, and drain water salinity. Although it has never been
used to estimate LR, it can be used to do so. For this purpose,
the lowest value of LF that can be used without any (or
excessive loss) loss in yield would be equivalent to the LR.
2.2. Transient leaching requirement models
Leaching requirement is an agricultural concept that was
originally based on an assumption of steady-state conditions.
Over long time periods when steady-state conditions can be
more closely approximated, the traditional concept of LR
applies quite well. However, perturbations to the system (e.g.,
change in crop, alteration of irrigation management, intro-
duction of varying irrigation water quality, etc.) result in
transient conditions, which reduce the general applicability of
the traditional LR model approach, rendering a temporal
tracking of the system with transient approaches more
appropriate.
2.2.1. TETransThe TETrans model is a functional, ‘‘tipping-bucket’’, layer-
equilibrium model that predicts incremental changes over
time in amounts of solute and water content occurring within
the crop root zone (Corwin et al., 1990; Corwin and Waggoner,
1990a,b). In TETrans, transport through the root zone is
modeled as a series of events or processes within a finite
collection of discrete depth intervals. These sequential events
or processes include infiltration of water, drainage to field-
capacity, plant water uptake resulting from transpiration,
and/or evaporative losses from the soil surface. Each process is
assumed to occur in sequence within a given depth interval as
opposed to reality where transport is a collection of simulta-
neous processes. Other assumptions include: (i) the soil is
a g r i c u l t u r a l w a t e r m a n a g e m e n t 9 0 ( 2 0 0 7 ) 1 6 5 – 1 8 0 169
composed of a finite series of discrete depth intervals with
each depth interval having homogeneous properties, (ii)
drainage occurs through the profile to a depth-variable
field-capacity water content, (iii) the depletion of stored water
by evapotranspiration within each depth increment does not
go below a minimum water content that will stress the plant,
(iv) dispersion is either negligible or part of the phenomenon of
bypass, and (v) upward or lateral water flow does not occur.
Included within TETrans is a simple mechanism to account
for preferential flow or bypass. The phenomenon in which all
or part of the infiltrating water passes through a portion or all
of the soil profile via large pores or cracks without contacting
or displacing water present within finer pores or soil
aggregates is referred to as bypass. This process is typical of
cracking clay soils (such as those in the Imperial Valley). The
net effect of bypass is that some resident salt is not miscibly
displaced by incoming water; this reduces the leaching
efficiency and increases the amount of salt retained within
successive soil-depth intervals. The TETrans model offers a
means to quantify the importance of bypass in estimating LR
for such soils.
In TETrans, bypass is approximated using a simple mass-
balance approach; it is simulated by ascribing a spatial
variation in the fractional quantity (or % water bypass) of
the resident pore-water present in the soil at the time an
infiltration event occurs that is not involved in piston-type
displacement following the event. The means of estimating
bypass is by assuming that any deviation from piston flow for
the transport of a conservative solute is due to bypass (Corwin
et al., 1990).
The total amount of ET occurring between irrigation events
and the plant root distribution are needed as inputs in
TETrans. Plant water uptake is simulated by reducing the
amount of water in the soil over time in accordance with the
assumed rate of ET and in proportion to the changing rooting
distribution that occurs within the soil profile as the crop
matures and the roots grow. Root growth is assumed to occur
linearly from the date of planting to the date of maturity.
Between crops, water loss from the root zone is simulated as
evaporation from the soil surface. The distribution of water
removal by the plant root system is simulated by a choice of
extraction models: linear and exponential. Concomitant with
the removal of water by the roots is the concentration of the
salts. Salt precipitation and mineral weathering are not
considered in TETrans, nor does the model predict crop-yield
reductions caused by salinity stress.
2.2.2. UNSATCHEMThe UNSATCHEM model is a sophisticated transient, numer-
ical model that simulates the flow of water in unsaturated
soils, along with transport and chemical reactions of solutes,
and crop response to salinity (Simunek and Suarez, 1994;
Simunek et al., 1996). The model has submodels accounting for
major ion chemistry, crop response to salinity, CO2 production
and transport, time-varying concentration in irrigated root
zones, and the presence of shallow groundwater. While
variably-saturated water flow is assumed to be described
using the Richards equation, the transport of solutes and CO2
is described using the convection–dispersion equation. Root
growth is described using the logistic growth function and root
distribution can be made user-specific. Precipitation, evapo-
transpiration, and irrigation fluxes can be specified at any
user-defined time interval.
While UNSATCHEM has not been used to determine LR, it is
suited to do so by determining the minimum LF that can be
used under a specified set of soil, crop, and management
conditions while preventing undue losses in crop yields. The
UNSATCHEM model does not account for the phenomenon of
bypass. The complex transient chemical processes included
are precipitation and/or dissolution of solid phases, cation
exchange, and complexation reactions as influenced by the
CO2 composition of the soil air, which largely controls the soil
pH, as well as sulfate ion association, which affects the
solubility of gypsum. Since the original version of
UNSATCHEM could simulate only a single growth season,
UNSATCHEM was modified for this study to include a restart
option that allows simulation of a subsequent growth season
using final conditions of the previous season.
3. Modeling conditions
In order to estimate LR using the previously described steady-
state and transient models, a data base is needed for the
following: climate, crops grown, crop rotations, solute trans-
port-related soil properties, irrigation management practices,
drainage conditions, and irrigation water composition. For the
purposes of this comparative study, a set of realistic condi-
tions and properties was sought so that the estimated LRs
from the models could be compared. A data set was developed
from available data sources representative of California’s
Imperial Valley (for details see Rhoades, 1999).
To estimate the LR for the entire Imperial Valley, one must
consider the crop sequence grown and associated rooting
depth on each and every individual field. Even if known, the
combinations would be too many to consider individually.
Thus, a single rotation was sought that would be representa-
tive of the valley-wide cropping pattern. From available
records, it was found that the dominant crops grown in the
Imperial Valley during the period 1989–1996 were field crops
(177,130 ha/year), followed by garden crops (48,626 ha/year)
and permanent crops (9244 ha/year); totaling 235,000 ha/year.
Among the field crops, alfalfa was dominant (77,320 ha/year)
followed by wheat (30,840 ha/year). Among the garden crops,
lettuce and cantaloupes dominated with 11,480 and 9615 ha/
year, respectively. Consequently, a representative crop rota-
tion would be alfalfa (grown for several consecutive years),
followed by wheat and lettuce (or cantaloupes) in sequence.
This rotation was selected as a basis for evaluating the various
models for estimating LR for the Imperial Valley.
In order to determine the LR of a crop rotation, an
appropriate schedule of irrigation and farming events must
be established, along with the intervening amounts of ET, for
the corresponding time periods. A schedule of events (i.e.,
planting and harvesting dates, dates and amounts of irrigation
and rainfall, root development periods, mature root penetra-
tion depths, root water extraction patterns, stages of plant
growth, and ET amounts for the period of the crop rotation)
was developed for the 6-year crop rotation of alfalfa/alfalfa/
alfalfa/alfalfa/wheat/lettuce. Imperial Water District reports

a g r i c u l t u r a l w a t e r m a n a g e m e n t 9 0 ( 2 0 0 7 ) 1 6 5 – 1 8 0170
and data in Circulars 104-F and 104-V of the University of
California Cooperative Extension for the Imperial Valley were
used to develop the schedule (UCCE, 1996a,b), together with
personal communications with Kalid M. Bali (Imperial Valley
Farm Advisor, Irrigation/Water Science) and Marvin Jensen
(Agricultural Consultant to the Bureau of Reclamation). These
data were incorporated into a spreadsheet and used as the
input data for the transient model simulations.
The resultant irrigation schedule was representative of
irrigation practices in the Imperial Valley. Briefly, two
irrigations occurred between cuttings of alfalfa; cuttings were
made 6 days after the last previous irrigation; irrigations were
resumed 12 days after each cutting. Thus, irrigations were
scheduled about every 18 days during alfalfa production. For
wheat, a pre-irrigation was followed by the first irrigation 45
days later and then about every 3 weeks thereafter until the
ripening period began. Irrigation amounts were assumed to be
11.25 cm of water each time, except for pre-plant irrigations of
15 cm. For lettuce, 20 cm of irrigation water were applied 21
days before planting, 30 cm (spread over 3 days) were applied
at planting time and, thereafter, about every 2 weeks until
harvest in irrigation amounts of 11.25 cm of water each time.
Some changes in the timings and amounts of irrigations were
made after it was observed (during computer simulations) that
the above described irrigations were either too infrequent (as
occurred during alfalfa production) or too excessive (as
occurred during wheat and lettuce production).
For purposes of estimating the crop evapotranspiration,
ETc (= ET0Kcb), crop coefficients (Kcb) were developed for each
of the four growth stages based on values provided in the
Imperial Water District reports. These coefficient values were
modified on the advice of Marvin Jensen (personal commu-
nication) using Eq. (6.64) of ASCE Manual 70 to provide for the
higher amounts of evaporation that occur from wet soil
surfaces immediately after rain and irrigation events (Jensen
et al., 1990). The values used for potential reference evapo-
transpiration (ET0) are those obtained by multiplying the
average daily values measured at the CIMIS-68 Station by the
factor 1.05 (based on personal communications with Marvin
Jensen).
Leaching will be more difficult to achieve while alfalfa is
growing because of its high rate of ET, especially in the
summer, and limited opportunities for irrigation caused by the
numerous cutting, drying, and harvesting operations that
occur. Thus, salinity would be more likely to accumulate to
excessive levels during this period in the rotation. Since wheat
is more tolerant of salinity than alfalfa, the required leaching
will be less during its period of growth, assuming no extra
leaching is needed to mitigate any excess build-up of salinity
that occurs during alfalfa production, which is a question to be
answered from the simulations. This, in turn, offers another
opportunity for additional soil salinization to occur before
lettuce production occurs. Lettuce is one of the more salt-
sensitive crops grown in the Imperial Valley. Thus, the chosen
rotation should provide an appropriate test of whether, or not,
special reclamation leaching (i.e., leaching in addition to that
considered in the LR) is typically needed in the Imperial Valley,
or whether, or not, the leaching provided to all crops in the
rotation should be that required by the most salt-sensitive
crop grown in the rotation (i.e., lettuce in this case).
The conventional salt-tolerance data of Maas (1990),
relating crop response to average root zone soil salinity, were
used as the basis for estimating LR. The conventional salt-
tolerance parameters (i.e., intercept and slope) for alfalfa,
wheat, and lettuce are: 2.0 dS/m and 7.3% per dS/m increase in
ECe, 6.0 dS/m and 7.1%, and 1.3 dS/m and 13.0%, respectively
(Maas, 1990). Alfalfa is classified as a moderately sensitive
crop, wheat as a moderately tolerant crop, and lettuce as a
moderately sensitive crop. Thus, the chosen rotation will
require a relatively high degree of leaching because the
preponderance of water-use is by relatively salt-sensitive
crops. Less leaching would be required, if more salt-tolerant
crops were grown or their proportional use of the total water
supply was greater.
While soil properties do not directly affect the LR, they do
affect it indirectly by influencing the leaching efficiency. Soil
properties directly affect irrigation management since water
holding capacity, infiltration rate, and hydraulic conductivity
properties of soils establish the timing and duration limits of
irrigation. The dominant soil series of the Imperial Valley in
terms of area and surface permeabilities are as follows:
Imperial (44%; 0.15–0.5 cm/h), Holtville (15%; 0.15–0.5 cm/h),
Glenbar (15%; 0.5–1.5 cm/h), Indio (6%; 1.5–5 cm/h), Meloland
(8%; 1.5–15 cm/h), Niland and Rositas (4%; 15–50 cm/h). The
shrink–swell character of the Imperial soil is classified as high,
of the Glenbar soil as moderate, of the Holtville soil as high to
low, and of the others as low. The dominant soils of the Valley
have low infiltration rates and moderate to high shrink–swell
properties. For purposes of the computer simulations, the
water holding and transmission properties of the soils were
assumed to be similar to those of the dominant Imperial silty-
clay and Holtville silty-clay soil types, as given in Perrier et al.
(1974) and based on unpublished data from a lysimeter study
using Imperial silty-clay soil taken from the Brawley Experi-
ment Station in California’s Imperial Valley: a dry-weight
moisture content of 0.45 g/g at field-capacity, a dry-weight
moisture content of 0.20 g/g at permanent wilting, a bulk
density of 1.5 g/cm3, an average infiltration rate of about
0.33 cm/h, and a field-capacity/saturation percentage ratio of
0.5. The hydraulic properties used in the UNSATCHEM simula-
tions were those estimated using the sub-routines contained
within the program based on soils with similar permeabilities.
The initial condition for the electrical conductivity of salt in soil
solution through the soil profile was assumed to be 1.4, 2.0, 3.0,
and 4.0 dS/m for the depth increments of 0–0.3, 0.3–0.6, 0.6–0.9,
and 0.9–1.2 m, respectively.
An approximation of representative preferential flow for
Imperial silty-clay soil was also obtained from the lysimeter
study. An analysis of time domain reflectometry and an
optimized fit of TETrans to tracer data from the study
indicated that preferential flow was dominated by flow
through surface cracks extending to depths ranging from 15
to 45 cm. The preferential flow through surface cracks
occurred until the cracks were swollen closed, after which
preferential flow was substantially reduced and subsequently
dominated by flow through macropores scattered throughout
the profile. The assumed depth of penetration for the surfaces
cracks was set at 30 cm, representing the mid-point of the
range of cracks found in the lysimeter study, which was
assumed to be representative of the Imperial silty-clay soil.
a g r i c u l t u r a l w a t e r m a n a g e m e n t 9 0 ( 2 0 0 7 ) 1 6 5 – 1 8 0 171
The average salinity levels and compositions of the
Colorado River during the period 1990–1996 were established
using monthly compositional data supplied by Mark Niblack of
the Bureau of Reclamation-Yuma, AZ office. The average EC
value was 1.23 dS/m. The corresponding average values of
major solute concentrations were: 5.89 mmolc/L (Na),
0.13 mmolc/L (K), 4.30 mmolc/L (Ca), 2.70 mmolc/L (Mg),
2.97 mmolc/L (alkalinity), 3.42 mmolc/L (Cl), and 6.29 mmolc/
L (SO4).
4. Results of leaching requirementassessments
The results obtained with each method for determining LR are
presented and discussed separately in this section. First, the
steady-state methods are discussed for the traditional, WAT-
SUIT, and WPF models, followed by the transient methods for
TETrans and UNSATCHEM, and finally the results are
compared. In all cases rainfall was ignored since rainfall in
the Imperial Valley is so low.
4.1. Traditional model
As shown in Table 1, the LR values determined by the
traditional method from Eq. (4) for the individual alfalfa,
wheat, and lettuce crops are 0.14, 0.04, and 0.23, respectively,
assuming the EC of the irrigation water (i.e., Colorado River) is
1.23 dS/m, and the tolerable levels of average root zone soil
salinity are 2.0, 6.0, and 1.3 dS/m, respectively. The weighted
average LR for the 6-year rotation during crop growth and the
6-year rotation during growth and overall rotation periods
were 0.14 and 0.13, respectively, assuming the ETc values for
alfalfa, wheat, and lettuce are 5273, 668, and 233 mm,
respectively (Table 1). Additional irrigation water must be
added to compensate for the amount of ETc (actually, for E)
that occurs during unplanted periods and for the depletion
Table 1 – Leaching requirements (LR) as determined by the tra
Period Leaching requir
ETca (mm) LRb
Alfalfa (Year 1) 1642 0.14
Alfalfa (Year 2) 1740 0.14
Alfalfa (Year 3) 1740 0.14
Alfalfa (Year 4) 1511 0.14
Wheat 668 0.04
Lettuce 233 0.23
Crop growth 7534
Overall 7731
a Crop evapotranspiration (ETc) from Table A-2 (UCCE, 1996a).b Leaching requirement (LR) obtained from Fig. 1b.c Required irrigation, Viw = ETc/(1 � LR).d Required drainage, Vdw = Viw � ETce (Required drainage/required irrigation) during crop growth period.f (Required drainage /required irrigation) during overall rotation period. C
rotation during crop growth and fallow periods. ECiw: electrical conductiv
saturation extract for a given crop appropriate to the tolerable degree
electrical conductivity as defined by Maas (1990); Viw: volume of irrigatio
(with reference to field-capacity) of soil water that occurred
during cropping. These LRs are based on uniform water
infiltration across the field.
4.2. WATSUIT model
The estimated LR values are 0.09, 0.03, and 0.13 for the
individual alfalfa, wheat, and lettuce crops, respectively
(Table 2). The corresponding weighted LR values for the crop
growth period and overall rotation period are estimated to be
0.09 and 0.08, respectively (Table 2).
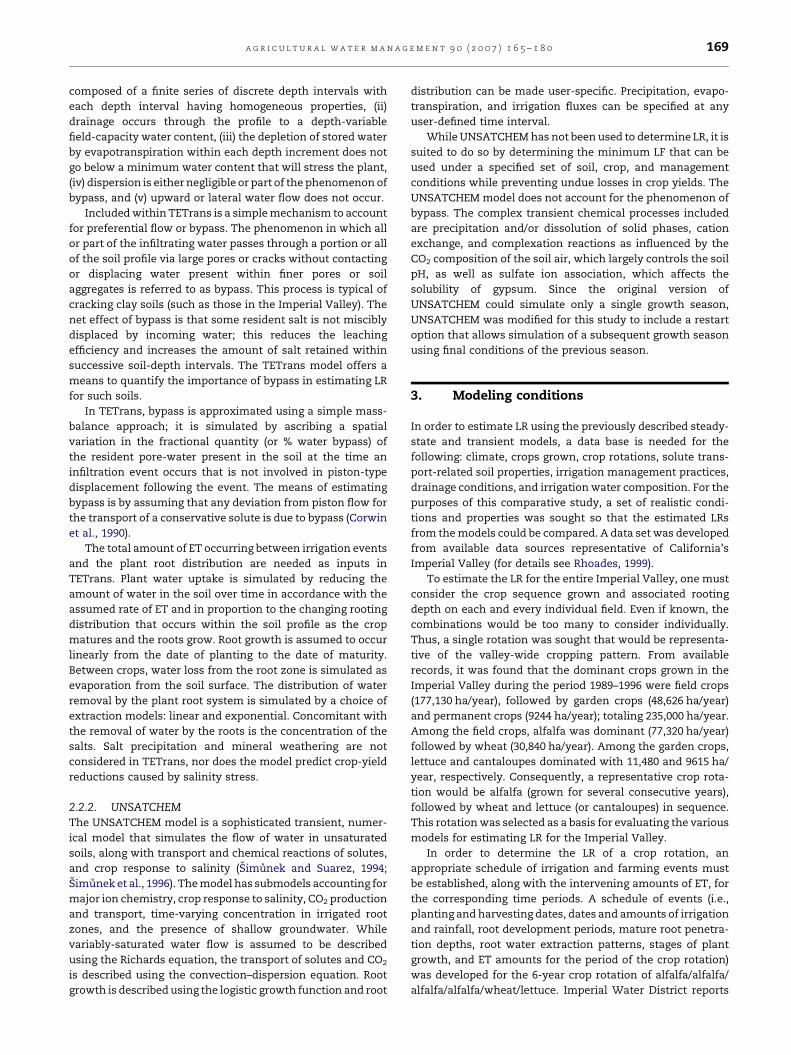
The relationships between soil salinity, soil depth, and LF
predicted using WATSUIT are shown in Fig. 1a. The soil
salinity-depth distributions shown in Fig. 1a apply to a steady-
state condition, such as would occur if the crop were to be
grown continuously for a period of several years without
interruption (i.e., perennial crops). Similar distributions occur
after approximately 2 years of a 4-year cycle of alfalfa
production, but not during the wheat and lettuce crops.
Fig. 1b and c show quite clearly that salt precipitation
under steady-state conditions is a significant factor in
reducing average soil salinity for this water composition.
At steady-state, the soil water salinity will be predicted with
WATSUIT to be reduced by salt precipitation by about 25% at a
LF of 0.03, 20% at 0.05, 13% at 0.10, 9% at 0.15, and 5% at 0.20
(Fig. 1c). These removals of salt reduce the need for leaching.
As shown in Tables 1 and 2 and Fig. 1b, the LR for alfalfa (EC�e of
2.0 dS/m) is reduced from 0.14 to 0.09 by salt precipitation; the
LR for lettuce (EC�e of 1.3 dS/m) is reduced from 0.23 to 0.13, and
the LR for wheat is reduced from 0.04 to about 0.03. The
process of salt precipitation, in which the salts are made
innocuous to plants and removed from the soil and drainage
waters, significantly reduces the LR. To illustrate, the LR value
for the crop rotation period obtained using the WATSUIT
model is estimated to be about 0.08–0.09, compared to LR
values of about 0.13–0.14 obtained using the traditional
model.
ditional method
ement estimates (traditional method)
Viwc (mm) Vdw
d (mm) Weighted LR
1909 267
2023 283
2023 283
1757 246
699 31
304 71
8715 1181 0.14e
8912 1181 0.13f
rop growth: 6-year rotation during crop growth period. Overall: 6-year
ity of the irrigation water; EC�e: average electrical conductivity of the
of yield reduction, generally 10%, and equivalent to the threshold
n water; Vdw: volume of drainage water.

Table 2 – Leaching requirements as determined by the WATSUIT model
Period Leaching requirement estimates (WATSUIT model)
ETca (mm) LRb Viw
c (mm) Vdwd (mm) Weighted LR
Alfalfa (Year 1) 1642 0.09 1804 162
Alfalfa (Year 2) 1740 0.09 1912 172
Alfalfa (Year 3) 1740 0.09 1912 172
Alfalfa (Year 4) 1511 0.09 1660 149
Wheat 668 0.03 685 17
Lettuce 233 0.13 266 34
Crop growth 7534 8239 706 0.09e
Overall 7731 8436 706 0.08f
a Crop evapotranspiration (ETc) from Table A-2 (UCCE, 1996a).b Leaching requirement (LR) obtained from Fig. 1b.c Squared irrigation, Viw = ETc/(1 � LR).d Required drainage, Vdw = Viw � ETc.e (Required drainage/required irrigation) during crop growth period.f (Required drainage/required irrigation) during overall rotation period. Crop growth: 6-year rotation during crop growth period. Overall: 6-year
rotation during crop growth and fallow periods. ECiw: electrical conductivity of the irrigation water; EC�e: average electrical conductivity of the
saturation extract for a given crop appropriate to the tolerable degree of yield reduction, generally 10%, and equivalent to the threshold
electrical conductivity as defined by Maas (1990); Viw: volume of irrigation water; Vdw: volume of drainage water.
a g r i c u l t u r a l w a t e r m a n a g e m e n t 9 0 ( 2 0 0 7 ) 1 6 5 – 1 8 0172
4.3. Water-production-function model
The results obtained with the WPF model are summarized in
Table 3. Simulations with the WPF model (data not shown)
clearly indicated that relatively large increases in LF are
required to obtain increases in yields greater than about 90% of
the potential non-stressed yield. Thus, when using the WPF
model to estimate LR, one should carefully consider water-use
efficiency and economics in order to determine the most
appropriate minimum value of LF to determine LR. Without
benefit of such an analysis, we arbitrarily chose the LR values
as the values of LF resulting in about 98% yield. The LR values
are about 0.18, 0.04, and 0.23 for the individual crops of alfalfa,
wheat and lettuce, respectively. The LR values for the entire
crop rotation are 0.17 and 0.17 for the planted and overall
periods (see Table 3).
Table 3 – Leaching requirements as determined by the water-
Period Leaching requirement
ETca (mm) LRb
Alfalfa (Year 1) 1642 0.18
Alfalfa (Year 2) 1740 0.18
Alfalfa (Year 3) 1740 0.18
Alfalfa (Year 4) 1511 0.18
Wheat 668 0.04
Lettuce 233 0.23
Crop growth 7534
Overall 7731
a Crop evapotranspiration (ETc) from Table A-2 (UCCE, 1996a).b Leaching requirement (LR) calculated from Letey et al. (1985).c Required irrigation, Viw = ETc/(1 � LR).d Required drainage, Vdw = Viw � ETc.e (Required drainage/required irrigation) during crop growth period.f (Required drainage/required irrigation) during overall rotation period. Cr
rotation during crop growth and fallow periods. ECiw: electrical conductiv
saturation extract for a given crop appropriate to the tolerable degree
electrical conductivity as defined by Maas (1990); Viw: volume of irrigatio
4.4. TETrans model
In its present configuration, TETrans is designed to simulate
solute transport in the root zone rather than to determine LR;
consequently, the model requires considerable time to vary
inputs to estimate LR. Because TETrans does not compute
yield based on soil salinity, it must be used to estimate LR by
iteratively running simulations using successively lower
irrigation amounts (hence, reduced LF) until the predicted
soil salinity reaches EC�e. The corresponding LF represents the
LR. For the preceding operational limitation, TETrans was used
to test whether the steady-state LRs determined from the
traditional method would result in lower, comparable, or
higher levels of soil salinity under transient conditions;
consequently, irrigation timings and amounts for TETrans
were adjusted to match those of the steady-state LRs
production-function model
estimates (water-production-function model)
Viwc (mm) Vdw
d (mm) Weighted LR
2002 360
2122 382
2122 382
1843 3329
696 28
302 70
9087 1554 0.17e
9284 1554 0.17f
op growth: 6-year rotation during crop growth period. Overall: 6-year
ity of the irrigation water; EC�e: average electrical conductivity of the
of yield reduction, generally 10%, and equivalent to the threshold
n water; Vdw: volume of drainage water.
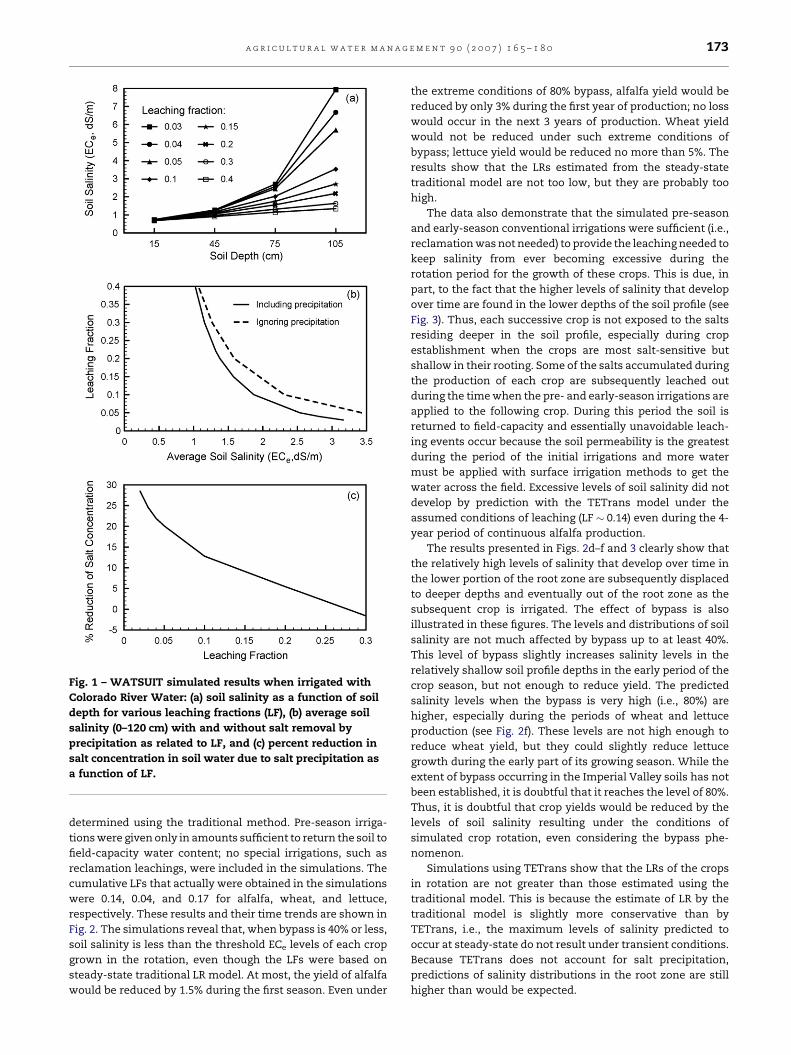
Fig. 1 – WATSUIT simulated results when irrigated with
Colorado River Water: (a) soil salinity as a function of soil
depth for various leaching fractions (LF), (b) average soil
salinity (0–120 cm) with and without salt removal by
precipitation as related to LF, and (c) percent reduction in
salt concentration in soil water due to salt precipitation as
a function of LF.
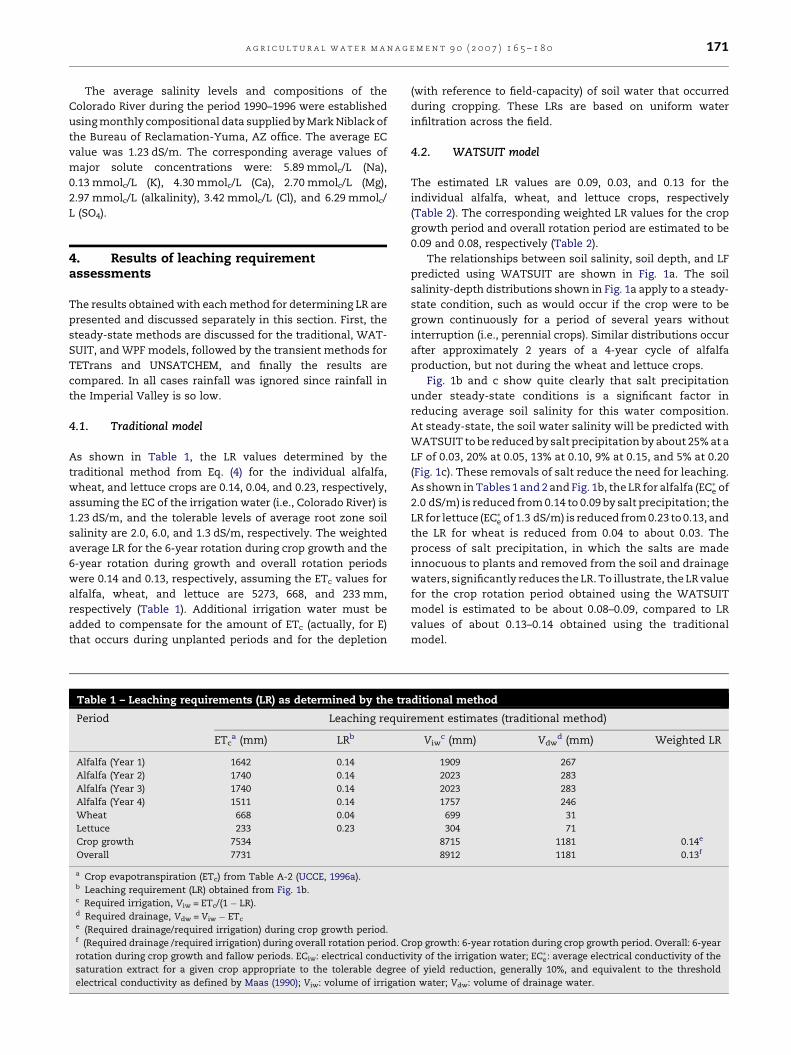
a g r i c u l t u r a l w a t e r m a n a g e m e n t 9 0 ( 2 0 0 7 ) 1 6 5 – 1 8 0 173
determined using the traditional method. Pre-season irriga-
tions were given only in amounts sufficient to return the soil to
field-capacity water content; no special irrigations, such as
reclamation leachings, were included in the simulations. The
cumulative LFs that actually were obtained in the simulations
were 0.14, 0.04, and 0.17 for alfalfa, wheat, and lettuce,
respectively. These results and their time trends are shown in
Fig. 2. The simulations reveal that, when bypass is 40% or less,
soil salinity is less than the threshold ECe levels of each crop
grown in the rotation, even though the LFs were based on
steady-state traditional LR model. At most, the yield of alfalfa
would be reduced by 1.5% during the first season. Even under
the extreme conditions of 80% bypass, alfalfa yield would be
reduced by only 3% during the first year of production; no loss
would occur in the next 3 years of production. Wheat yield
would not be reduced under such extreme conditions of
bypass; lettuce yield would be reduced no more than 5%. The
results show that the LRs estimated from the steady-state
traditional model are not too low, but they are probably too
high.
The data also demonstrate that the simulated pre-season
and early-season conventional irrigations were sufficient (i.e.,
reclamation was not needed) to provide the leaching needed to
keep salinity from ever becoming excessive during the
rotation period for the growth of these crops. This is due, in
part, to the fact that the higher levels of salinity that develop
over time are found in the lower depths of the soil profile (see
Fig. 3). Thus, each successive crop is not exposed to the salts
residing deeper in the soil profile, especially during crop
establishment when the crops are most salt-sensitive but
shallow in their rooting. Some of the salts accumulated during
the production of each crop are subsequently leached out
during the time when the pre- and early-season irrigations are
applied to the following crop. During this period the soil is
returned to field-capacity and essentially unavoidable leach-
ing events occur because the soil permeability is the greatest
during the period of the initial irrigations and more water
must be applied with surface irrigation methods to get the
water across the field. Excessive levels of soil salinity did not
develop by prediction with the TETrans model under the
assumed conditions of leaching (LF � 0.14) even during the 4-
year period of continuous alfalfa production.
The results presented in Figs. 2d–f and 3 clearly show that
the relatively high levels of salinity that develop over time in
the lower portion of the root zone are subsequently displaced
to deeper depths and eventually out of the root zone as the
subsequent crop is irrigated. The effect of bypass is also
illustrated in these figures. The levels and distributions of soil
salinity are not much affected by bypass up to at least 40%.
This level of bypass slightly increases salinity levels in the
relatively shallow soil profile depths in the early period of the
crop season, but not enough to reduce yield. The predicted
salinity levels when the bypass is very high (i.e., 80%) are
higher, especially during the periods of wheat and lettuce
production (see Fig. 2f). These levels are not high enough to
reduce wheat yield, but they could slightly reduce lettuce
growth during the early part of its growing season. While the
extent of bypass occurring in the Imperial Valley soils has not
been established, it is doubtful that it reaches the level of 80%.
Thus, it is doubtful that crop yields would be reduced by the
levels of soil salinity resulting under the conditions of
simulated crop rotation, even considering the bypass phe-
nomenon.
Simulations using TETrans show that the LRs of the crops
in rotation are not greater than those estimated using the
traditional model. This is because the estimate of LR by the
traditional model is slightly more conservative than by
TETrans, i.e., the maximum levels of salinity predicted to
occur at steady-state do not result under transient conditions.
Because TETrans does not account for salt precipitation,
predictions of salinity distributions in the root zone are still
higher than would be expected.

Fig. 2 – Time trend in average salinity (ECe, dS/m) for the soil profile (0–120 cm) over the period of a 10-year cycle of crop
rotation (a–c) and for the crop root zone (alfalfa: 0–120 cm, wheat: 0–90 cm, lettuce: 0–60 cm) over the period of a 6-year cycle
of crop rotation (d–f) as predicted by TETrans for various levels of bypass: (a and d) 0% bypass, (b and e) 40% bypass, and (c
and f) 80% bypass.
a g r i c u l t u r a l w a t e r m a n a g e m e n t 9 0 ( 2 0 0 7 ) 1 6 5 – 1 8 0174
4.5. UNSATCHEM model
Similar to TETrans, simulations were made with UNSATCHEM
for the purpose of evaluating whether soil salinity would
become excessive during the transient conditions that occur
under crop rotation, so as to require either a period of special
reclamation or the adoption of the LR of the most salt-
sensitive crop grown in the rotation. Several simulations were
performed using UNSATCHEM. The first was undertaken using
the same modified input as was employed in the TETrans
simulations so that the results of the two models could be
directly compared. In this simulation, pre-season irrigations
were given to return the soil to field-capacity water content;
otherwise no additional special irrigations, such as reclama-
tion leachings, were included in the simulation. Because of
salt precipitation, the salinity levels obtained with
UNSATCHEM were always lower than the corresponding
levels predicted by TETrans at bypass levels of 0 and 40%.
The salinity levels were never yield limiting under the
assumed conditions of irrigation and leaching. Thus, the LR
values are concluded to be less than the LFs used in this
simulation (i.e., 0.14, 0.05, and 0.17 for alfalfa, wheat, and
lettuce, respectively). The results also showed that the salinity
conditions that resulted at the end of the 4 successive years of
alfalfa production were essentially the same in both the first
and second cycles of the 6-year rotation; thus, those for wheat
and lettuce would necessarily also be the same in both
cycles. From these results, one can conclude that the ultimate
long-term conditions of salinity for the rotation under
evaluation will be the same as those found in the second
cycle of the rotation. These data further substantiate that the
LR values estimated using the traditional model for the
individual crops, as well as for the rotation, are conservative.
For the preceding reasons, another simulation was under-
taken with UNSATCHEM assuming lower amounts of leaching
could be used. The LR values obtained using the steady-state
WATSUIT model (0.09 for alfalfa, 0.03 for wheat, and 0.13 for
lettuce) were used in this simulation. The salinity levels
predicted with UNSATCHEM for these conditions of leaching
are given in Figs. 4–6. These results show that soil salinity is
kept within essentially acceptable conditions during all
periods of the crop rotation, without the provision of any
special leaching or reclamation (see Fig. 4). The estimates of LR
obtained with the steady-state WATSUIT model (0.09, 0.03 and
0.13 for alfalfa, wheat and lettuce, respectively) appear to
provide reasonable estimates of LR for salinity control under
transient conditions, as well. However, the LR values of 0.09 for
alfalfa and of 0.13 for lettuce appear to be close to the
minimum. The LR value of 0.03 for wheat is about as low as
feasible, though the salinity level is still much below that
tolerable by this crop.
The manner in which the distribution of salinity within the
soil profile (0–120 cm) changes during the crop rotation is
clearly shown in Figs. 5 and 6. The relatively low levels of
salinity maintained within the root zones of these crops
during most of their cropping seasons, especially in the upper
Fig. 3 – Soil salinity levels (ECe, dS/m) by depth at selected times for alfalfa (a–c), wheat (d–f), and lettuce (g–i) as predicted by
TETrans for various levels of bypass: (a, d, and g) 0% bypass, (b, e, and h) 40% bypass, and (c, f, and i) 80% bypass.
a g r i c u l t u r a l w a t e r m a n a g e m e n t 9 0 ( 2 0 0 7 ) 1 6 5 – 1 8 0 175
one-half of the root zones, clearly illustrates the adequacy of
the simulated irrigation/leaching management for salinity
control.
The amounts of irrigation, precipitation, crop ET (i.e., ETc),
and the levels of resulting leaching and deep percolation for
each crop and for the entire rotation, as estimated from the
input data and from UNSATCHEM, are summarized in Table 4
Fig. 4 – Time trends in average soil salinity of the crop root
zone (alfalfa: 0–120 cm, wheat: 0–90 cm, lettuce: 0–60 cm)
over the period of 16 years (i.e., 4 years of alfalfa, 1 year of
wheat, 1 year of lettuce, 4 years of alfalfa, 1 year of wheat,
1 year of lettuces, and 4 years of alfalfa) as predicted by
UNSATCHEM.
in three ways. The fraction of applied infiltrated water
(precipitation + irrigation) that passed through the root zone
(i.e., LF) over the entire period of the crop rotation was 0.08.
Since no loss in yield was obtained under these conditions, it
may be concluded that the LR may be as low (or possibly lower)
as 0.08 for the overall crop rotation and about 0.10 for alfalfa, 0
for wheat, and 0.13 for lettuce.
5. Discussion of results
A summary of the values of LR obtained by the various
methods is given in Table 5. Higher estimates were obtained
using the WPF model for all crops and for the entire rotation
period compared to the other two steady-state model (i.e.,
traditional and WATSUIT) and the two transient models
(TETrans and UNSATCHEM). Although estimated LR from the
traditional and WPF model were nearly comparable (i.e., the
same for wheat and lettuce), WPF was higher for alfalfa and for
the entire rotation. Among the steady-state models, it was
anticipated that lower values would be obtained by WATSUIT
because it accounts for the removal of salts by salt precipita-
tion while the traditional and WPF models do not. However,
the slightly higher values obtained with the WPF model
relative to the traditional method were not anticipated. Some
insight into the higher WPF model values is gained by
examining the relationship between relative crop yield and

Fig. 5 – Soil salinity levels (ECe, dS/m) by depth at selected times as predicted by UNSATCHEM for (a) alfalfa, (b) wheat, and (c)
lettuce.
a g r i c u l t u r a l w a t e r m a n a g e m e n t 9 0 ( 2 0 0 7 ) 1 6 5 – 1 8 0176
LF given from WPF simulations. First, relative losses in crop
yields predicted by the WPF model are small (i.e., only�3–5%) at
LF values equivalent to the LR values obtained by the traditional
method. Second, maximum crop yields for the two salt-
sensitive crops (i.e., alfalfa and wheat) are approached
asymptotically as the LF increases. Essentially identical values
of LR to those obtained by the traditional method can be
obtained by the WPF model by substituting a more water-
efficient value of acceptable relative crop yield, such as 95%, in
place of the value of 98% that was used. This is easily justified,
since relatively large increases in LF are required to obtain
relatively small increases in crop yield, according to the WPF
model. Furthermore, the LR values obtained with the WPF
model at a 98% relative crop-yield reference are concluded to be
too high because the levels of average root zone soil salinity
predicted withTETrans (which used leaching amounts based on
the LR values obtained with the traditional method) were below
the threshold levels associated with the initiation of yield loss.
The traditional, WPF, and TETrans models are the most
directly comparable of the various methods evaluated because
Fig. 6 – Soil salinity levels (ECe, dS/m) by depth for alfalfa, whea
selected days late in each crop season (i.e., alfalfa: Day 1752, whe
the entire crop season (i.e., 4 years for alfalfa, 1 year for wheat
they are based on the same water–salt balance relations and
exclude the effects of salt precipitation. They allow a
comparison of steady-state (i.e., traditional and WPF) and
transient (i.e., TETrans) models. The notion that steady-state
models over-estimate LR is supported, but only to a minor
extent. Estimates of LR by steady-state models were found to
be slightly conservative. The actual levels of root zone salinity
will be slightly less than the predicted steady-state levels for
the cases of annual crops and time-varying cropping since
there is insufficient time to develop the maximum levels
found under steady-state conditions, which result only after
longer periods of continuous cropping, such as with perennial
crops. This is supported by results obtained with the transient
models, TETrans and UNSATCHEM.
The estimates of LR were significantly reduced when the
effect of salt precipitation was included in the salt-balance
calculations. For example, the LR for the overall crop rotation
was reduced from 0.13 (traditional method) to 0.08 (WATSUIT
method) by accounting for salt precipitation (Table 5). The
magnitude of the effect of salt precipitation can be appreciated
t, and lettuce as predicted by UNSATCHEM for (a) single
at: Day 1951, and lettuce: Day 2170) and (b) an average over
, and 1 year for lettuce).
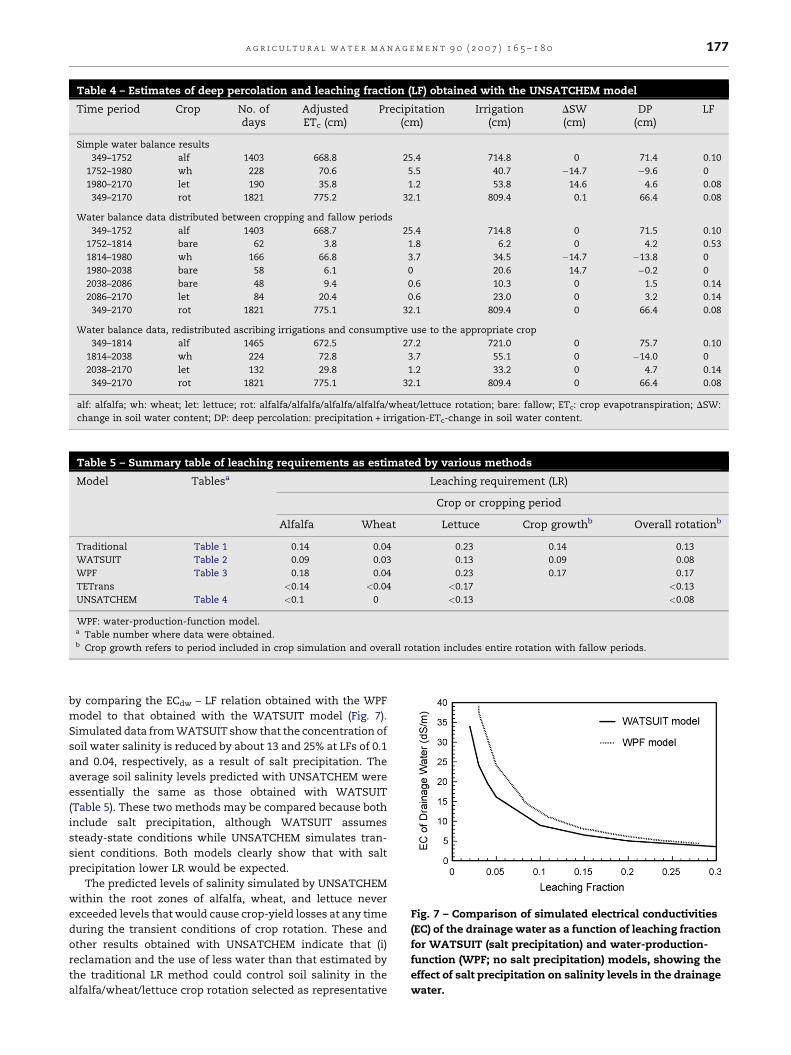
Table 4 – Estimates of deep percolation and leaching fraction (LF) obtained with the UNSATCHEM model
Time period Crop No. ofdays
AdjustedETc (cm)
Precipitation(cm)
Irrigation(cm)
DSW(cm)
DP(cm)
LF
Simple water balance results
349–1752 alf 1403 668.8 25.4 714.8 0 71.4 0.10
1752–1980 wh 228 70.6 5.5 40.7 �14.7 �9.6 0
1980–2170 let 190 35.8 1.2 53.8 14.6 4.6 0.08
349–2170 rot 1821 775.2 32.1 809.4 0.1 66.4 0.08
Water balance data distributed between cropping and fallow periods
349–1752 alf 1403 668.7 25.4 714.8 0 71.5 0.10
1752–1814 bare 62 3.8 1.8 6.2 0 4.2 0.53
1814–1980 wh 166 66.8 3.7 34.5 �14.7 �13.8 0
1980–2038 bare 58 6.1 0 20.6 14.7 �0.2 0
2038–2086 bare 48 9.4 0.6 10.3 0 1.5 0.14
2086–2170 let 84 20.4 0.6 23.0 0 3.2 0.14
349–2170 rot 1821 775.1 32.1 809.4 0 66.4 0.08
Water balance data, redistributed ascribing irrigations and consumptive use to the appropriate crop
349–1814 alf 1465 672.5 27.2 721.0 0 75.7 0.10
1814–2038 wh 224 72.8 3.7 55.1 0 �14.0 0
2038–2170 let 132 29.8 1.2 33.2 0 4.7 0.14
349–2170 rot 1821 775.1 32.1 809.4 0 66.4 0.08
alf: alfalfa; wh: wheat; let: lettuce; rot: alfalfa/alfalfa/alfalfa/alfalfa/wheat/lettuce rotation; bare: fallow; ETc: crop evapotranspiration; DSW:
change in soil water content; DP: deep percolation: precipitation + irrigation-ETc-change in soil water content.
Table 5 – Summary table of leaching requirements as estimated by various methods
Model Tablesa Leaching requirement (LR)
Crop or cropping period
Alfalfa Wheat Lettuce Crop growthb Overall rotationb
Traditional Table 1 0.14 0.04 0.23 0.14 0.13
WATSUIT Table 2 0.09 0.03 0.13 0.09 0.08
WPF Table 3 0.18 0.04 0.23 0.17 0.17
TETrans <0.14 <0.04 <0.17 <0.13
UNSATCHEM Table 4 <0.1 0 <0.13 <0.08
WPF: water-production-function model.a Table number where data were obtained.b Crop growth refers to period included in crop simulation and overall rotation includes entire rotation with fallow periods.
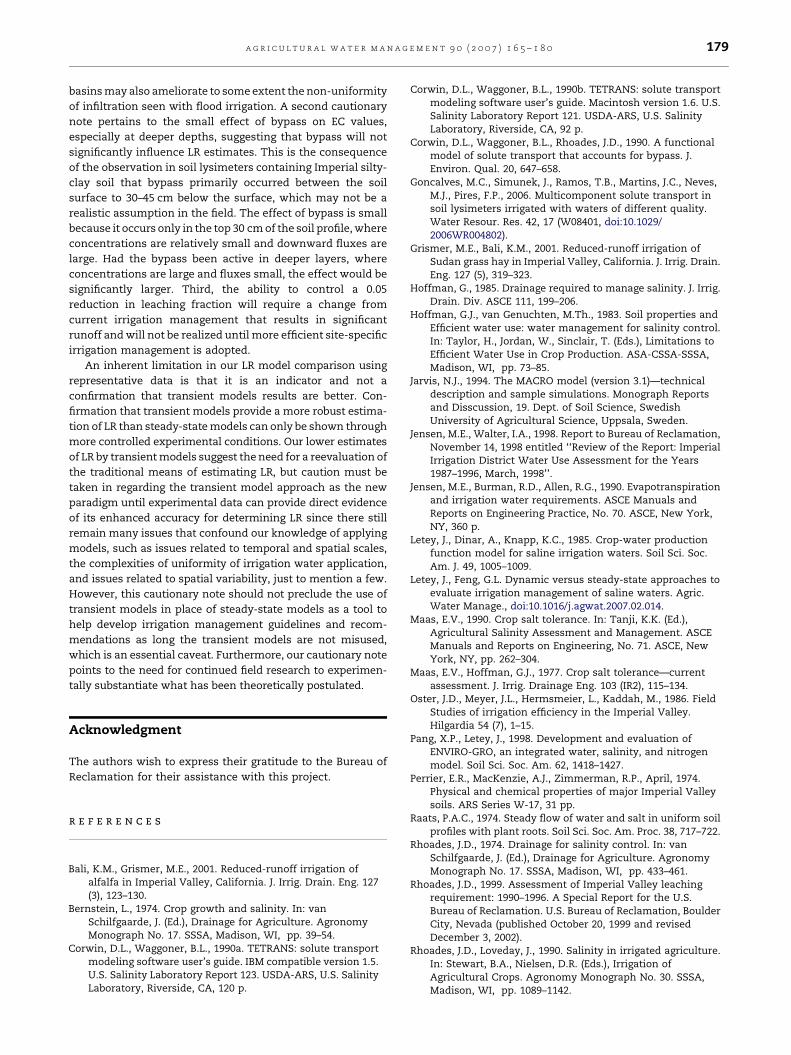
Fig. 7 – Comparison of simulated electrical conductivities
(EC) of the drainage water as a function of leaching fraction
for WATSUIT (salt precipitation) and water-production-
function (WPF; no salt precipitation) models, showing the
effect of salt precipitation on salinity levels in the drainage
water.
a g r i c u l t u r a l w a t e r m a n a g e m e n t 9 0 ( 2 0 0 7 ) 1 6 5 – 1 8 0 177
by comparing the ECdw – LF relation obtained with the WPF
model to that obtained with the WATSUIT model (Fig. 7).
Simulated data from WATSUIT show that the concentration of
soil water salinity is reduced by about 13 and 25% at LFs of 0.1
and 0.04, respectively, as a result of salt precipitation. The
average soil salinity levels predicted with UNSATCHEM were
essentially the same as those obtained with WATSUIT
(Table 5). These two methods may be compared because both
include salt precipitation, although WATSUIT assumes
steady-state conditions while UNSATCHEM simulates tran-
sient conditions. Both models clearly show that with salt
precipitation lower LR would be expected.
The predicted levels of salinity simulated by UNSATCHEM
within the root zones of alfalfa, wheat, and lettuce never
exceeded levels that would cause crop-yield losses at any time
during the transient conditions of crop rotation. These and
other results obtained with UNSATCHEM indicate that (i)
reclamation and the use of less water than that estimated by
the traditional LR method could control soil salinity in the
alfalfa/wheat/lettuce crop rotation selected as representative

a g r i c u l t u r a l w a t e r m a n a g e m e n t 9 0 ( 2 0 0 7 ) 1 6 5 – 1 8 0178
of Imperial Valley conditions and (ii) the LR is lower than that
determined using the traditional method.
6. Conclusions
The two transient models, TETrans and UNSATCHEM, esti-
mated the LR to be lower than the traditional steady-state
approach. The weakness of the traditional LR approach is that
steady-state conditions seldom exist except over long time
periods and processes such as preferential flow and precipita-
tion–dissolution reactions are not taken into account. The
difference between the traditional steady-state and transient
approaches is expected and adds credence to the recommenda-
tionthat anyestimationofLRfirstconsider the use ofa transient
model, particularly for research applications. The same general
conclusion recommending the use of a transient over a steady-
state approach for estimating LR was also found by Letey and
Feng (this issue) when focusing on the influence of plant water
uptake using the transient ENVIRO-GRO model compared to
two steady-state models. Similarly, Schoups et al. (2006)
demonstrated the need for transient modeling of salt leaching.
The small difference in the estimated LR between WAT-
SUIT and UNSATCHEM shows that accounting for salt
precipitation under conditions representative of the Imperial
Valley was even more important than whether the model was
a steady-state or transient. This suggests that in some
instances accounting for all the dominant mechanisms
influencing the leaching of salts may be nearly as important
as capturing the temporal dynamics of the leaching process.
This fact suggests that there may be certain instances where
steady-state models can be used as long as the steady-state
model accounts for all the dominant mechanisms (e.g., bypass
flow, precipitation–dissolution reactions, plant water uptake,
etc.) that are affecting the leaching of salts and there few or no
perturbations that have occurred over a long time period that
would prevent steady-state conditions or nearly so. For
instance, in situations where precipitation–dissolution reac-
tions are dominant and temporal dynamic effects are
minimal, LR could be adequately estimated using WATSUIT.
Or, in situations where irrigation water of quality and amount
that minimized the temporal dynamic effects of plant water
uptake, LR could be adequately estimated using the exponen-
tial water uptake, steady-state model by Hoffman and van
Genuchten (1983).
Our findings indicate that the most rigorous method for
determining LR is with UNSATCHEM except that it does not
consider bypass. To apply this method on a valley-wide basis
would require that the exact crop rotation practiced on each
field within the entire Imperial Valley be known and that
simulations be carried out for every one of these combina-
tions. The overall weighted average of all these combinations
and fields would provide the correct value of LR for the
Imperial Valley. However, this approach is impractical. An
alternative would be to determine the area of every crop and to
estimate the LR for each crop using the WATSUIT model. The
valley-wide LR would then be the weighted average of these
crop areas and LRs or the weighted average of the yearly
irrigation requirements of these crops. Jensen and Walter
(1998) obtained a value of 0.14 for the entire Imperial Valley
using this latter approach and the traditional method of
estimating LR for individual crops. In addition, field studies by
Oster et al. (1986) showed a similar steady-state estimate of LR
of 0.12. The LR value obtained herein for the representative
crop rotation using the traditional method of estimating LR
was 0.13. The three results are essentially the same.
Thus, the valley-wide LR can be reasonably estimated using
the selected representative crop rotation and either the
WATSUIT or UNSATCHEM models. Based on the results
obtained with these models, a LR value of 0.08 is concluded
to be reasonable for the entire Imperial Valley. This conclusion
is based on the fact that both models predict that soil salinity
will not accumulate to levels that would cause losses to any
crop grown in rotation at the ascribed level of leaching.
Furthermore, the 6-year crop rotation is made up of the
dominant crops grown in the Imperial Valley and of crops that
are dominantly salt-sensitive (i.e., alfalfa and lettuce). The LR
would be proportionately lower, if the assessment was based
on more salt-tolerant crops. The validity of a valley-wide LR of
0.08 is supported by the results of a field experiment carried
out in the Imperial Valley in which a succession of crops were
successfully grown in two different rotations (cotton/wheat/
alfalfa and wheat/sugar beets/cantaloupes) with a LF of about
0.1, even while substituting water that was four-times as
saline as Colorado River (i.e., Alamo River water) in place of
Colorado River for between 30 and 50% of the total irrigation
supply (Rhoades et al., 1989). The field studies by Bali and
Grismer (2001) and Grismer and Bali (2001) also support the
notion that a valley-wide LR for Imperial Valley of 0.08 is
reasonable from results that showed no decrease in the yield
of alfalfa and Sudan grass hay at a LF of 0.10 or less.
The salient points to be derived from the model simula-
tions that are specific to the conditions representative of the
Imperial Valley include: (i) for cracking soils representative of
the Imperial Valley, preferential flow does not appear to be a
significant factor influencing LR and (ii) salt precipitation is a
primary factor reducing LR for the Imperial Valley. The
implication is that reducing the estimated LR from 0.13 to
0.8 will reduce irrigation water needs that deplete scarce
surface water supplies and will reduce drainage volumes that
impact the environment when disposed. Each year an
estimated 2.46 � 109 m3 (2,000,000 ac-ft) of water infiltrates
into the cropped soil of Imperial Valley; consequently,
reducing the LR from 0.14 to 0.08 would reduce the drainage
volume by approximately 1.23 � 108 m3 (100,000 ac-ft).
However, there are cautionary notes that should be
weighed when considering the practicality and validity of a
valley-wide LR of 0.08 for the Imperial Valley. First, the effect of
irrigation uniformity has not been addressed in this study nor
has runoff been considered. The lack of irrigation uniformity
caused by uneven application of irrigation water and/or
within-field spatial variability results in a greater application
of irrigation water to attain maximum yield. The issues of non-
uniformity effects on LR are discussed in detail by Rhoades
(1999). The inability to more precisely control the spatial
distribution of irrigation application also causes runoff.
However, site-specific irrigation technology may eventually
overcome the problems of application distribution associated
with flood irrigation and within-field spatial variability
through site-specific, sprinkler irrigation. The use of level
a g r i c u l t u r a l w a t e r m a n a g e m e n t 9 0 ( 2 0 0 7 ) 1 6 5 – 1 8 0 179
basins may also ameliorate to some extent the non-uniformity
of infiltration seen with flood irrigation. A second cautionary
note pertains to the small effect of bypass on EC values,
especially at deeper depths, suggesting that bypass will not
significantly influence LR estimates. This is the consequence
of the observation in soil lysimeters containing Imperial silty-
clay soil that bypass primarily occurred between the soil
surface to 30–45 cm below the surface, which may not be a
realistic assumption in the field. The effect of bypass is small
because it occurs only in the top 30 cm of the soil profile, where
concentrations are relatively small and downward fluxes are
large. Had the bypass been active in deeper layers, where
concentrations are large and fluxes small, the effect would be
significantly larger. Third, the ability to control a 0.05
reduction in leaching fraction will require a change from
current irrigation management that results in significant
runoff and will not be realized until more efficient site-specific
irrigation management is adopted.
An inherent limitation in our LR model comparison using
representative data is that it is an indicator and not a
confirmation that transient models results are better. Con-
firmation that transient models provide a more robust estima-
tion of LR than steady-state models can only be shown through
more controlled experimental conditions. Our lower estimates
of LR by transient models suggest the need for a reevaluation of
the traditional means of estimating LR, but caution must be
taken in regarding the transient model approach as the new
paradigm until experimental data can provide direct evidence
of its enhanced accuracy for determining LR since there still
remain many issues that confound our knowledge of applying
models, such as issues related to temporal and spatial scales,
the complexities of uniformity of irrigation water application,
and issues related to spatial variability, just to mention a few.
However, this cautionary note should not preclude the use of
transient models in place of steady-state models as a tool to
help develop irrigation management guidelines and recom-
mendations as long the transient models are not misused,
which is an essential caveat. Furthermore, our cautionary note
points to the need for continued field research to experimen-
tally substantiate what has been theoretically postulated.
Acknowledgment
The authors wish to express their gratitude to the Bureau of
Reclamation for their assistance with this project.
r e f e r e n c e s
Bali, K.M., Grismer, M.E., 2001. Reduced-runoff irrigation ofalfalfa in Imperial Valley, California. J. Irrig. Drain. Eng. 127(3), 123–130.
Bernstein, L., 1974. Crop growth and salinity. In: vanSchilfgaarde, J. (Ed.), Drainage for Agriculture. AgronomyMonograph No. 17. SSSA, Madison, WI, pp. 39–54.
Corwin, D.L., Waggoner, B.L., 1990a. TETRANS: solute transportmodeling software user’s guide. IBM compatible version 1.5.U.S. Salinity Laboratory Report 123. USDA-ARS, U.S. SalinityLaboratory, Riverside, CA, 120 p.
Corwin, D.L., Waggoner, B.L., 1990b. TETRANS: solute transportmodeling software user’s guide. Macintosh version 1.6. U.S.Salinity Laboratory Report 121. USDA-ARS, U.S. SalinityLaboratory, Riverside, CA, 92 p.
Corwin, D.L., Waggoner, B.L., Rhoades, J.D., 1990. A functionalmodel of solute transport that accounts for bypass. J.Environ. Qual. 20, 647–658.
Goncalves, M.C., Simunek, J., Ramos, T.B., Martins, J.C., Neves,M.J., Pires, F.P., 2006. Multicomponent solute transport insoil lysimeters irrigated with waters of different quality.Water Resour. Res. 42, 17 (W08401, doi:10.1029/2006WR004802).
Grismer, M.E., Bali, K.M., 2001. Reduced-runoff irrigation ofSudan grass hay in Imperial Valley, California. J. Irrig. Drain.Eng. 127 (5), 319–323.
Hoffman, G., 1985. Drainage required to manage salinity. J. Irrig.Drain. Div. ASCE 111, 199–206.
Hoffman, G.J., van Genuchten, M.Th., 1983. Soil properties andEfficient water use: water management for salinity control.In: Taylor, H., Jordan, W., Sinclair, T. (Eds.), Limitations toEfficient Water Use in Crop Production. ASA-CSSA-SSSA,Madison, WI, pp. 73–85.
Jarvis, N.J., 1994. The MACRO model (version 3.1)—technicaldescription and sample simulations. Monograph Reportsand Disscussion, 19. Dept. of Soil Science, SwedishUniversity of Agricultural Science, Uppsala, Sweden.
Jensen, M.E., Walter, I.A., 1998. Report to Bureau of Reclamation,November 14, 1998 entitled ‘‘Review of the Report: ImperialIrrigation District Water Use Assessment for the Years1987–1996, March, 1998’’.
Jensen, M.E., Burman, R.D., Allen, R.G., 1990. Evapotranspirationand irrigation water requirements. ASCE Manuals andReports on Engineering Practice, No. 70. ASCE, New York,NY, 360 p.
Letey, J., Dinar, A., Knapp, K.C., 1985. Crop-water productionfunction model for saline irrigation waters. Soil Sci. Soc.Am. J. 49, 1005–1009.
Letey, J., Feng, G.L. Dynamic versus steady-state approaches toevaluate irrigation management of saline waters. Agric.Water Manage., doi:10.1016/j.agwat.2007.02.014.
Maas, E.V., 1990. Crop salt tolerance. In: Tanji, K.K. (Ed.),Agricultural Salinity Assessment and Management. ASCEManuals and Reports on Engineering, No. 71. ASCE, NewYork, NY, pp. 262–304.
Maas, E.V., Hoffman, G.J., 1977. Crop salt tolerance—currentassessment. J. Irrig. Drainage Eng. 103 (IR2), 115–134.
Oster, J.D., Meyer, J.L., Hermsmeier, L., Kaddah, M., 1986. FieldStudies of irrigation efficiency in the Imperial Valley.Hilgardia 54 (7), 1–15.
Pang, X.P., Letey, J., 1998. Development and evaluation ofENVIRO-GRO, an integrated water, salinity, and nitrogenmodel. Soil Sci. Soc. Am. 62, 1418–1427.
Perrier, E.R., MacKenzie, A.J., Zimmerman, R.P., April, 1974.Physical and chemical properties of major Imperial Valleysoils. ARS Series W-17, 31 pp.
Raats, P.A.C., 1974. Steady flow of water and salt in uniform soilprofiles with plant roots. Soil Sci. Soc. Am. Proc. 38, 717–722.
Rhoades, J.D., 1974. Drainage for salinity control. In: vanSchilfgaarde, J. (Ed.), Drainage for Agriculture. AgronomyMonograph No. 17. SSSA, Madison, WI, pp. 433–461.
Rhoades, J.D., 1999. Assessment of Imperial Valley leachingrequirement: 1990–1996. A Special Report for the U.S.Bureau of Reclamation. U.S. Bureau of Reclamation, BoulderCity, Nevada (published October 20, 1999 and revisedDecember 3, 2002).
Rhoades, J.D., Loveday, J., 1990. Salinity in irrigated agriculture.In: Stewart, B.A., Nielsen, D.R. (Eds.), Irrigation ofAgricultural Crops. Agronomy Monograph No. 30. SSSA,Madison, WI, pp. 1089–1142.

a g r i c u l t u r a l w a t e r m a n a g e m e n t 9 0 ( 2 0 0 7 ) 1 6 5 – 1 8 0180
Rhoades, J.D., Merrill, S.D., 1976. Assessing the suitability ofwater for irrigation: theoretical and empirical approaches.In: Prognosis of Salinity and Alkalinity. Soils Bulletin 31,FAO, Rome, pp. 69–109.
Rhoades, J.D., Bingham, F.T., Hoffman, G.J., Dedrick, A.R., Pinter,A.R., Replogle, J.A., 1989. Use of saline drainage water forirrigation: Imperial Valley study. Agric. Water Manage. 16,25–36.
Rhoades, J.D., Kandiah, A., Mashali, A.M., 1992. The use of salinewaters for crop production. FAO Irrigation & Drainage Paper48. FAO, Rome, Italy, 133 p.
Rhoades, J.D., Oster, J.D., Ingvalson, R.D., Tucker, J.M., Clark, M.,1974. Minimizing the salt burdens of irrigation drainagewaters. J. Environ. Qual. 3, 311–316.
Schoups, G., Hopmans, J.W., Tanji, K.K., 2006. Evaluation ofmodel completity and space–time resolution on theprediction of long-term soil salinity dynamics, western SanJoaquin Valley, California. Hydrol. Processes 20, 2647–2668.
Simunek, J., Suarez, D.L., 1994. Major ion chemistry model forvariably saturated porous media. Water Resour. Res. 30 (4),1115–1133.
Simunek, J., van Genuchten, M.Th., Sejna, M., 2005. The HYDRUS-1D software package for simulating the one-dimensional
movement of water, heat, and multiple solutes in variablysaturated media, version 3.0. HYDRUS Software Series 1.Department of Environmental Sciences, University ofCalifornia, Riverside, Riverside, CA, p. 270.
Simunek, J., Suarez, D.L., Sejna, M., 1996. The UNSATCHEMsoftware package for simulating one-dimensional variablysaturated water flow, heat transport, carbon dioxideproduction and transport, and solute transport with majorion equilibrium and kinetic chemistry, version 2. Res.Report No. 141. USDA-ARS, U.S. Salinity Laboratory,Riverside, CA, 186 p.
University of California Cooperative Extension (UCCE), 1996a. In:Mayberry, K.S., Holmes, G.J. (Eds.), Guidelines to ProductionCosts and Practices for Imperial County, Field Crops 1996–1997. Circular 104-F. UC Cooperative Extension, Holtville,CA, p. 39.
University of California Cooperative Extension (UCCE), 1996b.In: Mayberry, K.S. (Ed.), Guidelines to Production Costs andPractices for Imperial County, Vegetable Crops. Circular104-V. UC Cooperative Extension, Holtville, CA, p. 81.
U.S. Salinity Laboratory Staff, 1954. Diagnosis and Improvementof Saline and Alkali Soils. U.S. Dept. Agriculture, Handbook60. U.S. Government Printing Office, Washington, DC, p. 160.
Top Related