


Languages
Pages
Legal


Who Pays for Obesity?
Jay BhattacharyaStanford University
April 2011

Obesity is Bad for Your Health and Costs A Lot
Lifetime medical costs related to diabetes, heart disease, high cholesterol, hypertension, and stroke are $10,000 higher among the obese
$31 billion (in Year 2000 $) spent during 1996 for adult overweight/obesity-related CVD treatments alone
Among the overweight, lifetime medical costs can be reduced by $2,200 - $5,300 following a 10 percent reduction in body weight
Health care costs in excess of $76 billion were incurred due to physical inactivity in the year 2000

Key Question: Who Pays for Obesity?
If you pay all the costs of decisions about your weight, there is little place for intervention by others who do not pay these costs.
But if others pay the costs there may be a (Pigouvian) justification for intervention.

Obesity Externalities
Health insurance costsDisability, morbidity, and
mortality costsFamily externalities
Obesity and Private Insurance

Obesity and Health Insurance: Two Stories
Splitting the bill Insurance without moral
hazard

The Social Loss from the Obesity-Health Insurance
Externality Need two things for there to be
a social loss:Pooled insurance – obese people must pay less (on average) for health insurance than their expected medical expenditures
Moral hazard – health insurance must make you fat

Policy Implications of the Framework
If there is no in health insurance pooling There is no social harm through this mechanism
No case for Pigouvian taxes If there is pooling, but no
moral hazardInsurance induces a progressive, costless transfer

Is There Pooling In Private Insurance?

Wages and Obesity
Obese workers earn less than thinner workers with equivalent job experience and education.
Some have argued that this is evidence of labor market discrimination against the obese.
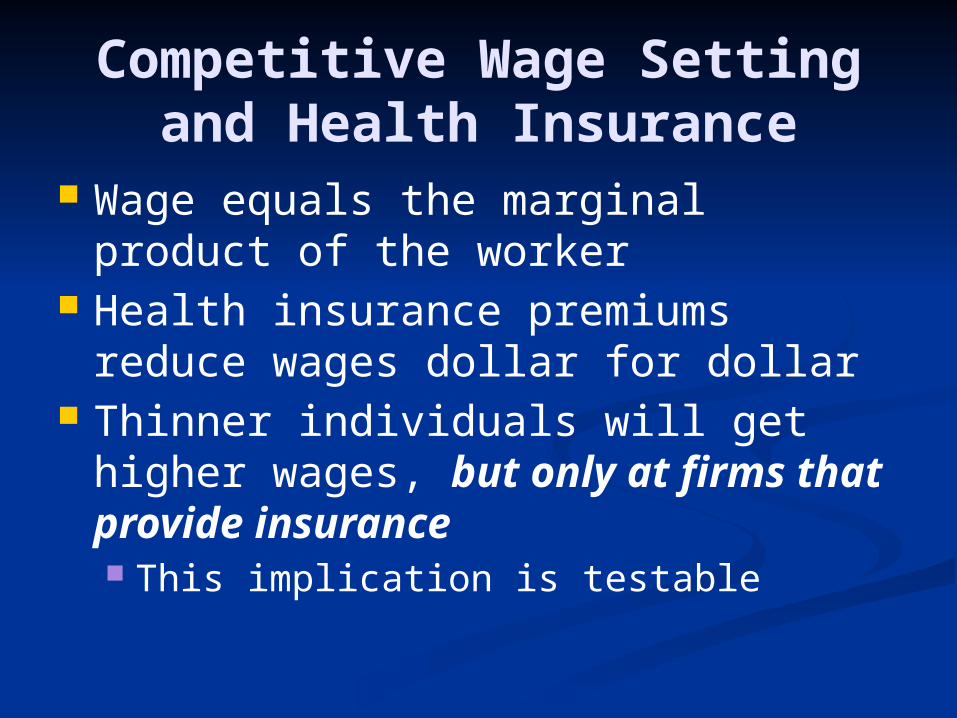
Competitive Wage Setting and Health Insurance
Wage equals the marginal product of the worker
Health insurance premiums reduce wages dollar for dollar
Thinner individuals will get higher wages, but only at firms that provide insurance This implication is testable
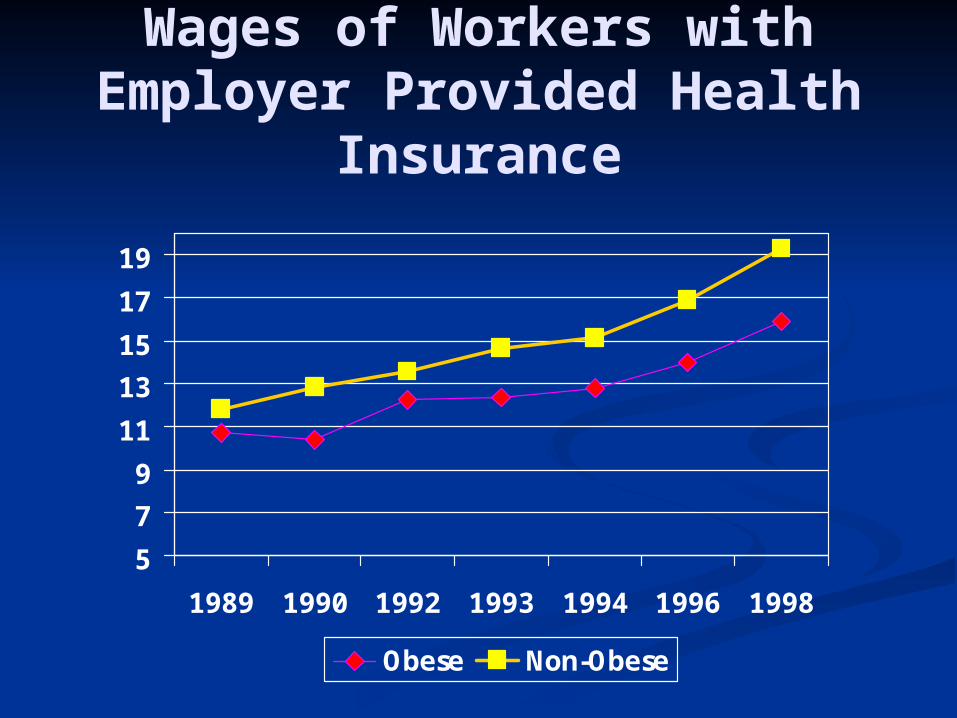
Wages of Workers with Employer Provided Health
Insurance
5
7
9
11
13
15
17
19
1989 1990 1992 1993 1994 1996 1998
Obese Non-Obese

Wages of Workers without Employer Provided Health
Insurance
5
7
9
11
13
15
17
19
1989 1990 1992 1993 1994 1996 1998
Obese Non-Obese

Men and WomenTable 5: Analysis of the Wage Offset for Obesity by Age and Sex
(1) (2) (3) (1) (2) (3)Obese -1.21 -1.27 -0.79 -1.66 -1.66 0.43
[0.39]*** [0.39]*** [0.48] [0.39]*** [0.39]*** [0.98]Employer coverage (own) 2.3 2.4 1.81 2.37
[0.33]*** [0.35]*** [0.39]*** [0.33]***Obese*Employer coverage (own) -0.58 -2.64
[0.63] [1.00]***Constant 22.36 20.22 20.12 15.35 9.83 9.51
[9.47]** [9.51]** [9.50]** [10.89] [10.81] [10.81]Observations 19,183 19,183 19,183 11,993 11,993 11,993 R-squared 0.19 0.19 0.19 0.14 0.14 0.14
(1) (2) (3) (1) (2) (3)Obese -0.42 -0.45 -0.11 -1.38 -1.37 1.08
[0.42] [0.42] [0.57] [0.54]** [0.54]** [1.84]Employer coverage (own) 1.77 1.83 1.32 1.88
[0.39]*** [0.42]*** [0.58]** [0.41]***Obese*Employer coverage (own) -0.43 -3.19
[0.76] [1.82]*Constant 9.13 9.45 9.41 20.04 18.69 19.08
[18.15] [18.06] [18.08] [26.95] [26.96] [26.96]Observations 12,585 12,585 12,585 7,755 7,755 7,755 R-squared 0.10 0.10 0.10 0.07 0.08 0.08
(1) (2) (3) (1) (2) (3)Obese -2.06 -2.21 -0.48 -1.83 -1.85 0.49
[0.60]*** [0.60]*** [0.78] [0.51]*** [0.51]*** [0.50]Employer coverage (own) 3.84 4.3 2.8 3.56
[0.53]*** [0.57]*** [0.41]*** [0.49]***Obese*Employer coverage (own) -2.04 -2.87
[1.00]** [0.75]***Constant 0.35 -1.12 0.32 -10.07 -14.78 -15.44
[65.41] [65.10] [65.03] [48.72] [48.60] [48.57]Observations 6,598 6,598 6,598 4,238 4,238 4,238 R-squared 0.24 0.25 0.25 0.27 0.27 0.27Robust standard errors in brackets* significant at 10%; ** significant at 5%; *** significant at 1%
Men WomenAll Ages
Age <=35
Note: Estimates are weighted and standard errors in parentheses are adjusted for repeated obeservations of individuals. Adjusted estimates include controls for sex, children in the household and its interaction with female, race, martial status, age, education, urban residence, job tenure, employer size, year, industry, and occupation.
Men Women
Age >35Men Women
In jobs with health insurance:• Obese men earn $0.58 less per
hour• Obese women earn $2.64 less
per hour

Medical ExpendituresPrivately Insured, Age
20-50
Source: Bhattacharya and Bundorf (2008)

Table 7: Expenditure and Prevalence Differences by Condition
Women
Condition Non-Obese Obese Difference Non-Obese Obese DifferenceDiabetes 1.15% 4.64% 3.49% *** $4,246 $5,769 $1,522Asthma 9.29% 14.58% 5.30% *** $3,805 $4,147 $342Hypertension 6.18% 22.14% 15.96% *** $3,834 $4,278 $444Coronary Artery Disease 0.13% 0.68% 0.56% *** $19,274 $6,641 -$12,633Angina 0.18% 0.46% 0.29% * $2,637 $8,574 $5,937Myocardial Infarction 0.22% 0.69% 0.48% ** $6,709 $8,240 $1,531Other Heart Disease 3.26% 4.46% 1.21% * $4,333 $3,900 -$433Stroke 0.44% 0.62% 0.17% $10,728 $7,969 -$2,760Emphysema 0.10% 0.24% 0.14% $13,712 $8,851 -$4,861Joint Pain 22.53% 35.57% 13.04% *** $3,740 $4,726 $987Arthritis 8.07% 17.96% 9.89% *** $4,141 $6,097 $1,956 **
Men
Condition Non-Obese Obese Difference Non-Obese Obese DifferenceDiabetes 1.23% 6.60% 5.38% *** $5,425 $4,623 -$802Asthma 7.99% 6.66% -1.33% $2,043 $2,533 $490Hypertension 9.76% 26.84% 17.08% *** $3,276 $2,996 -$280Coronary Artery Disease 0.50% 1.15% 0.64% ** $12,618 $6,959 -$5,658Angina 0.28% 0.74% 0.46% ** $7,766 $9,610 $1,844Myocardial Infarction 0.54% 1.06% 0.52% * $11,812 $6,123 -$5,690Other Heart Disease 2.03% 2.75% 0.72% $2,440 $4,014 $1,574Stroke 0.15% 0.56% 0.41% ** $5,635 $12,730 $7,095Emphysema 0.11% 0.20% 0.09% $1,781 $106 -$1,675Joint Pain 24.93% 31.53% 6.59% *** $4,514 $3,215 -$1,298Arthritis 6.54% 12.60% 6.06% *** $2,926 $4,150 $1,224 ** significant at 10%; ** significant at 5%; *** significant at 1%
Disease Prevalence Expenditures Conditional on Disease
Disease Prevalence Expenditures Conditional on Disease
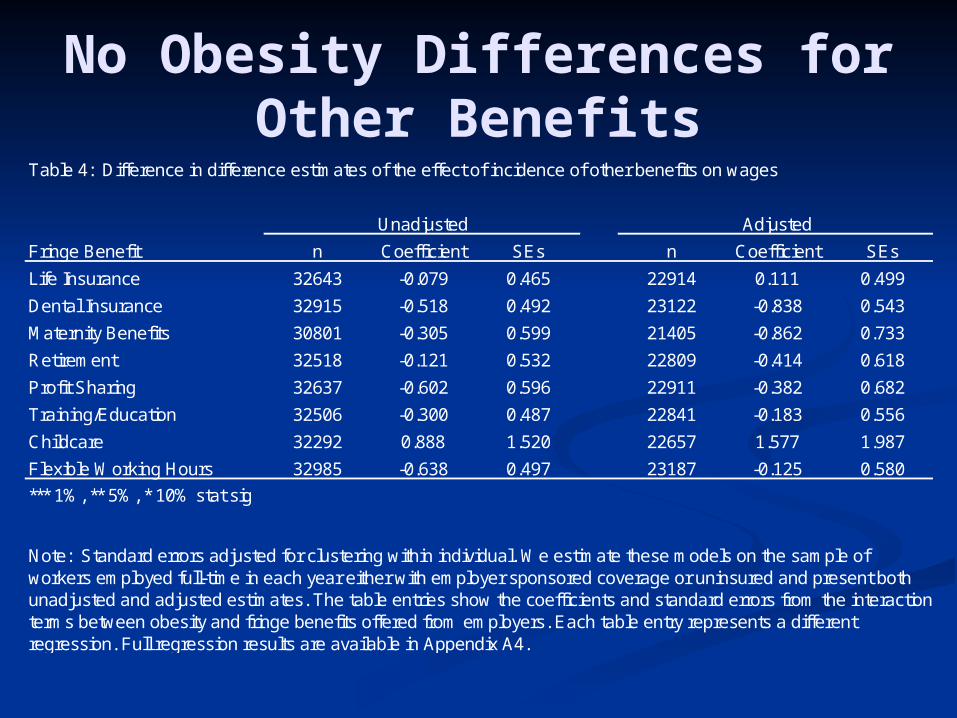
No Obesity Differences for Other Benefits
Table 4: Difference in difference estimates of the effect of incidence of other benefits on wages
Fringe Benefit n Coefficient SEs n Coefficient SEs
Life Insurance 32643 -0.079 0.465 22914 0.111 0.499
Dental Insurance 32915 -0.518 0.492 23122 -0.838 0.543
Maternity Benefits 30801 -0.305 0.599 21405 -0.862 0.733
Retirement 32518 -0.121 0.532 22809 -0.414 0.618
Profit Sharing 32637 -0.602 0.596 22911 -0.382 0.682
Training/Education 32506 -0.300 0.487 22841 -0.183 0.556
Childcare 32292 0.888 1.520 22657 1.577 1.987
Flexible Working Hours 32985 -0.638 0.497 23187 -0.125 0.580
*** 1%, ** 5%, * 10% stat sig
Unadjusted Adjusted
Note: Standard errors adjusted for clustering within individual. We estimate these models on the sample of workers employed full-time in each year either with employer sponsored coverage or uninsured and present both unadjusted and adjusted estimates. The table entries show the coefficients and standard errors from the interaction terms between obesity and fringe benefits offered from employers. Each table entry represents a different regression. Full regression results are available in Appendix A4.

Who Pays for Obesity In Working Age Populations?
Obese workers at firms providing health insurance pay for their higher health insurance costs through lower wages.
Obese workers at firms without health insurance earn the same as their thinner colleagues.

Medicare and Obesity
There is no mechanism in Medicare financing to charge higher premiums to the obese
Obese individuals pay less for Medicare…They earn lower wages
…and get more They are unhealthier when they turn 65

Does Medicare Induce a Social Loss?
It depends upon the incentives created by the transfer to obese individuals induced by Medicare.
If the transfer does not change eating and exercise incentives, then there is no social loss.
Does More Generous Health Insurance
Make You Fat?

RAND Health Insurance Experiment
Experiment run in the late 1970s to mid-1980sFamilies stayed in experiment for ~5 years

Random Assignment to Insurance
Free plan (no out of pocket costs of health care)
25% coinsurance (families paid 25% of health care costs)
50% coinsurance95% coinsurance

RAND Health Insurance Experiment Reanalyzed
Goal: measure the insurance elasticity of body weight
If insurance induces moral hazard, we should expect the greatest gain in weight among people assigned to the most generous insurance (free plan)

% Obese in the RAND HIE at Entry and Exit of the
Experiment
0
2
4
6
8
10
12
14
16
18
Free 25% 50% 95%
Entry
Exit

Family and Social Network Externalities

Social Networks and Obesity
Source: Christakis and Fowler (2007)

Source: Christakis and Fowler (2007)

Source: Christakis and Fowler (2007)

Source: Christakis and Fowler (2007)

Source: Christakis and Fowler (2007)

Source: Christakis and Fowler (2007)

Interpreting Network Formation
Two possible interpretationsObese people make their friends obese
People pick their friends based on body weight

Policy Implications of Family Externalities
Do the external effects of social networks induce any welfare loss?Is there a transfer?Does the transfer induce a change in behavior?
Law of Unintended Consequences: Food Taxes

Unintended Consequences of
Food Taxes Ideally, a food tax should be
assessed on the 2500th calorie (and above) eaten during the day, not on the 1st
Political economy problems:Is granola junk food? Who decides?
Tax may cause undue hardship for the poor
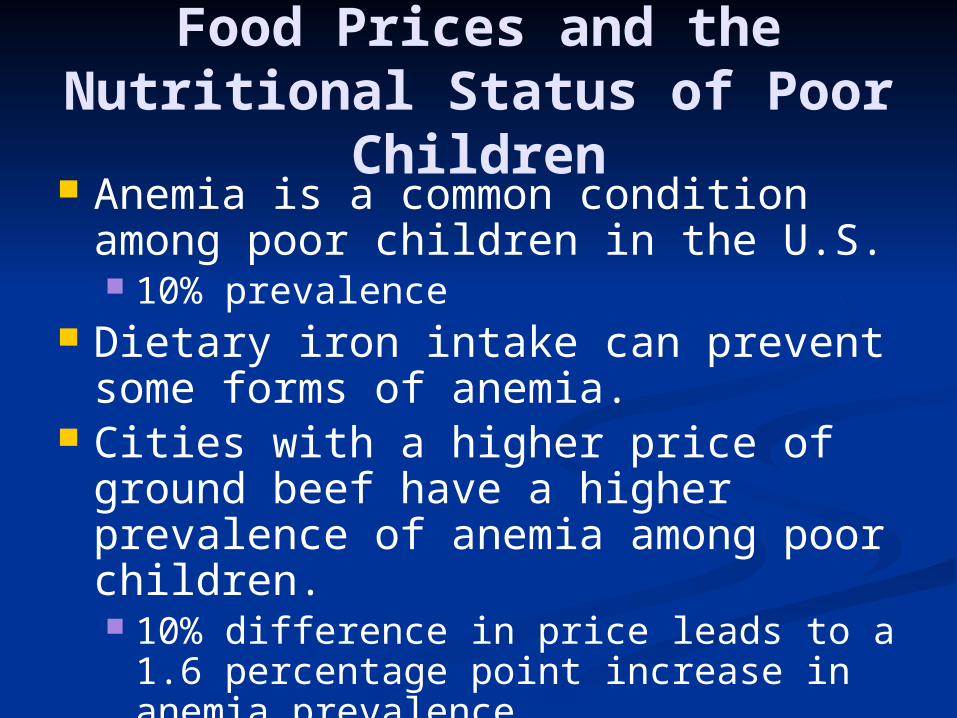
Food Prices and the Nutritional Status of Poor
Children Anemia is a common condition
among poor children in the U.S. 10% prevalence
Dietary iron intake can prevent some forms of anemia.
Cities with a higher price of ground beef have a higher prevalence of anemia among poor children. 10% difference in price leads to a 1.6
percentage point increase in anemia prevalence

Dependent variable (mean) All Ages All Adults
Vitamin A deficiency (7%)
Price of Peaches 0.035(0.036)
-0.013(0.017)
Price of Milk 0.056(0.046)
0.075**
(0.024)
Vitamin C deficiency (12%)
Price of Peaches 0.181**
(0.050)0.212**
(0.063)
Price of Orange Juice 0.064*
(0.036)0.078*
(0.044)
Folate deficiency (16%)
Price of Orange Juice 0.138**
(0.055)0.196**
(0.072)
Price of Bread 0.195(0.122)
0.258(0.165)
Anemia (10%)
Price of Ground Beef 0.106**
(0.051)0.063(0.048)
Effect of food prices on serum nutrient deficiencies
Evidence from the National Health and Nutrition Examination Survey III
Top Related