


Languages
Pages
Legal

Ultrafast Laser-Driven Plasma for Space
PropulsionTerry Kammash, K. Flippo†, T. Lin,
A. Maksimchuk, M. Rever,S. Banerjee, D. Umstadter
FOCUS Center / Center for Ultrafast Optical Science, University of Michigan, Ann Arbor, MI 48109-2099, USA
Y. SentokuGeneral Atomics, San Diego, CA
V. Yu. BychenkovP. N. Lebedev Physics Institute, Russian Academy of Science, 117924 Moscow, Russia
Lasers supported by the National Science Foundation FOCUS Centerand the U of M Center for Ultrafast Optical Science, and funding from NASA Institute For Advanced Concepts
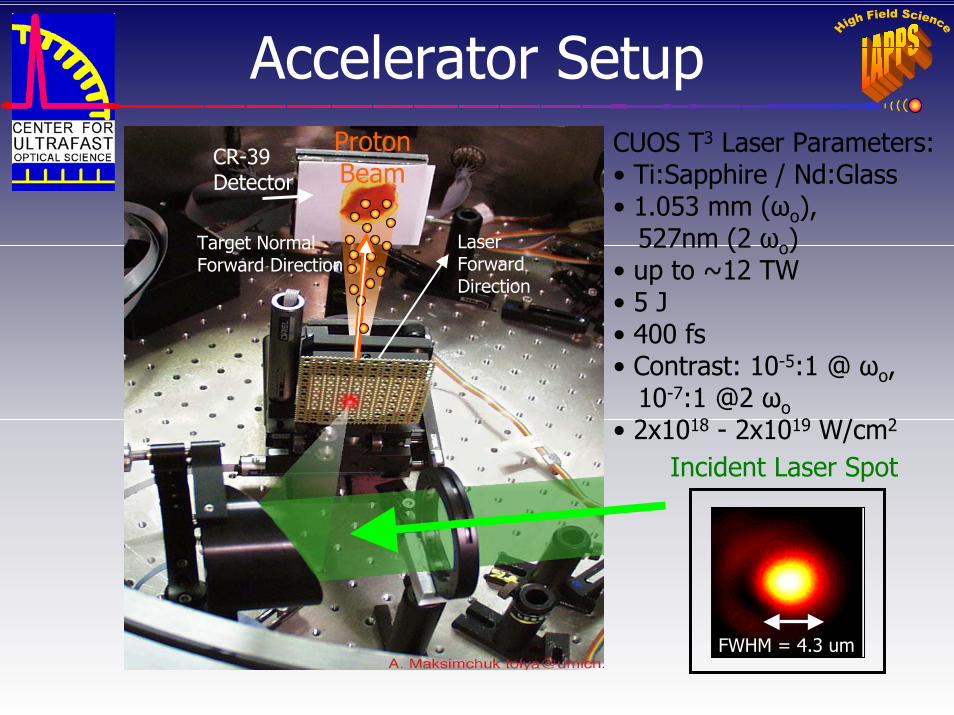
Accelerator SetupProton Beam
CUOS T3 Laser Parameters:• Ti:Sapphire / Nd:Glass• 1.053 mm (ωo),
527nm (2 ωo)• up to ~12 TW • 5 J• 400 fs• Contrast: 10-5:1 @ ωo,
10-7:1 @2 ωo• 2x10¹⁸ - 2x10¹⁹ W/cm2
Target Normal Forward Direction
Laser Forward Direction
CR-39 Detector
FWHM = 4.3 um
Incident Laser Spot

Front Surface Deuteron Acceleration
•Activation of 10B to 11C is achieved only by illuminating deuterons on the front surface. •No activation when deuterons were on the back surface, or without deuterons (i.e. no production of 11C detected from 11B (p,n)11C reaction).•Deuterons have about ½ the Emax of the measured protons
10
100
1000
0 10 20 30 40 50 60 70
Cou
nts
/2 m
in
Time after shot (min)
Decay for 11C
Ilas=6x10¹⁸ W/cm2
Detection efficiency 15%
10B(d,n)11C reaction
Boronsample
Laser
Mylar filmCD
11C10BDeuterons
n
K. Nemoto, S. Banerjee, K. Flippo , A. Maksimchuk, D. Umstadter App. Phys. Lett, 78, 595 (2001)
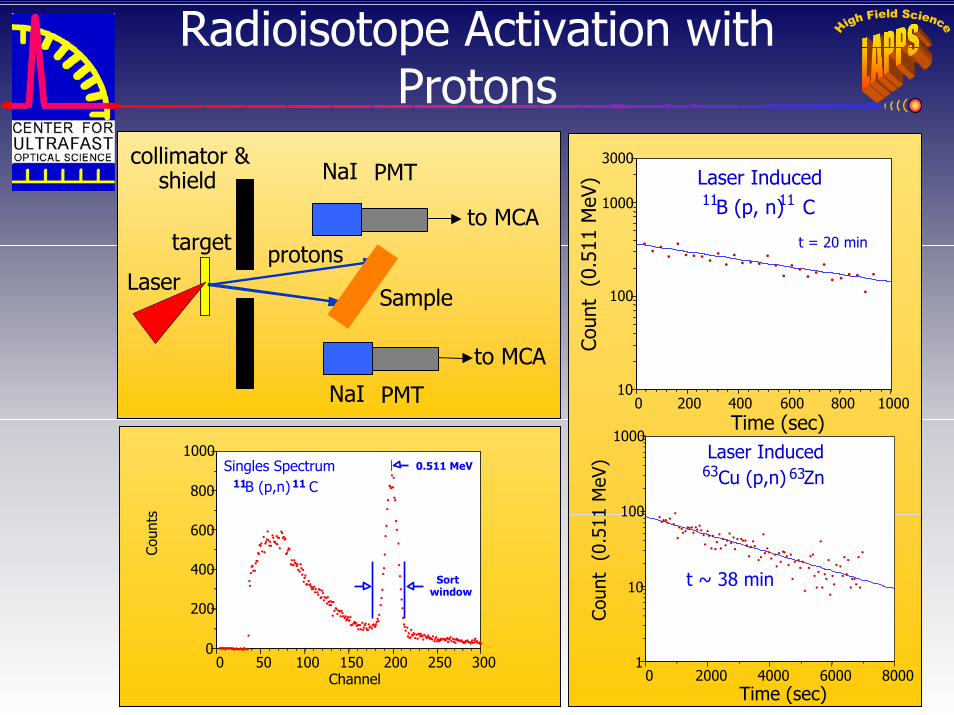
Radioisotope Activation with Protons
NaI PMT
to MCA
Sample
protonsLaser
target
collimator &shield
NaI PMT
to MCA
•••••••
•
•
•••••••
•••••
••
••
•
•
•••
•••••••
•• •••
•
••••
••
•
•••••
•
•••••
•
•
•
••••
•
•
••
•
•
•
•
•
••
•
•
••
• ••
•
•
•
••••
•
•
•
1
10
100
1000
0 2000 4000 6000 8000
Coun
t (
0.51
1 M
eV)
Time (sec)
t ~ 38 min
Cu (p,n) Zn63 63Laser Induced
•••••••••••••••••••••••••••••••••
•
••
••••••••••••••
•
•••••••••
•••••••••
•
••••••
•••••
•••••••••••
••••
•••••••••••••••••
••••••••••••••••
•
•••••••••
••••••••••••••••••••
••••••••••••••••••••
•••••••
••
•
•
•
••
•••
•
••
••
••
•
•
•
•
•••••••••••••••••••
•••••••••••••••••••••••••••••••••••••
•••••••••••••••••••••••••••••••••••0
200
400
600
800
1000
0 50 100 150 200 250 300
Coun
ts
Channel
Singles SpectrumB (p,n) C11 11
0.511 MeV
Sort window
•• •
•
•• • • •
••
•• • •
••
•• •
• ••
• • • •
•
•
10
100
1000
3000
0 200 400 600 800 1000
Coun
t (
0.51
1 M
eV)
Time (sec)
B (p, n) C1111
t = 20 min
Laser Induced

Material Effect on Proton Production
E
e-
Conductor Insulator
p+
p+ p+BB
e-
E
Mylar (polyethylene terephthalate C10H8O4)• ρ~1.2 g/cm3
• σ=10-12 Ω-1m-1
• Z=4.3
Aluminum• ρ~2.7 g/cm3
• σ=3.6×10⁷ Ω-1m-1
• Z=13
p+
e-
p+p+
laserlaser targettarget
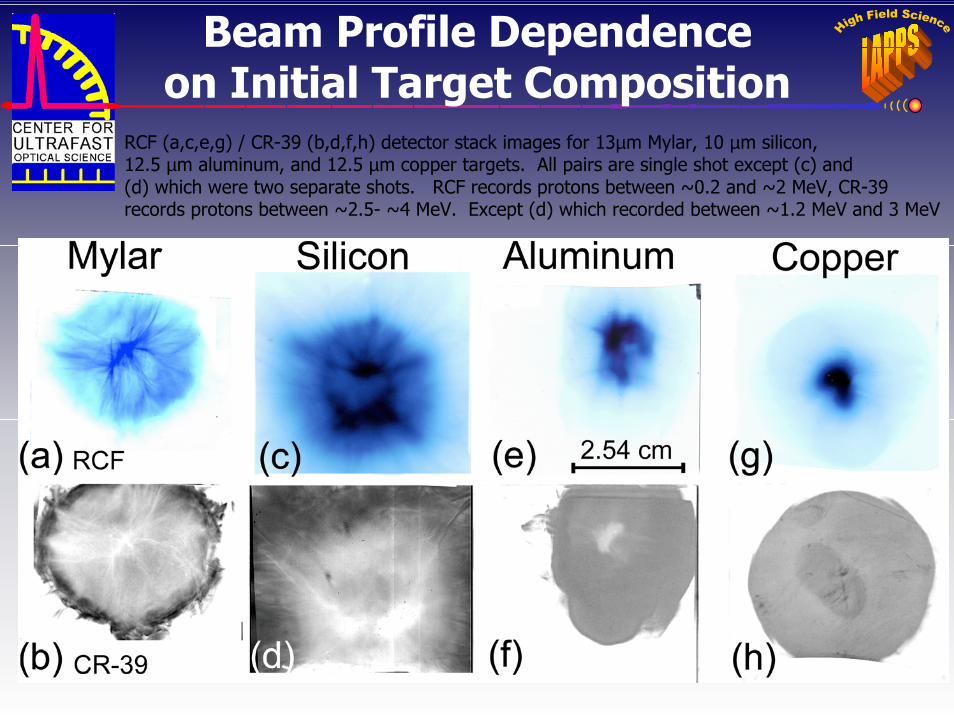
Beam Profile Dependenceon Initial Target Composition
RCF (a,c,e,g) / CR-39 (b,d,f,h) detector stack images for 13µm Mylar, 10 µm silicon, 12.5 µm aluminum, and 12.5 µm copper targets. All pairs are single shot except (c) and (d) which were two separate shots. RCF records protons between ~0.2 and ~2 MeV, CR-39 records protons between ~2.5- ~4 MeV. Except (d) which recorded between ~1.2 MeV and 3 MeV
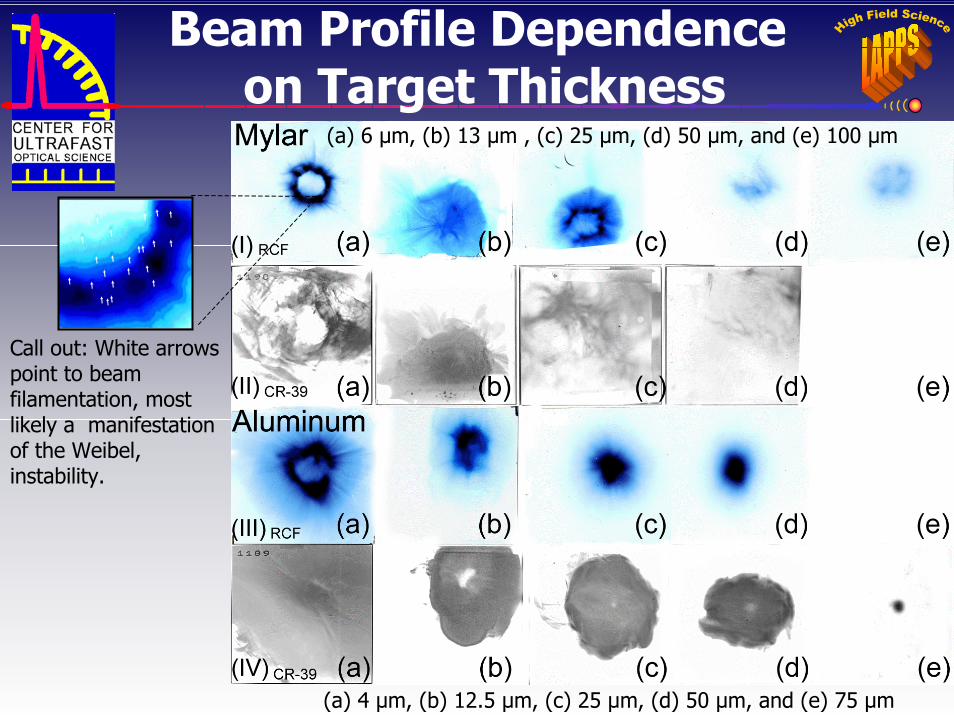
Beam Profile Dependenceon Target Thickness
(a) 6 µm, (b) 13 µm , (c) 25 µm, (d) 50 µm, and (e) 100 µm
(a) 4 µm, (b) 12.5 µm, (c) 25 µm, (d) 50 µm, and (e) 75 µm
Call out: White arrows point to beam filamentation, most likely a manifestation of the Weibel, instability.
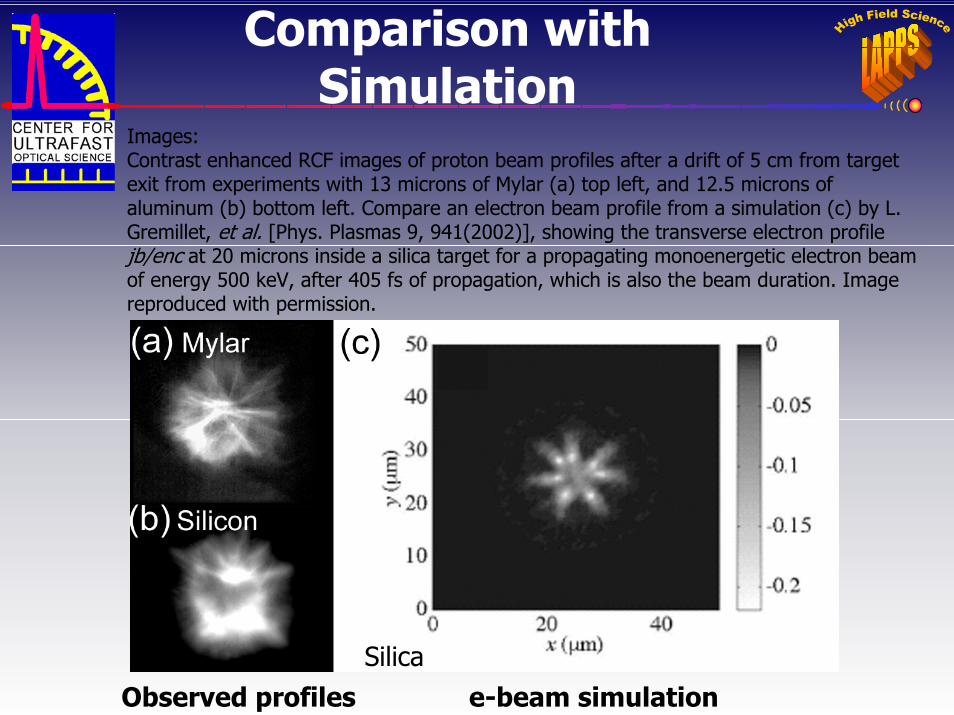
Comparison with Simulation
Images: Contrast enhanced RCF images of proton beam profiles after a drift of 5 cm from target exit from experiments with 13 microns of Mylar (a) top left, and 12.5 microns of aluminum (b) bottom left. Compare an electron beam profile from a simulation (c) by L. Gremillet, et al. [Phys. Plasmas 9, 941(2002)], showing the transverse electron profile jb/enc at 20 microns inside a silica target for a propagating monoenergetic electron beam of energy 500 keV, after 405 fs of propagation, which is also the beam duration. Image reproduced with permission.
SilicaObserved profiles e-beam simulation
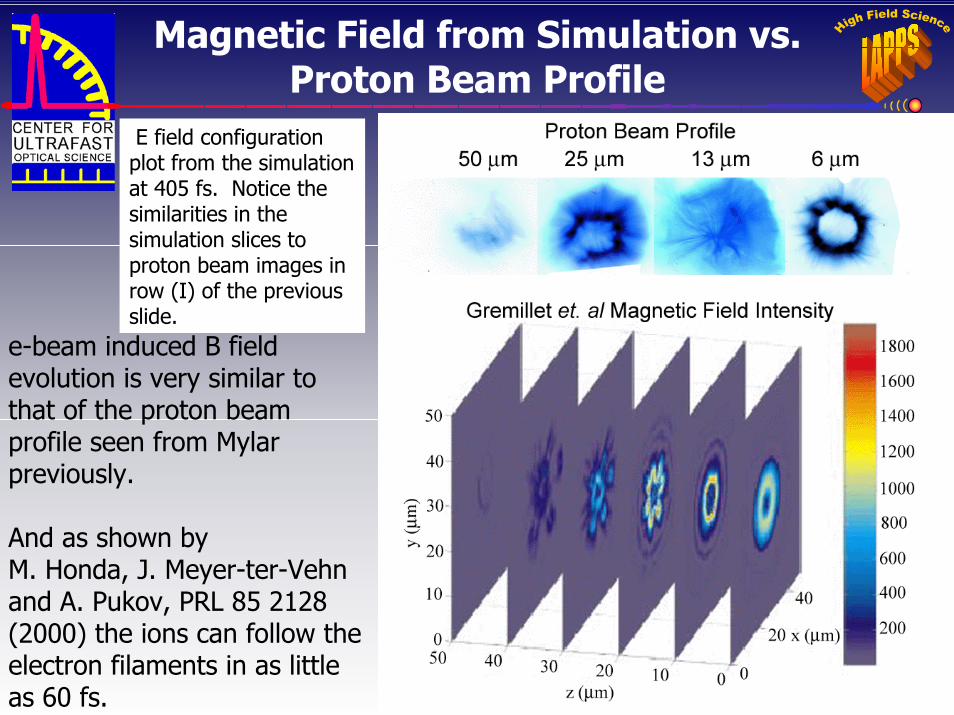
Magnetic Field from Simulation vs. Proton Beam Profile
E field configuration plot from the simulation at 405 fs. Notice the similarities in the simulation slices to proton beam images in row (I) of the previous slide.
e-beam induced B field evolution is very similar to that of the proton beam profile seen from Mylar previously.
And as shown byM. Honda, J. Meyer-ter-Vehn and A. Pukov, PRL 85 2128 (2000) the ions can follow the electron filaments in as little as 60 fs.
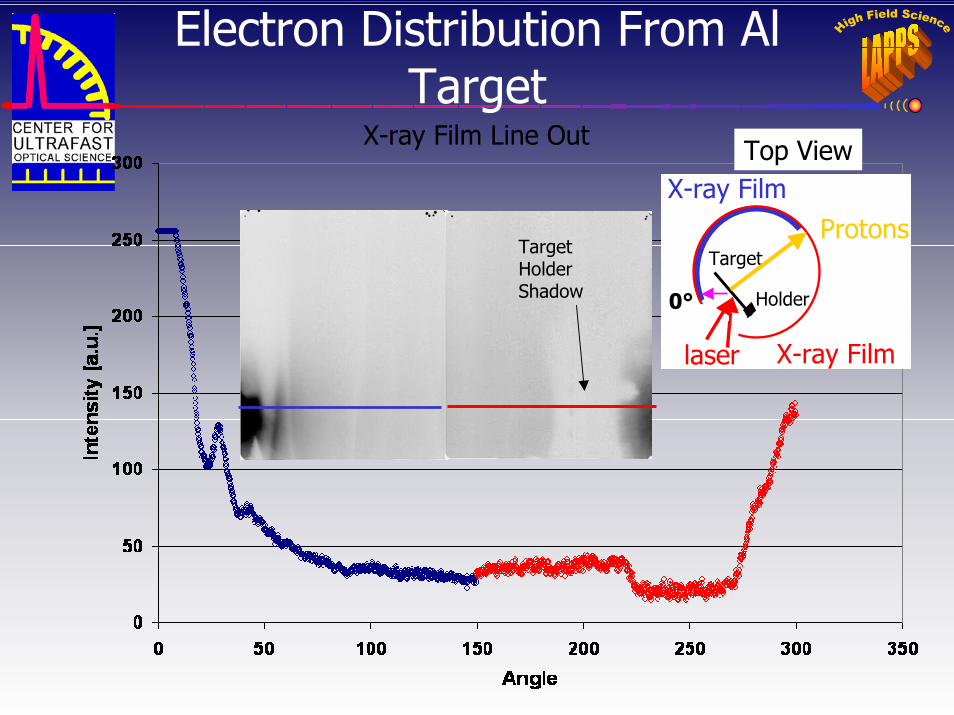
Electron Distribution From Al Target
ProtonsX-ray Film
laser
Target
Top View
Target Holder Shadow
X-ray Film Line Out
X-ray Film
Holder0°
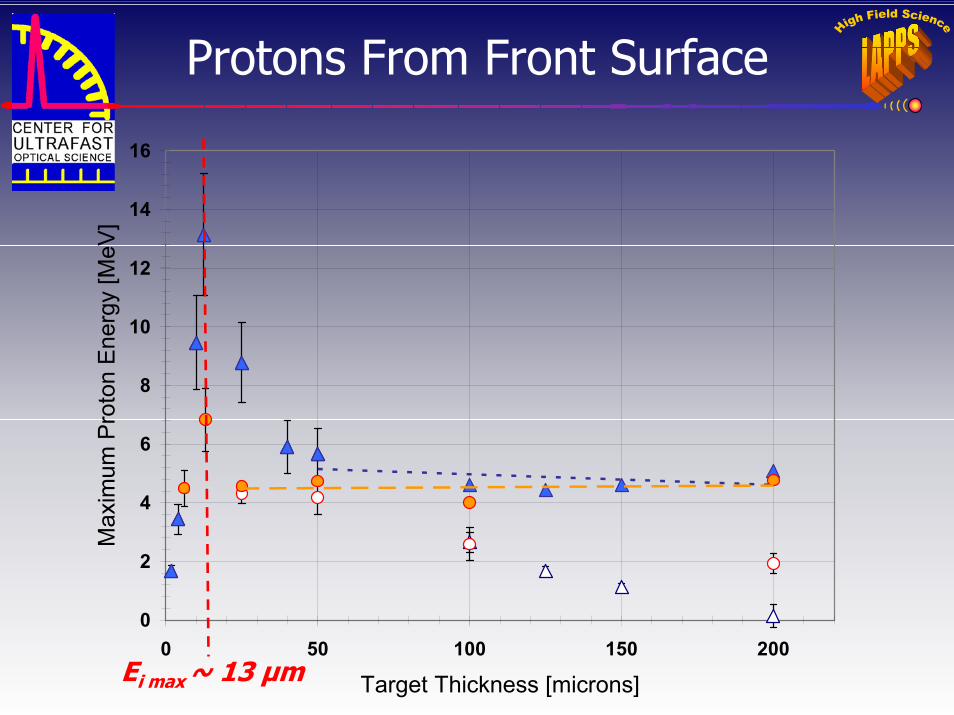
Protons From Front Surface
0
2
4
6
8
10
12
14
16
0 50 100 150 200
Target Thickness [microns]
Max
imum
Pro
ton
Ene
rgy
[MeV
]
Ei max ~ 13 µm
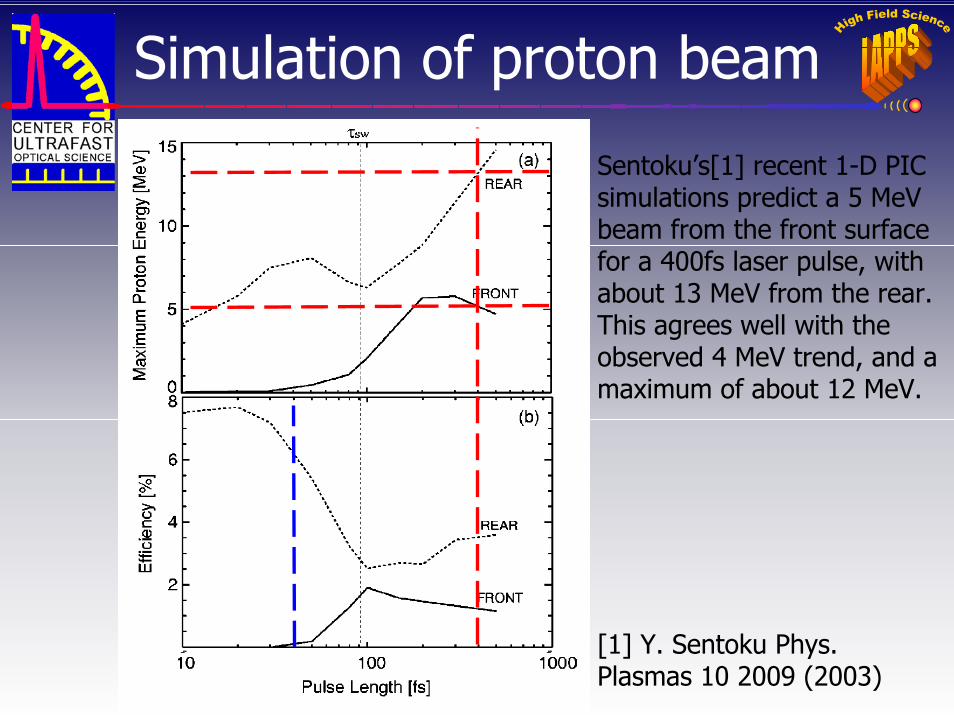
Simulation of proton beam
Sentoku’s[1] recent 1-D PIC simulations predict a 5 MeV beam from the front surface for a 400fs laser pulse, with about 13 MeV from the rear. This agrees well with the observed 4 MeV trend, and a maximum of about 12 MeV.
[1] Y. Sentoku Phys. Plasmas 10 2009 (2003)

Deuteron AccelerationPreliminary Results
Deuteron coating No deuteron coating
p+d+p+
Where do highest energy deuterons come from?1. The BACK of 12.5um Al2. The FRONT of 6 um Mylar3. The FRONT of 13 um Mylar4. The FRONT of 12.5 um Al5. The BACK of 13 um Mylar
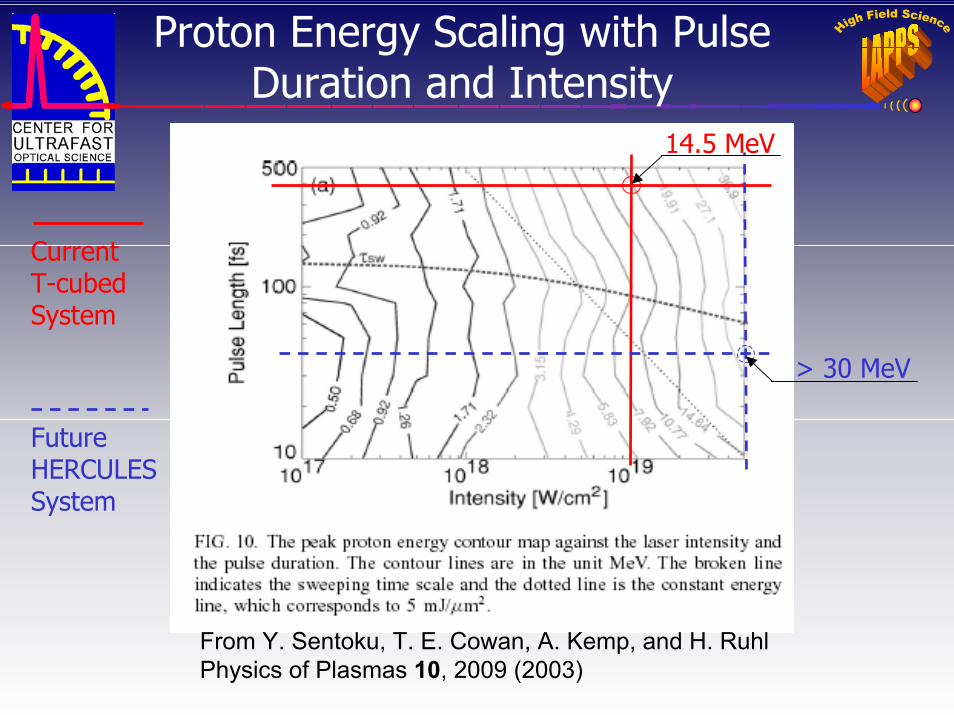
Proton Energy Scaling with Pulse Duration and Intensity
From Y. Sentoku, T. E. Cowan, A. Kemp, and H. RuhlPhysics of Plasmas 10, 2009 (2003)
14.5 MeV
> 30 MeV
Current T-cubed System
Future HERCULES System
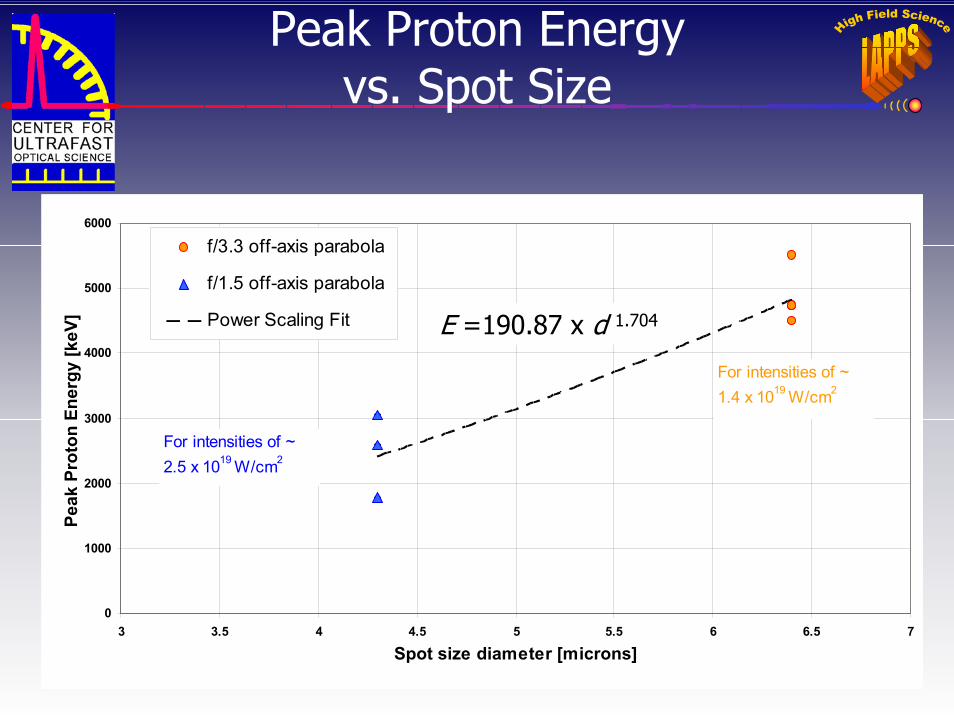
Peak Proton Energy vs. Spot Size
E = 190.87d 1.7404
0
1000
2000
3000
4000
5000
6000
3 3.5 4 4.5 5 5.5 6 6.5 7
Spot size diameter [microns]
Peak
Pro
ton
Ener
gy [k
eV]
f/3.3 off-axis parabola
f/1.5 off-axis parabola
Power Scaling Fit
For intensities of ~ 1.4 x 10¹⁹ W/cm2
For intensities of ~ 2.5 x 10¹⁹ W/cm2
E =190.87 x d 1.704

Spot Size Comparison
Total Intensity vs. Diameter for f/1.5 Paraboloid 4.3 FWHM Spot Size
0
20
40
60
80
100
120
0 5 10 15 20 25 30 35 40 45 50Spot Size Diameter [um]
Tota
l Ene
rgy
[%]
Profile of 4.3µm FWHM Spot
0100002000030000400005000060000
-15 -10 -5 0 5 10 15Radial Position [µm]
Inte
nsity
[a.u
.]
40% in FWHM
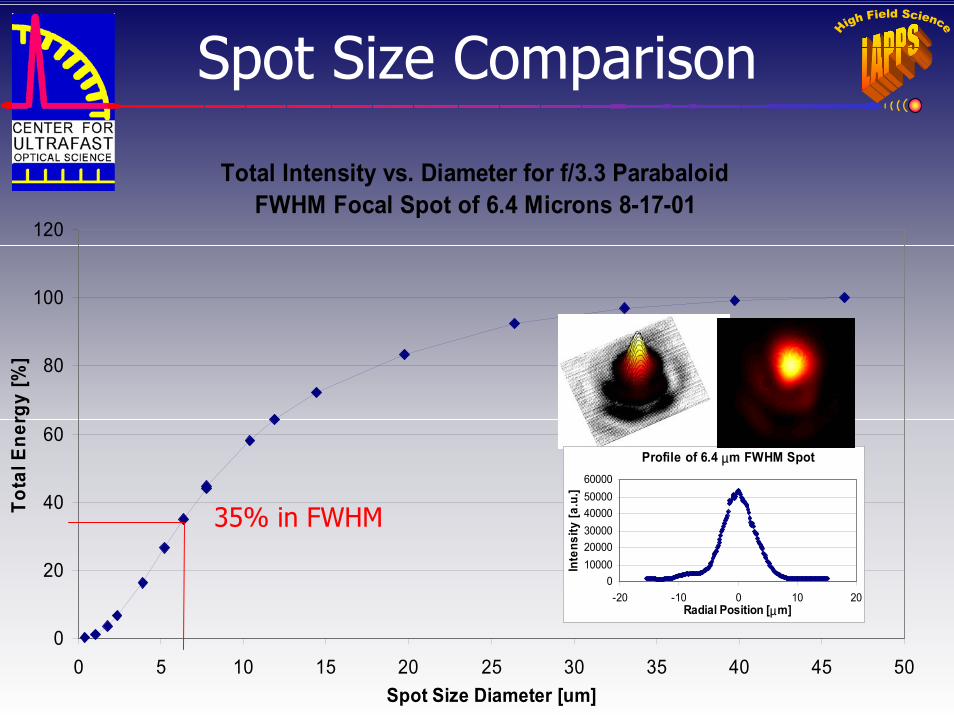
Spot Size Comparison
Total Intensity vs. Diameter for f/3.3 Parabaloid FWHM Focal Spot of 6.4 Microns 8-17-01
0
20
40
60
80
100
120
0 5 10 15 20 25 30 35 40 45 50Spot Size Diameter [um]
Tota
l Ene
rgy
[%]
Profile of 6.4 µm FWHM Spot
0100002000030000400005000060000
-20 -10 0 10 20Radial Position [µm]
Inte
nsity
[a.u
.]
35% in FWHM

Material Effects on Plume ProfileProton Beam Images Using a CCD
Laser Propagation
Direction
TargetPlane
Dark Side
IlluminatedSide
4 Al Target, 4MeV beamNo backfilled
gas,200 mTorr ambient
4 um Al Target with 2 Torr H2
25 um Mylar Target
25 um Mylar Target
with 2.4 Torr He
25 um Al Target
Proton Beam isEmitted Normal to Target

Plume Evolution in 1 Torr H2Ambient Backfill
12.5 mm Al
+4 ms +1 ms +4 ms +14 ms
3.069 cm
25 mm Mylar
2.138 cm
~31000 m/s
2.222cm
3.194 cm
~32000 m/s
1 cm
+ 65.5us+1 ms

Target Geometry
>1.4 MeV, 55º div.@ 1.5x10¹⁹ W/cm2
>2 MeV, 38º div.@ 1.2x10¹⁹ W/cm2
> 1.4 MeV, 44º div.@ 1.6x10¹⁹ W/cm2
> 3 MeV, 28º div.@ 1.2x10¹⁹ W/cm2
Laser
Protons
Target
TargetHolder
Curved TargetGeometry 25 µm AlRadius of
curvature ~ 0.2 mm
Radius of curvature ~ 0.5 mm
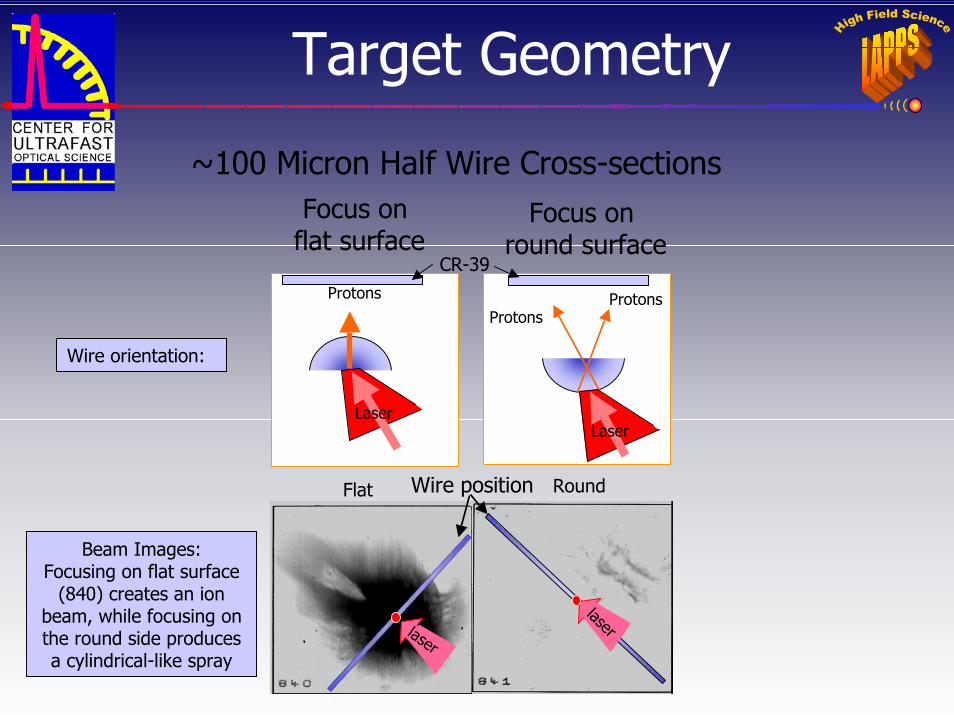
Target Geometry
~100 Micron Half Wire Cross-sectionsFocus on
flat surfaceFocus on
round surface
Wire orientation:
Protons
Laser
ProtonsProtons
Laser
Wire position
CR-39
Flat Round
laser
laser
Beam Images:Focusing on flat surface
(840) creates an ion beam, while focusing on the round side produces a cylindrical-like spray

Target Surface Geometry
Electron Microscopyof LaserBlack™
Results:•30 mm Laserblack target ~ 8.2 MeV•Enhancement in the number of maximum energy protons•Beam profile does not suffer, regardless of which surface has been coated, i.e. no imprinting even from rear-side
100 µm
2 µm
Murnane et al. APL 62 (1993) used gratings and clusters,Kulcsar et al. PRL 84 (2000) used metallic “velvet”.
Both showed enhanced X-ray yield from enhance electron heating from efficient coupling.
LaserBlack® is > 96% absorptive at 1 mm.
Laser Spot Size ~ 6 microns
Use a material which will “trap” the laser light, to enhance the generation of hot electrons.
>1.3MeV31º div.

T-cube Laser
Thin Film Target
Mesh Radiochromic Film
51.8 lines high
Proton Radiography
The possibility exists to use the laser produced proton beam for very small scale imaging or even lithography.
The image on the left is a 5x magnified proton radiograph captured on RCF of a mesh with 10 micron wires and 30 micron grid spacing.
Proton Beam
1 mm
1 mm
Approximate Region Sampled by Beam
Area of Image at Right

Future Laser Development
100-200 TW@ 25-40 fs
0.1 Hz350 ps7-10 J2-pass Amplifier
20-30 TW@ 25 fs
10 Hz350 ps1-1.5 J4-pass Amplifier
1 PW @ 30-40 fs0.1 Hz350ps50 JHigh-Power Amplifier
N/A10 Hz350 ps100 mJRegenerativeAmplifier
N/A10 Hz15 fs1 mJCleaner(106 contrast)
N/A80 Mhz10-15 fs1 nJOscillator
Compressed Output
RepetitionRate
Pulse widthEnergy
Current Hercules
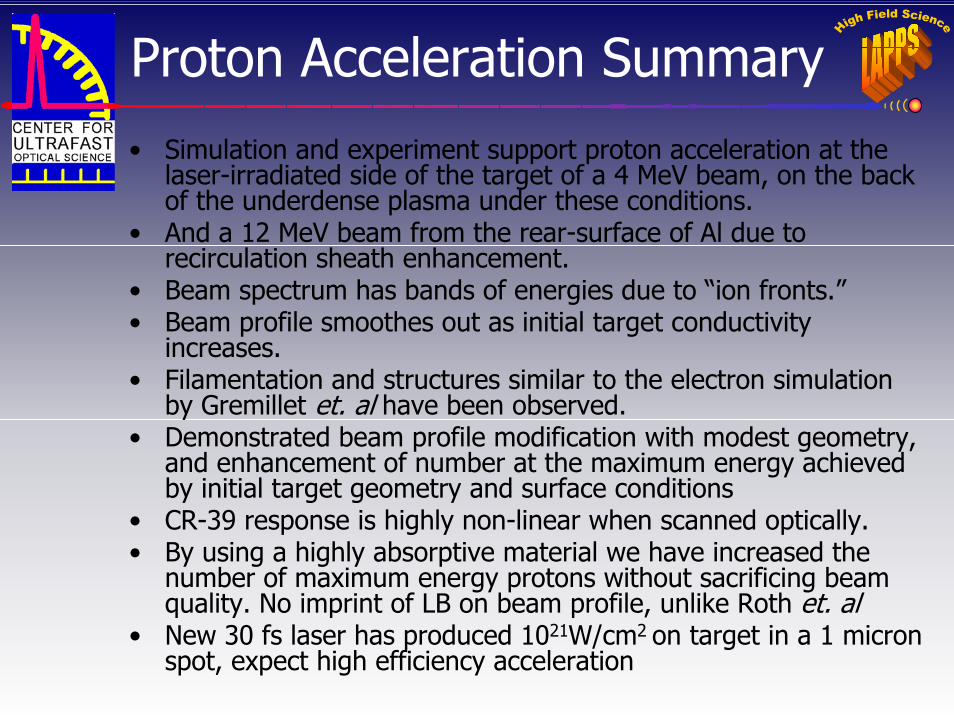
Proton Acceleration Summary• Simulation and experiment support proton acceleration at the
laser-irradiated side of the target of a 4 MeV beam, on the back of the underdense plasma under these conditions.
• And a 12 MeV beam from the rear-surface of Al due to recirculation sheath enhancement.
• Beam spectrum has bands of energies due to “ion fronts.”• Beam profile smoothes out as initial target conductivity
increases.• Filamentation and structures similar to the electron simulation
by Gremillet et. al have been observed.• Demonstrated beam profile modification with modest geometry,
and enhancement of number at the maximum energy achieved by initial target geometry and surface conditions
• CR-39 response is highly non-linear when scanned optically.• By using a highly absorptive material we have increased the
number of maximum energy protons without sacrificing beam quality. No imprint of LB on beam profile, unlike Roth et. al
• New 30 fs laser has produced 1021W/cm2 on target in a 1 micron spot, expect high efficiency acceleration

Ion Acceleration Physics Relativistic Electron Cloud (Beam) Model One-
Dimensional
Poisson’s Equation∇ ·E=-4 πenb
Where:e=electron chargenb=beam electron density
Can readily show:Ez=2πenbh
Where:h=thickness of electron cloudR=radius of electron cloudd=diameter of electron cloud
d
R
Ez
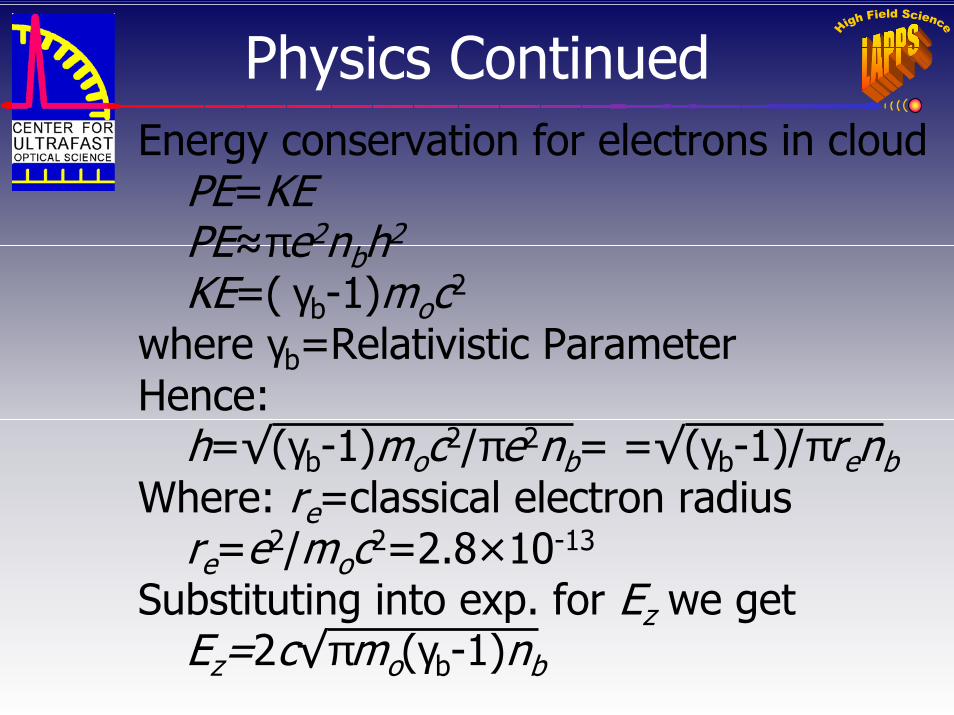
Physics ContinuedEnergy conservation for electrons in cloud
PE=KEPE≈πe2nbh2
KE=( γb-1)moc2
where γb=Relativistic ParameterHence:
h=√(γb-1)moc2/πe2nb= =√(γb-1)/πrenbWhere: re=classical electron radius
re=e2/moc2=2.8×10-13
Substituting into exp. for Ez we getEz=2c√πmo(γb-1)nb
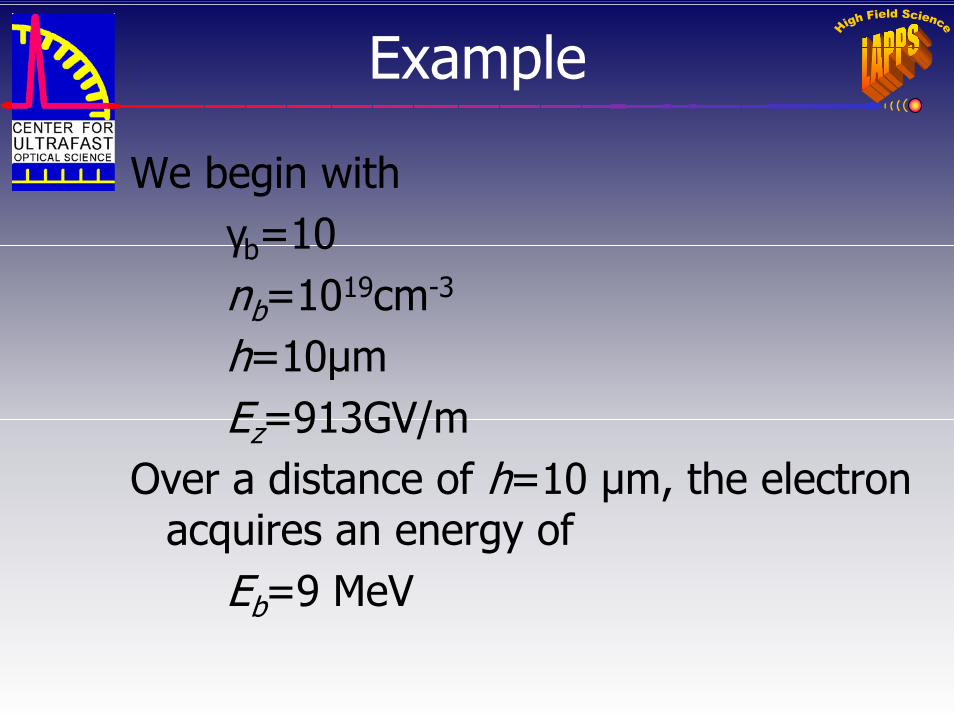
Example
We begin withγb=10nb=1019cm-3
h=10µmEz=913GV/m
Over a distance of h=10 µm, the electron acquires an energy of
Eb=9 MeV
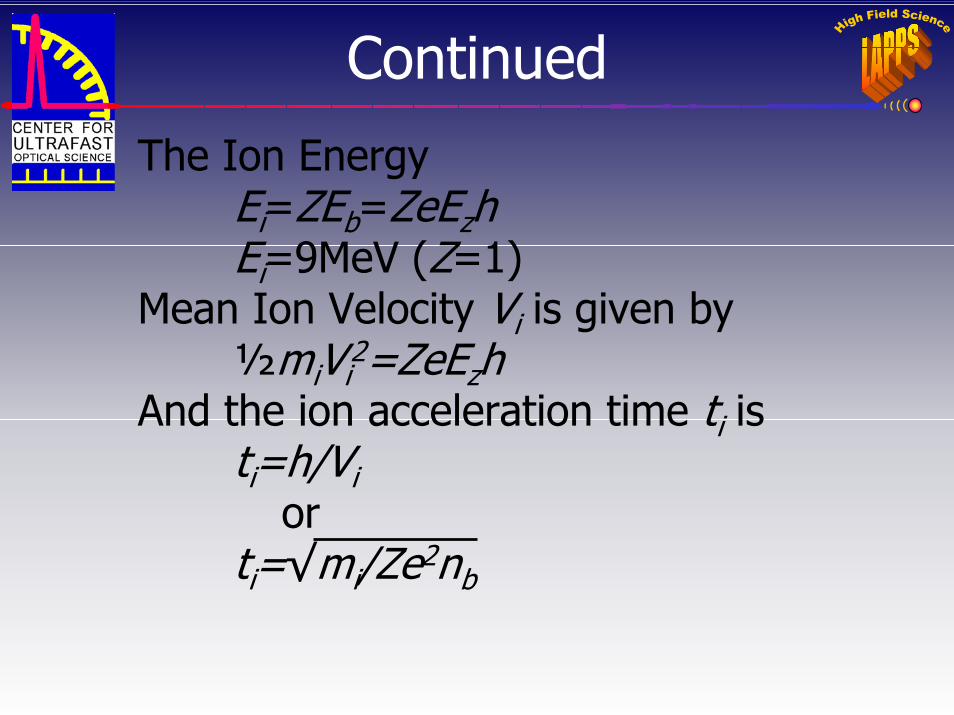
Continued
The Ion Energy Ei=ZEb=ZeEzhEi=9MeV (Z=1)
Mean Ion Velocity Vi is given by ½miVi
2=ZeEzhAnd the ion acceleration time ti is
ti=h/Vior
ti=√mi/Ze2nb

Two Asymptotic Regimes for Ion Acceleration
1. “Isothermal” expansion relevant to long pulse lengths i.e.
τ>ti (ti=1ps)
Ions acquire exponential distribution in velocity
dni /dv ~ exp-( v/CS)
Where CS=√ZTe/mi = ion sound speed
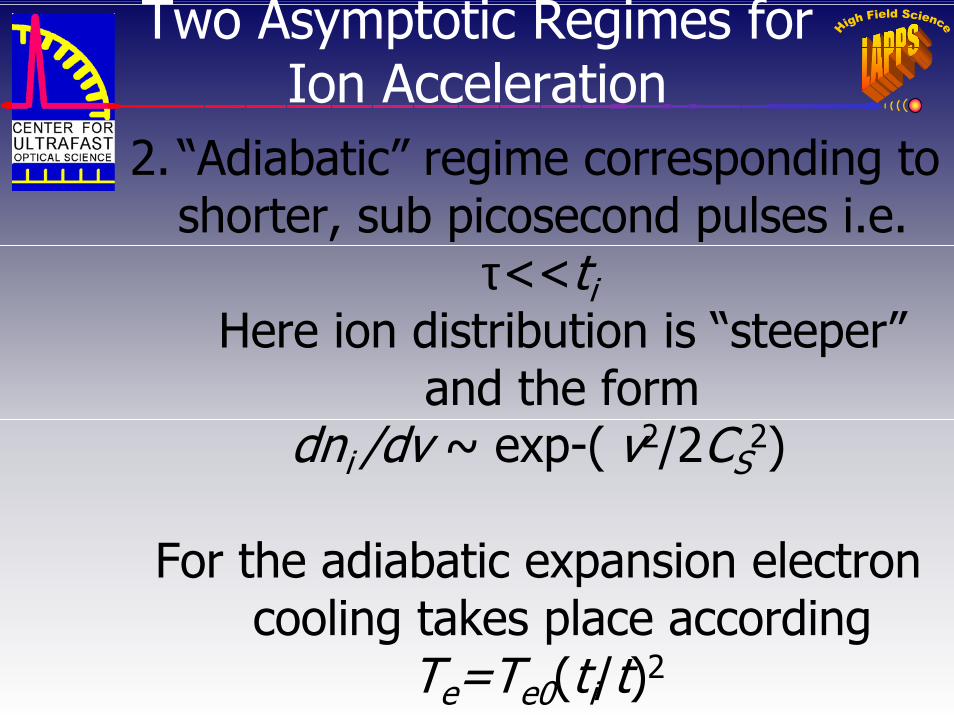
Two Asymptotic Regimes for Ion Acceleration
2. “Adiabatic” regime corresponding to shorter, sub picosecond pulses i.e.
τ<<tiHere ion distribution is “steeper”
and the formdni /dv ~ exp-( v2/2CS
2)
For the adiabatic expansion electron cooling takes place according
Te=Te0(ti/t)2

Ion Velocities
Maxium Ion Velocities:Isothermal vmax=2CS ln(d/h)Adiabatic vmax=2√2CS ln(d/h)
Note in both instances:Ion Acceleration is more efficient when
(d/h)>>1i.e. for larger focal spots
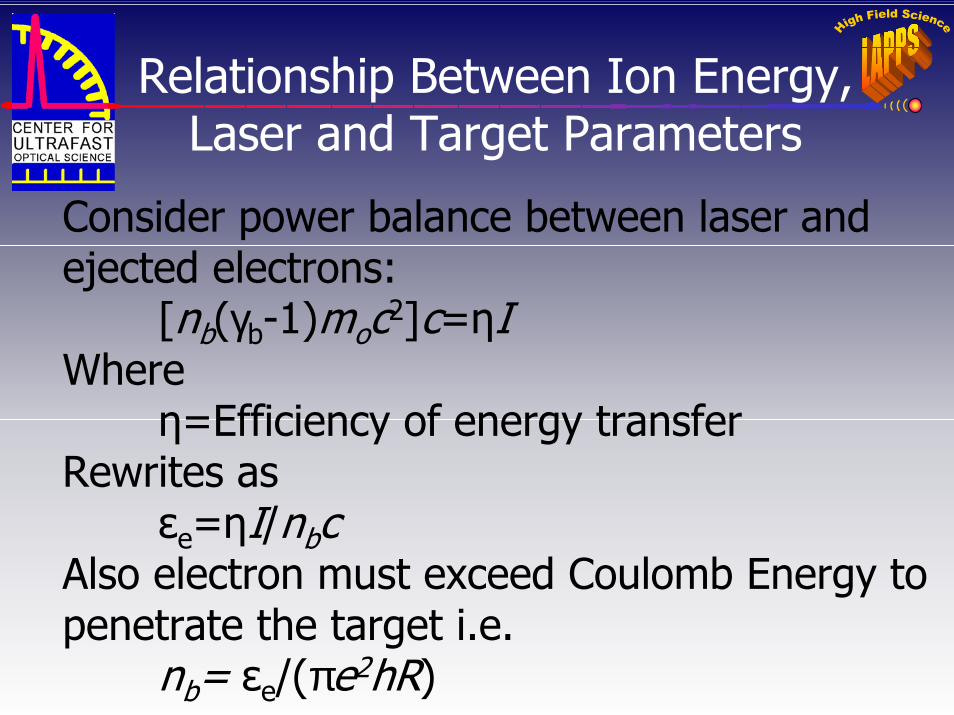
Relationship Between Ion Energy, Laser and Target Parameters
Consider power balance between laser and ejected electrons:
[nb(γb-1)moc2]c=ηIWhere
η=Efficiency of energy transferRewrites as
εe=ηI/nbcAlso electron must exceed Coulomb Energy to penetrate the target i.e.
nb= εe/(πe2hR)

Relationship Between Ion Energy, Laser and Target Parameters
Combining we get:εe=√πe2IRh η/c
Since h≈λ = laser wave length, thenεe=√πe2IRh η/c
Andεi=Z εe
If we express intensity I in units of 1018
W/cm2 and R and λ in microns thenεi=Z εe≈ √ ηIRλ MeV

An Example
I=1021W/cm2
η=0.10R=2.5 µm
Thenεi=14 MeV

Thrust
F=NiMiωVi
Mi = ion mass (proton) = 1.6 ×10⁻²⁷ kg
ω = representation rate ≈ 1kHz
Vi = ion velocity (14 MeV) = 5.2×10⁷ m/s

Plasma Expansion in Vacuum
Ion acceleration timeti=h/vi = 19×10-15 sec
Pulse length (projected) τ=30×10-15
Thenτ>ti Expansion is Isothermalvi max = 2 CS ln(d/h)CS= √ZTe /mi =3×10⁷ m/secvi max= 108 m/secVi initial ≈ 5×10⁷ m/sec
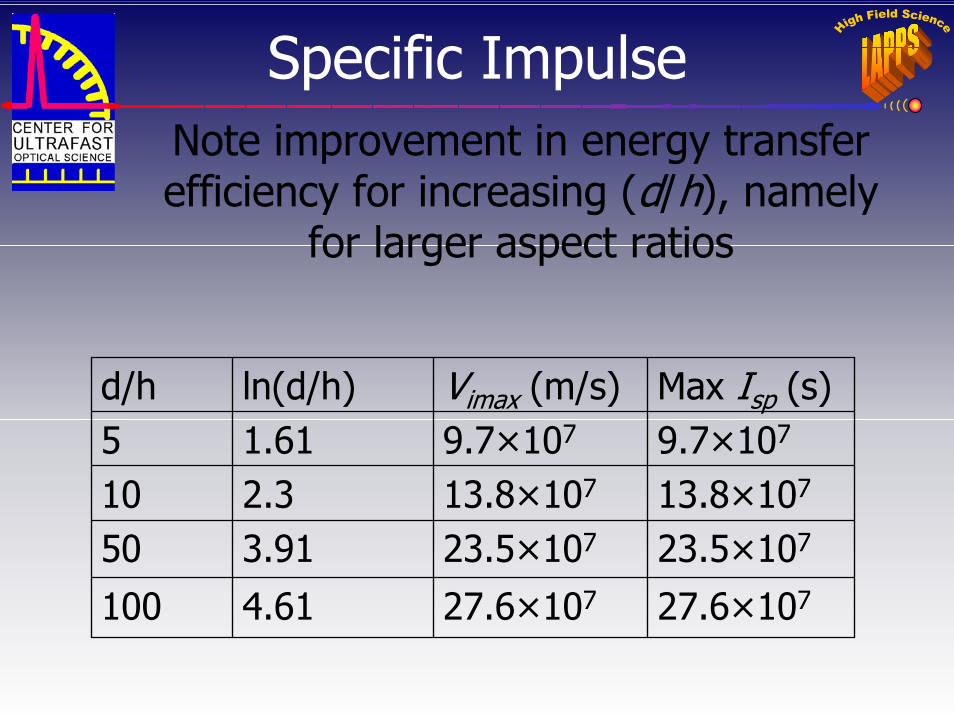
Specific ImpulseNote improvement in energy transfer efficiency for increasing (d/h), namely
for larger aspect ratios
27.6×10727.6×1074.6110023.5×10723.5×1073.915013.8×10713.8×1072.3109.7×1079.7×1071.615Max Isp (s)Vimax (m/s)ln(d/h)d/h

Accomplishments Thus Far1. Generate a Relativistically Consistent
Mathematical Expression for the energy of the ejected ion as a function of laser and target parameters, i.e.
Ei =z √ηIRλwhere
z = ion chargeη = energy conversion efficiencyR = radius of focal spotλ = laser wave length

Accomplishments Thus Far
2. Experimentally validatedEi~ √IEi~ √λ
3. Indirectly established relationships relating Ei to R and dependence on η. More work is needed in this area!
Just purchased 5 parabolic mirrors to investigate thoroughly dependence of Ei and total number of ejected particles on R.
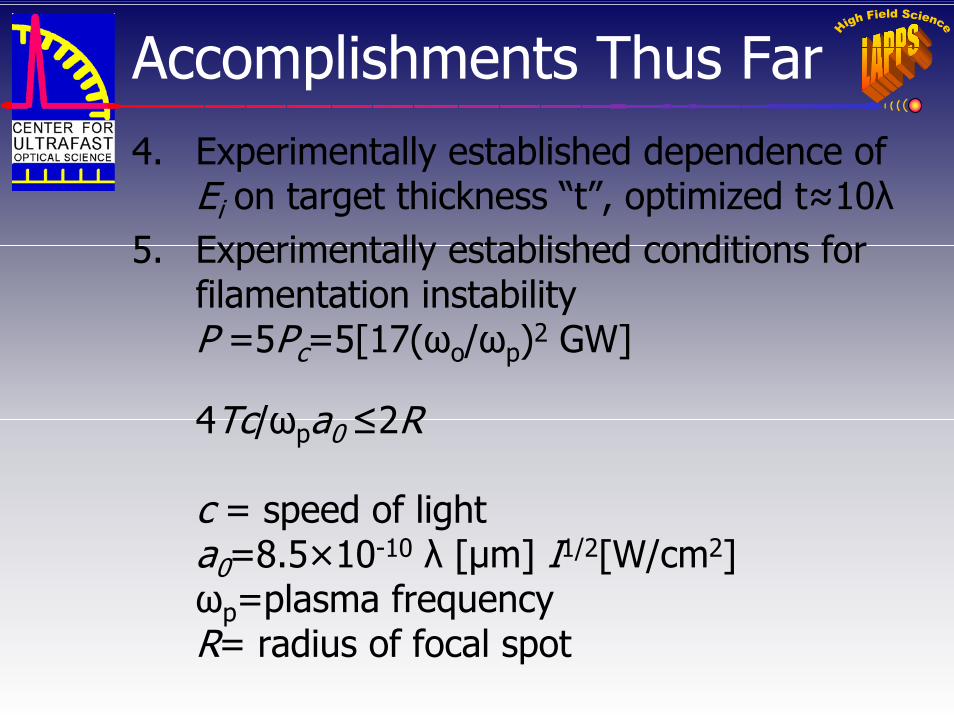
Accomplishments Thus Far4. Experimentally established dependence of
Ei on target thickness “t”, optimized t≈10λ5. Experimentally established conditions for
filamentation instabilityP =5Pc=5[17(ωo/ωp)2 GW]
4Tc/ωpa0≤2R
c = speed of lighta0=8.5×10⁻¹⁰ λ [µm] I1/2[W/cm2]ωp=plasma frequencyR= radius of focal spot
Accomplishments Thus Far
4. Experimentally established energy of ions ejected from front and rear surfaces of target which appear to agree well with simulations
5. Established dependence of proton beam profiles on materials, surface conditions and geometry
6. Carried out designs of space Nuclear Reactor for use in LAPPS. Likely candidates are gas-cooled Cermet reactors using Uranium, Plutonium or Americium as fuel.
Top Related