


Languages
Pages
Legal

Labor Supply Effects of Occupational Regulation: Evidence from the Nurse Licensure Compact*
Christina DePasquale
Emory University [email protected]
Kevin Stange University of Michigan and NBER
September 17, 2015
ABSTRACT
There is concern that state licensure requirements impede efficient mobility of licensed professionals to areas of high demand. Nursing has not been immune to this criticism, especially in the context of perceived nurse shortages and large expected future demand. The Nurse Licensure Compact (NLC) was introduced to solve this problem by permitting registered nurses to practice across state lines without obtaining additional licensure and making licensure easier to obtain for nurses moving between member states. We exploit the staggered adoption of the NLC across states and over time to examine whether a reduction in licensure-induced barriers alters the nurse labor market. Using data on over 1.5 million nurses and other health care workers from the 1990 and 2000 Census and the 2006-2012 American Community Surveys as well as data from the 1992-2012 Current Population Survey, we estimate the effects of NLC adoption on labor supply and commuting outcomes. We find no evidence that the labor supply or mobility of nurses increases following the adoption of the NLC, even among the residents of counties bordering other NLC states who are potentially most affected by the NLC. This suggests that nationalizing occupational licensing will not substantially reduce the labor market frictions caused by occupational regulation.
* We are grateful to Thomas Buchmueller, Sam Kleiner, Francine Lafontaine, Yesim Orhun, Sarah Stith, and seminar participants at the Rollins School of Public Health, ASHEcon 2014, and APPAM 2014 for helpful comments and suggestions.
1

1 Introduction
Occupational licensing is pervasive in the US and Europe. Nearly 29% of the US
workforce requires a federal- or state-granted license to practice or work in their occupation
(Kleiner and Krueger 2008; Thornton and Timmons, 2013) and over 800 occupations are licensed
by at least one state (Kleiner 2000). While licensing is meant to protect consumers and ensure
safety by certifying provider quality, it also may create rents for incumbent members of the
occupation.
One mechanism through which licensing could restrict supply is by impeding geographic
mobility. Since licensing and certification is primarily at the state level, workers typically must
obtain separate licenses for each state in which they work, even if their jobs are identical. In
addition, workers typically must obtain a new license whenever they move to another state. Such a
barrier to mobility may prevent workers from seeking jobs across state lines, misallocating
workers geographically and depressing employment and labor force participation. Moreover,
licensed professionals may be less likely to move to areas of high demand. The Department of
Treasury Office of Economic Policy, the Council of Economic Advisers, and the Department of
Labor recently released a report detailing the best practices of occupational licensing (U.S.
Department of the Treasury Office of Economic Policy, Council of Economic Advisers, and the
Department of Labor, 2015). The report acknowledges that while licensing improves service
quality, it can create economic inefficiencies by restricting worker mobility, reducing employment
opportunities for excluded workers, and increasing costs to consumers. The report suggests that
states should try to harmonize requirements and recognize licenses from other states.
In this paper, we examine the impact of such a policty on the labor market for nurses,
exploiting a unique policy change that made it substantially easier for nurses to work and, to a
lesser extent, move across state lines. Nursing is an important occupation to focus on, as the
availability of nurses is important for community health, hospital care, and disaster relief.
Furthermore, an already acute nursing shortage is expected to increase over the next decade, as
more nurses retire and the aging population increases demand for health care services (Buerhaus,
Staiger, Auerbach, 2009). Insurance expansions embodied in the Affordable Care Act may only
exacerbate this shortage. Removing licensing barriers is one mechanism to better utilize the
existing supply of trained nurses. The ability for technology to improve health care delivery is also
hampered by cross-state licensing barriers for health care workers, which makes telemedicine
2
difficult legally (Sulentic 1991) as health providers must be licensed in the states in which their
patients reside.
Surprisingly, compelling evidence on the impact of licensing on the geographic scope of
labor markets is thin. Several studies, dating back a half-century, document a cross-sectional
correlation between licensing restrictions and interstate mobility of professionals (Holen, 1965;
Pashigian, 1979; Conrad and Dolan,1980; Kleiner, Gay, and Greene, 1982). A challenge with this
cross-sectional analysis is that licensure practices may correlate with other unobserved state-level
attributes that influence migration. Peterson, Pandya, LeBang (2014) address this problem by
exploiting changes in residency training requirements for immigrant physicians within states over
time, finding that states that impose more stringent requirements receive fewer immigrant
physicians. We add to this literature by examining a recent policy change, the Nurse Licensure
Compact (NLC), with a compelling research design that lets us control for several sources of bias
that may confound previous estimates. This study is the first to provide direct evidence on the
likely effects of nationalizing licensure for a large and important occupation.
The NLC was introduced to reduce licensing burdens by permitting registered nurses
living in member states to practice across state lines. It also made licensure easier to obtain for
nurses moving between member states. Twenty-five states have implemented the NLC since its
inception in 2000 and another six states currently have NLC legislation pending. We exploit the
staggered adoption of the NLC across states and over time to examine whether a reduction in
licensure-induced barriers is associated with a greater labor force participation and hours worked,
greater likelihood of cross-state commuting, and longer travel time to work among nurses. We
estimate difference-in-differences models, comparing nurses in states adopting the NLC to those
in states that do not. While this controls for time-invariant characteristics of states that may
correlate with both labor market outcomes and licensure laws, state-specific time-varying factors
may still bias estimates of the policy. A unique feature of our setting is that we are able to use
non-nurse health workers (who are not affected by the NLC) to construct triple difference models
to control for any health care labor market changes that may happen to correlate with NLC
adoption. We find that this feature is important, as results from the triple difference models are
different than those from the basic difference-in-differences approach for several outcomes,
suggesting a time-varying source of bias in the latter. Since many workers may be unaffected by
the Compact since they do not live near another Compact state, we also implement a similar
3
research design focused on residents of counties that border other states. Even within NLC states,
some counties share a border with another NLC state, while others do not.
Using data on over 1.5 million nurses and other health care workers from the 1990 and
2000 Census and the 2006-2012 American Community Surveys, we find no effect of NLC
adoption on a variety of labor market outcomes of nurses such as labor force particpation,
employment levels, hours worked, earnings, and likelihood of working across state lines. This null
effect persists even when focusing on those workers most likely to be affected by the NLC. That is,
we estimate the treatment effect of living in a border county in a Compact state that also borders
another Compact state and find no effect on the same labor market outcomes. We do find positive
effects of NLC adoption on travel time to workfor nurses living in MSAs, but discount this finding
as we do not see a similar increase those living in border counties. We supplement our main
analysis with data from the Current Population Survey to test if there are systematic pre-trends in
workforce characteristics or labor supply outcomes before the introduction of the NLC. We find
little evidence to suggest that pre-trends may be biasing our difference-in-difference estimates nor
is there any evidence that NLC adoption is associated with greater labor supply.
The paper is organized as follows. We provide background on nurse licensing and the NLC
and review the literature on occupational regulation in Section 2. Next, our methods and data are
described in Section 3 and results are discussed in Section 4. Finally, Section 5 offers some
concluding remarks.
2 Background
A. Nurse Licensure and the Nurse Licensure Compact
In 1947, New York became the first state to require mandatory licenses for nurses.
Today, every state requires a nurse to obtain a license to practice within the state (Benefiel, 2011).
Obtaining a license typically requires passing a licensing examination and meeting requirements
that are set by each state individually. The exams for registered nurses and licensed practical
nurses differ from each other and although the exams may differ by state, there has been a trend
toward uniformity in recent years (Barnum, 1997). Besides an examination, there are monetary
costs associated with obtaining an initial license in a state. For example, in the state of California,
the examination registration fee is $200 plus the fee for verification of licensure ($60) plus the
application fee of $100. If a nurse is licensed in another state, he/she must pass the California exam
4
and pay all of the same application fees before obtaining a California nursing license.
The Nurse Licensure Compact (NLC) was first passed in 1999 by Utah and Arkansas, and
first implemented by Maryland, Texas, Utah, and Wisconsin in 2000. The compact allows a nurse
licensed in one NLC-member state to practice in other NLC states without obtaining a separate
license for the other state. Each state that is a member mutually recognizes other member states.
Since its introduction, 25 states have implemented the Nurse Licensure Compact and another six
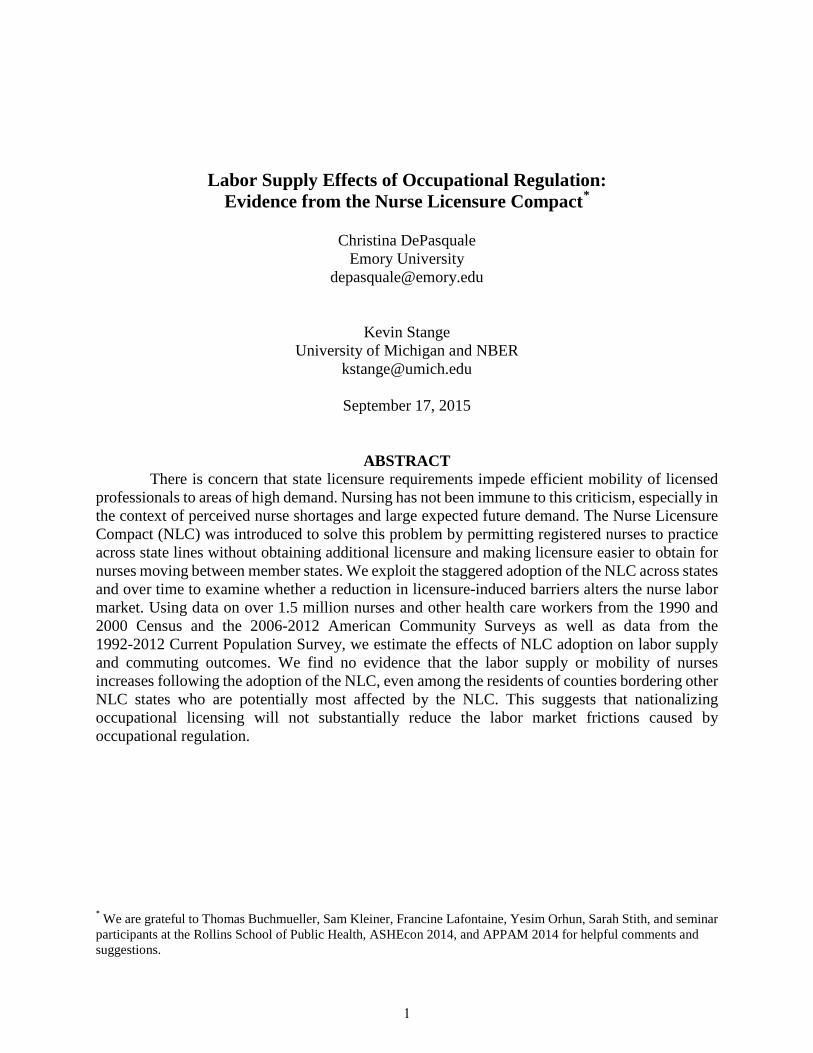
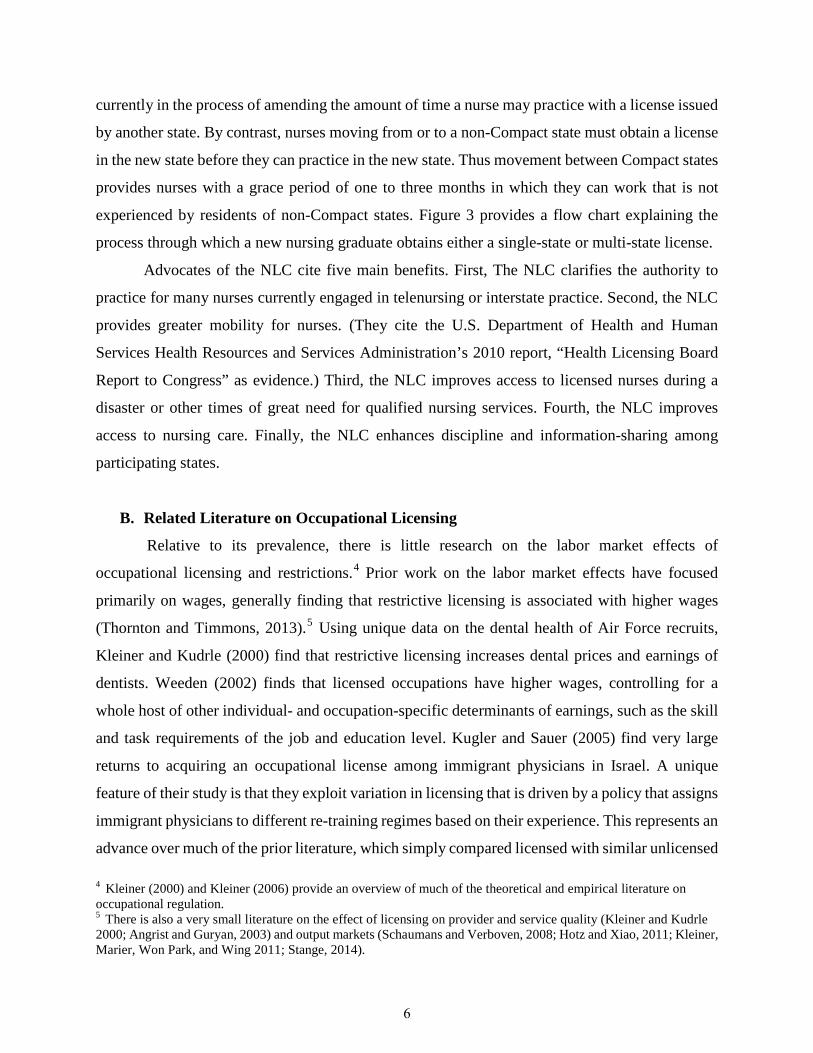
states currently have NLC legislation pending.1 Figure 1 depicts the number of states that are part
of the NLC over time. While about half of the states joined the Compact in its first two years of
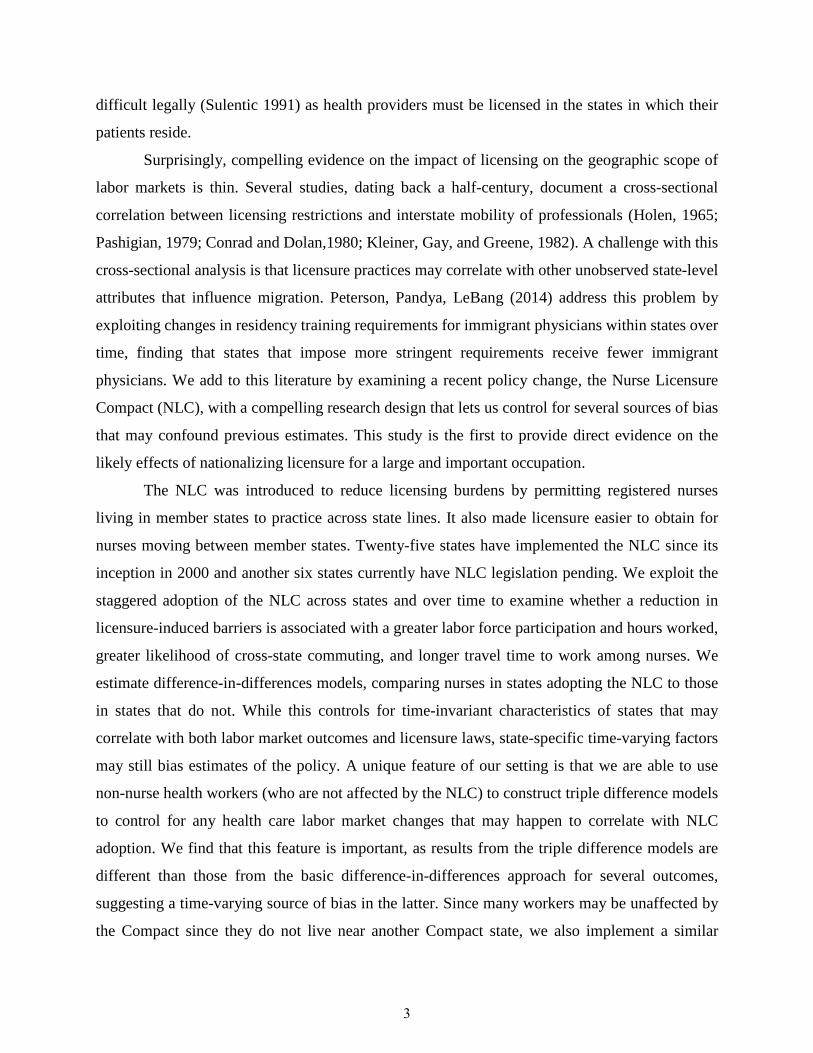
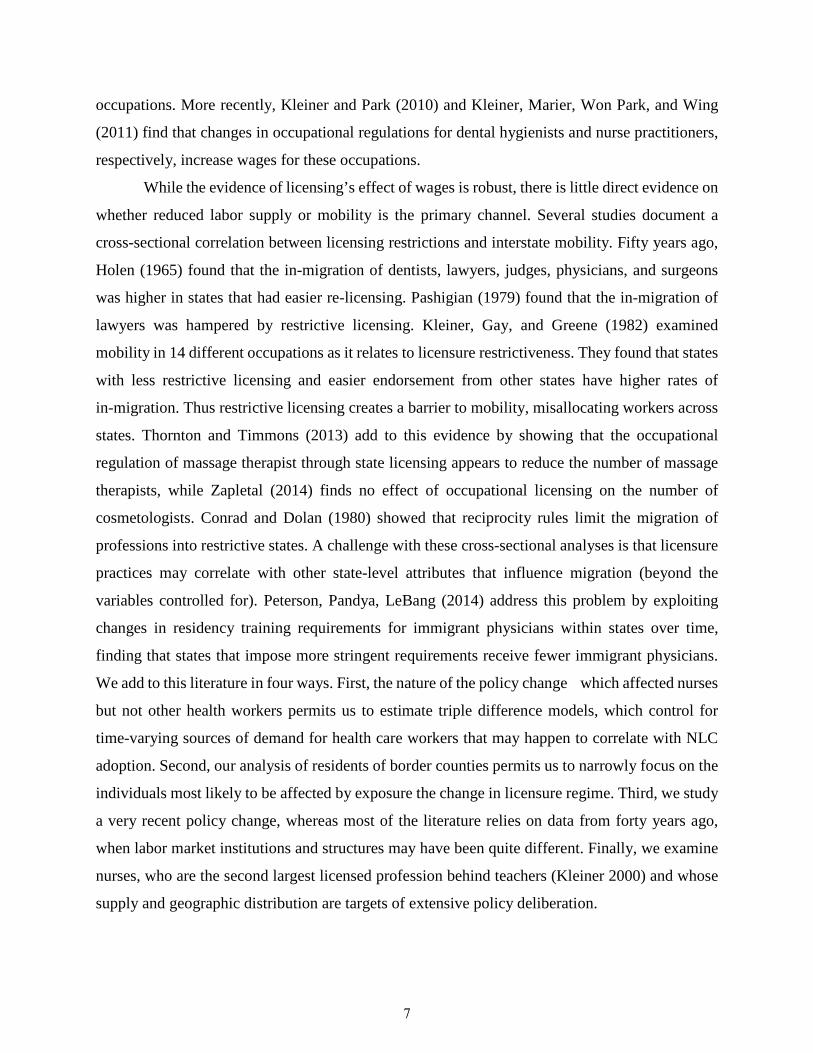
existence, an average of 1-2 states per year have continued to join the compact since. Figure 2
identifies the Compact states in 2000 (its first year) and 2012 (the last year of our analysis). It is
worth noting that each member state currently has another member state that is adjacent to it
except for Rhode Island (although Massachusetts currently has legislation pending).
In order for a state to join the NLC, they must meet four requirements. First, the bill
language drafted by state legislators must mirror that of the “NLC Model Legislation,” which is
provided by the National Council of State Boards of Nursing. The model legislation is attached as
Appendix B. Second, the state legislature must pass the legislation. Third, the State Board of
Nursing must implement the Compact.2 Finally, the state must pay $3000 per year to keep their
membership in the NLC active. The NLC applies to registered nurses (RNs), licensed practical
(LPNs) and licensed vocational nurses (LVNs) only.3 To be eligible for a multistate license, a
nurse’s primary state of residence must be a compact-member state. As long as a nurse declares a
compact state as a primary state of residence and the nurse is in good standing, the license
automatically becomes a multistate license and the nurse can practice physically or electronically
in other compact states. If a nurse works in a compact states but lives (i.e. has a primary state of
residence) in a non-compact state, he/she is not eligible for a multistate license.
If a compact-eligible nurse permanently relocates to another compact state, that is, the
nurse obtains a new driver’s license, votes, or files taxes in another state, the nurse must apply for
licensure by endorsement and declare the new state as his/her primary state of residence. This must
be completed within 30 to 90 days of moving (depending on the state), although some states are
1 Table A1 in the Appendix lists the date of implementation for each Compact state. 2 The takes approximately one year from the time the bill is passed. 3 Advanced Practical Registered Nurses (APRNs) do not fall under the NLC, but instead have their own separate APRN Compact that provides for a multistate license.
5
currently in the process of amending the amount of time a nurse may practice with a license issued
by another state. By contrast, nurses moving from or to a non-Compact state must obtain a license
in the new state before they can practice in the new state. Thus movement between Compact states
provides nurses with a grace period of one to three months in which they can work that is not
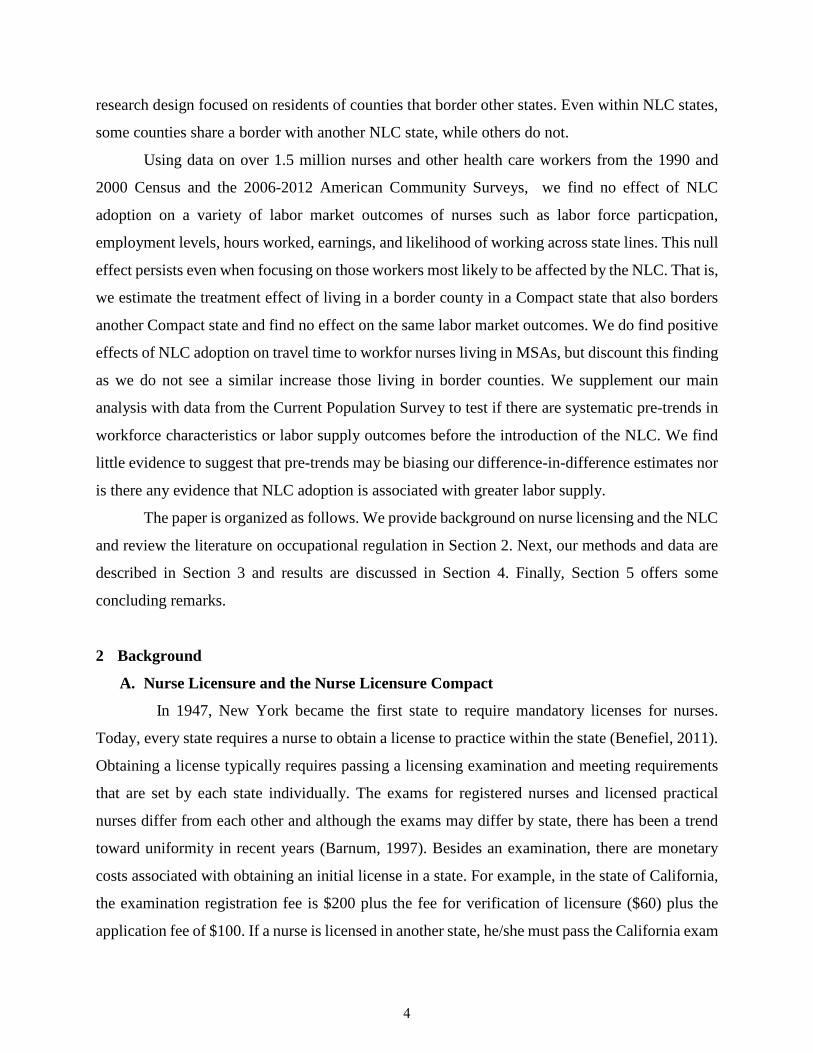
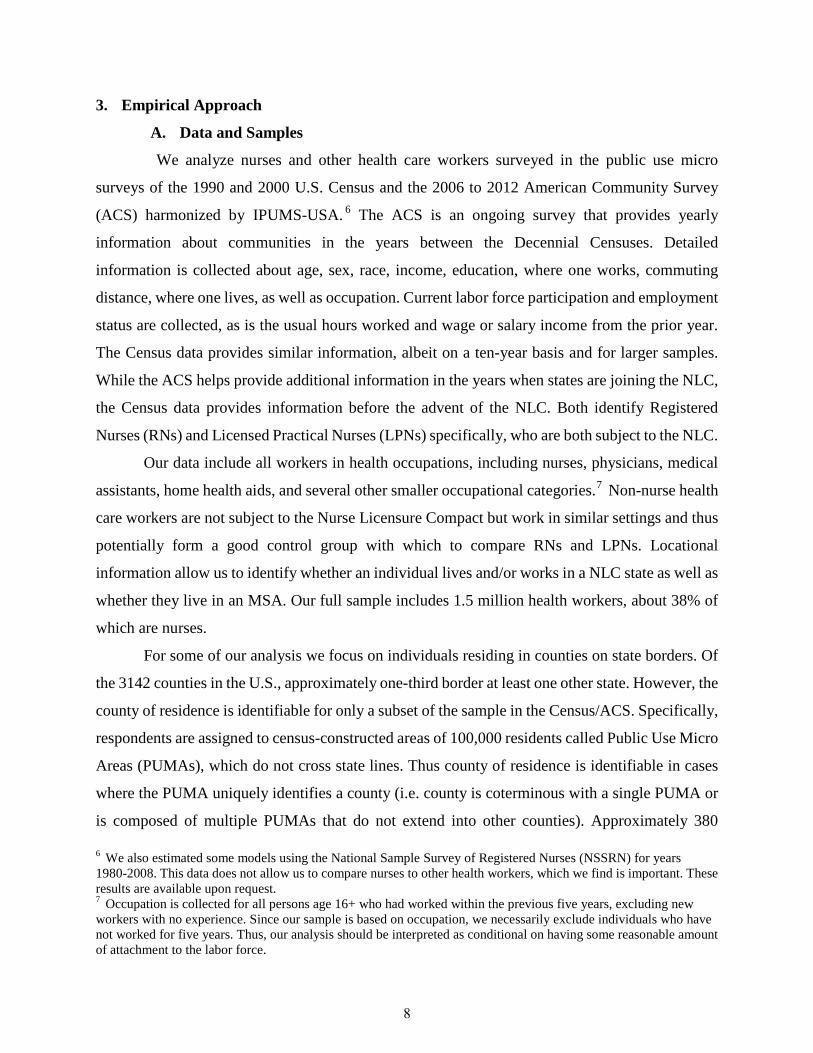
experienced by residents of non-Compact states. Figure 3 provides a flow chart explaining the
process through which a new nursing graduate obtains either a single-state or multi-state license.
Advocates of the NLC cite five main benefits. First, The NLC clarifies the authority to
practice for many nurses currently engaged in telenursing or interstate practice. Second, the NLC
provides greater mobility for nurses. (They cite the U.S. Department of Health and Human
Services Health Resources and Services Administration’s 2010 report, “Health Licensing Board
Report to Congress” as evidence.) Third, the NLC improves access to licensed nurses during a
disaster or other times of great need for qualified nursing services. Fourth, the NLC improves
access to nursing care. Finally, the NLC enhances discipline and information-sharing among
participating states.
B. Related Literature on Occupational Licensing
Relative to its prevalence, there is little research on the labor market effects of
occupational licensing and restrictions.4 Prior work on the labor market effects have focused
primarily on wages, generally finding that restrictive licensing is associated with higher wages
(Thornton and Timmons, 2013).5 Using unique data on the dental health of Air Force recruits,
Kleiner and Kudrle (2000) find that restrictive licensing increases dental prices and earnings of
dentists. Weeden (2002) finds that licensed occupations have higher wages, controlling for a
whole host of other individual- and occupation-specific determinants of earnings, such as the skill
and task requirements of the job and education level. Kugler and Sauer (2005) find very large
returns to acquiring an occupational license among immigrant physicians in Israel. A unique
feature of their study is that they exploit variation in licensing that is driven by a policy that assigns
immigrant physicians to different re-training regimes based on their experience. This represents an
advance over much of the prior literature, which simply compared licensed with similar unlicensed
4 Kleiner (2000) and Kleiner (2006) provide an overview of much of the theoretical and empirical literature on occupational regulation. 5 There is also a very small literature on the effect of licensing on provider and service quality (Kleiner and Kudrle 2000; Angrist and Guryan, 2003) and output markets (Schaumans and Verboven, 2008; Hotz and Xiao, 2011; Kleiner, Marier, Won Park, and Wing 2011; Stange, 2014).
6
occupations. More recently, Kleiner and Park (2010) and Kleiner, Marier, Won Park, and Wing
(2011) find that changes in occupational regulations for dental hygienists and nurse practitioners,
respectively, increase wages for these occupations.
While the evidence of licensing’s effect of wages is robust, there is little direct evidence on
whether reduced labor supply or mobility is the primary channel. Several studies document a
cross-sectional correlation between licensing restrictions and interstate mobility. Fifty years ago,
Holen (1965) found that the in-migration of dentists, lawyers, judges, physicians, and surgeons
was higher in states that had easier re-licensing. Pashigian (1979) found that the in-migration of
lawyers was hampered by restrictive licensing. Kleiner, Gay, and Greene (1982) examined
mobility in 14 different occupations as it relates to licensure restrictiveness. They found that states
with less restrictive licensing and easier endorsement from other states have higher rates of
in-migration. Thus restrictive licensing creates a barrier to mobility, misallocating workers across
states. Thornton and Timmons (2013) add to this evidence by showing that the occupational
regulation of massage therapist through state licensing appears to reduce the number of massage
therapists, while Zapletal (2014) finds no effect of occupational licensing on the number of
cosmetologists. Conrad and Dolan (1980) showed that reciprocity rules limit the migration of
professions into restrictive states. A challenge with these cross-sectional analyses is that licensure
practices may correlate with other state-level attributes that influence migration (beyond the
variables controlled for). Peterson, Pandya, LeBang (2014) address this problem by exploiting
changes in residency training requirements for immigrant physicians within states over time,
finding that states that impose more stringent requirements receive fewer immigrant physicians.
We add to this literature in four ways. First, the nature of the policy change which affected nurses
but not other health workers permits us to estimate triple difference models, which control for
time-varying sources of demand for health care workers that may happen to correlate with NLC
adoption. Second, our analysis of residents of border counties permits us to narrowly focus on the
individuals most likely to be affected by exposure the change in licensure regime. Third, we study
a very recent policy change, whereas most of the literature relies on data from forty years ago,
when labor market institutions and structures may have been quite different. Finally, we examine
nurses, who are the second largest licensed profession behind teachers (Kleiner 2000) and whose
supply and geographic distribution are targets of extensive policy deliberation.
7
3. Empirical Approach
A. Data and Samples
We analyze nurses and other health care workers surveyed in the public use micro
surveys of the 1990 and 2000 U.S. Census and the 2006 to 2012 American Community Survey
(ACS) harmonized by IPUMS-USA. 6 The ACS is an ongoing survey that provides yearly
information about communities in the years between the Decennial Censuses. Detailed
information is collected about age, sex, race, income, education, where one works, commuting
distance, where one lives, as well as occupation. Current labor force participation and employment
status are collected, as is the usual hours worked and wage or salary income from the prior year.
The Census data provides similar information, albeit on a ten-year basis and for larger samples.
While the ACS helps provide additional information in the years when states are joining the NLC,
the Census data provides information before the advent of the NLC. Both identify Registered
Nurses (RNs) and Licensed Practical Nurses (LPNs) specifically, who are both subject to the NLC.
Our data include all workers in health occupations, including nurses, physicians, medical
assistants, home health aids, and several other smaller occupational categories.7 Non-nurse health
care workers are not subject to the Nurse Licensure Compact but work in similar settings and thus
potentially form a good control group with which to compare RNs and LPNs. Locational
information allow us to identify whether an individual lives and/or works in a NLC state as well as
whether they live in an MSA. Our full sample includes 1.5 million health workers, about 38% of
which are nurses.
For some of our analysis we focus on individuals residing in counties on state borders. Of
the 3142 counties in the U.S., approximately one-third border at least one other state. However, the
county of residence is identifiable for only a subset of the sample in the Census/ACS. Specifically,
respondents are assigned to census-constructed areas of 100,000 residents called Public Use Micro
Areas (PUMAs), which do not cross state lines. Thus county of residence is identifiable in cases
where the PUMA uniquely identifies a county (i.e. county is coterminous with a single PUMA or
is composed of multiple PUMAs that do not extend into other counties). Approximately 380
6 We also estimated some models using the National Sample Survey of Registered Nurses (NSSRN) for years 1980-2008. This data does not allow us to compare nurses to other health workers, which we find is important. These results are available upon request. 7 Occupation is collected for all persons age 16+ who had worked within the previous five years, excluding new workers with no experience. Since our sample is based on occupation, we necessarily exclude individuals who have not worked for five years. Thus, our analysis should be interpreted as conditional on having some reasonable amount of attachment to the labor force.
8
counties are identifiable in our sample each year, accounting for 57% of the full sample. Across all
years, the sample includes 186 border counties in 44 states. Identifiable counties are necessarily
larger than average, so conclusions from our border county analysis may not necessarily apply to
residents of small or rural communities. Our border county sample represents 21% of the full
sample and includes 327,590 health workers, 37% of which are nurses.
Table 1 provides summary statistics for our full and border county samples of nurses and
all health workers across all years. Statistics are shown separately by whether the individual
currently lives in a compact state. Across all states and years, 3-4% of nurses and other health
workers commute across state lines to work, with an average travel time of 23 to 24 minutes
(among those that work). Cross-state commuting and travel time are both higher among workers
living in Compact states. Eighty-seven percent of the nurses in the sample are currently in the labor
force, with almost all of those who are labor force participants being currently employed, working
an average of 34 hours and earning $32,600 the previous year.8 Unsurprisingly, residents of
border counties are much more likely to commute across state lines to work, with the average
rising to 6% for all health workers and 7% for nurses. Labor force participation, earnings, and
travel time to work is also higher among these individuals, though hours worked are quite similar
to the full sample.
Interestingly, nurses are more mobile and have greater labor force participation rates when
the Compact is in place. This pattern is most striking for nurses in border counties: individuals
residing in and bordering a Compact state are about twice as likely to commute across state lines
than individuals that do not. However, many of these patterns are also observed for the broader
sample of health workers, even though two-thirds of them should be unaffected by the Compact.
Furthermore, there are some observed differences between nurses and other health workers
residing in Compact states or treated counties that could also relate to labor market outcomes.
Workers exposed to the NLC are slightly older, have smaller families, and are less likely to be
immigrants (naturalized citizens or not). These differences underscore the need to more carefully
control for observed and unobserved characteristcs of workers and locations that may correlate
with NLC exposure.
For supplemental analysis, we also analyze nurses and other health care workers included
8 Nurses have among the lowest unemployment rates of any occupation. The implied unemployment rate of 2% in our sample is consistent with official rates reported by the Bureau of Labor Statistics.
9

in the March Current Population Surveys from 1992 to 2012, harmonized by IPUMS-CPS. The
CPS is a monthly labor force survey of the U.S. population; the March supplement collects
detailed information about family characteristics, household composition, marital status,
education attainment, and prior year work experience, among others. A limitation of the CPS is
that occupation is only collected for individuals that are currently in the labor force and a small
share of people not in the labor force. Thus the CPS is not useful for examining labor force
participation. Furthermore, small sample sizes limit the inferences that can be drawn using CPS
data. However, the CPS is available annually, which permits us to test for pre-trends leading up to
the adoption of the NLC for some of our outcome variables and many worker characteristics.
Summary statistics for the CPS sample are presented in Appendix Table A2.
B Identification Strategy and Method
The raw summary statistics suggest that nurses have greater labor supply and are more
mobile when the NLC is in place. However, this raw correlation is unlikely to provide a good
estimate of the causal effect of the policy on labor supply or worker mobility. Time trends, state
characteristics, worker characteristics, or labor market shocks that happen to correlate with the
presence of the NLC are likely to bias estimates of its effect. To address these, we exploit the fact
that states adopted the NLC at different times and that it only pertained to nurses to construct
several difference-in-difference estimates of the effect of exposure to the Compact.
State-Level Analysis
Our first approach is to compare changes in outcomes of nurses between states that adopted
the NLC with those that did not during the same time period. We begin by estimating simple
difference-in-difference models on the sample of registered and licensed practical nurses using
regressions of the form:
isttsistxstist XCompactY εγγβββ +++++ 10= (1)
Our dependent variable, istY , is the outcome (indicators for labor force participation, employed,
usual hours worked, log of wage or salary income, works in different state and the the natural log
of the average commute time to work) for individual i residing in state s during year t. stCompact
is an indicator for whether state s is a compact state in year t. Aggregate time trends in the
10

prevalence of cross-state commuting and employment are accounted for by year fixed effects tγ .
State fixed effects control for average differences in commuting and employment prevalence
across areas that may be related to the adoption of the NLC. For instance, states that typically have
many nurses commuting across the border may have a greater incentive to join the compact. In
some specifications, we also control for time-varying individual istX characteristics, such as
worker demographics that may influence outcomes and also happen to correlate with adoption of
the compact. The coefficient of interest 1β is the change in outcomes following the adoption of
the NLC relative to the time pattern experienced by other states. Standard errors are clustered at the
state level, to address the possibility that observations within states are not independent.
The simple difference-in-differences specification assumes that outcomes for treatment
and control states would trend similarly in the absence of treatment. Labor market trends and
shocks could violate this assumption if, for instance, states adopt the NLC in anticipation of
growing demand for nurses or as a response to declining supply. The typical approach to ruling out
this form of violation is to look for evidence of differential trends between Compact and
non-Compact states before the former enact the NLC. Unfortunately we do not have enough high
frequency data to evaluate pre-trends in the Census/ACS data. However, several features of the
NLC naturally facilitate variations on the basic specification to probe the validity of this main
identifying assumption. Most importantly, we exploit the fact that only nurses (registered and
licensed vocational/practical) are affected by the compact while other health professionals
(physicians, medical assistants, etc.) are not to construct a triple difference estimator. We first
estimated (1) on the sample of non-nurse health workers and test whether there is any “effect” on
these workers when there should not be. We then explicitly use these workers as a control group,
and estimate the following model of the form:
iststiststist NurseCompactNurseCompactY *= 3210 ββββ +++
isttsistx X εγγβ ++++ (2)
The coefficient on stCompact captures any change in commuting patterns among non-nurse
health care workers that are correlated with NLC adoption. The coefficient on the interaction term
istst NurseCompact * captures the differential impact on nurses and is our coefficient of interest.
11
This specification controls for any time-varying labor market shocks that similarly affect nurses
and other health care workers.
Border County Analysis
Since Compact states likely include many individuals that are minimally affected by the Compact
because they do not live close to another Compact state, our second approach focuses specifically
on residents of the 186 border counties identified in the data. For each county in each year, we
construct the variable ctTreatment which equals one if county c is in a Compact state and borders
at least one other compact state in year t. We then compare changes in outcomes of nurses between
border counties that experienced this treatment with those that did not during the same time period.
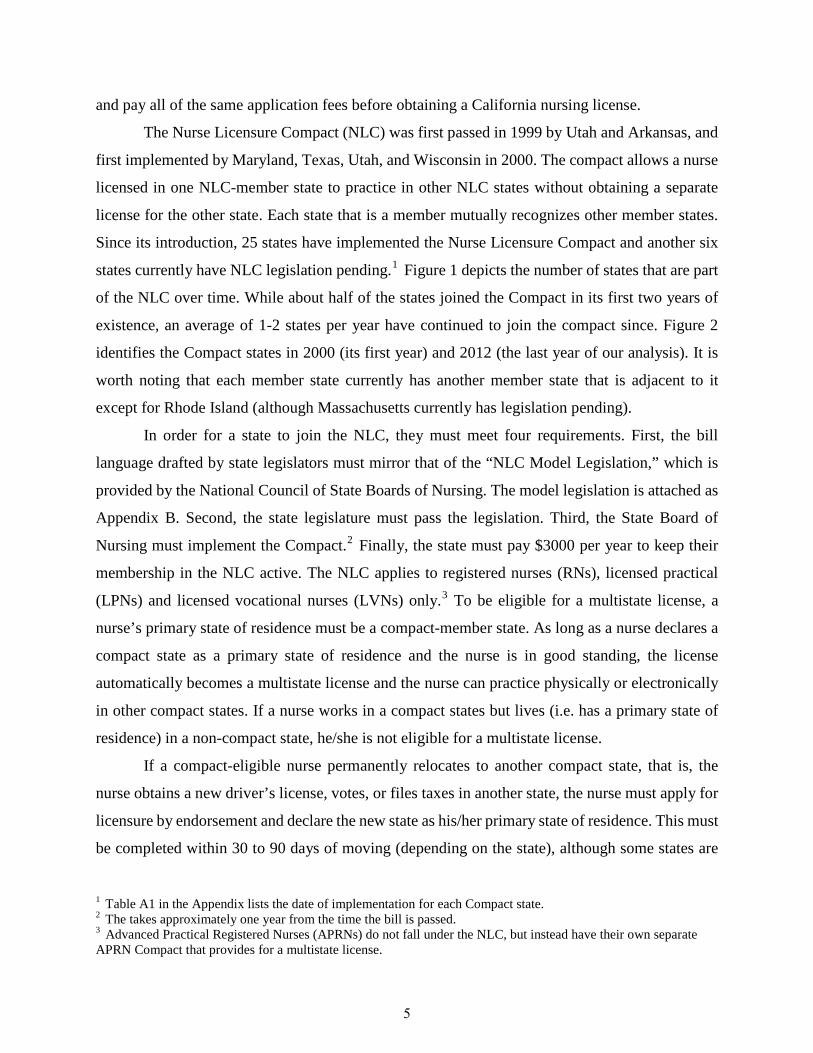
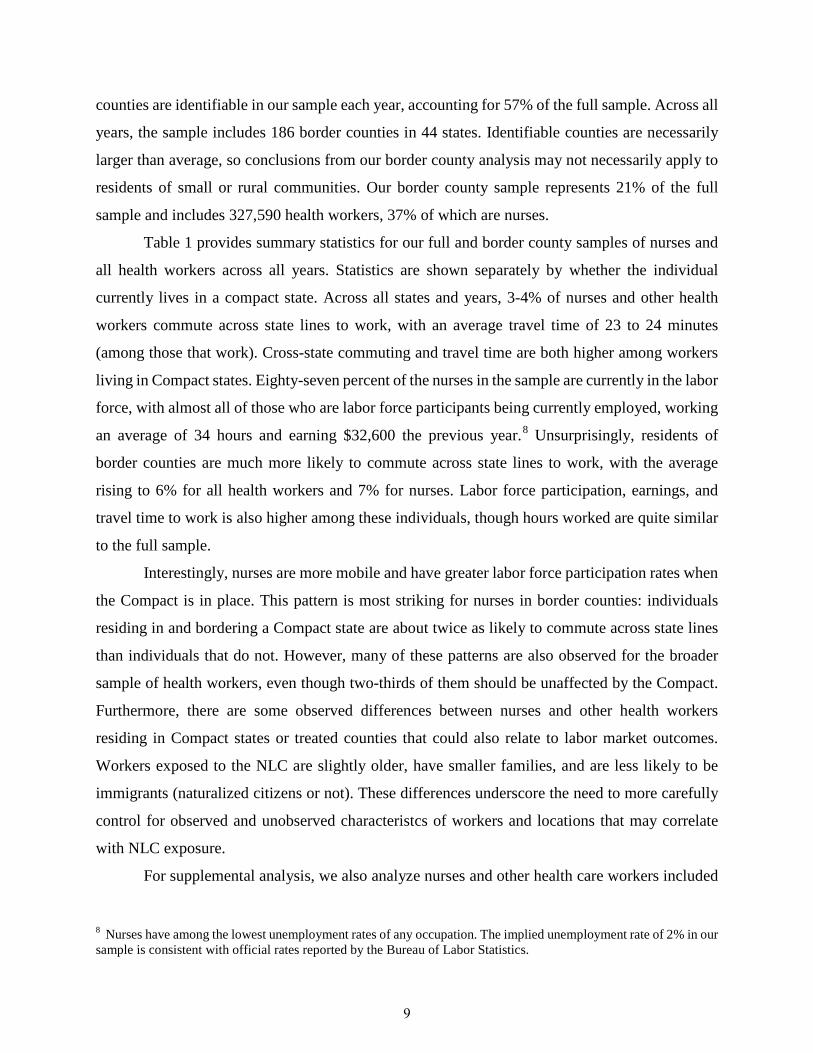
Figure 4 depicts this strategy graphically. Border counties are categorized by whether they are in a
Compact state and whether they border another Compact state in 2000 and 2012. Treatment
counties are marked in black – they are both in a state that is part of the Compact and border
another state that is also part of the Compact. The experience of these counties over time is
compared to all other border counties, including those in the same state that happen not to border
another Compact state (dark grey) and those in non-Compact states (light grey).
This approach is implemented by estimating regressions of the form:
icttcictxctict XTreatmentY εγγβββ +++++ 10= (3)
Aggregate time trends in the prevalence of cross-state commuting and employment among
residents of border counties are accounted for by year fixed effects tγ . County fixed effects
control for average differences in commuting and employment prevalence across counties that
may be related to the adoption of the NLC by the own or bordering state. Standard errors are
clustered at the state level, though we also estimate models clustering by county. In addition, we
estimate several alternative specifications to rule out various forms of bias. First, we include
state-specifc year fixed effects, exploiting variation across counties within the same state.
Counties that border states that are not part of the NLC serve as the counterfactuals for the counties
in the same state that happen to border a NLC state. For example, counties along South Carolina’s
border with North Carolina (a Compact state) are compared to those along its southern border with
Georgia (not a Compact state). We also restrict analysis only to border counties in NLC states or
just to the treated counties, thus letting the time trends be estimated from counties that are arguably
more similar to the treated counties.
12

Following our state-level analysis, we also estimate triple difference models using
non-nurse health workers as a control group to account for any changes in employment or
communting that happen to correlate with treatment:
icttcictxistctistctict XNurseTreatmentNurseTreatmentY εγγβββββ +++++++ *= 3210 (4)
The coefficient on the interaction term istit NurseTreatment * captures the differential impact of
exposure to the NLC on nurses and is our coefficient of interest. This specification controls for any
time-varying labor market shocks that similarly affect nurses and other health care workers in
border counties exposed to the NLC.
Supplemental Analysis with CPS
It is possible that there are systematic pre-trends in workforce characteristics and labor supply
outcomes before the introduction of the NLC. To test for such pre-trends in several of our outcome
variables we estimate event-study models using the Current Population Survey (CPS). The CPS
provides information on employment, labor force participation, migration of workers, as well as an
extensive variety of demographic characteristics of survey participants. Using data from
1992-2012, we estimate the following model for all registered nurses and licensed practical nurses:
isttsistxN
Nn nnistist XCompactY εγγβββ +++++∑ −=0= (5)
where istY , is the outcome for individual i residing in state s during year t, including hours worked
the week before the survey date, usual hours worked, weeks worked in the prior year, whether the
individual moved to a different state last year, and whether the individual moved for his or her job.nistCompact are a set of dummy variables indicating each observation’s timing relative to the
introduction of the compact. The omitted category is the year prior to the Compact’s
implementation. Xist is a vector of demographic controls (race, gender, age, age2, martial status,
education, household size, and number of children in household), sγ and tγ are state and time
fixed-effects, respectively, and standard errors are clustered at the state level.
We also estimate a modified specification on all health workers, using non-nurses as a
within-Compact control group for nurses. In other words, we estimate:
isttsistxN
Nn nistnist
N
Nn nnistist NurseXNurseCompactCompactY εγγββββ ++++++ ∑∑ −=−=
**= 0 (6)
where istnist NurseCompact * is a set of indicators for the interaction term and, again, indicate
13
relative timing to the introduction of the compact. tNurse γ* are nurse-year fixed effects, and
standard errors are clustered at the state level.
Finally, it is possible that demographic characteristics of the sample are systematically
changing over time. For instance, suppose education or family size changes in conjunction with
the introduction of compact. This could lead to changes in workforce trends that are incorrectly
attributed to the introduction of the compact. To examine how worker characteristics change in
relation to the start of the compact, we also estimate (5) using various control variables as
outcomes (but excluding control variables on the right hand side). As a parsimonious way of
examining changes in worker characteristics, we also construct an index of workers’ propensity to
participate in the labor force based on observed characteristics and estimate (5) with this index as
the outcome. This index was constructed by estimating (via a Probit model) the relationship
between labor force participation and our full set of control variables in the Census/ACS sample,
then predicting out of sample in the CPS.
Threats to Identification
Since occupational licensing regimes are not experimentally assigned, there are several
possible threats to identification that confound estimates of the effect of NLC participation. First, it
is possible that other policies are adopted simultaneously with the NLC that only impact nurse
labor markets (but not other health workers). We are not aware of any such policies, but cannot
rule this out entirely. We think this type of bias is unlikely to affect our border county analysis
since treatment depends on the actions of multiple states. Second, our approach takes residency
location decisions as exogenous. If the NLC also impacts where nurses choose to live, our
estimates may confound true causal effects with changes in the composition of nurses who work in
compact states. We explore the robustness of our results to including or excluding observed worker
attributes such as education, sex, age, nativity, and family structure and also specifically examine
trends in these characteristics leading up to and following states’ adoption of the Compact. Finally,
we take workers’ occupational classification as given, ignoring movements between nursing and
other occupations. If the NLC actually alters who enters or remains in nursing (vs. other
occupations), then this could create selection bias of unknown direction. Our labor supply results
should be interpreted as conditional on chosing to become or remain a nurse.
14
4. Results
A. State-level analysis
Tables 2 and 3 present our main results for the full sample and each of our labor supply and
commuting outcomes, respectively. All specifications include year fixed effects, state fixed
effects, and the full set of demographic and background controls. The first column for each
outcome presents difference-in-difference estimates on the sample of nurses, as described by
equation (1).9 Contrary to expectation, these difference-in-difference estimates imply that NLC
adoption is actually associated with lower levels of labor force participation, employment, and
labor supply among nurses (and lower wage income, though the estimate is insignificant). The
inclusion of demographic cotnrols has little impact on diff-in-diff point estimates (not reported),
suggesting that worker composition does not change dramatically when the NLC is adopted. We
only report estimates with controls included, as these are more precise.10 In Table 3 we find that
cross-state employment and commute time (among the employed) has minimal association with
the adoption of the Compact, though the likelihood of working in a different state that is also part
of the Compact does increase significantly following adoption.
These basic difference-in-difference estimates are biased if nurses are subject to other
policy or labor market shocks or trends that coincide with NLC adoption, such as states adopting
the NLC in response to a declining supply of nurses. In this case, states that do not join the NLC
would be an inappropriate control for the states that do. The typical approach to ruling out this
form of bias is to look for evidence of differential trends between Compact and non-Compact
states before the former enact the NLC. Unfortunately the Census/ACS data is not available at a
high enough frequency to evaluate pre-trends. However, the second column for each outcome
presents a placebo test, repeating the difference-in-difference specification but for the sample of
non-nurse health workers. Though subject to many of the same labor market and economic shocks
as nurses, these workers should be unaffected by the adoption of the NLC. In fact, many estimates
are qualitatively similar for nurses and non-nurses, suggesting that NLC adoption may be
9 The full set of estimates, including the controls, is reported in the Appendix Table A3. Many relationships are as expected: nurses that are more educated have higher labor force attachment and earnings; nurses with young children or larger families work fewer hours. 10 State and year fixed effects do have a material impact on estimates, suggesting that states adopting the NLC have different labor market characteristics than those that do not and that participation and labor supply are trending over time. Inclusion of demographic controls has little impact on diff-in-diff point estimates (but does improve precision), suggesting that worker composition does not change dramatically when the NLC is adopted.
15

coinciding with other trends. The third column for each outcome presents triple difference
estimates (equation 2), explicitly using non-nurse health workers as a control group that should be
unaffected by NLC adoption. In these specifications the parameter of interest is the the interaction
between living in a compact state and being a nurse. Estimates are reduced towards zero and tend
to be insignficant for almost all outcomes.
Triple difference point estimates suggest that labor force participation, employment, hours
worked, or wage income of nurses are unaffected (relative to non-nurse health workers) by the
adoption of the NLC. In addition, this result implies that the coefficient on equation (1) is biased
downward as those states that join the NLC have declining labor supply following NLC adoption
for all health workers, not just nurses. Estimates are sufficiantly precise that we can rule out small
positive effects on labor force participation (95% CI = -0.007 to 0.004), employment (-0.010 to
0.004), and hours worked of (-0.317 to 0.912). Estimated effects on cross-state employment are
positive but small and imprecise, though we do find nurses spend approximately 4% more time
commuting to work (significant at the 1% level) than other health workers when the NLC is
adopted.
Since workers in urban areas may have different commuting and labor supply patterns than
workers in rural areas, it is possible that NLC effects could vary with the size of the market . To
examine this, we estimate equations (1) and (2) but stratify by nurses and health workers living in
an MSA and those who are not assigned to an MSA. Table 4 presents the results. Estimates of
equation (1) suggest that workers in urban areas have different work force patterns than workers in
rural areas. Specifically, the coefficients on Compact for labor force participation, employment,
usual hours worked last year, and commuting time are negative and statistically significant for
those living in an MSA. Estimates for non-MSA residents tend to be smaller and insignificant..
Furthermore, when estimating whether a nurse works in a different state, the coefficient on
Compact for nurses living in an MSA is negative and statistically insignificant, implying no effect,
while it is positive and statistically significant for those not living in an MSA.
The estimates of equation (1) imply that NLC is associated with a reduction in labor supply
for workers in MSAs, but not for those outside of MSAs. However, once we expand our sample to
include all health-workers and estimate the triple difference specification in equation (2), most of
these patterns attenuate. The only statistically significant treatment effect (indicated by the
interaction term) is on comuting time for those living in MSAs. The coefficient indicates that the
16

introduction of the compact increased comuting time by approximately 3.7% (significant at the 1%
level) for nurses living in MSAs. Estimates are insignificant for every other outcome, for both
MSAs and non-MSAs, similar to the full (unstratified) sample. These results imply that the
estimates from equation (1) are biased downward and those states that join the NLC have declining
labor supply following NLC adoption for all health workers.
B. Border County Analysis
One limitation of the state-level analysis presented in Tables 2 and 3 is that the benefits of the NLC
likely acrue to only a modest share of nurses in each Compact state. Many may not have
opportunities to work in another Compact state, either because of prohibative distance or because
the nearest state is not part of the Compact. In order to focus on nurses most likely to be affected by
participation in the Compact, we estimate difference-in-difference and triple difference models
exclusively on residents of the 186 border counties identified in our data. Our main explanatory
variable is now an indicator for whether the indiviudal resides in a Compact state and borders at
least one other state that is also a Compact member. Thus variation in treatment arises both
because indivudals’ own state joins the NLC and bordering states do.
Tables 5 and 6 report border county estimates for labor supply and commuting outcomes,
respectively. Even for nurses for whom the NLC expands the geographic reach of their credential
the most, we see no increase in labor supply, measured by labor force participation, employment,
or hours worked. In fact, point estimates for these outcomes are all negative (and insignificant).
Triple difference models, using non-nurse health workers as a within-Compact control group,
yield similarly null results. Precision is such that for the triple difference estimates, we can rule out
small postive effects for labor force participation (95% CI = -0.015 to 0.007), employment (-0.020
to 0.003), hours worked (-0.440 to 0.497), and wage/salary income (-0.087 to 0.019). In Table 6,
estimated effects on cross-state employment and commute time are insignificant in the triple
difference model, though imprecision prevents us from ruling out modest postive effects.
Table 7 explores the robustness of the border county difference-in-differences estimates to
alternative specifications and controls. Column (1) repeats our base model, which includes county
and year fixed effects and full controls. In specification (2) we demonstrate that the inclusion of an
exensive vector of observed characteristics have virtually no impact on our point estimates. The
characteristics are quite predictive of each outcome (e.g. the R-squared improves from 0.01 to 0.13
17
when controls are included in the model for hours worked), but do not alter the estimated
relationship between treatment and outcomes. The implication is that NLC implementation is
uncorrelated with observed changes in nurse charactersitcs.
Our base specification uses the experience of all border counties to form the counterfactual
time path for counties exposed to the NLC treatment. The next three columns relax this feature and
use the experience of counties that are arguably more similar to treated counties to contruct
counterfactuals. In (3) we include state-specific year fixed effects, which implicitly compares
treated border counties to border counties in the same state that happen to not border another
Compact state. For example, counties along South Carolina’s border with North Carolina (a
Compact state) are compared to those along its southern border with Georgia (not a Compact
state). Similar comparisons can be made in Arizona, Arkansas, Colorado, Iowa, Maryland,
Mississippi, Nebraska, New Hampshire, Tennessee, and Texas. Specifications (4) and (5) restrict
analysis to only states that had ever joined the NLC and only to treated counties, respectively. In
these specifications time trends are estimated from counties that are part of states that have chosen
to join the NLC, so should experience a similar policy environment. With a few exceptions, the
(mostly null) results from the base model are quite robust to these alternative ways of contructing
the counterfactuals. We find no obvious evidence that exposure to the NLC expanded nurse labor
supply on either the extensive or intensive margin. The only consistent and significant result we
observe is that NLC exposure is associated with a greater likelihood of working in another
compact state (Panel F), though we discount this finding as it is not seen in the triple difference
model in Table 6. Lastly, our decision to cluster standard errors at the state (rather than county)
level has minimal impact on our inference (specification 6).
C. CPS Analysis
The key assumption of the difference-in-difference approaches above is that the treatment counties
and states would have followed similar trends as non-treatment counties/states in the absence of
exposure to the NLC. While inherently not testable, this assumption is more plausable in cases
where outcomes and sample characteristics are trending similarly for treated and non-treated
groups in the years leading up to NLC adoption. A weakness of the Diennial Census/ACS data is
that it is not available at a sufficiently high level of frequency to do such a test for pre-trends. For
this we turn to the CPS, which is available annually, albeit with smaller samples.
18

Figure 5 presents event-study estimates of NLC introduction on the characteristics of
nurses. As a parsimonious way of combining many covariates, we construct an index which
captures individuals’ propensity to participate in the labor force. This index was constructed by
estimating (via a Probit model) the relationship between labor force participation and our set of
control variables in the Census/ACS sample, then predicting out of sample in the CPS.11 As
measured by this index, there is no obvious change in nurse characteristics leading up to and
following the adoption of the NLC by states. Some individual characteristics do experience
modest changes (see Appendix Figure A1), but taken together these have no systematic pattern
with labor force participation. This echoes our earlier finding that controlling for observed
characteristics of nurses has minimal impact on estimates of the effect of the NLC.
Figures 6 and 7 present event-study estimates for several measures of labor supply.12
Figure 6 reports event-study estimates for the sample of just nurses. Neither hours or weeks
worked are systemically trending in Compact states relative to non-Compact states in the years
leading up to NLC adoption. There is a marginally significant 2-hour increase in hours worked in
the prior week immediately following NLC implementation, but this does not persist in subsequent
years. Figure 7 presents event-study etimates that use non-nurse health workers as a
within-Compact control, as described by equation (6). These estimates reveal similar patterns as in
Figure 6. There is little evidence suggesting pre-trends that may bias our difference-in-difference
estimates nor is there any evidence that NLC adoption is associated with increased labor supply.
5. Conclusion
The Nurse Licensure Compact was first introduced in 2000 and allows Registered
Nurses and Licensed Practical Nurses with licenses in one NLC-member state to practice in other
NLC states without obtaining a separate license. The Compact was created with the intention of
providing greater mobility for nurses, clarifying the authority to practice for nurses currently
engaged in telenursing or interstate practice, improving access to nursing care in general and
during a disaster or other times of great need, and enhancing information-sharing among member
11 Estimates from the first stage model are reported in Appendix Table A4. It is not possible to perform this procedure exclusively in the CPS sample, as it mostly excludes workers that are not in the labor force. 12 We do not report estimates for labor force participation, employment, or inter-state migration as these are uninformative because there is minimal variation due to the sampling frame (labor force participation and employment) or imprecision (inter-state migration).
19
NLC states While only four states joined the Compact in its first year, currently 25 states are now
members and a few more have pending legislation.
In this paper, we use data from the American Community Survey and the U.S. Census for
years 1990-2012 to estimate the effects of the Compact on labor force and commuting outcomes.
In comparison to other health workers who were not affected by the Compact, we find little
evidence that the labor supply or mobility of nurses increased following the adoption of the
Compact in the nurses’ home state. Specifically, we find no effect on labor force particpation,
employment levels, hours worked, wages or the probability of working across state lines. When
limiting our sample to nurses that live in border counties and examining the effect of living in a
Compact state and bordering another member state, we similarly find no effect on labor market
outcomes, including commuting times. We also use data from the annual Current Population
Survey to rule out the possibility that pre-trend differences in labor market outcomes or worker
characteristics between NLC and non-NLC states are biasing our estimates.
While this is the first study to empirically look at the effect of the Nurse Licensure
Compact, we recognize that this is only a first step towards fully identifying the consequences of
inter-state licensing. To get a fuller picture of the effect of the NLC, it is necessary to test whether
access to care increased following the adoption of the Compact in a patient’s home state, and how
this has affected the prevalence and scope of telenursing throughout the United States.
Furthermore, it is possible that the benefits of a cross-state system of occupational licensing will
only acrue if the licensing regime is truly national. Even with the Compact, nurses still face
licensing barriers when moving across states (even within the Compact) or working in
non-Compact states. Though the NLC provides the best evidence to date on the likely effects of a
nationalized licensing system, it still may not go far enough to generate measurable impacts on the
nurse labor market.
Our results imply the following for licensing and health care policy. First, while we do not
find that the multistate licensing provided by the NLC reduces labor market frictions caused by
occupational licensing, it is important to note that we necessarily focus on nurses. The results may
not generalize to other licensed professionals, such as lawyers, therapists, physicians and teachers.
Second, from a healthcare delivery perspective, our results indicate that the NLC is likely not to
increase the labor supply of nurses. We find no evidence that reducing licensing barriers will
increase the pool of workers from which hospitals draw or that it will bring nurses into the labor
20

force. As a result, this reduction in licensing barriers does not appear to be a solution to an
aggregate shortage of nurses.
21
References
Angrist, J. D., and Guryan, J. (2008). Does teacher testing raise teacher quality? Evidence from state certification requirements. Economics of Education Review, 27(5), 483-503.
Barnum, B. (1997). Licensure, Certification, and Accreditation, Online Journal of Issues in
Nursing, 2(3). Benefiel, D. (2011). The Story of Nurse Licensure, Nurse Educator, 36(1), 16-20. Bryson, A., and Kleiner, M. M. (2010). The Regulation of Occupations. British Journal of
Industrial Relations, 48(4), 670-675. Buerhaus, P.I., Auerbach, D.I., and Staiger, D.O. (2009). The recent surge in nurse employment:
causes and implications. Health Affairs, 28(4), w657-w668. Holen, A. S. (2012). Effects of Professional Licensing Arrangements on Interstate Labor Mobility
and Resource Allocation. Journal of Political Economy, 73(5), 492-498 Hotz, V. J., and Xiao, M. (2009). The Impact of Regulations on the Supply and Quality of Care in
Child Care Markets, Working paper, (pp. 1-52). Kleiner, M. M., (2000). Occupational Licensing. Journal of Economic Perspectives 14, 189-202. Kleiner, M.M., (2006) Licensing Occupations: Ensuring Quality or Restricting Competition?
Kalamazoo, Mich.: W. E. Upjohn Institute. Kleiner, M. M. (2011). Occupational Licensing. The Journal of Economic Perspectives, 14(4),
189-202. Kleiner, M. M., and Krueger, A. B. (2009). Analyzing the Extent and Influence of Occupational
Licensing on the Labor Market. NBER Working Paper (pp. 1-35). Kleiner, M. M., and Krueger, A. B. (2010). The Prevalence and Effects of Occupational Licensing.
British Journal of Industrial Relations, 48(4), 676-687. Kleiner, M. M., and Kudrle, R. T. (2000). Does Regulation Affect Economic Outcomes? The Case
of Dentistry. Journal of Law and Economics, 43(October), 547-582. Kleiner, M. M., Gay, R. S., and Greene, K. (1982b). Licensing, Migraton, and Earnings: Some
Empirical Insights. Review of Policy Research, 1(3), 510-522. Kleiner, M. M., Gay, R. S., and Greene, K. (1982a). Barriers to Labor Migration: The Case of
Occupational Licensing. Industrial Relations, 21(3), 383-391.
22
Kleiner, M. M., and Won Park, K. (2010). Battles Among Licensed Occupations: Analyzing
Government Regulations on Labor Market Outcomes for Dentists and Hygienists, Working paper, (pp. 1-40).
Kleiner, M. M., Marier, A., Won Park, K., and Wing, C. (2010). Relaxing Occupational Licensing
Requirements: Analyzing Wages and Prices for a Medical Service, Working paper. Kugler, A. D., and Sauer, R. M. (2005). Doctors without Borders? Relicensing Requirements and
Negative Selection in the Market for Physicians. Journal of Labor Economics, 23(3), 437-465.
Pashigan, B. P. (1979).Occupational Licensing and the Interstate Mobility of Professionals,.
Journal of Law and Economics, 22(1), 1-25. Peterson, B. D., Pandya, S. S., and Leblang, D. (2014). Doctors with borders: occupational
licensing as an implicit barrier to high skill migration. Public Choice, January. Schaumans, C., and Verboven, F. (2008). Entry and regulation: evidence from health care
professions. The Rand Journal of Economics, 39(4), 949-72. Sulentic, A. M. (1999). Crossing Borders?: The Licensure of Interstate. Journal of Legislation,
25(1), 1-37. Stange, K. (2014). How Does Provider Supply and Regulation Influence Health Care Markets?
Evidence from Nurse Practitioners and Physician Assistants. Journal of Health Economics, 33(2014), 1-27.
Thornton, R. J., and Timmons, E. J. (2013). Licensing One of the World s Oldest Professions?:
Massage. Journal of Law and Economics, 56(2), 371-388. U.S. Department of the Treasury Office of Economic Policy, Council of Economic Advisers, and
the Department of Labor. (2015). Occupation Licensing: A Framework for Policymakers. https://www.whitehouse.gov/sites/default/files/docs/licensing_report_final_nonembargo.pdf.
Weeden, K. A. (2002). Why Do Some Occupations Pay More than Others? Social Closure and
Earnings Inequality in the United States. American Journal of Sociology, 108(1), 55-101. Zapletal, M. (2014). The Effects of Occupational Licensing: Evidence from Detailed
Business-Level Data, Working paper, (pp. 1-54).
23
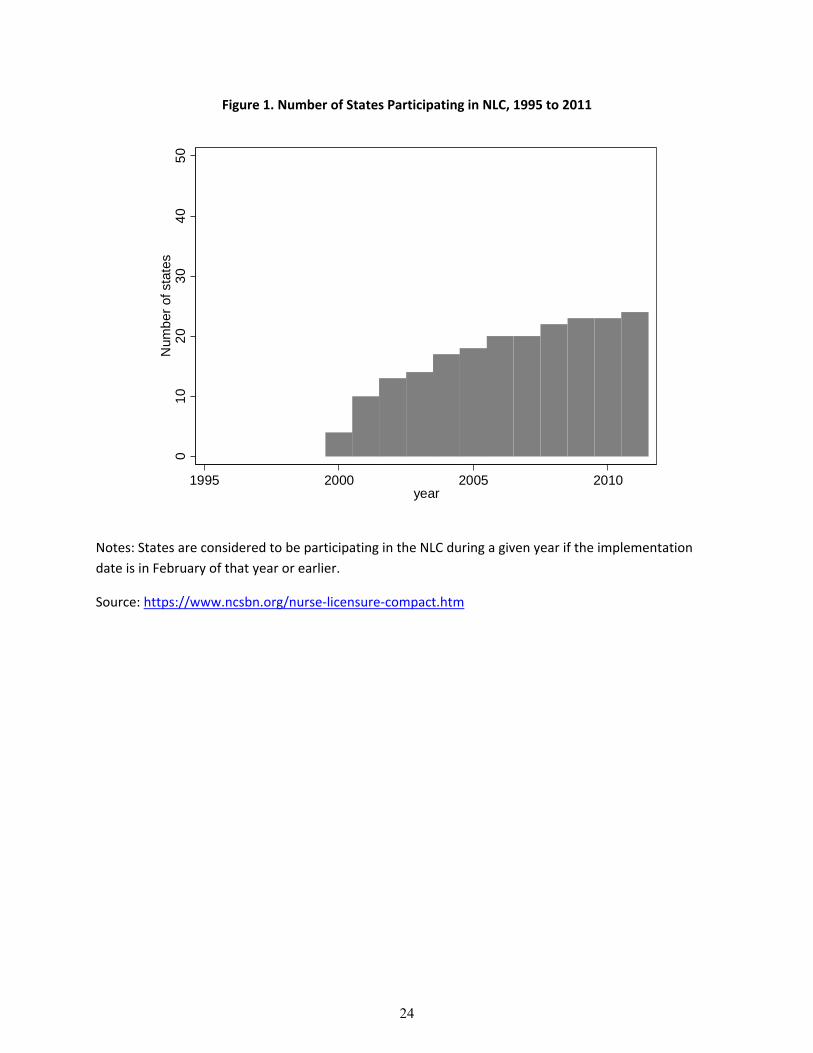
Figure 1. Number of States Participating in NLC, 1995 to 2011
Notes: States are considered to be participating in the NLC during a given year if the implementation
date is in February of that year or earlier.
Source: https://www.ncsbn.org/nurse‐licensure‐compact.htm
01
02
03
04
05
0N
umb
er o
f sta
tes
1995 2000 2005 2010year
24
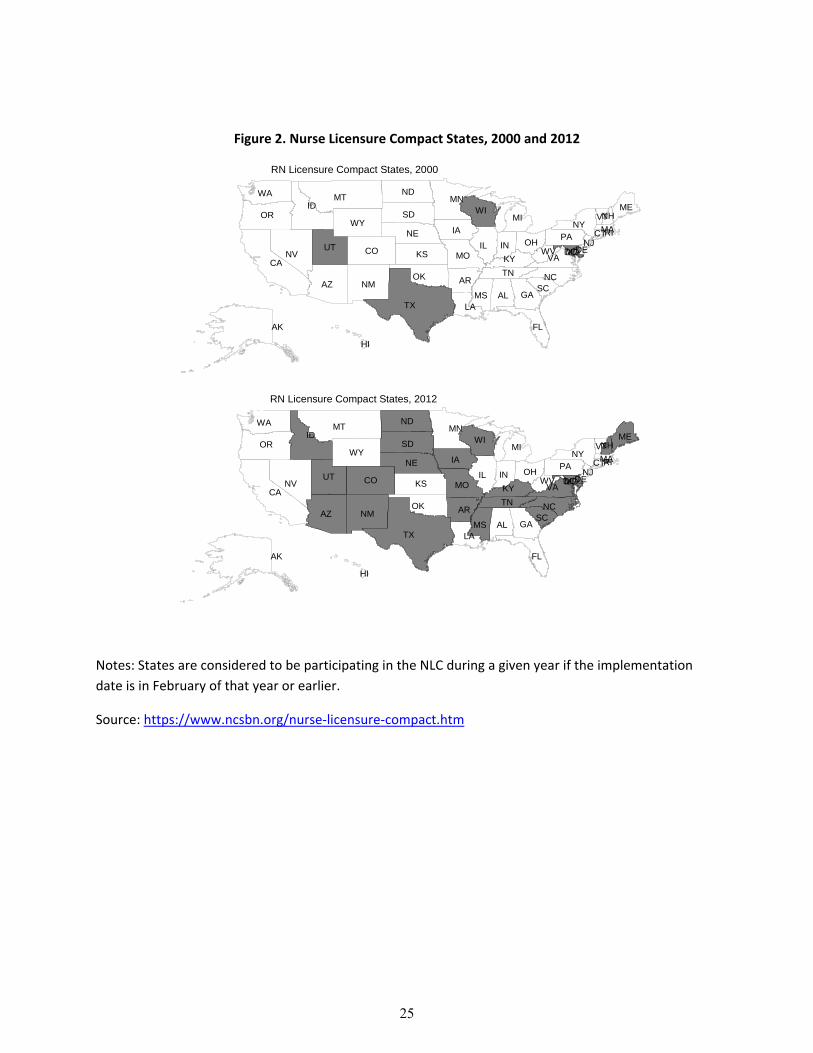
Figure 2. Nurse Licensure Compact States, 2000 and 2012
Notes: States are considered to be participating in the NLC during a given year if the implementation
date is in February of that year or earlier.
Source: https://www.ncsbn.org/nurse‐licensure‐compact.htm
AK
AL
ARAZ
CACO
CT
DCDE
FL
GA
HI
IA
ID
IL INKS KY
LA
MA
MD
MEMI
MN
MO
MS
MT
NC
ND
NE
NH
NJ
NM
NV
NY
OH
OK
OR
PA RI
SC
SD
TN
TX
UTVA
VT
WA
WI
WV
WY
RN Licensure Compact States, 2000
AK
AL
ARAZ
CACO
CT
DCDE
FL
GA
HI
IA
ID
IL INKS KY
LA
MA
MD
MEMI
MN
MO
MS
MT
NC
ND
NE
NH
NJ
NM
NV
NY
OH
OK
OR
PA RI
SC
SD
TN
TX
UTVA
VT
WA
WI
WV
WY
RN Licensure Compact States, 2012
25

Figure 3. Flow Chart for Obtaining Nurse License
Source: https://www.ncsbn.org/nurse‐licensure‐compact.htm
Is your primary/legal state of residence (PSOR) a compact state?(This is the state in which you hold a driver’s license, are registered to vote, and/or
file federal income tax)
Single-state license
Multi-state licenseApply for
licensure by examination in
any one state of choice.
Apply for licensure by examination in your primary state
of residence (PSOR)
Follow the NCLEX examination steps
Apply for licensure with one Board of
Nursing (BON)
Receive receipt of registration from
Pearson VUE
Register with Pearson VUE (see candidate bulletin)
Receive eligibility from Board of
Nursing
Receive an Authorization to Test (ATT) via
letter or email from Pearson VUE
Receive results from BON
Schedule an exam with Pearson VUE
via website or telephone
Arrive for exam –present photo ID
and ATT (see candidate bulletin)
Your new multi-state license grants privilege to practice in all NLC states contingent upon remaining a
resident of the issuing state.
Your new single-state license grants privilege to practice in only the state of issuance (other single-state licenses may be
acquired via licensure by endorsement)
YesNo
26

Figure 4. Border Counties Exposed to Compact
Not border, not Compact Border, not Compact Not border, Compact No bordering Compact
Border Counties in US, 2000
Not border, not Compact Border, not Compact Not border, Compact No bordering Compact Bordering Compact
Border Counties in US, 2012
27

Figure 5. Changes in Worker Characteristics Leading up to and Following NLC Adoption
Notes: Outcome is labor force participation as predicted with covariates from a two‐sample approach.
First, labor force participation is regressed on covariates using the full Census/ACS sample . Second,
model estimates are then used to predict labor force participation based on the same covariates, but in
the full CPS sample. Figure plots coefficients on indicators for time until or since NLC adoption. Model
includes state and year fixed effects. Dashed lines represent 95% confidence interval. Standard errors
clustered by state. Sample includes all nurses in the March CPS, 1992‐2012.
-.01
-.005
0
.005
.01
.015
-5+ -5 -4 -3 -2 -1 0 1 2 3 4 5 5+Year
Predicted Value In Labor Force
28
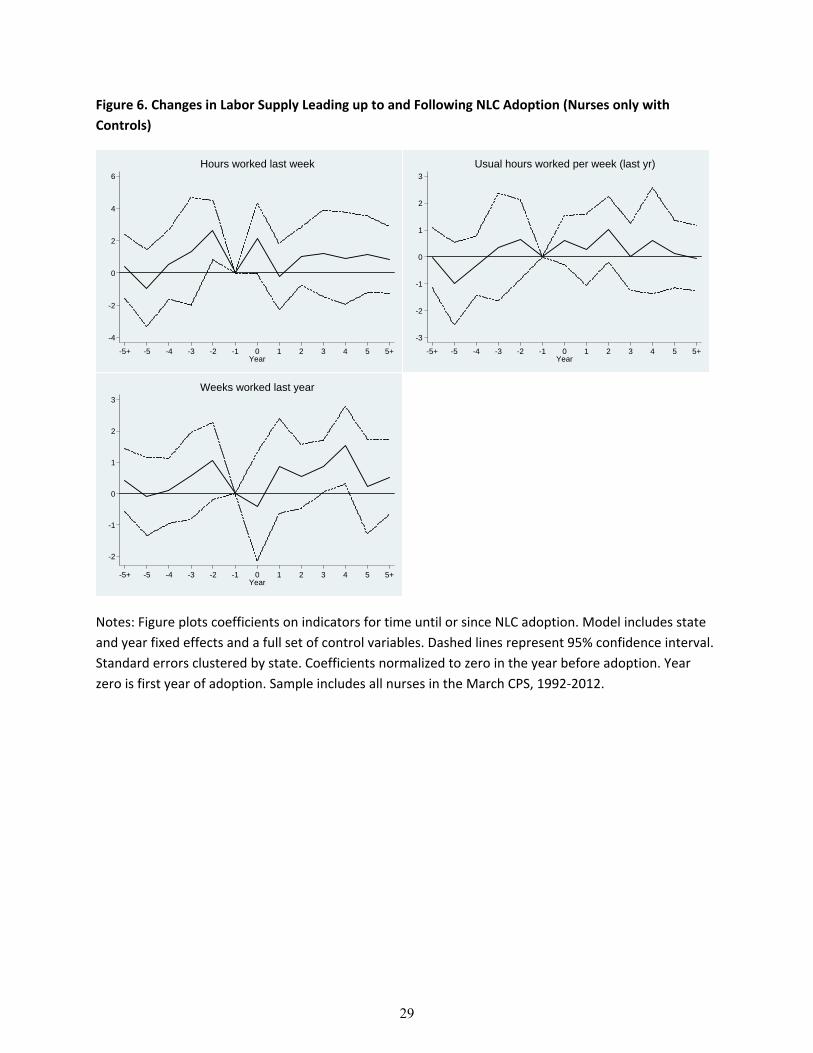
Figure 6. Changes in Labor Supply Leading up to and Following NLC Adoption (Nurses only with
Controls)
Notes: Figure plots coefficients on indicators for time until or since NLC adoption. Model includes state
and year fixed effects and a full set of control variables. Dashed lines represent 95% confidence interval.
Standard errors clustered by state. Coefficients normalized to zero in the year before adoption. Year
zero is first year of adoption. Sample includes all nurses in the March CPS, 1992‐2012.
-4
-2
0
2
4
6
-5+ -5 -4 -3 -2 -1 0 1 2 3 4 5 5+Year
Hours worked last week
-3
-2
-1
0
1
2
3
-5+ -5 -4 -3 -2 -1 0 1 2 3 4 5 5+Year
Usual hours worked per week (last yr)
-2
-1
0
1
2
3
-5+ -5 -4 -3 -2 -1 0 1 2 3 4 5 5+Year
Weeks worked last year
29
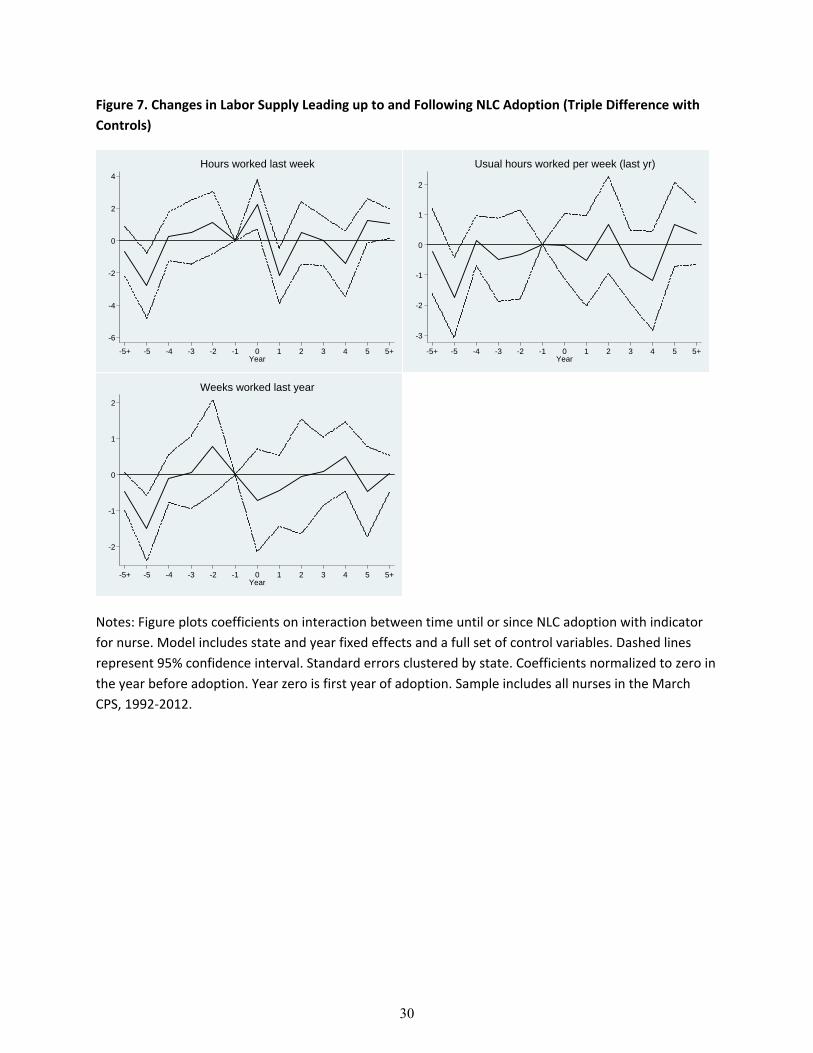
Figure 7. Changes in Labor Supply Leading up to and Following NLC Adoption (Triple Difference with
Controls)
Notes: Figure plots coefficients on interaction between time until or since NLC adoption with indicator
for nurse. Model includes state and year fixed effects and a full set of control variables. Dashed lines
represent 95% confidence interval. Standard errors clustered by state. Coefficients normalized to zero in
the year before adoption. Year zero is first year of adoption. Sample includes all nurses in the March
CPS, 1992‐2012.
-6
-4
-2
0
2
4
-5+ -5 -4 -3 -2 -1 0 1 2 3 4 5 5+Year
Hours worked last week
-3
-2
-1
0
1
2
-5+ -5 -4 -3 -2 -1 0 1 2 3 4 5 5+Year
Usual hours worked per week (last yr)
-2
-1
0
1
2
-5+ -5 -4 -3 -2 -1 0 1 2 3 4 5 5+Year
Weeks worked last year
30

Table 1. Summary Statistics, Census and ACS Sample
Border counties only Border counties only
Full sample
Currently part of
Compact
Not currently in
CompactFull
sample
State and border
compact
Not state and border
compact Full sample
Currently part of
Compact
Not currently in
CompactFull
sample
State and border
compact
Not state and border
compact
In labor force 0.87 0.88 0.87 0.88 0.89 0.87 0.86 0.87 0.86 0.87 0.89 0.87Employed 0.86 0.86 0.85 0.86 0.87 0.86 0.84 0.84 0.84 0.84 0.86 0.84
Work in different state 0.03 0.04 0.03 0.07 0.14 0.06 0.03 0.04 0.03 0.06 0.12 0.06Travel time to work 24.13 24.79 23.97 25.12 25.60 25.09 23.37 23.37 23.37 25.47 24.61 25.53
Usual hours worked (last year) 33.83 34.35 33.70 33.71 34.54 33.64 34.42 34.30 34.45 34.61 34.72 34.60Wage/salary income, $1999 (last year) 32,611 32,962 32,527 35,568 35,791 35,551 31,992 30,442 32,366 34,930 33,425 35,038Registered nurse 0.79 0.79 0.79 0.83 0.83 0.83 0.30 0.29 0.30 0.30 0.33 0.30LPN 0.21 0.21 0.21 0.17 0.17 0.17 0.08 0.08 0.08 0.06 0.07 0.06Male 0.07 0.08 0.07 0.07 0.09 0.07 0.19 0.17 0.20 0.20 0.17 0.21White 0.82 0.83 0.82 0.73 0.71 0.73 0.79 0.79 0.78 0.69 0.67 0.69Black 0.10 0.11 0.10 0.16 0.21 0.16 0.12 0.13 0.11 0.19 0.23 0.19American Indian 0.01 0.01 0.01 0.00 0.01 0.00 0.01 0.01 0.01 0.00 0.01 0.00Asian 0.05 0.04 0.06 0.08 0.05 0.08 0.05 0.03 0.06 0.07 0.05 0.07Other 0.01 0.01 0.01 0.01 0.01 0.01 0.02 0.02 0.02 0.03 0.02 0.03Less than high school 0.01 0.00 0.01 0.01 0.00 0.01 0.04 0.04 0.04 0.04 0.03 0.04High school 0.09 0.09 0.10 0.09 0.08 0.09 0.21 0.22 0.21 0.20 0.19 0.21Some college 0.48 0.49 0.48 0.42 0.41 0.42 0.36 0.38 0.36 0.32 0.35 0.32College graduate 0.31 0.33 0.30 0.35 0.39 0.35 0.21 0.21 0.21 0.23 0.26 0.23Graduate degree 0.11 0.09 0.11 0.12 0.12 0.12 0.18 0.15 0.18 0.20 0.18 0.21Age 44.62 45.55 44.39 44.58 45.83 44.48 42.30 42.83 42.17 42.36 43.28 42.30Single household 0.18 0.18 0.18 0.19 0.20 0.19 0.19 0.20 0.19 0.20 0.21 0.20Family size 2.88 2.80 2.90 2.94 2.79 2.95 2.90 2.84 2.91 2.95 2.82 2.96Naturalized citizen 0.07 0.05 0.07 0.11 0.10 0.11 0.07 0.05 0.08 0.12 0.10 0.12Not citizen 0.04 0.03 0.04 0.05 0.05 0.11 0.04 0.03 0.05 0.07 0.06 0.07
Observations 582,578 112,387 470,191 120,113 8,596 111,517 1,547,920 300,880 1,247,040 327,590 21,883 305,707Number of states 51 24 51 44 16 43 51 24 51 44 16 43Number of counties All All All 186 37 183 All All All 186 37 183
All health workersAll counties
Nurses onlyAll counties
Notes: All counties sample includes all nurses or health professionals in the 1990 and 2000 Census (5% sample) and 2006-2012 ACS. Border county sample includes those in the 186 counties on state borders that are identified in the Census and ACS. Compact classification refers to the status during the year of the observation; observations for states or counties that eventually become treated are in included in the "Not currently in Compact" and "Not state and border Compact" columns.
31

Table 2. Main Labor Supply Results for Full Sample
(1) (2) (3) (4) (5) (6) (7) (8) (9) (10) (11) (12)
Compact state -0.0106*** -0.0062* -0.0071** -0.0113*** -0.0053 -0.0064 -0.4139** -0.2128 -0.3956 -0.0089 0.0013 -0.0097
(0.0037) (0.0036) (0.0032) (0.0041) (0.0049) (0.0046) (0.1549) (0.1991) (0.2429) (0.0137) (0.0138) (0.0157)
Nurse 0.0219*** 0.0314*** 0.9564*** 0.3425***
(0.0015) (0.0019) (0.0988) (0.0139)
Compact state X Nurse -0.0014 -0.0021 0.2976 0.0189
(0.0027) (0.0039) (0.3058) (0.0290)
Observations 582,543 965,245 1,547,788 582,543 965,245 1,547,788 582,543 965,245 1,547,788 528,021 830,675 1,358,696
R-squared 0.1406 0.0735 0.0933 0.1267 0.0687 0.0852 0.1275 0.1286 0.1231 0.1597 0.3345 0.3018
Sample NursesNon-nurse
health All health NursesNon-nurse
health All health NursesNon-nurse
health All health NursesNon-nurse
health All health
Outcome mean 0.890 0.875 0.880 0.872 0.840 0.852 34.42 34.50 34.47 10.32 9.89 10.05
In labor force(current)
Employed(current)
Usual hours worked(last year)
Log(Wage income)(last year)
Notes: All specifications include state fixed effects, year fixed effects, and full controls. Controls include indicators for LPN, male, race category, education category, a quadradic in age, indicators for single family household, number of children, and no children under the age of 5, family size (linear), naturalized citizen, and non-citizen. Standard errors clusted by state in parentheses. Sample includes all nurses or health professionals in the 1990 and 2000 Census (5% sample) and 2006-2012 ACS. *** p<0.01, ** p<0.05, * p<0.1
32
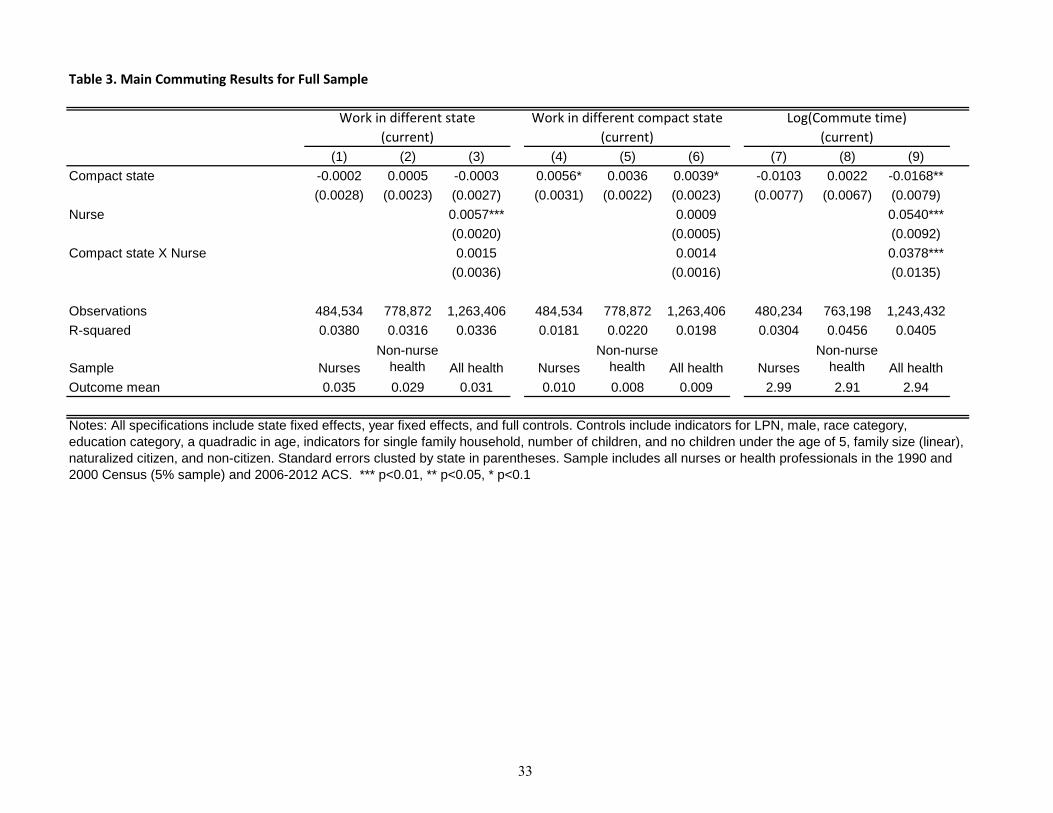
Table 3. Main Commuting Results for Full Sample
(1) (2) (3) (4) (5) (6) (7) (8) (9)
Compact state -0.0002 0.0005 -0.0003 0.0056* 0.0036 0.0039* -0.0103 0.0022 -0.0168**
(0.0028) (0.0023) (0.0027) (0.0031) (0.0022) (0.0023) (0.0077) (0.0067) (0.0079)
Nurse 0.0057*** 0.0009 0.0540***
(0.0020) (0.0005) (0.0092)
Compact state X Nurse 0.0015 0.0014 0.0378***
(0.0036) (0.0016) (0.0135)
Observations 484,534 778,872 1,263,406 484,534 778,872 1,263,406 480,234 763,198 1,243,432
R-squared 0.0380 0.0316 0.0336 0.0181 0.0220 0.0198 0.0304 0.0456 0.0405
Sample NursesNon-nurse
health All health NursesNon-nurse
health All health NursesNon-nurse
health All health
Outcome mean 0.035 0.029 0.031 0.010 0.008 0.009 2.99 2.91 2.94
Notes: All specifications include state fixed effects, year fixed effects, and full controls. Controls include indicators for LPN, male, race category, education category, a quadradic in age, indicators for single family household, number of children, and no children under the age of 5, family size (linear), naturalized citizen, and non-citizen. Standard errors clusted by state in parentheses. Sample includes all nurses or health professionals in the 1990 and 2000 Census (5% sample) and 2006-2012 ACS. *** p<0.01, ** p<0.05, * p<0.1
Work in different state(current)
Work in different compact state (current)
Log(Commute time)(current)
33

Table 4. Main Labor Supply Results for Full Sample, by MSA
(1) (2) (3) (4) (5) (6) (7) (8) (9) (10) (11) (12) (13) (14)
Panel A. MSA
Compact state -0.0101** -0.0112*** -0.0127*** -0.0110** -0.4686** -0.5502** -0.0064 -0.0133 -0.0028 -0.0003 0.0029 0.0029 -0.0168* -0.0248**
(0.0040) (0.0036) (0.0044) (0.0045) (0.1768) (0.2619) (0.0155) (0.0163) (0.0043) (0.0037) (0.0030) (0.0024) (0.0089) (0.0102)
Nurse 0.0221*** 0.0323*** 1.0288*** 0.3610*** 0.0048* -0.0000 0.0384***
(0.0014) (0.0018) (0.0948) (0.0162) (0.0024) (0.0005) (0.0102)
Compact state X Nurse 0.0010 -0.0003 0.3946 0.0243 -0.0018 -0.0006 0.0374**
(0.0037) (0.0049) (0.3756) (0.0345) (0.0037) (0.0014) (0.0150)
Observations 378,229 1,034,563 378,229 1,034,563 378,229 1,034,563 343,505 909,059 314,830 844,958 314,830 844,958 312,013 831,428
Sample Nurses All health Nurses All health Nurses All health Nurses All health Nurses All health Nurses All health Nurses All health
Outcome mean 0.892 0.881 0.875 0.852 34.570 34.465 10.363 10.064 0.029 0.026 0.005 0.005 3.012 2.980
Panel B. Non-MSA
Compact state -0.0084* 0.0035 -0.0070 0.0039 -0.2741 -0.2781 -0.0249 -0.0284 0.0065* 0.0030 0.0045 0.0019 -0.0284** -0.0256*
(0.0046) (0.0044) (0.0049) (0.0068) (0.2336) (0.2693) (0.0165) (0.0205) (0.0038) (0.0040) (0.0041) (0.0028) (0.0138) (0.0142)
Nurse 0.0220*** 0.0294*** 0.8083*** 0.3029*** 0.0074*** 0.0034** 0.0939***
(0.0024) (0.0027) (0.1265) (0.0112) (0.0019) (0.0014) (0.0074)
Compact state X Nurse -0.0050 -0.0039 0.2445 0.0297 0.0057 0.0030 0.0090
(0.0033) (0.0041) (0.2161) (0.0197) (0.0041) (0.0027) (0.0113)
Observations 204,314 513,225 204,314 513,225 204,314 513,225 184,516 449,637 169,704 418,448 169,704 418,448 168,221 412,004
Sample Nurses All health Nurses All health Nurses All health Nurses All health Nurses All health Nurses All health Nurses All health
Outcome mean 0.885828 0.879 0.867 0.852 34.118 34.471 10.222 10.028 0.048 0.043 0.018 0.015 2.945 2.864
Work in different compact state
Log(Commute time)(current)
Notes: All specifications include state fixed effects, year fixed effects, and full controls. Controls include indicators for LPN, male, race category, education category, a quadradic in age, indicators for single family household, number of children, and no children under the age of 5, family size (linear), naturalized citizen, and non-citizen. Standard errors clusted by state in parentheses. Sample includes all nurses or health professionals in the 1990 and 2000 Census (5% sample) and 2006-2012 ACS. *** p<0.01, ** p<0.05, * p<0.1
In labor force(current)
Employed(current)
Usual hours worked(last year)
Log(Wage income)(last year)
Work in different state
34

Table 5. Labor Supply Results for Border County Sample
(1) (2) (3) (4) (5) (6) (7) (8)
Resident & border state both Compact -0.0092 -0.0086 -0.0120 -0.0092 -0.5984 -0.6337 -0.0486** -0.0127
(0.0083) (0.0075) (0.0086) (0.0096) (0.3571) (0.3784) (0.0234) (0.0159)
Nurse 0.0191*** 0.0279*** 0.8044*** 0.3441***
(0.0024) (0.0026) (0.1459) (0.0175)
Resident & border state both Compact X Nurse -0.0040 -0.0088 0.0282 -0.0338
(0.0054) (0.0057) (0.2324) (0.0264)
Observations 120,107 327,576 120,107 327,576 120,107 327,576 109,117 288,633
R-squared 0.1423 0.0913 0.1270 0.0836 0.1341 0.1234 0.1550 0.2952
Sample Nurses All health Nurses All health Nurses All health Nurses All health
Outcome mean 0.895 0.887 0.877 0.857 34.45 34.68 10.39 10.12
In labor force(current)
Employed(current)
Usual hours worked(last year)
Log(Wage income)(last year)
Notes: All specifications include county fixed effects, year fixed effects, and full controls. Controls include indicators for LPN, male, race category, education category, a quadradic in age, indicators for single family household, number of children, and no children under the age of 5, family size (linear), naturalized citizen, and non-citizen. Standard errors clusted by state in parentheses. Sample includes all nurses or health professionals in the 186 counties on state borders that are identified in the 1990 and 2000 Census and 2006-2012 ACS and that have nurses or other health professionals included in the sample. Among these, 37 counties were treated. *** p<0.01, ** p<0.05, * p<0.1
35

Table 6. Commuting Results for Border County Sample
(1) (2) (3) (4) (5) (6)
Resident & border state both Compact -0.0182 -0.0173 0.0262*** 0.0336*** -0.0514* -0.0565***
(0.0139) (0.0142) (0.0075) (0.0080) (0.0278) (0.0165)
Nurse 0.0060 -0.0002 0.0274*
(0.0049) (0.0011) (0.0143)
Resident & border state both Compact X Nurse 0.0081 -0.0065 0.0304
(0.0090) (0.0046) (0.0239)
Observations 100,164 268,182 100,164 268,182 99,294 264,351
R-squared 0.1728 0.1411 0.1518 0.1200 0.0774 0.0952
Sample Nurses All health Nurses All health Nurses All health
Outcome mean 0.067 0.061 0.012 0.012 3.06 3.05
Work in different state
Work in different compact state
Log(Commute time)(current)
Notes: All specifications include county fixed effects, year fixed effects, and full controls. Controls include indicators for LPN, male, race category, education category, a quadradic in age, indicators for single family household, number of children, and no children under the age of 5, family size (linear), naturalized citizen, and non-citizen. Standard errors clusted by state in parentheses. Sample includes all nurses or health professionals in the 186 counties on state borders that are identified in the 1990 and 2000 Census and 2006-2012 ACS and that have nurses or other health professionals included in the sample. Among these, 37 counties were treated. *** p<0.01, ** p<0.05, * p<0.1
36
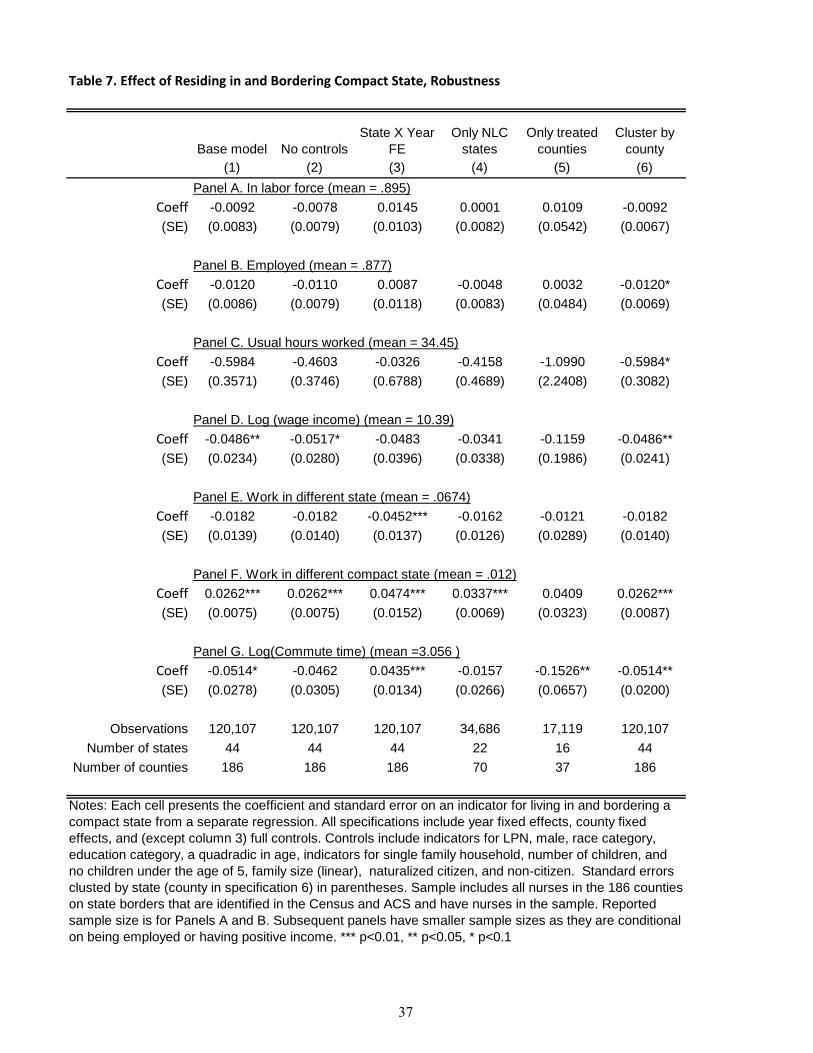
Table 7. Effect of Residing in and Bordering Compact State, Robustness
Base model No controlsState X Year
FEOnly NLC
statesOnly treated
countiesCluster by
county(1) (2) (3) (4) (5) (6)
Panel A. In labor force (mean = .895)
Coeff -0.0092 -0.0078 0.0145 0.0001 0.0109 -0.0092
(SE) (0.0083) (0.0079) (0.0103) (0.0082) (0.0542) (0.0067)
Panel B. Employed (mean = .877)
Coeff -0.0120 -0.0110 0.0087 -0.0048 0.0032 -0.0120*
(SE) (0.0086) (0.0079) (0.0118) (0.0083) (0.0484) (0.0069)
Panel C. Usual hours worked (mean = 34.45)
Coeff -0.5984 -0.4603 -0.0326 -0.4158 -1.0990 -0.5984*
(SE) (0.3571) (0.3746) (0.6788) (0.4689) (2.2408) (0.3082)
Panel D. Log (wage income) (mean = 10.39)
Coeff -0.0486** -0.0517* -0.0483 -0.0341 -0.1159 -0.0486**
(SE) (0.0234) (0.0280) (0.0396) (0.0338) (0.1986) (0.0241)
Panel E. Work in different state (mean = .0674)
Coeff -0.0182 -0.0182 -0.0452*** -0.0162 -0.0121 -0.0182
(SE) (0.0139) (0.0140) (0.0137) (0.0126) (0.0289) (0.0140)
Panel F. Work in different compact state (mean = .012)
Coeff 0.0262*** 0.0262*** 0.0474*** 0.0337*** 0.0409 0.0262***
(SE) (0.0075) (0.0075) (0.0152) (0.0069) (0.0323) (0.0087)
Panel G. Log(Commute time) (mean =3.056 )
Coeff -0.0514* -0.0462 0.0435*** -0.0157 -0.1526** -0.0514**
(SE) (0.0278) (0.0305) (0.0134) (0.0266) (0.0657) (0.0200)
Observations 120,107 120,107 120,107 34,686 17,119 120,107
Number of states 44 44 44 22 16 44
Number of counties 186 186 186 70 37 186
Notes: Each cell presents the coefficient and standard error on an indicator for living in and bordering a compact state from a separate regression. All specifications include year fixed effects, county fixed effects, and (except column 3) full controls. Controls include indicators for LPN, male, race category, education category, a quadradic in age, indicators for single family household, number of children, and no children under the age of 5, family size (linear), naturalized citizen, and non-citizen. Standard errors clusted by state (county in specification 6) in parentheses. Sample includes all nurses in the 186 counties on state borders that are identified in the Census and ACS and have nurses in the sample. Reported sample size is for Panels A and B. Subsequent panels have smaller sample sizes as they are conditional on being employed or having positive income. *** p<0.01, ** p<0.05, * p<0.1
37
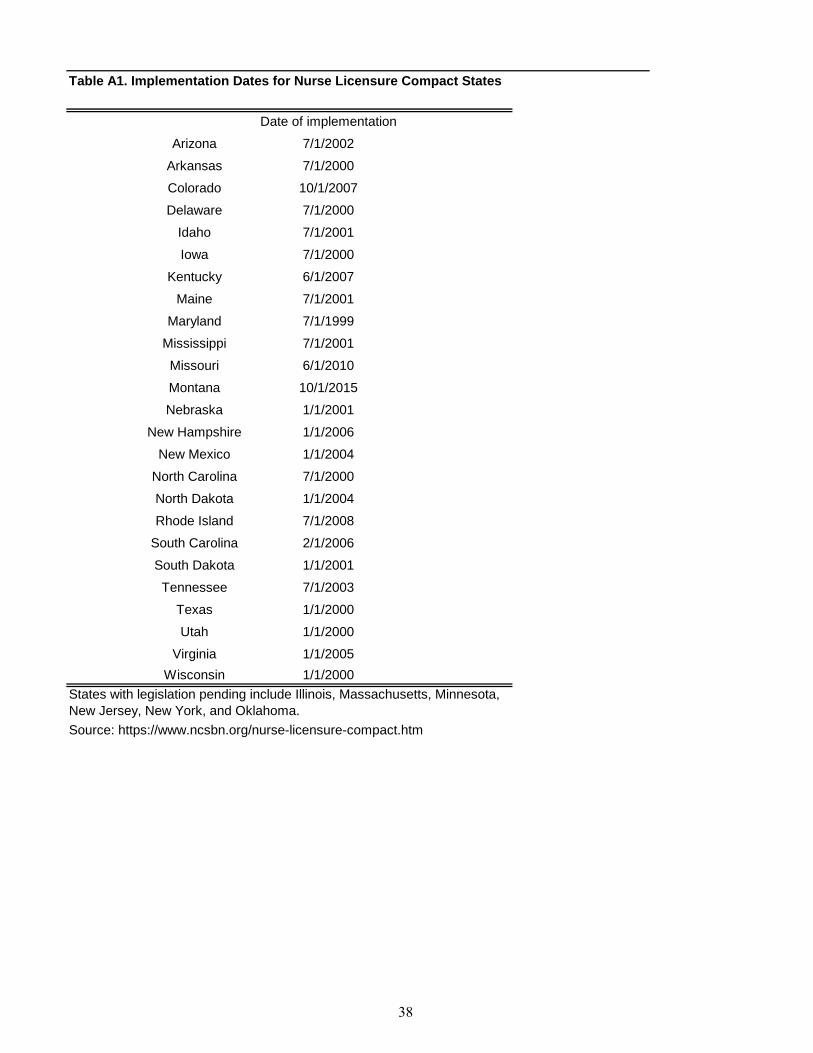
Table A1. Implementation Dates for Nurse Licensure Compact States
Date of implementation
Arizona 7/1/2002
Arkansas 7/1/2000
Colorado 10/1/2007
Delaware 7/1/2000
Idaho 7/1/2001
Iowa 7/1/2000
Kentucky 6/1/2007
Maine 7/1/2001
Maryland 7/1/1999
Mississippi 7/1/2001
Missouri 6/1/2010
Montana 10/1/2015
Nebraska 1/1/2001
New Hampshire 1/1/2006
New Mexico 1/1/2004
North Carolina 7/1/2000
North Dakota 1/1/2004
Rhode Island 7/1/2008
South Carolina 2/1/2006
South Dakota 1/1/2001
Tennessee 7/1/2003
Texas 1/1/2000
Utah 1/1/2000
Virginia 1/1/2005
Wisconsin 1/1/2000
States with legislation pending include Illinois, Massachusetts, Minnesota, New Jersey, New York, and Oklahoma.
Source: https://www.ncsbn.org/nurse-licensure-compact.htm
38
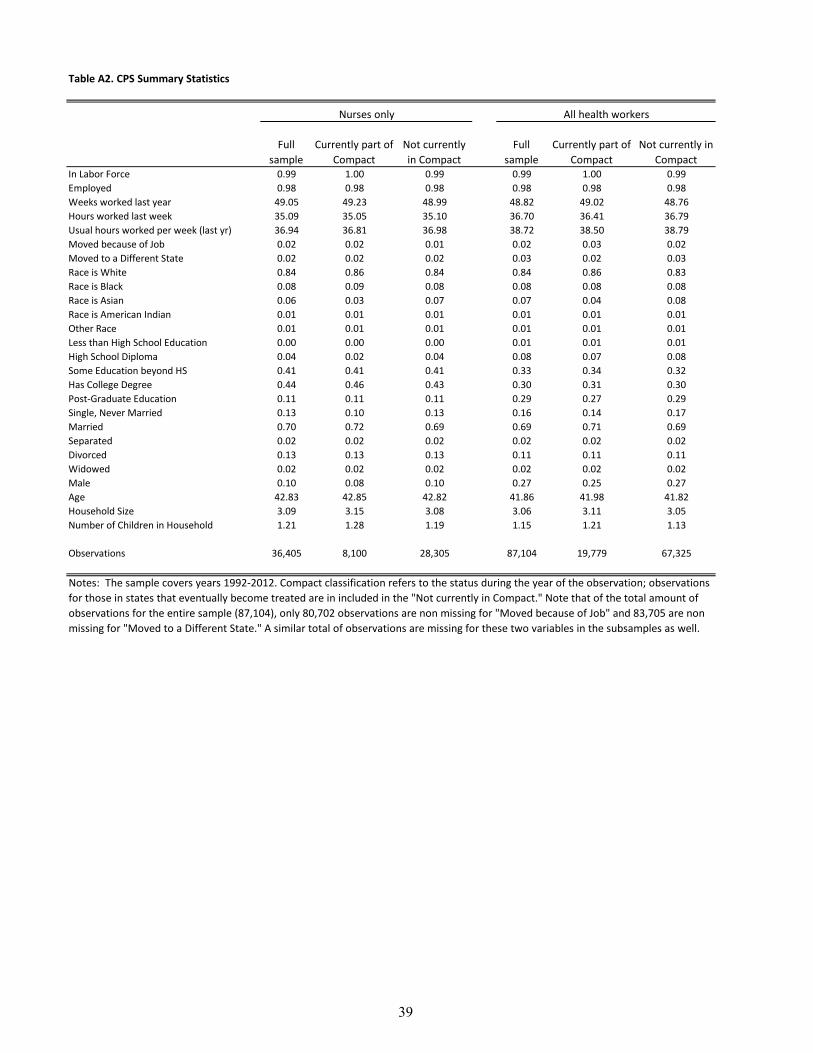
Table A2. CPS Summary Statistics
Full sample
Currently part of Compact
Not currently in Compact
Full sample
Currently part of Compact
Not currently in Compact
In Labor Force 0.99 1.00 0.99 0.99 1.00 0.99Employed 0.98 0.98 0.98 0.98 0.98 0.98Weeks worked last year 49.05 49.23 48.99 48.82 49.02 48.76Hours worked last week 35.09 35.05 35.10 36.70 36.41 36.79Usual hours worked per week (last yr) 36.94 36.81 36.98 38.72 38.50 38.79Moved because of Job 0.02 0.02 0.01 0.02 0.03 0.02Moved to a Different State 0.02 0.02 0.02 0.03 0.02 0.03Race is White 0.84 0.86 0.84 0.84 0.86 0.83Race is Black 0.08 0.09 0.08 0.08 0.08 0.08Race is Asian 0.06 0.03 0.07 0.07 0.04 0.08Race is American Indian 0.01 0.01 0.01 0.01 0.01 0.01Other Race 0.01 0.01 0.01 0.01 0.01 0.01Less than High School Education 0.00 0.00 0.00 0.01 0.01 0.01High School Diploma 0.04 0.02 0.04 0.08 0.07 0.08Some Education beyond HS 0.41 0.41 0.41 0.33 0.34 0.32Has College Degree 0.44 0.46 0.43 0.30 0.31 0.30Post-Graduate Education 0.11 0.11 0.11 0.29 0.27 0.29Single, Never Married 0.13 0.10 0.13 0.16 0.14 0.17Married 0.70 0.72 0.69 0.69 0.71 0.69Separated 0.02 0.02 0.02 0.02 0.02 0.02Divorced 0.13 0.13 0.13 0.11 0.11 0.11Widowed 0.02 0.02 0.02 0.02 0.02 0.02Male 0.10 0.08 0.10 0.27 0.25 0.27Age 42.83 42.85 42.82 41.86 41.98 41.82Household Size 3.09 3.15 3.08 3.06 3.11 3.05Number of Children in Household 1.21 1.28 1.19 1.15 1.21 1.13
Observations 36,405 8,100 28,305 87,104 19,779 67,325
Nurses only All health workers
Notes: The sample covers years 1992-2012. Compact classification refers to the status during the year of the observation; observations for those in states that eventually become treated are in included in the "Not currently in Compact." Note that of the total amount of observations for the entire sample (87,104), only 80,702 observations are non missing for "Moved because of Job" and 83,705 are non missing for "Moved to a Different State." A similar total of observations are missing for these two variables in the subsamples as well.
39

Table A3. Complete Labor Supply Results for Full Sample, Nurses Only
In labor force(current)
Employed(current)
Usual hours worked
(last year)
Log(Wage income)
(last year)
Work in different state
(current)
Work in different
compact state
Log(Commute time)
(current)Compact state -0.0106*** -0.0113*** -0.4139** -0.0089 -0.0002 0.0056* -0.0103
(0.0037) (0.0041) (0.1549) (0.0137) (0.0028) (0.0031) (0.0077)
LPN -0.0223*** -0.0324*** -0.5661*** -0.3568*** -0.0059*** -0.0010 -0.0609***
(0.0023) (0.0025) (0.1003) (0.0075) (0.0016) (0.0006) (0.0075)
Male 0.0193*** 0.0169*** 3.4772*** 0.1752*** 0.0088*** 0.0012 0.0571***
(0.0017) (0.0025) (0.1795) (0.0141) (0.0026) (0.0010) (0.0088)
White 0.0151*** 0.0259*** -0.6777*** -0.0036 -0.0118** -0.0037 -0.0490***
(0.0044) (0.0049) (0.2389) (0.0121) (0.0055) (0.0032) (0.0176)
Black 0.0270*** 0.0274*** 1.0182*** 0.0262 -0.0070 -0.0057* 0.0561**
(0.0053) (0.0060) (0.1675) (0.0181) (0.0060) (0.0031) (0.0240)
Amer. Indian -0.0103 -0.0134 0.7121 -0.0135 0.0088 0.0037 -0.0302
(0.0105) (0.0116) (0.4306) (0.0265) (0.0077) (0.0060) (0.0372)
Asian 0.0178*** 0.0294*** 0.6515 0.1439*** -0.0110* -0.0055* -0.0752***
(0.0052) (0.0067) (0.4039) (0.0154) (0.0064) (0.0031) (0.0220)
Other race 0.0198*** 0.0243** 0.4049 -0.0138 -0.0078** -0.0045 -0.0390
(0.0067) (0.0097) (0.5028) (0.0267) (0.0035) (0.0034) (0.0305)
Less than HS -0.0980*** -0.1427*** -4.4644*** -0.4206*** -0.0096 0.0030 -0.0897**
(0.0105) (0.0113) (0.3714) (0.0247) (0.0069) (0.0036) (0.0344)
High school -0.0455*** -0.0575*** -2.8143*** -0.2914*** -0.0129*** -0.0028** -0.0907***
(0.0037) (0.0038) (0.1531) (0.0126) (0.0038) (0.0012) (0.0112)
Some college -0.0092*** -0.0107*** -1.6409*** -0.1886*** -0.0069** -0.0007 -0.0603***
(0.0018) (0.0019) (0.0919) (0.0061) (0.0027) (0.0008) (0.0078)
College -0.0070*** -0.0040* -1.6730*** -0.0959*** -0.0047*** -0.0010 -0.0334***
(0.0019) (0.0020) (0.1299) (0.0080) (0.0012) (0.0007) (0.0064)
Age 0.0301*** 0.0300*** 1.3096*** 0.1074*** 0.0005* 0.0001 0.0095***
(0.0006) (0.0006) (0.0235) (0.0013) (0.0003) (0.0001) (0.0013)
Age-squared -0.0004*** -0.0004*** -0.0172*** -0.0012*** -0.0000** -0.0000 -0.0001***
(0.0000) (0.0000) (0.0003) (0.0000) (0.0000) (0.0000) (0.0000)
Single household 0.0113*** 0.0047* 1.2077*** 0.0349*** -0.0003 -0.0005 -0.0329***
(0.0024) (0.0028) (0.0993) (0.0068) (0.0015) (0.0009) (0.0062)
Family size -0.0025*** -0.0044*** -0.4046*** -0.0399*** 0.0004 0.0002 0.0224***
(0.0009) (0.0010) (0.0675) (0.0043) (0.0006) (0.0003) (0.0023)
No children in household 0.0200** 0.0092 0.1319 -0.0350 0.0062 0.0006 0.1383***
(0.0090) (0.0084) (0.3695) (0.0336) (0.0055) (0.0031) (0.0266)
One child in household 0.0417*** 0.0331*** 1.2959*** 0.0227 0.0031 0.0007 0.1015***
(0.0084) (0.0077) (0.3365) (0.0326) (0.0055) (0.0031) (0.0264)
Two children in household 0.0273*** 0.0233*** -0.2823 -0.0113 0.0004 0.0001 0.0667***
(0.0078) (0.0076) (0.3208) (0.0286) (0.0054) (0.0031) (0.0244)
3-5 children in household 0.0155* 0.0116 -0.9529*** -0.0420 0.0006 -0.0005 0.0329
(0.0081) (0.0078) (0.3416) (0.0252) (0.0054) (0.0028) (0.0239)
No children under 5 0.0668*** 0.0683*** 4.1069*** 0.0429*** 0.0004 0.0010 -0.0438***
(0.0019) (0.0022) (0.1167) (0.0071) (0.0014) (0.0008) (0.0052)
Nationalized citizen 0.0147*** 0.0217*** 1.6452*** 0.0926*** 0.0063 -0.0021** 0.0906***
(0.0029) (0.0033) (0.1667) (0.0124) (0.0058) (0.0010) (0.0306)
Not citizen -0.0274*** -0.0273*** 0.1119 -0.0760*** 0.0015 -0.0024** -0.0073
(0.0048) (0.0050) (0.2371) (0.0125) (0.0035) (0.0010) (0.0308)
Observations 582,543 582,543 582,543 528,021 484,534 484,534 480,234
R-squared 0.1406 0.1267 0.1275 0.1597 0.0380 0.0181 0.0304
Outcome mean 0.890 0.872 34.416 10.315 0.035 0.010 2.989
Notes: All specifications include state fixed effects and year fixed effects. Standard errors clusted by state in parentheses. Sample includes all nurses in the 1990 and 2000 Census (5% sample) and 2006-2012 ACS. *** p<0.01, ** p<0.05, * p<0.1
40

Table A4. First Stage Estimates of Correlates of Labor Force Participation
Probit coeffMale 0.2278
(0.0038)White 0.1027
(0.0068)Black 0.0789
(0.0075)Asian 0.0475
(0.0089)American Indian -0.0126
(0.0163)Less than high school -0.6130
(0.0067)High school -0.3899
(0.0047)Some college -0.1956
(0.0044)College -0.1529
(0.0048)Age 0.1034
(0.0006)Age-squared -0.0013
(0.0000)Single household -0.0191
(0.0045)Family size 0.0045
(0.0016)No children in househ -0.0896
(0.0049)Number of children in -0.0793
(0.0025)Constant -0.4094
(0.0156)Observations 1,547,920 Psuedo R-squared 0.0956
Notes: Sample includes all nurses or health professionals in the 1990 and 2000 Census (5% sample) and 2006-2012 ACS. Robust standard errors in parentheses.
41
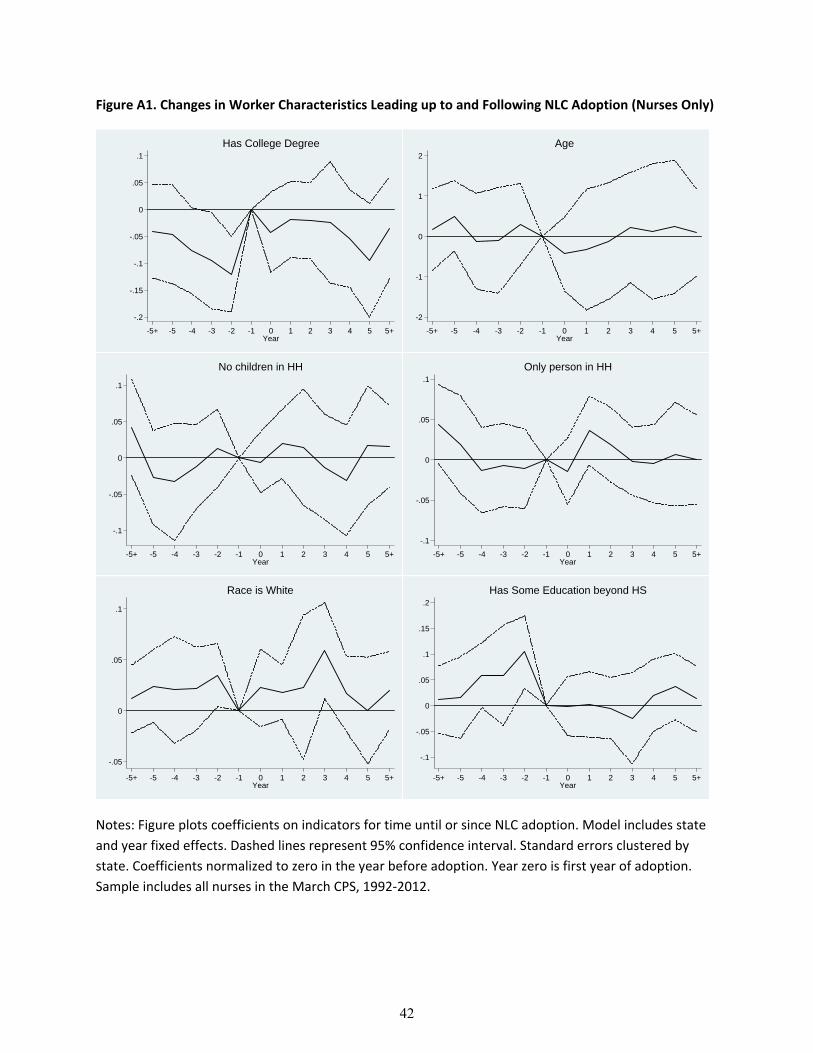
Figure A1. Changes in Worker Characteristics Leading up to and Following NLC Adoption (Nurses Only)
Notes: Figure plots coefficients on indicators for time until or since NLC adoption. Model includes state
and year fixed effects. Dashed lines represent 95% confidence interval. Standard errors clustered by
state. Coefficients normalized to zero in the year before adoption. Year zero is first year of adoption.
Sample includes all nurses in the March CPS, 1992‐2012.
-.2
-.15
-.1
-.05
0
.05
.1
-5+ -5 -4 -3 -2 -1 0 1 2 3 4 5 5+Year
Has College Degree
-2
-1
0
1
2
-5+ -5 -4 -3 -2 -1 0 1 2 3 4 5 5+Year
Age
-.1
-.05
0
.05
.1
-5+ -5 -4 -3 -2 -1 0 1 2 3 4 5 5+Year
No children in HH
-.1
-.05
0
.05
.1
-5+ -5 -4 -3 -2 -1 0 1 2 3 4 5 5+Year
Only person in HH
-.05
0
.05
.1
-5+ -5 -4 -3 -2 -1 0 1 2 3 4 5 5+Year
Race is White
-.1
-.05
0
.05
.1
.15
.2
-5+ -5 -4 -3 -2 -1 0 1 2 3 4 5 5+Year
Has Some Education beyond HS
42

Nurse Licensure CompactFinal Version, November 6, 1998
ARTICLE I Findings and Declaration of Purpose
a. The party states find that:1. the health and safety of the public are affected by the degree of compliance with and the
effectiveness of enforcement activities related to state nurse licensure laws;2. violations of nurse licensure and other laws regulating the practice of nursing may result
in injury or harm to the public;3. the expanded mobility of nurses and the use of advanced communication technologies as
part of our nation’s healthcare delivery system require greater coordination andcooperation among states in the areas of nurse licensure and regulation;
4. new practice modalities and technology make compliance with individual state nurselicensure laws difficult and complex;
5. the current system of duplicative licensure for nurses practicing in multiple states iscumbersome and redundant to both nurses and states.
b. The general purposes of this Compact are to:1. facilitate the states’ responsibility to protect the public’s health and safety;2. ensure and encourage the cooperation of party states in the areas of nurse licensure and
regulation;3. facilitate the exchange of information between party states in the areas of nurse
regulation, investigation and adverse actions;4. promote compliance with the laws governing the practice of nursing in each jurisdiction;5. invest all party states with the authority to hold a nurse accountable for meeting all state
practice laws in the state in which the patient is located at the time care is renderedthrough the mutual recognition of party state licenses.
ARTICLE II Definitions
As used in this Compact: a. "Adverse Action" means a home or remote state action.b. "Alternative program" means a voluntary, non-disciplinary monitoring program approved by a
nurse licensing board.c. "Coordinated licensure information system" means an integrated process for collecting, storing,
and sharing information on nurse licensure and enforcement activities related to nurse licensurelaws, which is administered by a non-profit organization composed of and controlled by statenurse licensing boards.
d. "Current significant investigative information" means:1. investigative information that a licensing board, after a preliminary inquiry that includes
notification and an opportunity for the nurse to respond if required by state law, hasreason to believe is not groundless and, if proved true, would indicate more than a minorinfraction; or
2. investigative information that indicates that the nurse represents an immediate threat topublic health and safety regardless of whether the nurse has been notified and had anopportunity to respond.
e. "Home state" means the party state which is the nurse’s primary state of residence.f. "Home state action" means any administrative, civil, equitable or criminal action permitted by the
home state’s laws which are imposed on a nurse by the home state’s licensing board or otherauthority including actions against an individual’s license such as: revocation, suspension,probation or any other action which affects a nurse’s authorization to practice.
43
Appendix B
g. "Licensing board" means a party state’s regulatory body responsible for issuing nurse licenses.h. "Multistate licensure privilege" means current, official authority from a remote state permitting the
practice of nursing as either a registered nurse or a licensed practical/vocational nurse in suchparty state. All party states have the authority, in accordance with existing state due process law,to take actions against the nurse’s privilege such as: revocation, suspension, probation or anyother action which affects a nurse’s authorization to practice.
i. "Nurse" means a registered nurse or licensed practical/vocational nurse, as those terms aredefined by each party’s state practice laws.
j. "Party state" means any state that has adopted this Compact.k. "Remote state" means a party state, other than the home state,
1. where the patient is located at the time nursing care is provided, or,2. in the case of the practice of nursing not involving a patient, in such party state where the
recipient of nursing practice is located.l. "Remote state action" means
1. any administrative, civil, equitable or criminal action permitted by a remote state’s lawswhich are imposed on a nurse by the remote state’s licensing board or other authorityincluding actions against an individual’s multistate licensure privilege to practice in theremote state, and
2. cease and desist and other injunctive or equitable orders issued by remote states or thelicensing boards thereof.
m. "State" means a state, territory, or possession of the United States, the District of Columbia or theCommonwealth of Puerto Rico.
n. "State practice laws" means those individual party’s state laws and regulations that govern thepractice of nursing, define the scope of nursing practice, and create the methods and grounds forimposing discipline. "State practice laws" does not include the initial qualifications for licensure orrequirements necessary to obtain and retain a license, except for qualifications or requirements ofthe home state.
ARTICLE III General Provisions and Jurisdiction
a. A license to practice registered nursing issued by a home state to a resident in that state will berecognized by each party state as authorizing a multistate licensure privilege to practice as aregistered nurse in such party state. A license to practice licensed practical/vocational nursingissued by a home state to a resident in that state will be recognized by each party state asauthorizing a multistate licensure privilege to practice as a licensed practical/vocational nurse insuch party state. In order to obtain or retain a license, an applicant must meet the home state’squalifications for licensure and license renewal as well as all other applicable state laws.
b. Party states may, in accordance with state due process laws, limit or revoke the multistatelicensure privilege of any nurse to practice in their state and may take any other actions undertheir applicable state laws necessary to protect the health and safety of their citizens. If a partystate takes such action, it shall promptly notify the administrator of the coordinated licensureinformation system. The administrator of the coordinated licensure information system shallpromptly notify the home state of any such actions by remote states.
c. Every nurse practicing in a party state must comply with the state practice laws of the state inwhich the patient is located at the time care is rendered. In addition, the practice of nursing is notlimited to patient care, but shall include all nursing practice as defined by the state practice lawsof a party state. The practice of nursing will subject a nurse to the jurisdiction of the nurselicensing board and the courts, as well as the laws, in that party state.
d. This Compact does not affect additional requirements imposed by states for advanced practiceregistered nursing. However, a multistate licensure privilege to practice registered nursinggranted by a party state shall be recognized by other party states as a license to practiceregistered nursing if one is required by state law as a precondition for qualifying for advancedpractice registered nurse authorization.
e. Individuals not residing in a party state shall continue to be able to apply for nurse licensure asprovided for under the laws of each party state. However, the license granted to these individualswill not be recognized as granting the privilege to practice nursing in any other party state unlessexplicitly agreed to by that party state.
44
Appendix B

ARTICLE IV Applications for Licensure in a Party State
a. Upon application for a license, the licensing board in a party state shall ascertain, through thecoordinated licensure information system, whether the applicant has ever held, or is the holder of,a license issued by any other state, whether there are any restrictions on the multistate licensureprivilege, and whether any other adverse action by any state has been taken against the license.
b. A nurse in a party state shall hold licensure in only one party state at a time, issued by the homestate.
c. A nurse who intends to change primary state of residence may apply for licensure in the newhome state in advance of such change. However, new licenses will not be issued by a party stateuntil after a nurse provides evidence of change in primary state of residence satisfactory to thenew home state’s licensing board.
d. When a nurse changes primary state of residence by:1. moving between two party states, and obtains a license from the new home state, the
license from the former home state is no longer valid;2. moving from a non-party state to a party state, and obtains a license from the new home
state, the individual state license issued by the non-party state is not affected and willremain in full force if so provided by the laws of the non-party state;
3. moving from a party state to a non-party state, the license issued by the prior home stateconverts to an individual state license, valid only in the former home state, without themultistate licensure privilege to practice in other party states.
ARTICLE V Adverse Actions
In addition to the General Provisions described in Article III, the following provisions apply: a. The licensing board of a remote state shall promptly report to the administrator of the coordinated
licensure information system any remote state actions including the factual and legal basis forsuch action, if known. The licensing board of a remote state shall also promptly report anysignificant current investigative information yet to result in a remote state action. Theadministrator of the coordinated licensure information system shall promptly notify the home stateof any such reports.
b. The licensing board of a party state shall have the authority to complete any pendinginvestigations for a nurse who changes primary state of residence during the course of suchinvestigations. It shall also have the authority to take appropriate action(s), and shall promptlyreport the conclusions of such investigations to the administrator of the coordinated licensureinformation system. The administrator of the coordinated licensure information system shallpromptly notify the new home state of any such actions.
c. A remote state may take adverse action affecting the multistate licensure privilege to practicewithin that party state. However, only the home state shall have the power to impose adverseaction against the license issued by the home state.
d. For purposes of imposing adverse action, the licensing board of the home state shall give thesame priority and effect to reported conduct received from a remote state as it would if suchconduct had occurred within the home state. In so doing, it shall apply its own state laws todetermine appropriate action.
e. The home state may take adverse action based on the factual findings of the remote state, solong as each state follows its own procedures for imposing such adverse action.
f. Nothing in this Compact shall override a party state’s decision that participation in an alternativeprogram may be used in lieu of licensure action and that such participation shall remain non-public if required by the party state’s laws. Party states must require nurses who enter anyalternative programs to agree not to practice in any other party state during the term of thealternative program without prior authorization from such other party state.
ARTICLE VI Additional Authorities Invested in Party State Nurse Licensing Boards
Notwithstanding any other powers, party state nurse licensing boards shall have the authority to: a. if otherwise permitted by state law, recover from the affected nurse the costs of investigations and
disposition of cases resulting from any adverse action taken against that nurse;
45
Appendix B

b. issue subpoenas for both hearings and investigations which require the attendance and testimonyof witnesses, and the production of evidence. Subpoenas issued by a nurse licensing board in aparty state for the attendance and testimony of witnesses, and/or the production of evidence fromanother party state, shall be enforced in the latter state by any court of competent jurisdiction,according to the practice and procedure of that court applicable to subpoenas issued inproceedings pending before it. The issuing authority shall pay any witness fees, travel expenses,mileage and other fees required by the service statutes of the state where the witnesses and/orevidence are located.
c. issue cease and desist orders to limit or revoke a nurse’s authority to practice in their state;d. promulgate uniform rules and regulations as provided for in Article VIII(c).
ARTICLE VII Coordinated Licensure Information System
a. All party states shall participate in a cooperative effort to create a coordinated data base of alllicensed registered nurses and licensed practical/vocational nurses. This system will includeinformation on the licensure and disciplinary history of each nurse, as contributed by party states,to assist in the coordination of nurse licensure and enforcement efforts.
b. Notwithstanding any other provision of law, all party states’ licensing boards shall promptly reportadverse actions, actions against multistate licensure privileges, any current significantinvestigative information yet to result in adverse action, denials of applications, and the reasonsfor such denials, to the coordinated licensure information system.
c. Current significant investigative information shall be transmitted through the coordinated licensureinformation system only to party state licensing boards.
d. Notwithstanding any other provision of law, all party states’ licensing boards contributinginformation to the coordinated licensure information system may designate information that maynot be shared with non-party states or disclosed to other entities or individuals without theexpress permission of the contributing state.
e. Any personally identifiable information obtained by a party states’ licensing board from thecoordinated licensure information system may not be shared with non-party states or disclosed toother entities or individuals except to the extent permitted by the laws of the party statecontributing the information.
f. Any information contributed to the coordinated licensure information system that is subsequentlyrequired to be expunged by the laws of the party state contributing that information, shall also beexpunged from the coordinated licensure information system.
g. The Compact administrators, acting jointly with each other and in consultation with theadministrator of the coordinated licensure information system, shall formulate necessary andproper procedures for the identification, collection and exchange of information under thisCompact.
ARTICLE VIII Compact Administration and Interchange of Information
a. The head of the nurse licensing board, or his/her designee, of each party state shall be theadministrator of this Compact for his/her state.
b. The Compact administrator of each party state shall furnish to the Compact administrator of eachother party state any information and documents including, but not limited to, a uniform data setof investigations, identifying information, licensure data, and disclosable alternative programparticipation information to facilitate the administration of this Compact.
c. Compact administrators shall have the authority to develop uniform rules to facilitate andcoordinate implementation of this Compact. These uniform rules shall be adopted by party states,under the authority invested under Article VI (d).
ARTICLE IX Immunity
No party state or the officers or employees or agents of a party state’s nurse licensing board who acts in accordance with the provisions of this Compact shall be liable on account of any act or omission in good faith while engaged in the performance of their duties under this Compact. Good faith in this article shall not include willful misconduct, gross negligence, or recklessness.
ARTICLE X Entry into Force, Withdrawal and Amendment
46
Appendix B
a. This Compact shall enter into force and become effective as to any state when it has beenenacted into the laws of that state. Any party state may withdraw from this Compact by enacting astatute repealing the same, but no such withdrawal shall take effect until six months after thewithdrawing state has given notice of the withdrawal to the executive heads of all other partystates.
b. No withdrawal shall affect the validity or applicability by the licensing boards of states remainingparty to the Compact of any report of adverse action occurring prior to the withdrawal.
c. Nothing contained in this Compact shall be construed to invalidate or prevent any nurse licensureagreement or other cooperative arrangement between a party state and a non-party state that ismade in accordance with the other provisions of this Compact.
d. This Compact may be amended by the party states. No amendment to this Compact shallbecome effective and binding upon the party states unless and until it is enacted into the laws ofall party states.
ARTICLE XI Construction and Severability
a. This Compact shall be liberally construed so as to effectuate the purposes thereof. The provisionsof this Compact shall be severable and if any phrase, clause, sentence or provision of thisCompact is declared to be contrary to the constitution of any party state or of the United States orthe applicability thereof to any government, agency, person or circumstance is held invalid, thevalidity of the remainder of this Compact and the applicability thereof to any government, agency,person or circumstance shall not be affected thereby. If this Compact shall be held contrary to theconstitution of any state party thereto, the Compact shall remain in full force and effect as to theremaining party states and in full force and effect as to the party state affected as to all severablematters.
b. In the event party states find a need for settling disputes arising under this Compact:1. The party states may submit the issues in dispute to an arbitration panel which will be
comprised of an individual appointed by the Compact administrator in the home state; anindividual appointed by the Compact administrator in the remote state(s) involved; and anindividual mutually agreed upon by the Compact administrators of all the party statesinvolved in the dispute.
2. The decision of a majority of the arbitrators shall be final and binding.
47
Appendix B
Top Related