


Languages
Pages
Legal


La valutazione attraverso i Multipli di borsa“A little inaccuracy sometimes saves tons of explanation”
H.H. Munro
Copyright SDA Bocconi
Ombretta Pettinato

Key valuation Methods
Analysis of comparable companies
Analysis of comparable transactions
Discounted cash-flow
analysis (DCF)p y ( )
Publicly traded companies Considerations paid intransactions involving
Valuation based on NPV ofprojected Free Cash Flows
Valution with multiples
Multiples show how theMarket values the future outlookof a company
gcomparables companies
Valution with multiples
Includes takeover premium
p j
WACC used as basis fordiscounted factor
DCF requires in defthof a company Includes takeover premium DCF requires in-defthanalysis of the company andaccess to relevant data
Copyright SDA Bocconi 2

Il metodo di valutazione dei multipli
• Definizione del multiplo– Coerenza nella stima del numeratore e denominatore
• Descrizione statistica del multiplo– Media vs medianaMedia vs mediana
• Analisi del multiplop– Fondamentali del multiplo
• Applicazione del multiplo– Definizione delle aziende comparables
Copyright SDA Bocconi 3

Applicazione metodo dei multipli
Relazione fondamentale:
Valore = Multiplo x Grandezza di riferimento
E i d ll’ li i d i i lt h i di l i d Esempio: dall’analisi dei comps risulta che in media le aziendedel settore quotano 10 x EBITDA (EV/EBITDA). Sulla basedell’EBITDA dell’azienda che intendiamo valutare (es: 1.500),stimiamo l’enterprise value nel seguente modo:stimiamo l enterprise value nel seguente modo:
Company EBITDA 1.500x Multiple x 10= Enterprise Value 15.000- Net Debt 2.000= Equity value 13.000Shares issued & outstanding 1 000
Copyright SDA Bocconi
Shares issued & outstanding 1.000Price per share per comps analysis 13
4

Il metodo di valutazione dei multipli PRINCIPIO: il valore di una società può essere determinato assumendo come riferimento
le indicazioni fornite dal mercato per società con caratteristiche analoghe a quella oggettodi valutazione
E’ fondamentale la COMPARABILITA’
STEP ISSUE RIFERIMENTO
1. Determinazione del campione di società comparabili
Le società del campione devono avere attività comparabili
Sez. I
2 Tipologie di m ltipli Coerenza tra n meratore e Sez. II e Sex.III2. Tipologie di multipli Coerenza tra numeratore e denominatore
Comparabilità dei dati: riclassificazione, principi contabili, calendarizzazione, normalizzazionenormalizzazione
3. Interpretazione e scelta Scelta del multiplo da applicare Sez. IV
Copyright SDA Bocconi 5

I. Determinazione del campione di società di riferimento
Copyright SDA Bocconi 6
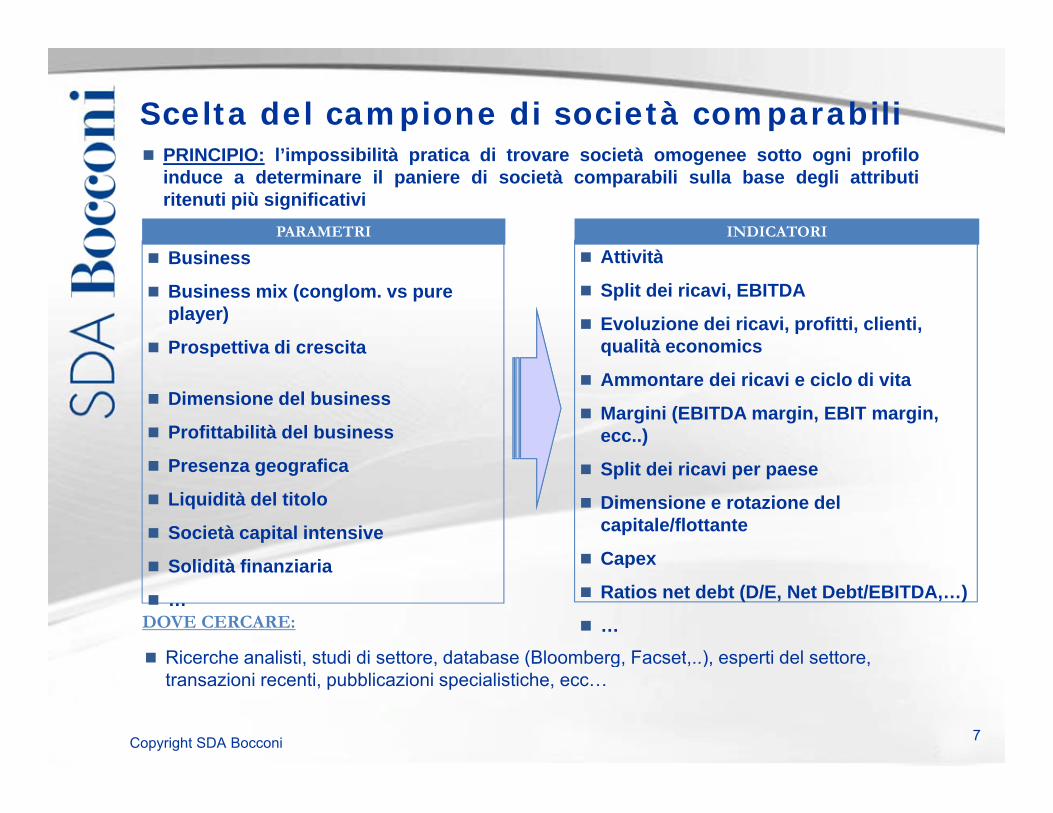
Scelta del campione di società comparabili PRINCIPIO l’i ibilità ti di t i tà tt i fil PRINCIPIO: l’impossibilità pratica di trovare società omogenee sotto ogni profilo
induce a determinare il paniere di società comparabili sulla base degli attributiritenuti più significativi
PARAMETRI
B iINDICATORI
Atti ità Business
Business mix (conglom. vs pure player)
Prospettiva di crescita
Attività
Split dei ricavi, EBITDA
Evoluzione dei ricavi, profitti, clienti, qualità economicsp
Dimensione del business
Profittabilità del business
q
Ammontare dei ricavi e ciclo di vita
Margini (EBITDA margin, EBIT margin, ecc..)
Presenza geografica
Liquidità del titolo
Società capital intensive
S lidità fi i i
Split dei ricavi per paese
Dimensione e rotazione del capitale/flottante
Capex Solidità finanziaria
…
Capex
Ratios net debt (D/E, Net Debt/EBITDA,…)
…DOVE CERCARE:
Ricerche analisti, studi di settore, database (Bloomberg, Facset,..), esperti del settore,
Copyright SDA Bocconi
Ricerche analisti, studi di settore, database (Bloomberg, Facset,..), esperti del settore, transazioni recenti, pubblicazioni specialistiche, ecc…
7

II. Tipologie dei multipli
Copyright SDA Bocconi 8

I multipli di mercato: concetto Rapporto tra valori borsistici e grandezze Rapporto tra valori borsistici e grandezze
economiche/patrimoniali/operative
ENTERPRISE VALUE
GRANDEZZE FINANZIARIE/OPERATIVE
EQUITY VALUE
GRANDEZZE FINANZIARIE/REDDITUALI
EQUITY VALUE VS ENTERPRISE VALUE
“UNLEVERED” “LEVERED”
ALCUNE REGOLE
ASSETS NON OPERATIVI.
CASSA
DEBITO
STATO PATRIMONIALE Coerenza tra numeratore e denominatore
Valori di mercato piuttosto che valori dibilancio
ENTERPRISE
VALUE EQUITY VALUE
Considerare sempre fonti ufficiali comepunto di partenza dei dati
Nel caso di livelli anormali dei multipliNel caso di livelli anormali dei multipliottenuti Verificare il meccanismo di calcolo Verificare i dati di base e i relativi
aggiustamenti Confrontare i dati alla base dei calcoli
ff tt ti i d ti d ll i h di
Stato Patrimoniale
ENTERPRISE VALUE
+ Cassa
Stato Patrimoniale
ENTERPRISE VALUE
+ Assets non operativi
Copyright SDA Bocconi
effettuati con i dati delle ricerche dimercato
Cassa
+ Assets non operativi
- Debito
= EQUITY VALUE
p
- PFN
= EQUITY VALUE 9
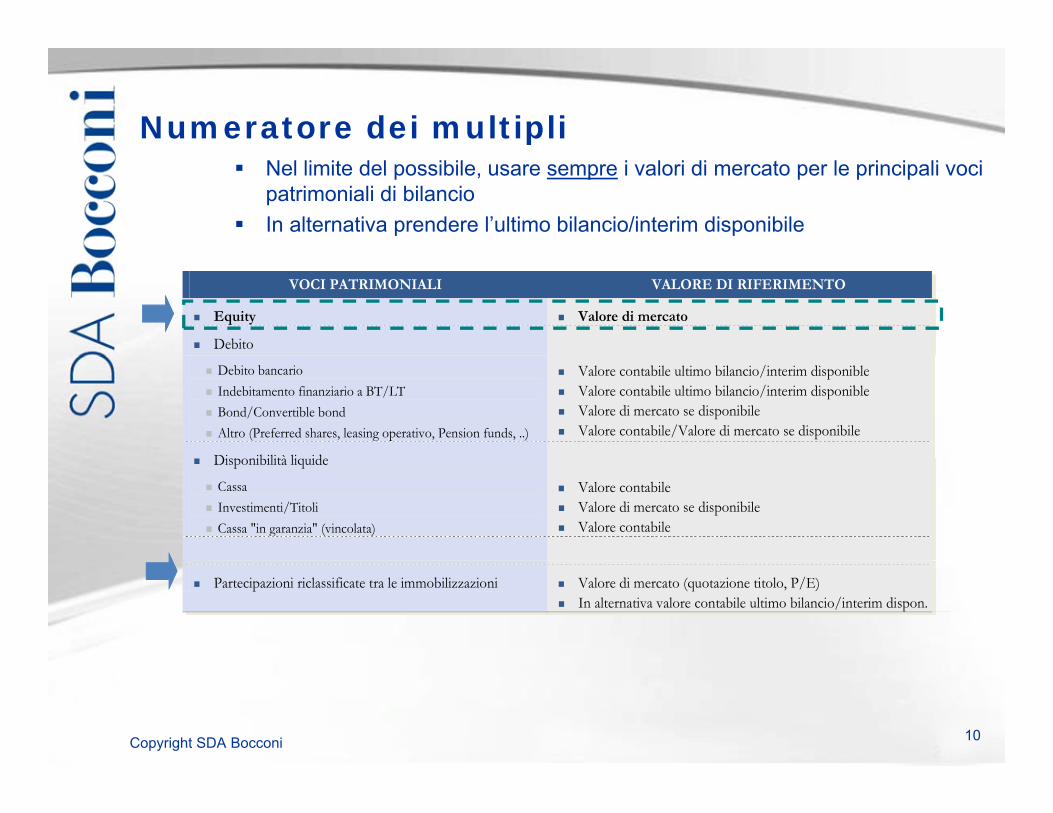
Numeratore dei multipli Nel limite del possibile, usare sempre i valori di mercato per le principali voci
patrimoniali di bilancio In alternativa prendere l’ultimo bilancio/interim disponibile
VOCI PATRIMONIALI VALORE DI RIFERIMENTO
Equity Valore di mercato
Debito
Debito bancario Indebitamento finanziario a BT/LT Bond/Convertible bond Altro (Preferred shares, leasing operativo, Pension funds, ..)
Valore contabile ultimo bilancio/interim disponible Valore contabile ultimo bilancio/interim disponible Valore di mercato se disponibile Valore contabile/Valore di mercato se disponibile
Di p ibilità li id Disponibilità liquide
Cassa Investimenti/Titoli Cassa "in garanzia" (vincolata)
Valore contabile Valore di mercato se disponibile Valore contabile
Partecipazioni riclassificate tra le immobilizzazioni Valore di mercato (quotazione titolo, P/E) In alternativa valore contabile ultimo bilancio/interim dispon.
Copyright SDA Bocconi 10

EXCESS CASH
Tipologie di multipli
ENTERPRISE EQUITY
NON OPER. ASSETS
EXCESS CASH
DEBT
VALUE EQUITY VALUE
ASSET SIDE EQUITY SIDE
EV/SALES
EV/EBITDA
P/E
PEG
EV/EBIT P/BV
Asset or Industry Specific Variable Number of customers (utility or telecom) Volume (MWh of electricity) Volume (tons of steel)
Copyright SDA Bocconi
Volume (tons of steel)
11

Tipologie di multipli
Copyright SDA Bocconi 12

Enterprise and Equity Value
Enterprise Value (EV)= Equity Value + Net Debt
ENTERPRISE
VALUE
NET DEBT Market Value of equity= Share price x Number of shares in issue, for each class of share (including preference if d d t b it )
EQUITY VALUE
if deemed to be equity)
Net DebtSh t d L T D bt
ENTERPRISE VALUE- NET DEBT
= EQUITY VALUE
= Short and Long -Term Debt+ Finance Leases+ Other Interest Bearing Liabilities+ Preferred shares (if deemed to be debt)
Mi it i t t+ Minority interest- Cash- Liquid Short-Term Investments
Copyright SDA Bocconi 13

Multipli Equity side
MULTIPLI PROS CONS
S li i à di l l Diff i i i i bili
MULTIPLI PROS CONS
S li i à di l l Diff i i i i bili
Price/Earnings
Semplicità di calcolo Diffusione all’interno della comunità
finanziaria
Differenze nei principi contabili delle diverse imprese
Differenze nell’imposizione fiscale Differenze nella struttura finanziariaPrice/Earnings
Semplicità di calcolo Diffusione all’interno della comunità
finanziaria
Differenze nei principi contabili delle diverse imprese
Differenze nell’imposizione fiscale Differenze nella struttura finanziaria
PEG =PE/growth
Permette di normalizzare per la crescita
Molto utilizzato soprattutto per imprese che crescono ad elevati tassi di crescita
Come il P/E
PEG =PE/growth
Permette di normalizzare per la crescita
Molto utilizzato soprattutto per imprese che crescono ad elevati tassi di crescita
Come il P/E
Price/Book Value
Risulta particolarmente utile con riferimento alle imprese che appartengono a settori dove gli assettangibili sono la primaria fonte di generazione di valore (banche, assetmanagement)
Differenze nei principi contabili e nei livelli di leva finanziaria possono distorcere il valore assunto dal multiplo
management)management)
Copyright SDA Bocconi 14
Current, Trailing and Leading Multiples
PRICE
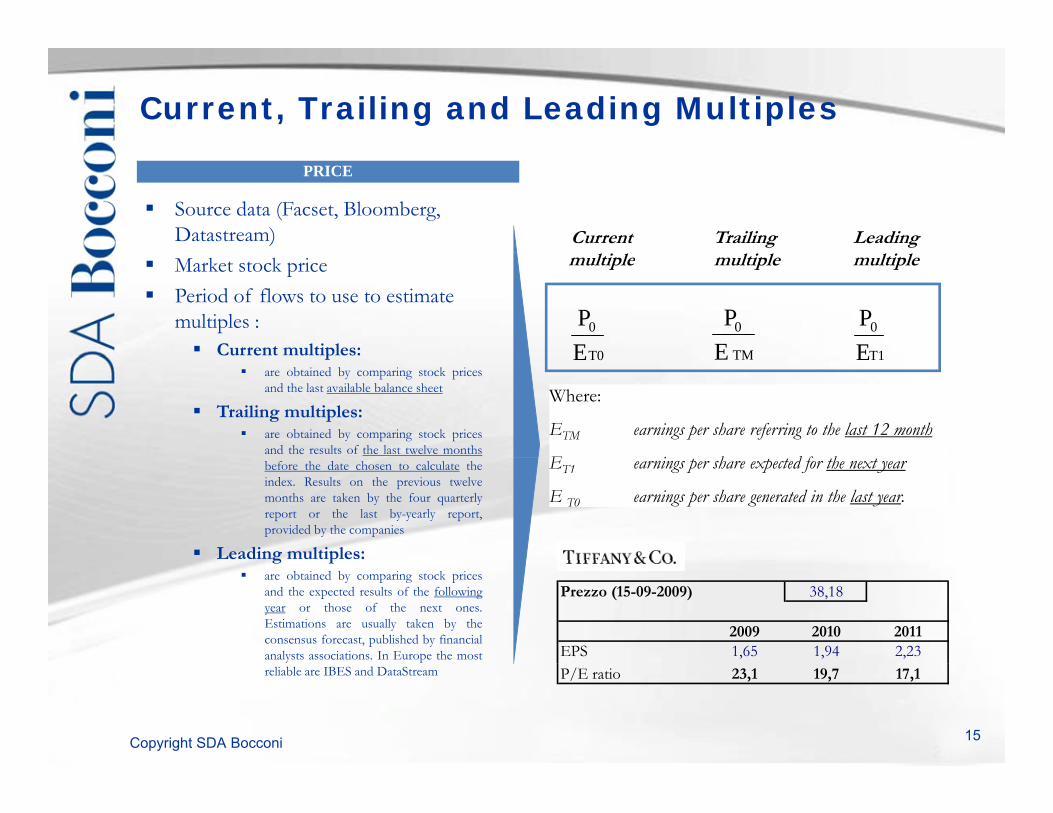
Source data (Facset, Bloomberg, Datastream) Current Trailing Leading
Market stock price Period of flows to use to estimate
multiples : Current multiples: T0
0
EP
TM
0
EP
T1
0
EP
multiple multiple multiple
p are obtained by comparing stock prices
and the last available balance sheet
Trailing multiples: are obtained by comparing stock prices
and the results of the last twelve months
T0E TME T1E
Where:
ETM earnings per share referring to the last 12 month
E i h d f hbefore the date chosen to calculate theindex. Results on the previous twelvemonths are taken by the four quarterlyreport or the last by-yearly report,provided by the companies
Leading multiples:
ET1 earnings per share expected for the next year
E T0 earnings per share generated in the last year.
g p are obtained by comparing stock prices
and the expected results of the followingyear or those of the next ones.Estimations are usually taken by theconsensus forecast, published by financialanalysts associations. In Europe the most
Prezzo (15-09-2009) 38,18
2009 2010 2011EPS 1,65 1,94 2,23
Copyright SDA Bocconi
reliable are IBES and DataStream P/E ratio 23,1 19,7 17,1
15
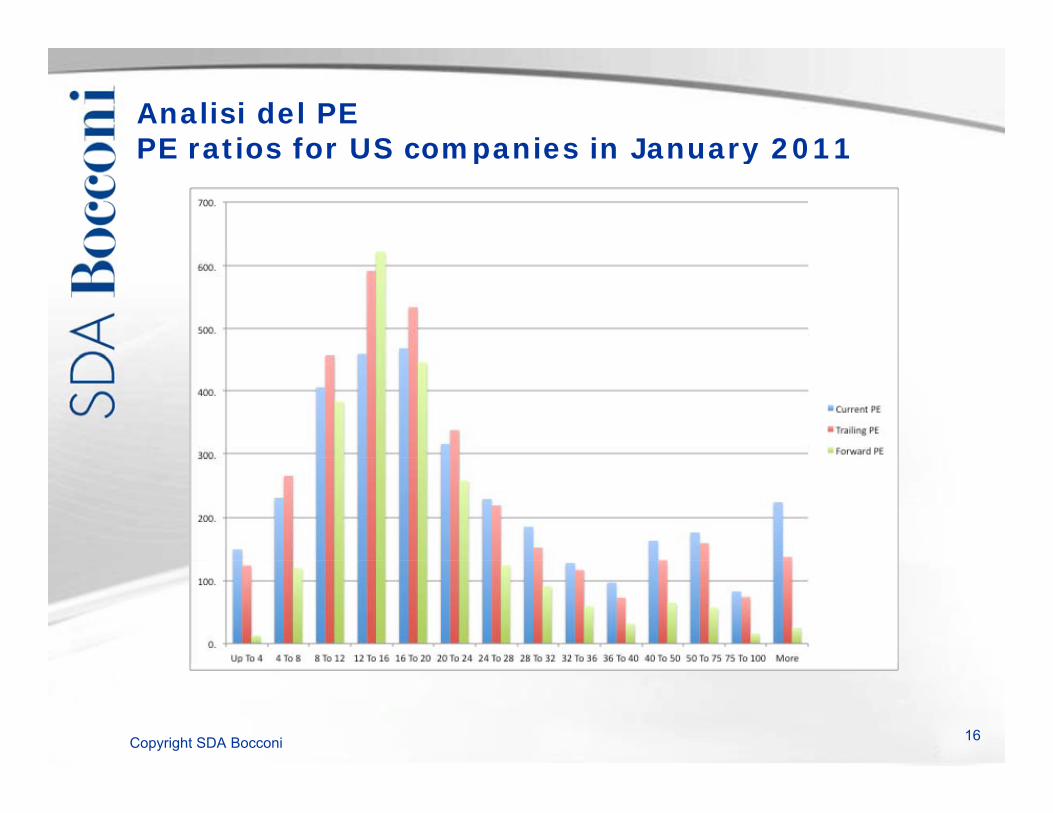
Analisi del PEPE ratios for US companies in January 2011PE ratios for US companies in January 2011
Copyright SDA Bocconi 16

Analisi del PE
Copyright SDA Bocconi 17

Analisi del PEUS, Europe, Japan and Emerging MarketsG i 2011Gennaio 2011
Copyright SDA Bocconi 18

P/E: i fondamentali T d t d th f d t l t t ith b i it di t d To understand the fundamentals, start with a basic equity discounted
cash flow model
With the dividend discount model:
gKgratiopayoutPE
EPSP
e
)1(*
0
0
gKgratiopayoutEPS
gkgDPSP
ee
)1(*)1(* 00
Proposition: Other things held equal, higher growth firms will have higher PEratios than lower growth firms. Proposition: Other things held equal, higher risk firms will have lower PE ratiosthan lower risk firmsthan lower risk firms Proposition: Other things held equal, firms with lower reinvestment needs willhave higher PE ratios than firms with higher reinvestment rates. Of course, other things are difficult to hold equal since high growth firms, tendto have risk and high reinvestment rates
Copyright SDA Bocconi
to have risk and high reinvestment rates.
19
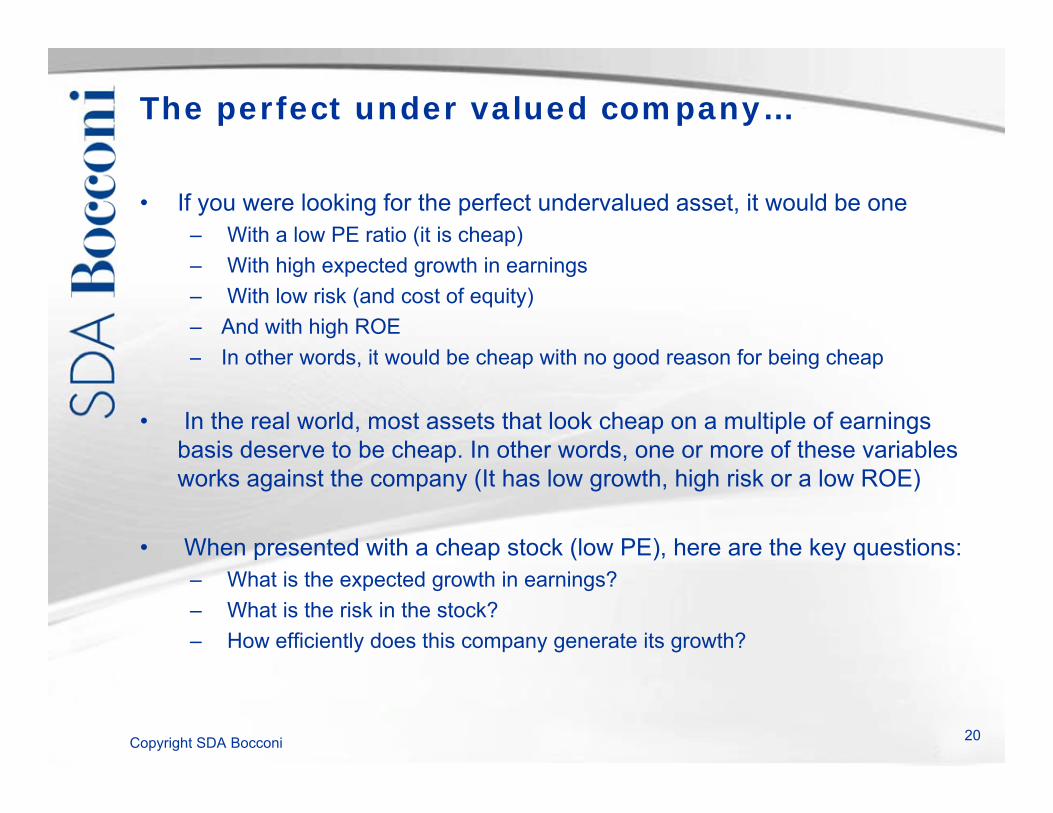
The perfect under valued company…
• If you were looking for the perfect undervalued asset, it would be one– With a low PE ratio (it is cheap)– With high expected growth in earnings– With low risk (and cost of equity)– And with high ROE
In other words it would be cheap with no good reason for being cheap– In other words, it would be cheap with no good reason for being cheap
• In the real world, most assets that look cheap on a multiple of earningsbasis deserve to be cheap. In other words, one or more of these variablesp ,works against the company (It has low growth, high risk or a low ROE)
• When presented with a cheap stock (low PE), here are the key questions:– What is the expected growth in earnings?– What is the risk in the stock?– How efficiently does this company generate its growth?
Copyright SDA Bocconi 20

Comparing PE ratios across firms in a sector
Copyright SDA Bocconi 21
A question
• You are reading an equity research report on this sector, and the analyst claims that Andres Wine and Hansen Natural are under valued because th h l PE tithey have low PE ratios.
• Would you agree?
• � Yes• � No
Wh h ?• � Why or why not?
Copyright SDA Bocconi 22
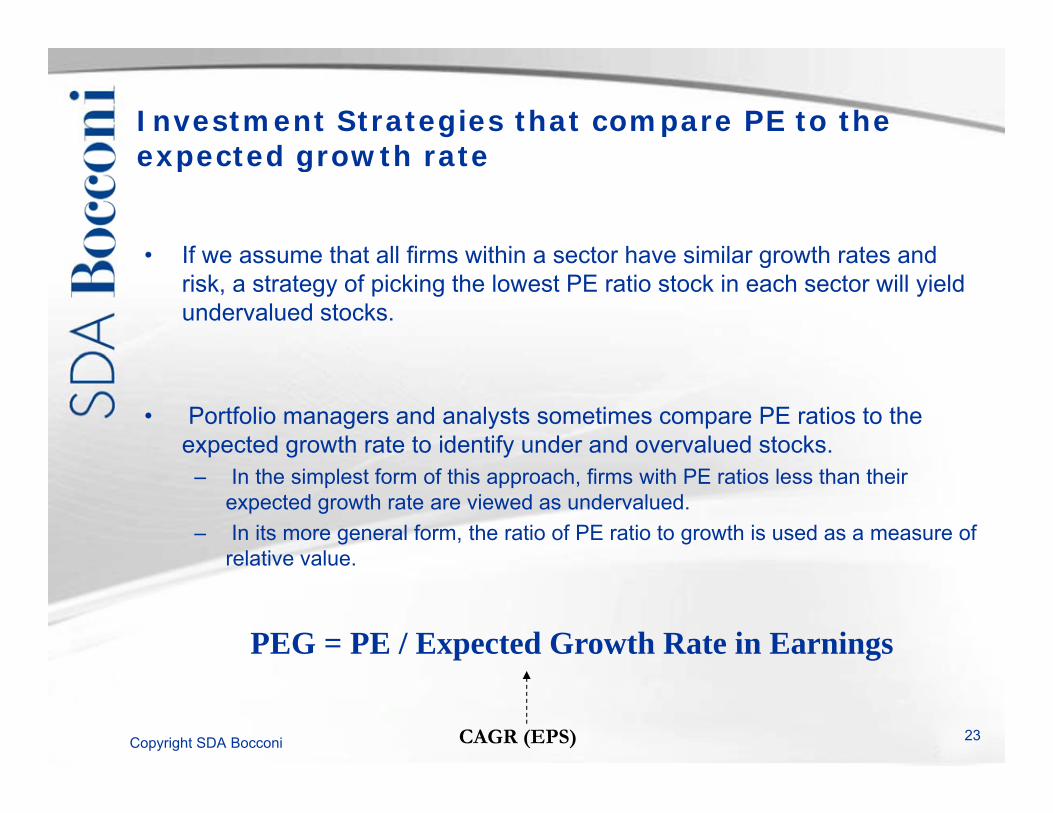
Investment Strategies that compare PE to the expected growth rateexpected growth rate
• If we assume that all firms within a sector have similar growth rates and• If we assume that all firms within a sector have similar growth rates and risk, a strategy of picking the lowest PE ratio stock in each sector will yieldundervalued stocks.
• Portfolio managers and analysts sometimes compare PE ratios to the expected growth rate to identify under and overvalued stocks.
– In the simplest form of this approach, firms with PE ratios less than theirexpected growth rate are viewed as undervalued.
– In its more general form, the ratio of PE ratio to growth is used as a measure ofrelative valuerelative value.
PEG = PE / Expected Growth Rate in Earnings
Copyright SDA Bocconi 23CAGR (EPS)

PEG Ratios: The Beverage Sector
Copyright SDA Bocconi 24

PEG Ratios: Reading the Numbers
The average PEG ratio for the beverage sector is 2.00. The lowestPEG ratio in the group belongs to Hansen Natural, which has a PEG
ti f 0 57 U i thi f l H N t l iratio of 0.57. Using this measure of value, Hansen Natural is
� the most under valued stock in the group� the most over valued stock in the groupg p� What other explanation could there be for Hansen’s low PEG ratio?
PEG ratios will be lower for high growth companiesPEG ti ill b l f hi h i k i
Analyzing PE/Growth
PEG ratios will be lower for high risk companies
Copyright SDA Bocconi 25

PEG Ratios and Fundamentals: Propositions
• Proposition 1: High risk companies will trade at much lower PEG ratiosthan low risk companies with the same expected growth rate.
– Corollary 1: The company that looks most under valued on a PEG ratio basis in a sector may be the riskiest firm in the sector
• Proposition 2: Companies that can attain growth more efficiently byinvesting less in better return projects will have higher PEG ratios thancompanies that grow at the same rate less efficiently.
– Corollary 2: Companies that look cheap on a PEG ratio basis may becompanies with high reinvestment rates and poor project returns.
– Proposition 3: Companies with very low or very high growth rates will tend to– Proposition 3: Companies with very low or very high growth rates will tend tohave higher PEG ratios than firms with average growth rates.
Copyright SDA Bocconi 26

PEG Ratios: an exampleDucati
Copyright SDA Bocconi
PUNTI CHIAVE Calcolo del CAGR(Eps) Calcolo del PEG 27

PEG Ratios: an exampleDucati
P/E 2007 = 45,4 x2007 ,Eps 2007 = 0,043Eps 2009 = 0,125
CAGR (Eps) = %7010430125,0109
EpsEps
PEG =
043,007 Eps
164,04,45
PEPEG = 164,0
70)(
EpsCAGR
Copyright SDA Bocconi 28

PEG Ratios: Tiffany
Prezzo (15-09-2009) 38,18
2009 2010 2011EPS 1,65 1,94 2,23P/E ratio 23,1 19,7 17,1CAGR (Eps) 0,18 0,16
PEG CAGR (EPS)EV/EBITDA EPS P/E
PEG 1,1 1,1
Recent Price ($) Mkt Cap. 2008A 2009E 2010E 2009E 2010E 2011E 2009E 2010E 2011E 2010E 2011E 2010E 2011ELuxury/AccessoriesBurberry 4,71 3.392$ 8,7x 8,8x 8,0x 0,29 0,31 0,35 16,2 15,2 13,5 2,2 1,4 6,9 9,9Hermes 101,00 15.600$ 19,7x 19,3x 18,1x 2,76 3,00 3,35 36,6 33,7 30,1 3,9 3,0 8,7 10,2LVMH 69,10 49.533$ 8,9x 9,8x 9,2x 3,71 4,05 4,64 18,6 17,1 14,9 1,9 1,3 9,2 11,8Media 23,82 21,97 19,50 2,65 1,86Mediana 18,63 17,06 14,89 2,20 1,36
Tiffany 38,18 4.754$ 7,9x 9,9x 8,5x 1,65 1,94 2,23 23,1 19,7 17,1 1,1 1,1 17,6 16,3
Copyright SDA Bocconi 29

Price-Book Value Ratio: Fondamentali
ROEbROEP )1(
Payout ratio Payout ratio
gKebBVROE
gKebEP
)1()1(
gKegROE
gKebROE
BVP
)1(
bbbb
Se ROE=Ke allora 1BVP
The price-book value ratio of a stable firm is determined by the differential between thereturn on equity and the required rate of return on its projects
Copyright SDA Bocconi 30

Multipli Asset side
PROSMULTIPLI CONS
Utile per taluni settori nei quali le vendite sono una variabile
Presuppone implicitamente una omogeneit à nel profilo di profittabilit à
PROSMULTIPLI CONS
Utile per taluni settori nei quali le vendite sono una variabile
Presuppone implicitamente una omogeneit à nel profilo di profittabilit à
EV/ Sales
vendite sono una variabile importante
Margini, cash flow negativi
omogeneit à nel profilo di profittabilit àtra le diverse imprese
Può essere considerato una proxy del cash flow operativo (ante capex )
Non permette di prendere in considerazione la dotazione di capitale
EV/ Sales
vendite sono una variabile importante
Margini, cash flow negativi
omogeneit à nel profilo di profittabilit àtra le diverse imprese
Può essere considerato una proxy del cash flow operativo (ante capex )
Non permette di prendere in considerazione la dotazione di capitale p ( p )
Non risente in maniera evidente delle diverse politiche contabili
pdelle societ à analizzate (sopra/sottovalutazione in funzione dell ’ammontare degli ammortamenti)
EV/EBITDA
Permette di prendere in considerazione le differenze nella
Rischi relativi alle differenze contabili nel trattamento degli ammortamenti
p ( p ) Non risente in maniera evidente delle
diverse politiche contabili
pdelle societ à analizzate (sopra/sottovalutazione in funzione dell ’ammontare degli ammortamenti)
EV/EBITDA
Permette di prendere in considerazione le differenze nella
Rischi relativi alle differenze contabili nel trattamento degli ammortamenti
Non risente in maniera evidente delle diverse politiche contabili
No dati sintetici, maggiore laboriosit ànel calcolo
dotazione di capitale E’ un indicatore della redditivit à
operativa dell ’impresa
gEV/EBIT
Non risente in maniera evidente delle diverse politiche contabili
No dati sintetici, maggiore laboriosit ànel calcolo
dotazione di capitale E’ un indicatore della redditività
operativa dell ’impresa
gEV/EBIT
EV/FCOd d v p b
Riflette la maggiore o minore capacit à dell ’impresa di generare flussi di cassa positivi
Rischio di essere poco efficaci, a causa dell ’eccessiva volatilit à che le fluttuazioni nelle voci del cash flow possono ingenerare
EV/FCOd d v p b
Riflette la maggiore o minore capacit à dell ’ impresa di generare flussi di cassa positivi
Rischio di essere poco efficaci, a causa dell ’eccessiva volatilit à che le fluttuazioni nelle voci del cash flow possono ingenerare
Copyright SDA Bocconi 31

III. Interpretazione e scelta dei multipli
Copyright SDA Bocconi 32

Interpretazione e scelta dei multipli
Non esistono regole di scelta ma solo il giudizio e il buon senso delvalutatore
Fondamentale ovviamente la comparabilità del business
I multipli di Enterprise Value (in particolare EV/EBITDA) sonogeneralmente più utilizzati perché indipendenti dalla struttura finanziaria egeneralmente più utilizzati perché indipendenti dalla struttura finanziaria erisentono in maniera meno forte delle politiche contabili (eccezione settorebanche)
O i t t l Orizzonte temporale Ultimo anno, LTM, anno corrente, anno corrente + 1
In generale il multiplo da applicare ai dati della società oggetto dig p pp ggvalutazione: Selezione dei multipli più coerenti con l’oggetto di valutazione Multiplo medio (semplice o ponderato) Eliminazione degli estremi
Copyright SDA Bocconi
Eliminazione degli estremi
33

Conventional usage…
Copyright SDA Bocconi 34
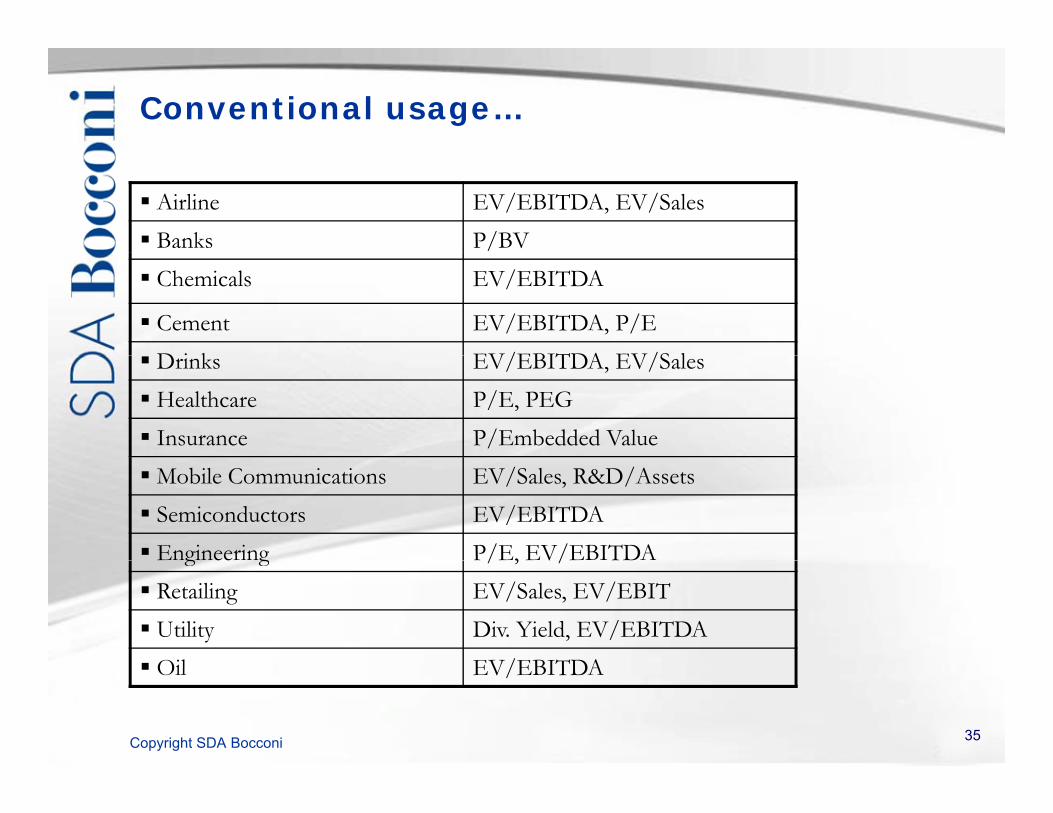
Conventional usage…
Airline EV/EBITDA, EV/Sales Banks P/BV Chemicals EV/EBITDA
Cement EV/EBITDA, P/ED i k EV/EBITDA EV/S l Drinks EV/EBITDA, EV/Sales Healthcare P/E, PEG Insurance P/Embedded ValueMobile Communications EV/Sales, R&D/Assets Semiconductors EV/EBITDA Engineering P/E, EV/EBITDAg g / , / Retailing EV/Sales, EV/EBIT Utility Div. Yield, EV/EBITDA Oil EV/EBITDA
Copyright SDA Bocconi
Oil EV/EBITDA
35

Applicazione metodo dei multipliEquity Report - Tod’s 2009
PUNTI CHIAVE Applicazione del metodo dei multipli Combinazione dei multipli Sensitivity analysis
LVMH Burberry AverageEV/Sales 1,58 1,13 1,4EV/EBITDA 6,81 5,90 6,4EV/EBIT 8,27 7,32 7,8P/E 12 35 10 10 11 2
Sensitivity analysis Valutazione attraverso l’utilizzo del PEG
P/E 12,35 10,10 11,2EBITDA margin (%) 23,20% 19,10%EBIT margin (%) 19,10% 15,40%
2009F (€m) Tod's EV Net Debt '09 Equity ValueSales 703,8 EV/Sales 1,4 953,6 106 1.059,6
Multiplo, / , , ,
EBITDA 141,5 EV/EBITDA 6,4 905,4 106 1.011,4 EBIT 110,2 EV/EBIT 7,8 859,0 106 965,0 Net Profit 72,1 P/E 11,2 809,3 EBITDA margin (%) 20,10% Average 961 EBIT margin (%) 15,70% Value/share 30,0
Method TP weightsDCF 41,6 50%Multipli 30,0 50%
31,6 5,4 6,4 7,415% 21,13 24,43 27,7320% 27,18 31,61 36,0325% 33 00 38 50 44 00
EV/EBITDA
Ebi
tda
Mar
gin
Copyright SDA Bocconi
35,8 Valutazione complessiva 25% 33,00 38,50 44,00E M
36

V. Applicazione del metodo dei multipli: caso Abercrombie
Copyright SDA Bocconi 37

Collocazione strategica dei comps
Copyright SDA Bocconi 38

Multipli di borsa dei principali comps
EV/Ricavi (x) EV/Ebitda (x) EV/Ebit (x) P/E (x)
2009E 2010E 2011E 2009E 2010E 2011E 2009E 2010E 2011E 2009E 2010E 2011ESocietà
Manutailer
Benetton 0,8x 0,8x 0,8x 5,5x 5,3x 5,2x 8,3x 8,1x 7,9x 8,7x 8,7x 8,2xInditex 2,3x 2,1x 1,9x 10,7x 9,5x 8,5x 15,5x 13,8x 12,1x 21,2x 18,9x 16,8xStefanel 0,7x n.a. n.a. n.m. n.a. n.a. n.a. n.a. n.a. n.a. n.a. n.a.Retailer integrati
Aber. & Fitch 0,9x 0,9x 0,8x 7,3x 5,8x 4,7x 17,7x 11,2x 8,2x n.a. 20,8x 14,1xBasic Net 1,2x n.a. n.a. 5,7x n.a. n.a. 7,1x n.a. n.a. 7,0x n.a. n.a.Charl. Voegele 0,3x 0,3x 0,3x 5,3x 4,0x 3,3x n.a. 10,4x 7,7x n.a 19,5x 11,2xEsprit 1,8x 1,7x 1,5x 9,2x 8,1x 6,9x 10,3x 9,0x 7,6x 14,2x 12,8x 10,9xG 0 8 0 8 0 8 4 8 4 7 4 6 6 3 5 9 6 1 12 7 11 8 11 5Gap 0,8x 0,8x 0,8x 4,8x 4,7x 4,6x 6,3x 5,9x 6,1x 12,7x 11,8x 11,5xH&M 3,2x 3,0x 2,6x 13,4x 11,7x 10,3x 14,8x 12,9x 11,4x 20,8x 18,2x 16,0xPure retailer
Debenhams 0,6x 0,6x 0,6x n.a. 5,2x 4,9x n.a. 8,0x 7,4x n.a. 8,5x 7,4xGruppo Coin 0,7x 0,7x 0,7x 8,1x 7,0x 5,4x 20,8x 13,5x 8,9x n.a 18,5x 10,2xNext 1,3x 1,3x 1,2x 6,6x 6,5x 6,2x 8,3x 8,1x 7,7x 10,7x 10,3x 9,7xNext 1,3x 1,3x 1,2x 6,6x 6,5x 6,2x 8,3x 8,1x 7,7x 10,7x 10,3x 9,7x
Copyright SDA Bocconi 39

Multipli di borsa dei principali comps
L l t i d ll S i tà è i di ti l t ll ti f iLa valutazione della Società è quindi articolata nelle seguenti fasi:•selezione delle società comparabili;•stima dei multipli di mercato delle società comparabili;•identificazione dei parametri cui riferire la valutazione;
ti d ll’E t i V l•stima dell’Enterprise Value;•passaggio dall’Enterprise Value all’Equity Value
Copyright SDA Bocconi 40

Multipli di borsa dei principali comps2009E 2010E 2011E
EV/Ricavi (x)
2009E 2010E 2011EManutailer - multipli
Min 0,7x 0,8x 0,8x
Mediana 0,8x 1,4x 1,3x
Media 1,3x 1,4x 1,3x
Max 2 3x 2 1x 1 9x
2009E 2010E 2011E
Manutailer
Benetton 0,8x 0,8x 0,8x
Società
Max 2,3x 2,1x 1,9x
Retailer integrati - multipli
Min 0,3x 0,3x 0,3x
Mediana 1,0x 0,9x 0,8x
Media 1 4x 1 3x 1 2xInditex 2,3x 2,1x 1,9xStefanel 0,7x n.a. n.a.Retailer integrati
Aber. & Fitch 0,9x 0,9x 0,8xBasic Net 1,2x n.a. n.a.
Media 1,4x 1,3x 1,2x
Max 3,2x 3,0x 2,6x
Pure retailer - multipli
Min 0,6x 0,6x 0,6x
Mediana 0,7x 0,7x 0,7x,Charl. Voegele 0,3x 0,3x 0,3xEsprit 1,8x 1,7x 1,5xGap 0,8x 0,8x 0,8xH&M 3,2x 3,0x 2,6xPure retailer
, , ,
Media 0,9x 0,8x 0,8x
Max 1,3x 1,3x 1,2x
Blended - multipli
Min 0,3x 0,3x 0,3xPure retailer
Debenhams 0,6x 0,6x 0,6xGruppo Coin 0,7x 0,7x 0,7xNext 1,3x 1,3x 1,2x
Mediana 0,9x 0,8x 0,8x
Media 1,2x 1,2x 1,1x
Max 3,2x 3,0x 2,6x
Blended - multipli
Copyright SDA Bocconi 41
Min 0,3x 0,3x 0,3x
Mediana (excl. Abercrombie) 0,8x 0,8x 0,8x
Media (excl. Abercrombie) 1,2x 1,2x 1,2x
Max 3,2x 3,0x 2,6x

Multipli di borsa dei principali compsDati finanziari 2009-10
ml/$ 2009 2010E
Ricavi 3.484 2.929
Ebitda 732 390
Ebit 507 151
Utile netto 314 99
P i i Fi i i N (422 0)Posizione Finanziaria Netta (422,0)
Valutazione Trading Multiples
1. Valutazione con multiplo EV/Ricavi (x)
Retailer Integrati BlendedRetailer Integrati Blended
Mediana Mediana
ml/€ 2009 2010E 2009 2010E
A. Ebitda 3.484 2.929 3.484 2.929
B. Multipli EV/Ricavi (x) 1,0x 0,9x 0,8x 0,8x
C. Enterprise Value (A*B) 3.580,9 2.494,2 2.832,2 2.403,7
D. PFN @ 31.12.2009 (422,0) (422,0) (422,0) (422,0)
Copyright SDA Bocconi 42
E. Equity Value (C-D) 4.002,9 2.916,2 3.254,2 2.825,7
Number of shares 89,9Prezzo per azione 45 32 36 31
Top Related