


Languages
Pages
Legal

La Niña impacts on Pacific Northwest climate in spring:
2011 and the historical record
Jim Johnstone
JISAO-UW

Niño 3.4 index
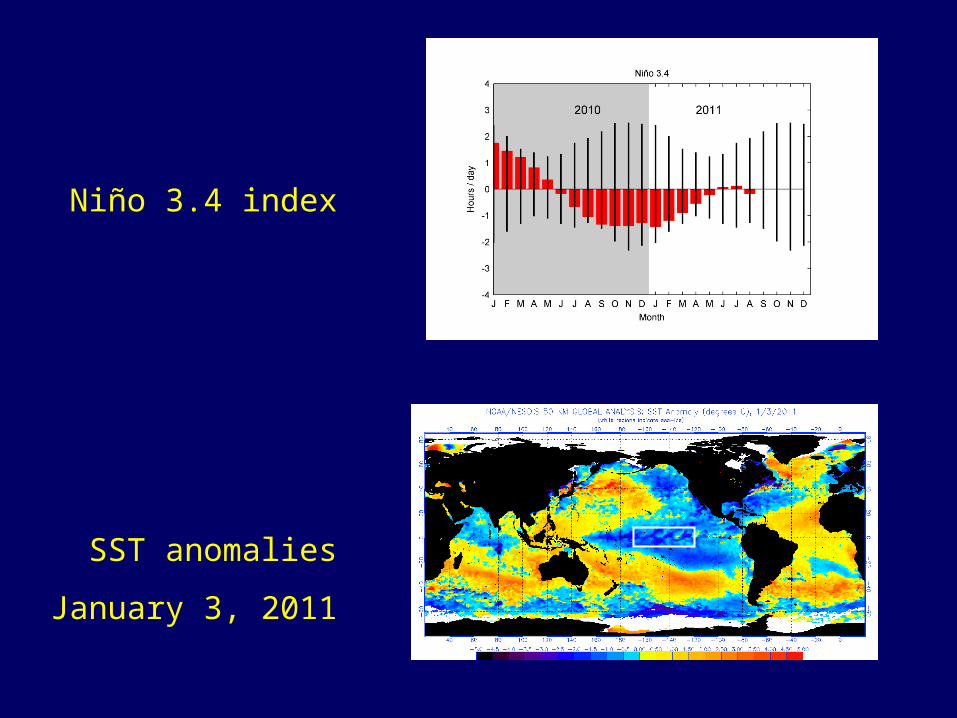
Niño 3.4 index
SST anomalies
January 3, 2011
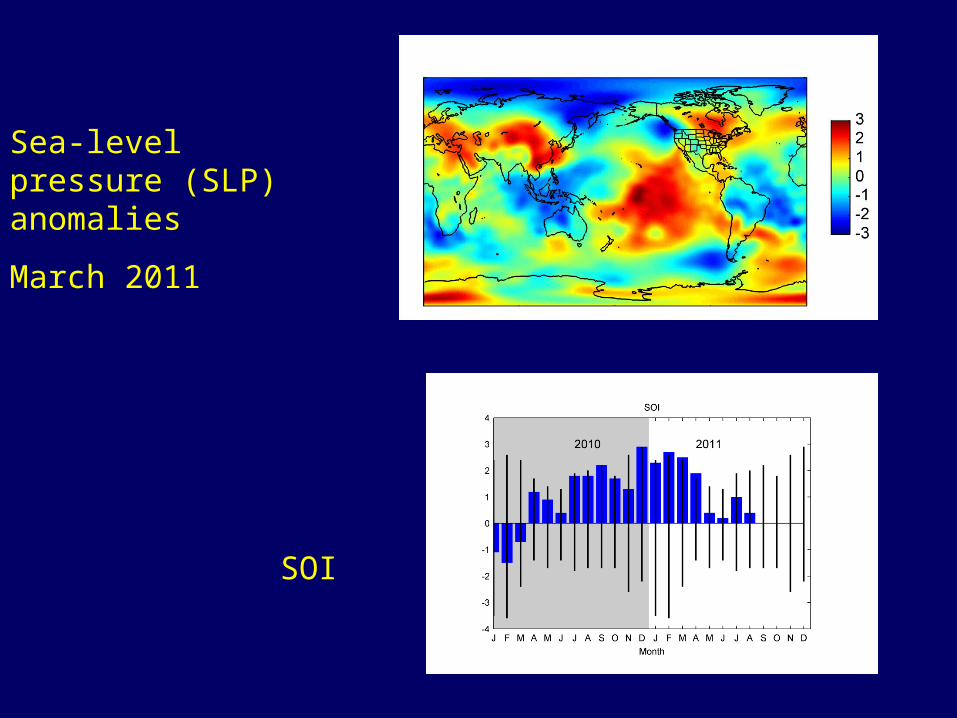
Sea-level pressure (SLP) anomalies
March 2011
SOI
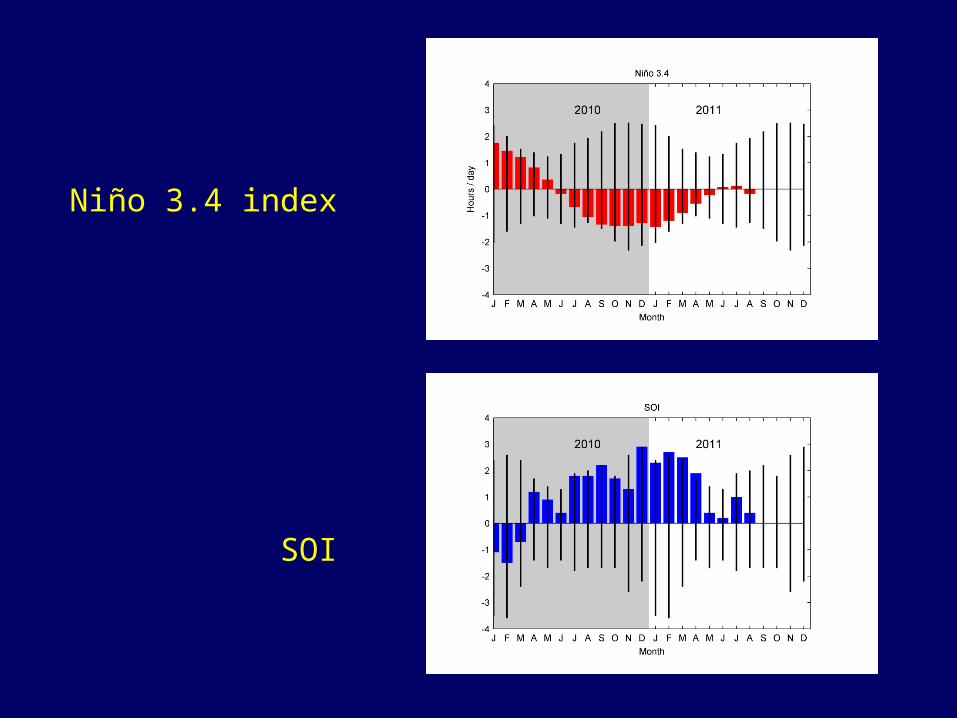
Niño 3.4 index
SOI
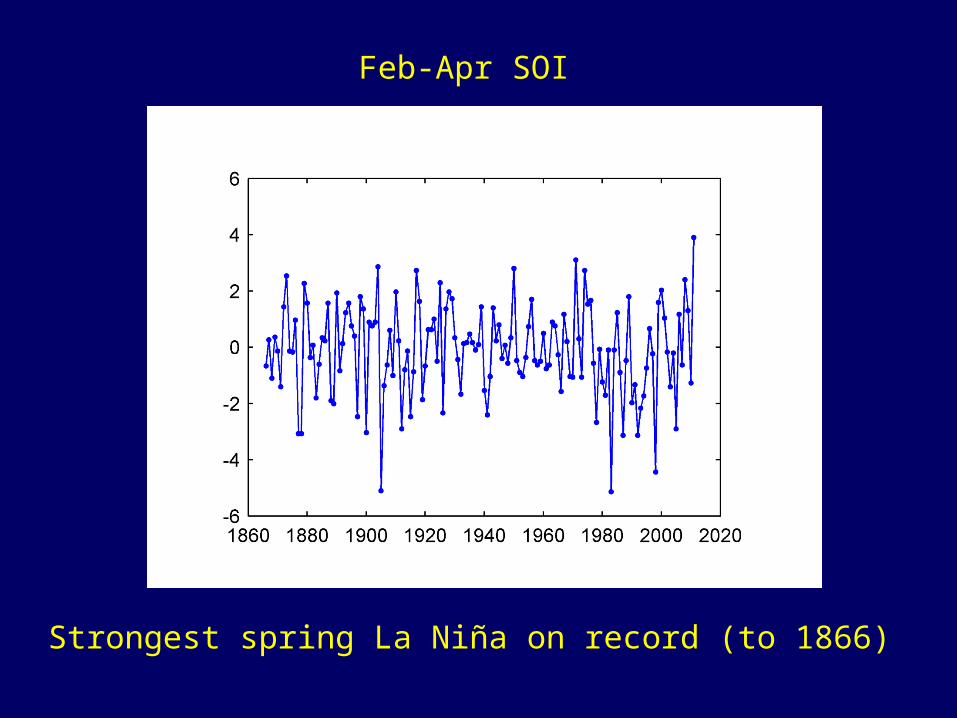
Feb-Apr SOI
Strongest spring La Niña on record (to 1866)
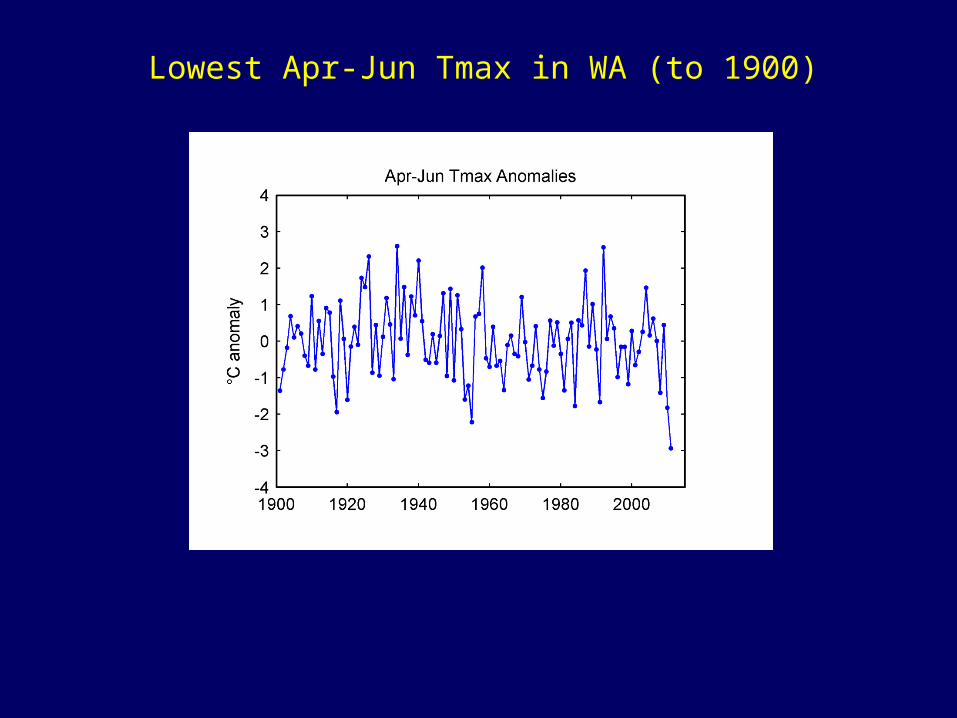
Lowest Apr-Jun Tmax in WA (to 1900)
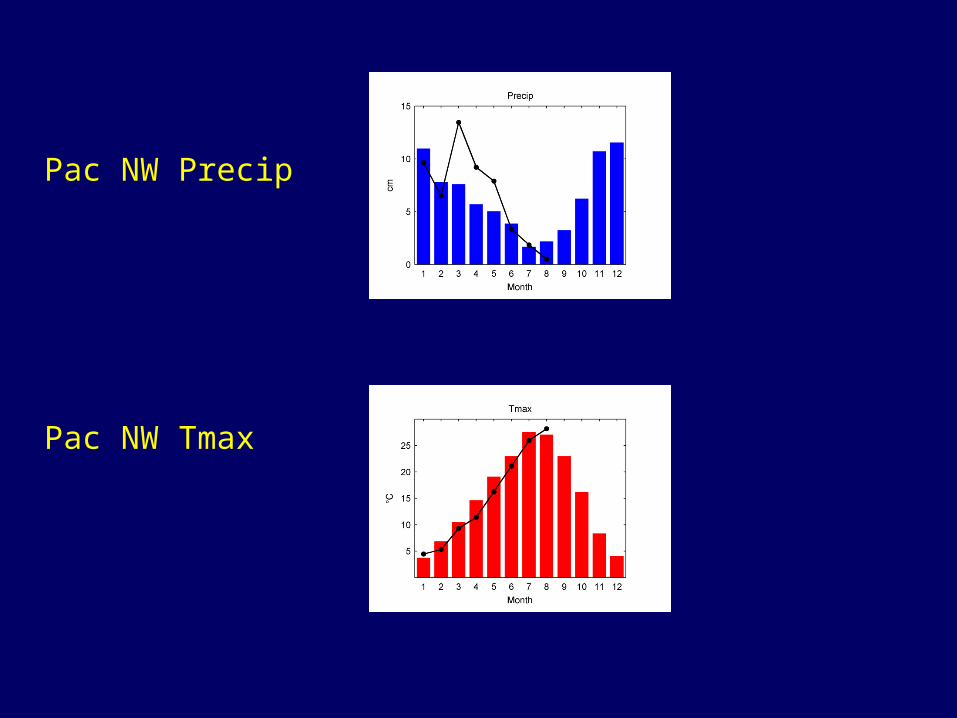
Pac NW Precip
Pac NW Tmax
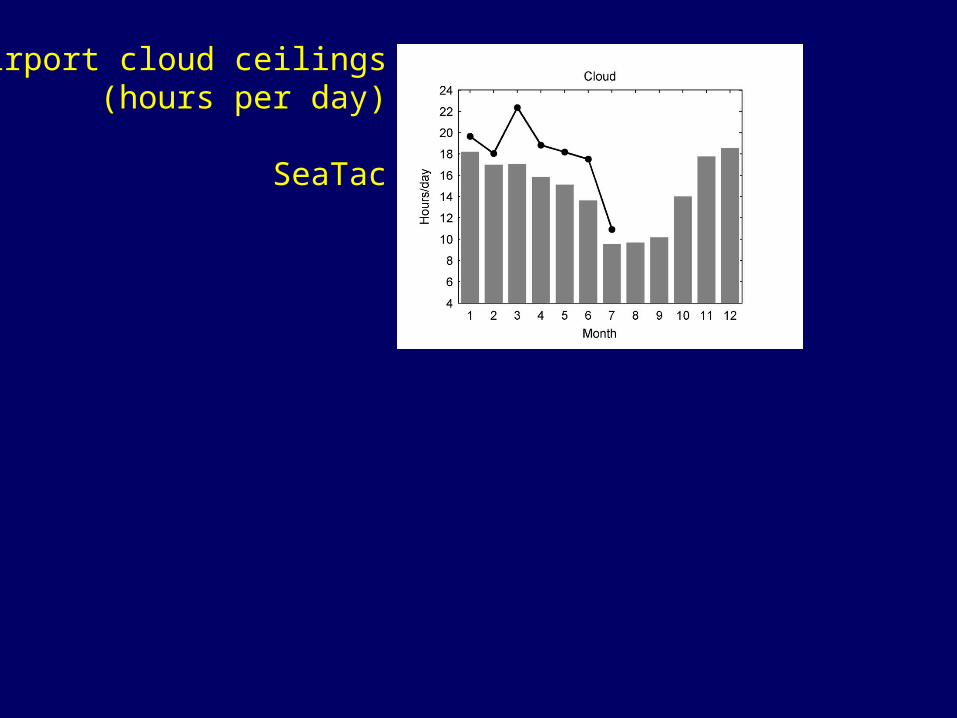
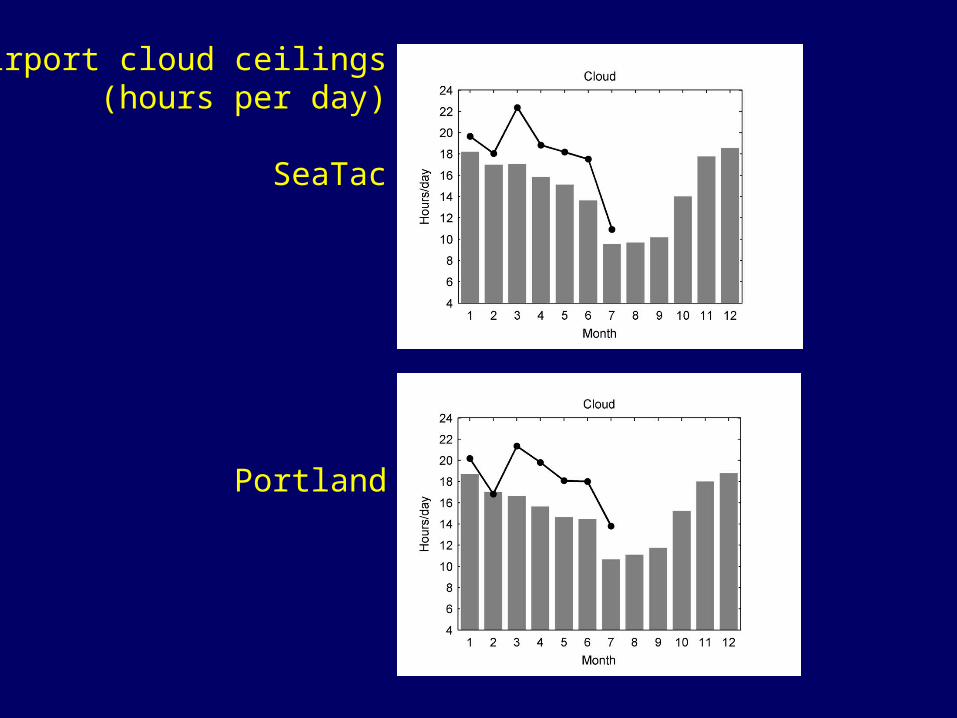
Airport cloud ceilings(hours per day)
SeaTac
Airport cloud ceilings(hours per day)
SeaTac
Portland
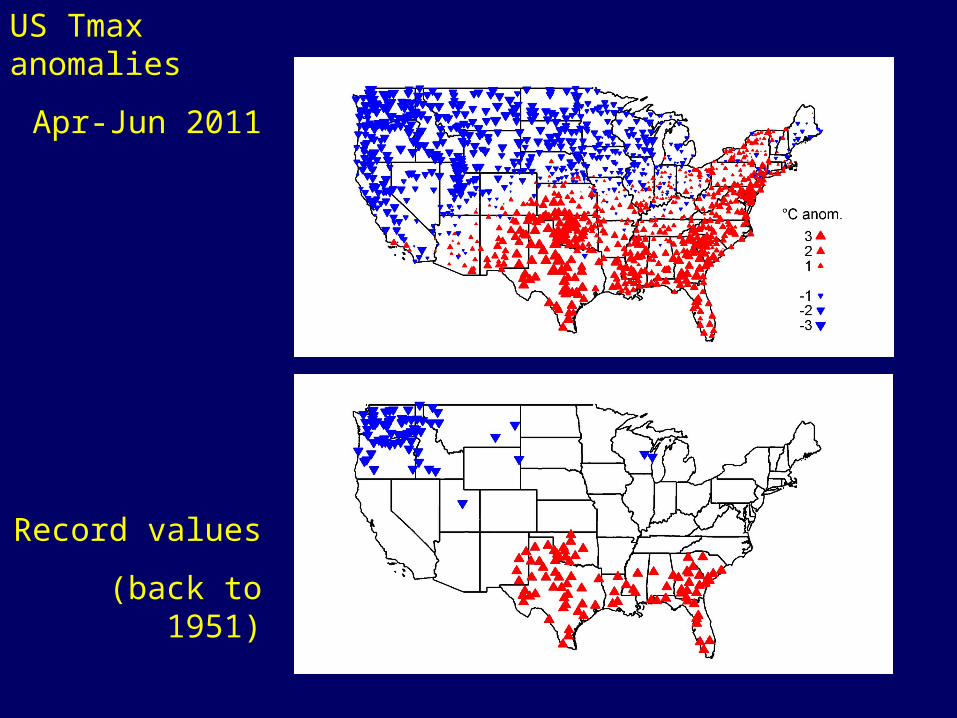
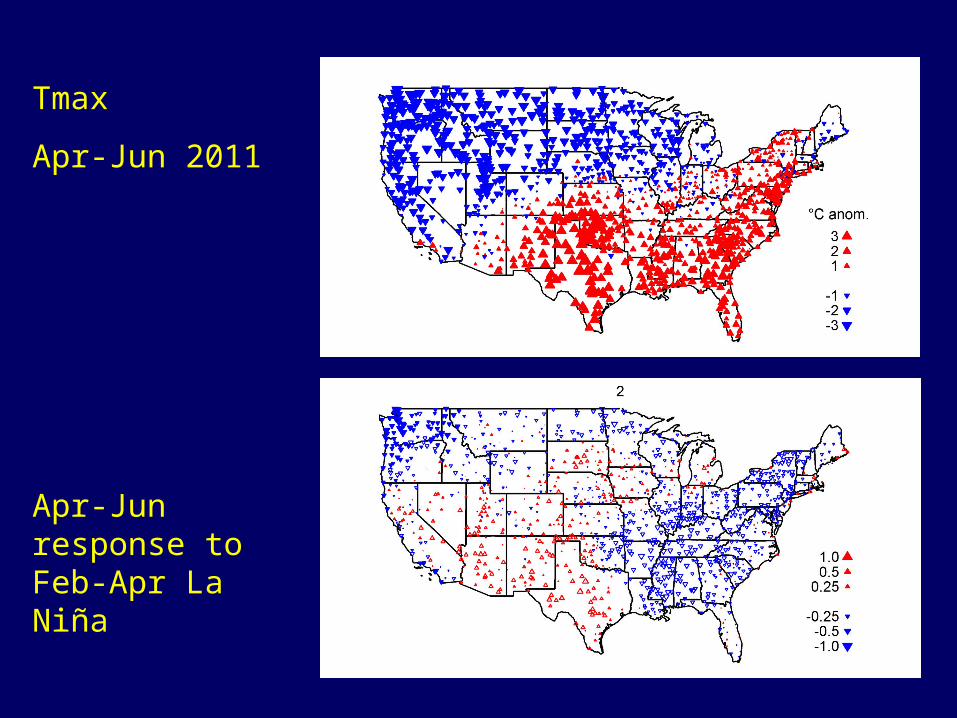
US Tmax anomalies
Apr-Jun 2011
Record values
(back to 1951)

Texas drought
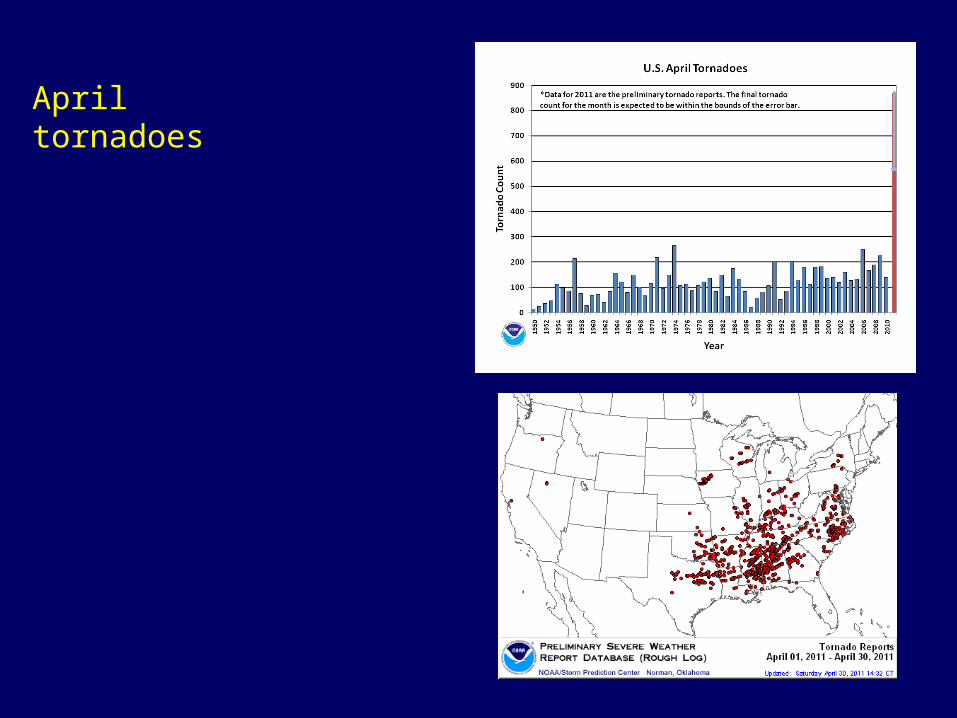
April tornadoes
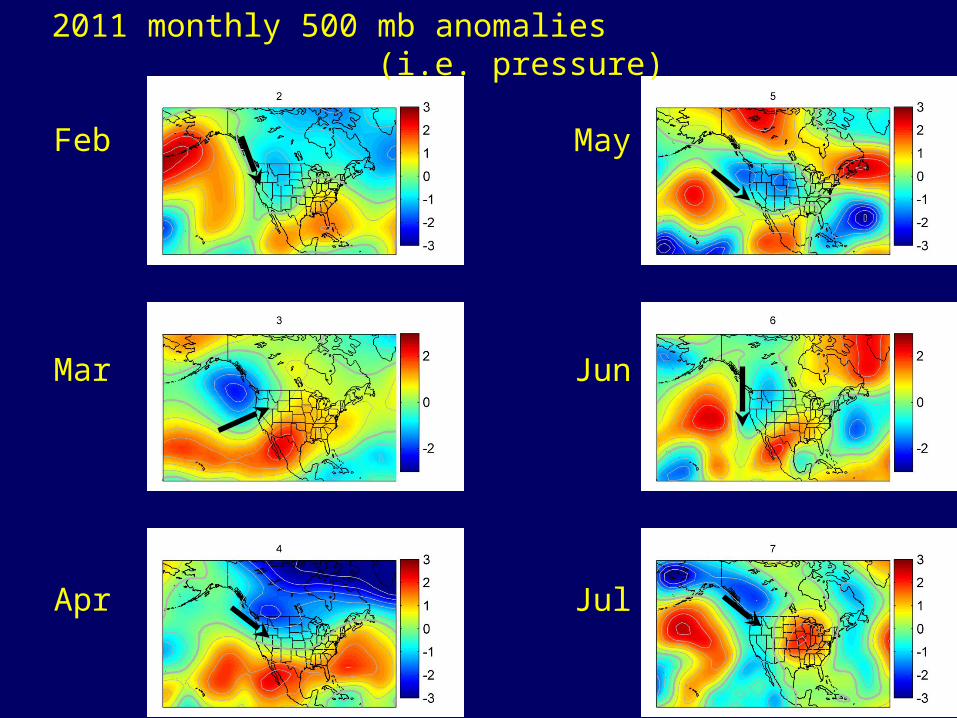
2011 monthly 500 mb anomalies (i.e. pressure)
Feb
Mar
Apr
May
Jun
Jul
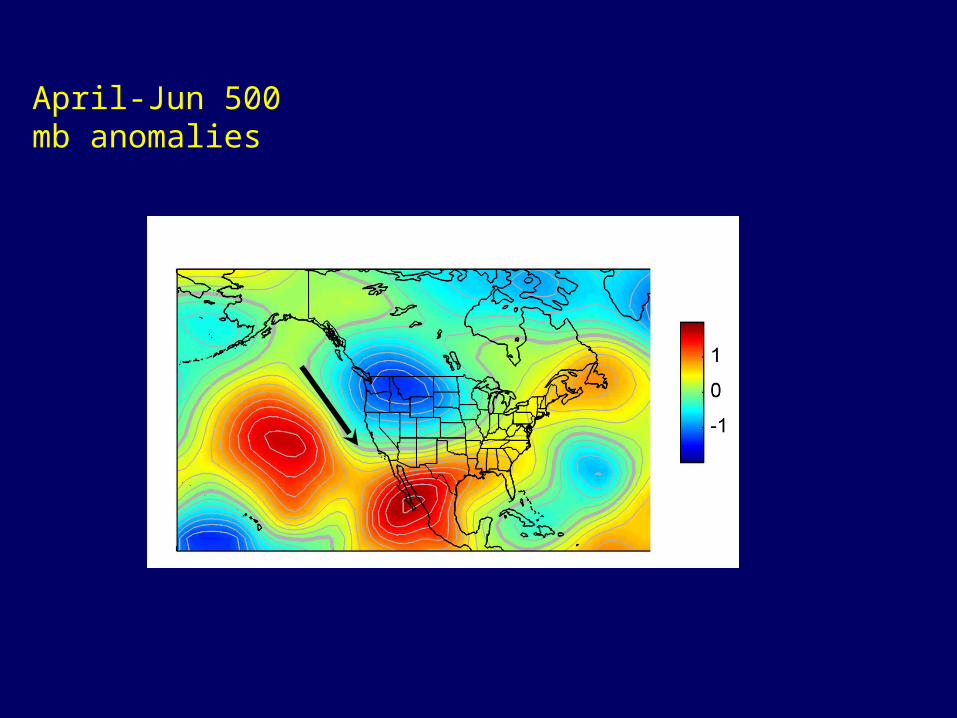
April-Jun 500 mb anomalies
Strong La Niña that persisted into April
Persistent and strong anomalies over the Pacific NW (and beyond) through June
Cause and effect?
Do Feb-Apr La Niña conditions occur with Apr-Jun anomalies over the Pacific NW?

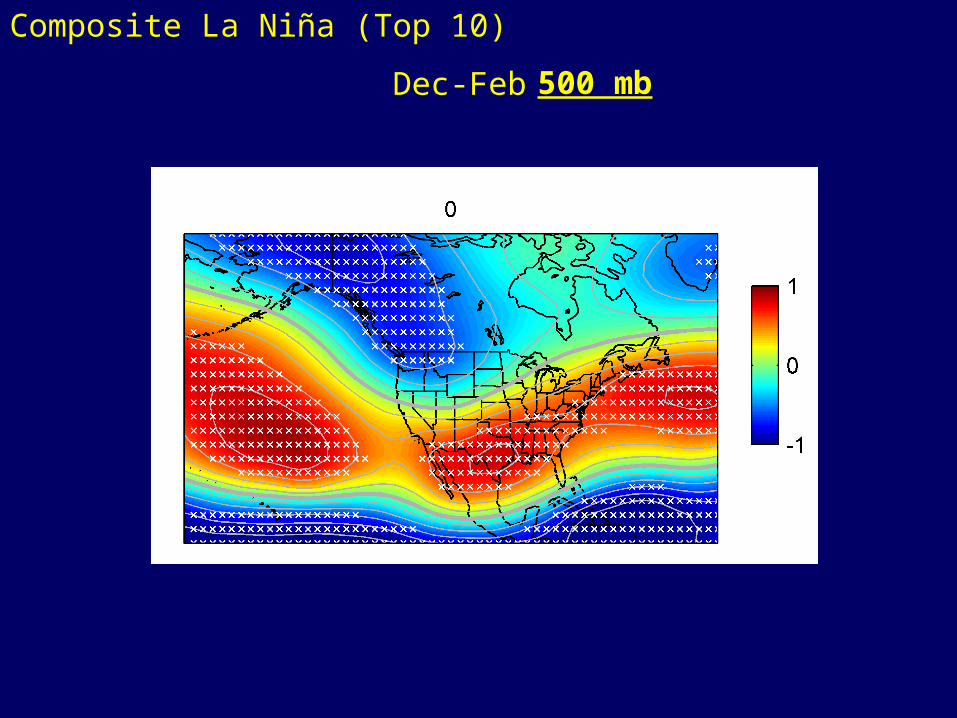
Composite La Niña (Top 10)
Dec-Feb 500 mb
Composite La Niña (Top 10)
Dec-Feb 500 mb

Winter La Niña composites (Dec-Feb)
Precip
Tmax
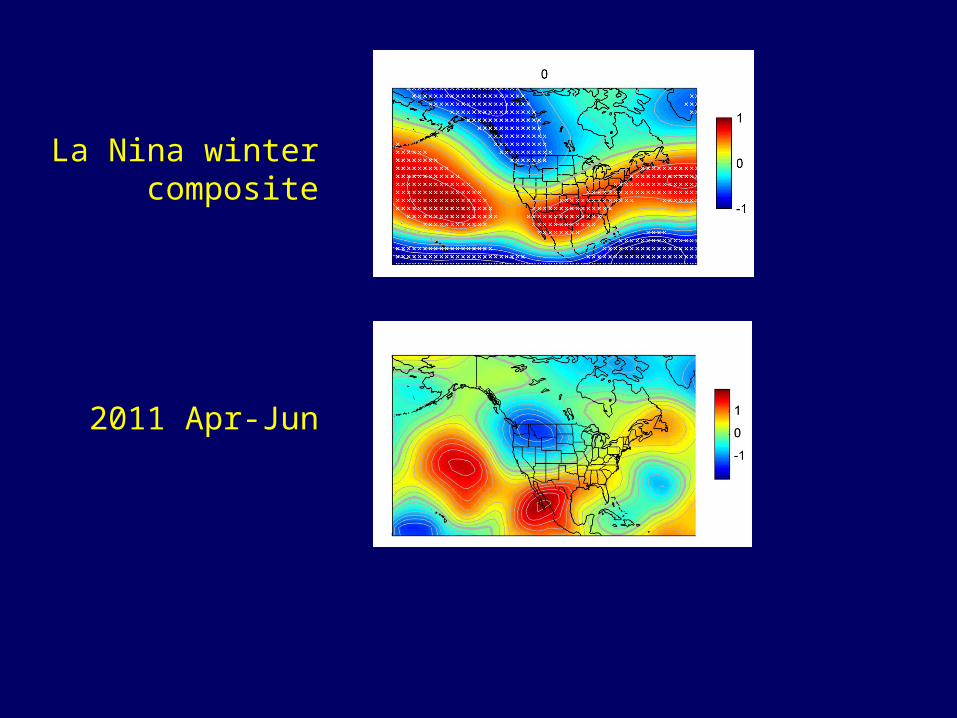
La Nina winter composite
2011 Apr-Jun

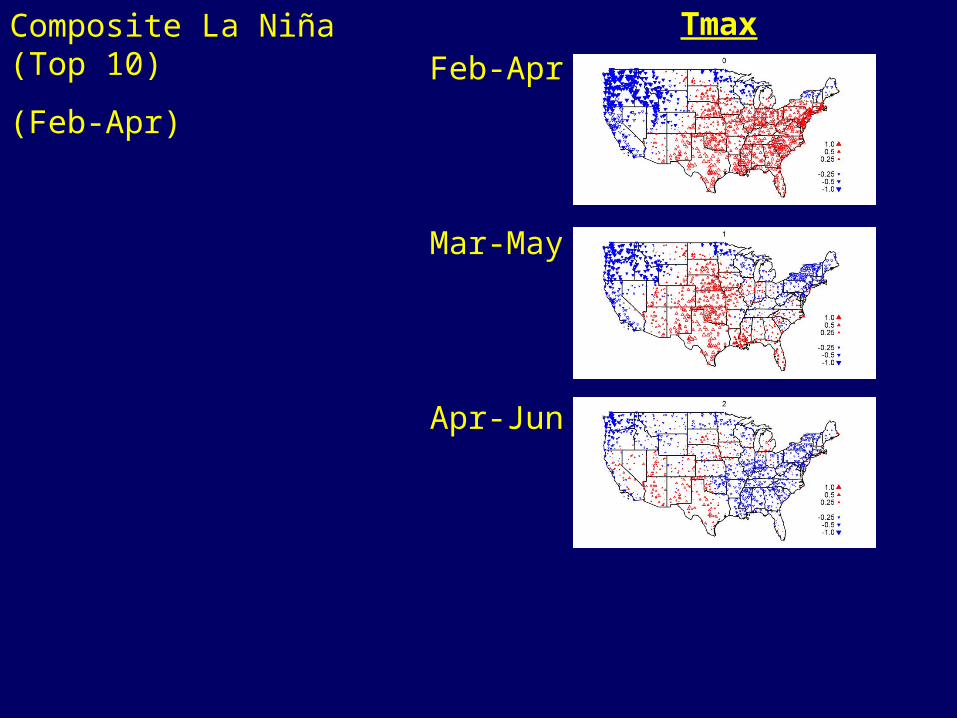
Composite La Niña (Top 10)
Feb-Apr 500 mb

Composite La Niña (Top 10)
(Feb-Apr) Feb-Apr
Mar-May
Apr-Jun
500 mb
Tmax
Apr-Jun 2011
Apr-Jun response to Feb-Apr La Niña
Composite La Niña (Top 10)
(Feb-Apr) Feb-Apr
Mar-May
Apr-Jun
Tmax
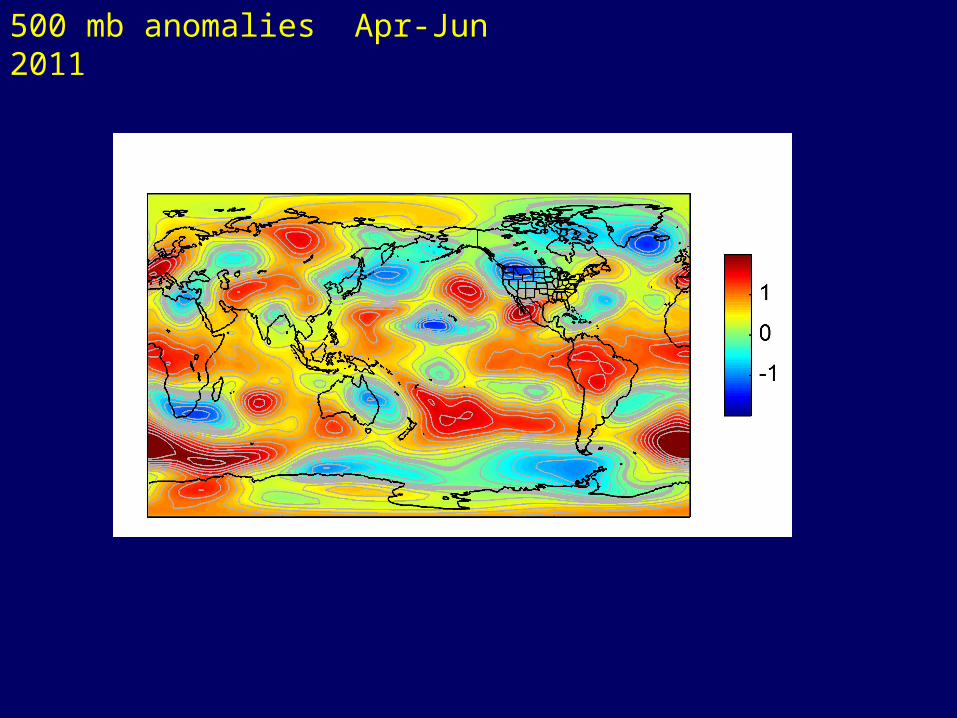
500 mb anomalies Apr-Jun 2011

Conclusion:
Apr-Jun climate patterns similar to a typical La Niña pattern(Trough PNW, Ridge SE)
But historical data shows limited effects of La Niña in spring

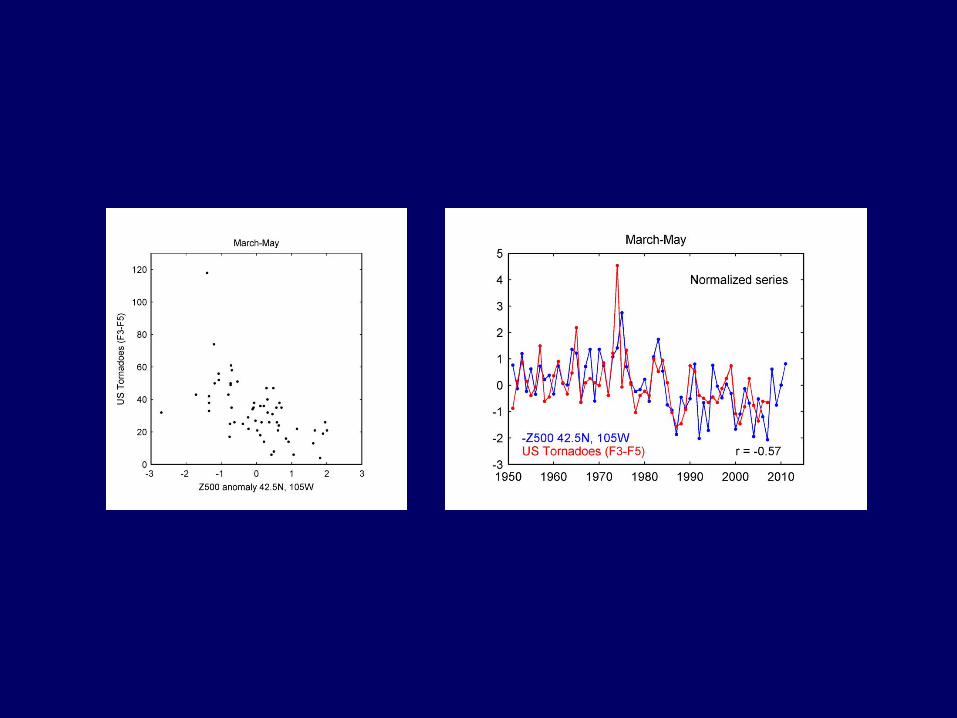
La Niña US tornadoes
Spring (MAM) Z500 composite anomalies (normalized)


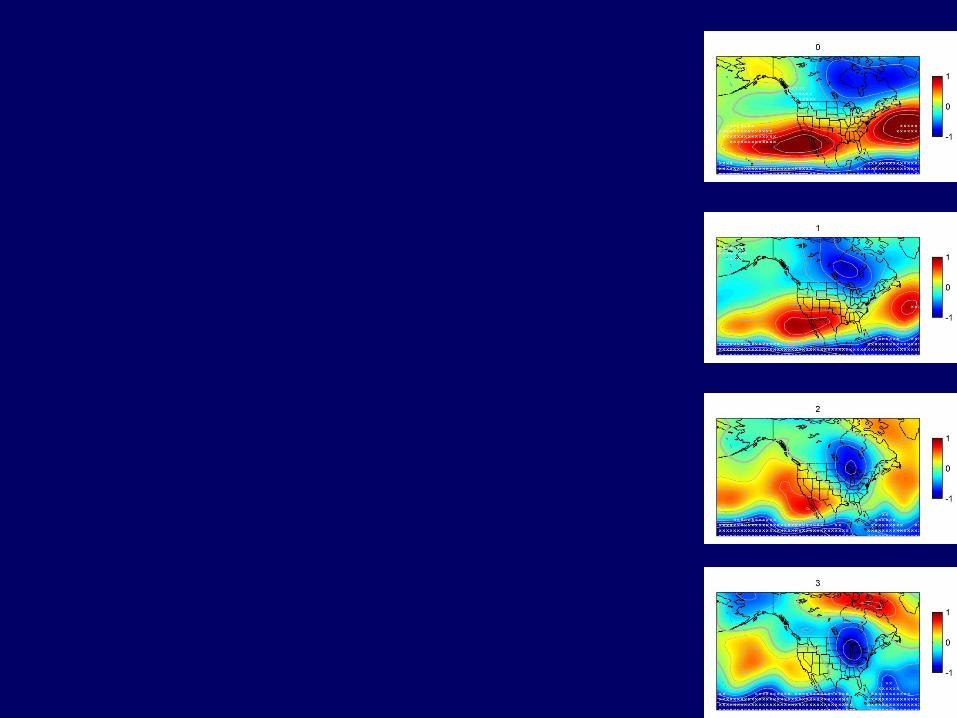
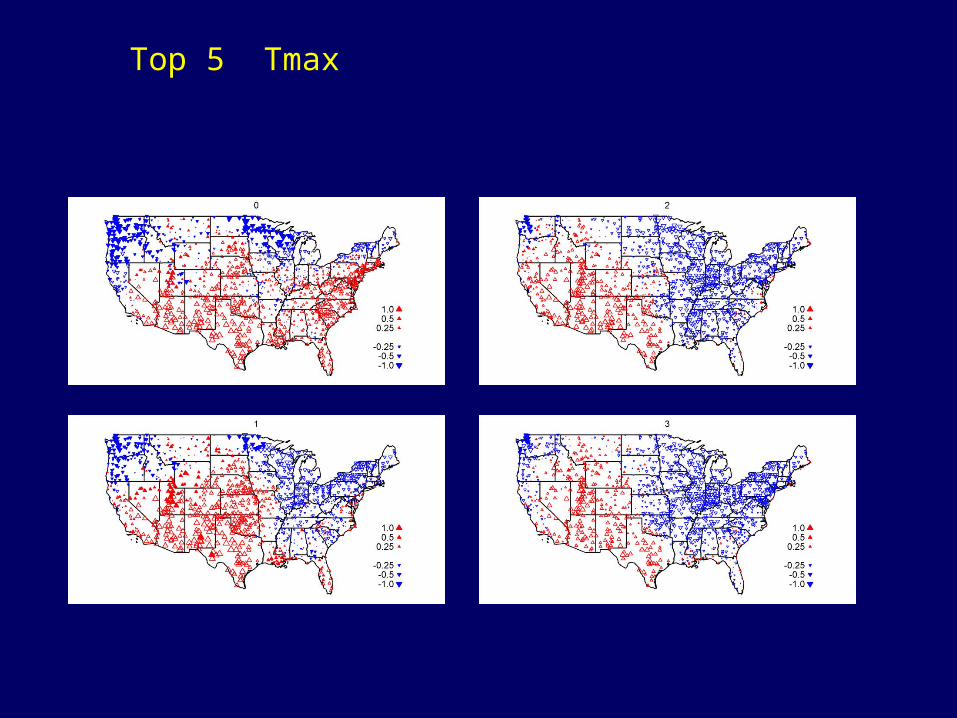
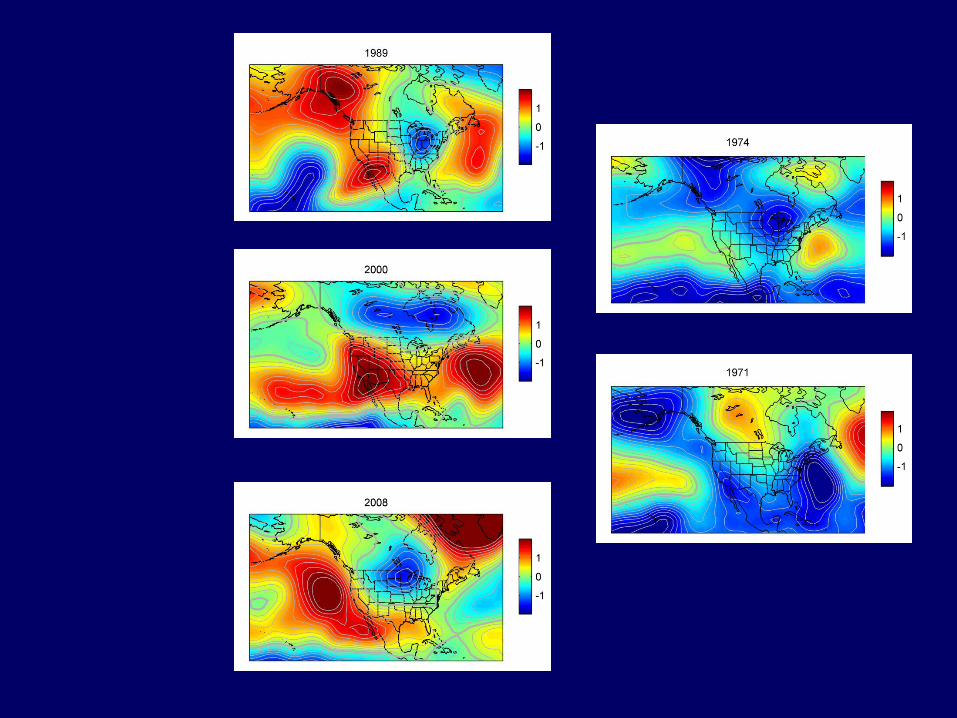
Top 5 Tmax

Top Related