


Languages
Pages
Legal


5-Year Survival of Non-Small Cell Lung Cancer Patients after Adjuvant
Chemoimmunoradiotherapy
Oleg Kshivets, M.D., Ph.D.Department of Surgery, Siauliai Public Hospital, Lithuania
The 53rd Annual Cancer Symposium of Society of Surgical OncologyNew Orleans, The USA, 2000

Abstract: FIVE-YEAR SURVIVAL AND LIFE SPAN OF NON-SMALL CELL LUNG CANCER PATIENTS AFTER ADJUVANT CHEMOIMMUNORADIOTHERAPY O.Kshivets* Siauliai Cancer Center, Siauliai, Lithuania Purpose: This study aimed to determine expediency of adjuvant chemoimmunoradiotherapy (AT) for radical operated non-
small cell lung cancer (C) patients (LCP) with pathologic stage II-III (T1-4N0-2M0G1-3). Methods: In randomised trial (1985-1998) 5-year survival (5YS) of 54 radical operated LCP after AT (age=54.41.0 years;
males=49, females=5; C size=4.70.2 cm) was compared with 5YS of 264 LCP after radical procedures (S) (age=55.80.5 years; males=240, females=24; C size=4.50.1 cm) and with 5YS of 86 radical operated LCP after postoperative radiation (R) (45-50 Gy) (age=58.00.8 years; males=74, females=12; C size=4.70.2 cm). Variables selected for 5YS study were sex, age, TNMG, cell type, C size. 1 cycle of chemoimmunotherapy (CAVT: cyclophosphamid 500 mg/m2 IV+doxorubicin 50 mg/m2 IV+vincristin 1.4 mg/m2 IV on day 1; thymalin/taktivin 20 mg IM daily for 5 days) was given on 10-14 day after S. R (45-50 Gy) was administered since 7 day after 1 cycle. After R 3-4 courses of CAVT were repeated every 21-28 day. Representativeness of samplings was reached by means of randomisation based on unrepeated random selection. Multiple correspondence analysis (A), cluster A, confirmatory factor A, structural equation modeling, Monte Carlo simulation were used to determine any significant overall differences between survival of LCP after AT, S, R.
Results: 5YS was superior in AT group (64.8%: 35 from 54 LCP with N0-2; life span: LS=1998.2156.9 days) compared with R group (45.3%: 39 from 86 LCP with N0-2; LS=1296.4109.5 days) (P<0.001). 5YS of S group was 63.6% (168 from 264 LCP with N0-2; LS=1738.363.4 days) (P>0.05 for AT and P<0.001 for R). For LCP with N1-2 5YS was significantly superior for AT group (63.6%: 21 from 33; LS=1934.0189.9 days) compared with S group (28.1%: 25 from 89; LS=1056.991.1 days) (P<0.001) and with R group (35.6%: 21 from 59; LS=1051.7119.6 days) (P<0.001). Rates of age, sex, T1-4, G1-3, cell type, C size for LCP after AT, S and R were not significantly different. Structural equation modeling and Monte Carlo simulation confirmed significant overall differences between 5YS (P<0.05) and LS (P<0.001) of LCP with N1-2 after AT with respect to S or R; however, 5YS of LCP for N0 with or without AT and R were not significantly different.

Samplings:
Lung Cancer Patients Lived More than 5 Years after Complete Resections..…...242
Lung Cancer Patients Died Because Generalization During First 5 Years after Complete Resections.…….…………...162
In All…………………………………...404

Samplings:
Adjuvant Chemoimmunoradiotherapy…………..54
Postoperative Radiotherapy..……...…..86 Surgery Alone…………………………264 In All…………………………………...404

Radical Procedures:
Pneumonectomy…………………..175 Upper/Lower Bilobectomy…………21 Upper Lobectomy…………………136 Lower Lobectomy………………….66 Middle Lobectomy………………….6 Combined Procedures……………..49 In All…………………………...….404

Staging:
T1…..118 N0..…223 G1…..100 T2…..187 N1……97 G2…..104 T3……84 N2……84 G3…..200 T4……15 Stage II...111 Stage III...293 Squamous Cell Carcinoma…..……….263 Adenocarcinoma………………………116 Large Cell Carcinoma………………….25

5-Year Survivors and Losts Bivariate Histogram: 5-Year Survival and Treatment
Lung Cancer Patients with N0, n=223Bivariate Histogram: 5-Year Survival and Treatment
Lung Cancer Patients with N1-2, n=181
Bivariate Histogram: 5-Year Survivor and Treatment Lung Cancer Patients with N0-2, n=404

Results of Factor AnalysisResults of Factor Analysis, Factor Loadings, Factor 1 vs. Factor 2
Rotation: Varimax normalizedExtraction: Principal components
Lung Cancer Patients with N0-2, n=404
Factor 1
Fact
or 2
Age
WeightGender
5-Year SurvivalLife SpanT
N
G Stage
Tumor Size
Histology
Procedures
Radiation
Surgery
CHT+IT+R
-1.0
-0.8
-0.6
-0.4
-0.2
0.0
0.2
0.4
-0.8 -0.6 -0.4 -0.2 0.0 0.2 0.4 0.6 0.8 1.0
Results of Factor Analysis, Factor Loadings, Factor 1 vs. Factor 2Rotation: Varimax normalized
Extraction: Principal componentsLung Cancer Patients with N1-2, n=181
Factor 1
Fact
or 2 Age
Weight
Gender
5-Year Survival
Life Span
TN
GStageD Histology
Procedures
Radiation Surgery
CHT+IT+R
-0.6
-0.4
-0.2
0.0
0.2
0.4
0.6
0.8
-0.3 -0.1 0.1 0.3 0.5 0.7 0.9

Results of Factor Analysis
1.266 1.359 1.452 1.546 1.639 1.733 1.826 1.920 2.013 2.107 above
Quadratic SurfaceCHt+IT+r vs. SURGERY vs. 5-Year Survival
Lung Cancer Patients with N0-2, n=404
1.063 1.144 1.224 1.305 1.386 1.466 1.547 1.627 1.708 1.789 above
Quadratic SurfaceCHT+IT+R vs. RADIATION vs.5-Year Survival
Lung Cancer Patients with N0-2, n=404
1.244 1.289 1.335 1.380 1.425 1.470 1.515 1.561 1.606 1.651 above
Quadratic SurfaceCHT+IT+R vs. SURGERY vs. 5-Year Survival
Lung Cancer Patients with N1-2, n=181
1.276 1.325 1.374 1.423 1.472 1.521 1.570 1.620 1.669 1.718 above
Quadratic SurfaceCHT+IT+R vs. RADIATION vs. 5-Year Survival
Lung Cancer Patients with N1-2, n=181

Nucloids of Lung Cancer Patients with N0-2, n=404

Results of Cluster-Analysis of Clinicopathologic
Characteristics of Lung Cancer Patients with N0-2, n=404

Nucloids of Lung Cancer Patients with N1-2, n=181

Results of Cluster-Analysis of Clinicopathologic Characteristics of Lung Cancer Patients with N1-2, n=181

Network-Model of Lung Cancer Patients with
N0-2 (n=404)

Network-Model of Lung Cancer Patients with N0 (n=223)
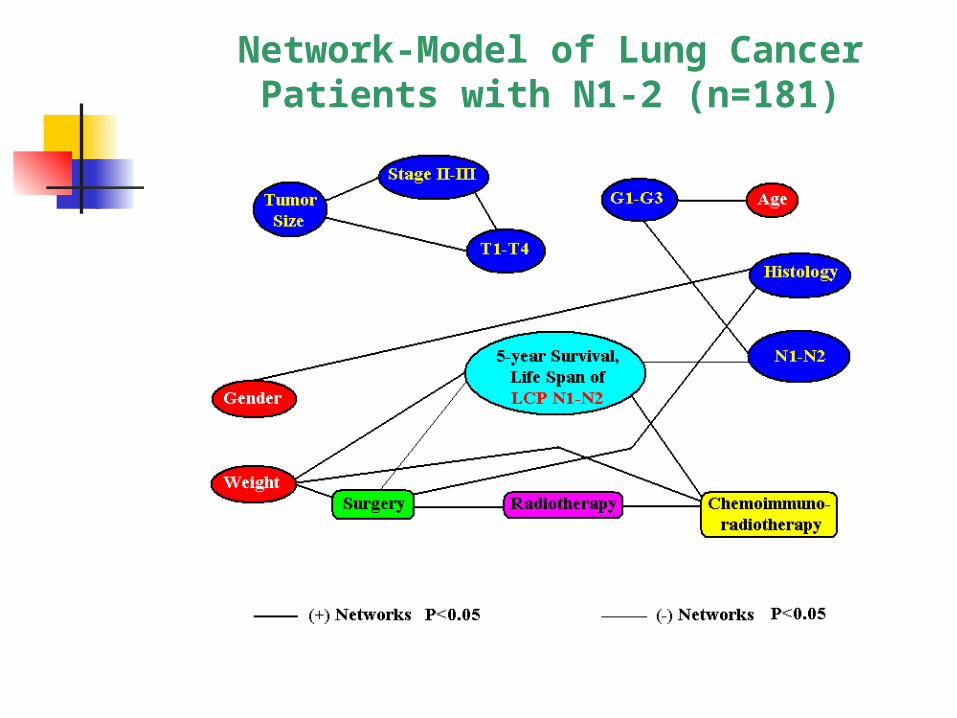
Network-Model of Lung Cancer Patients with N1-2 (n=181)

Survival of Lung Cancer Patients with N0-2 (n=404)
Cumulative Proportion Surviving (Kaplan-Meier)Complete Censored
Lung Cancer Patients, n=404 (N0-N1-N2)Global Chi2=14.34; Df=2; P=0.00077
Time (months) after complete resections
Cum
ulat
ive
Prop
ortio
n Su
rviv
ing
0.3
0.4
0.5
0.6
0.7
0.8
0.9
1.0
0 20 40 60 80 100 120 140 160 180 200
Only Complete Resections, n=264Postoperative Radiotherapy, n=86Adjuvant Chemoimmunoradiotherapy, n=54

Proportional Hazard (Cox) Regression Model of Lung Cancer Patients with N0-2, n=404
Survival Function for Mean Values of Independent VariablesProportional Hazard (Cox) Regression
Lung Cancer Patients, n=404 (N0-N1-N2)Chi2=129.33; Df=13; P=0.000000
Survival Time (Months)
Cum
ulat
ive
Prop
ortio
n Su
rviv
ing
0.55
0.60
0.65
0.70
0.75
0.80
0.85
0.90
0.95
1.00
1.05
0 20 40 60 80 100 120 140 160 180 200
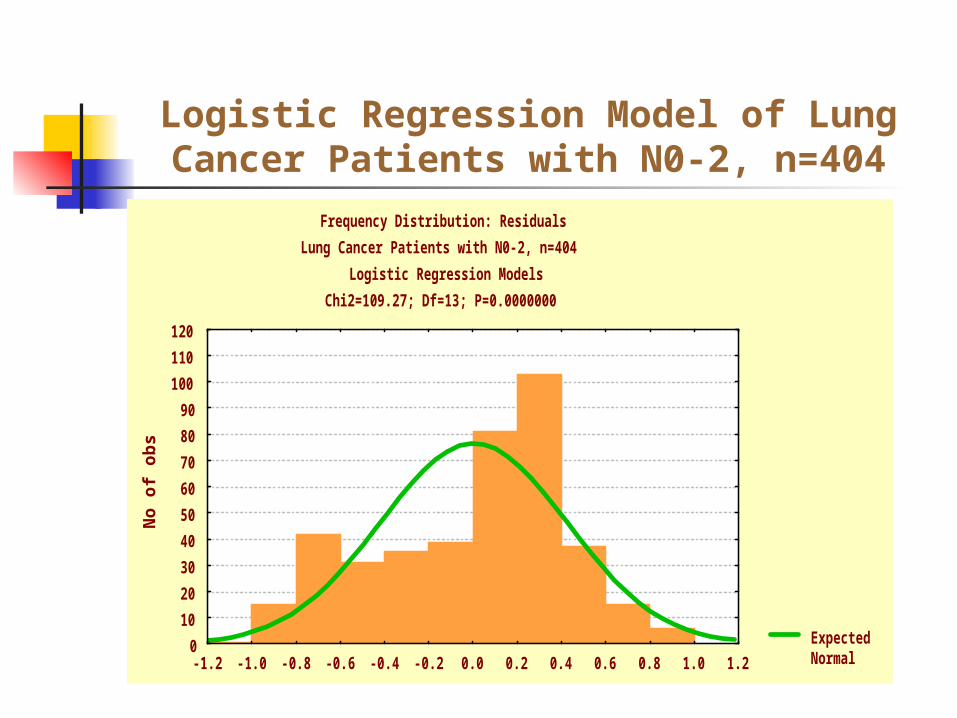
Logistic Regression Model of Lung Cancer Patients with N0-2, n=404
ExpectedNormal
Frequency Distribution: ResidualsLung Cancer Patients with N0-2, n=404
Logistic Regression ModelsChi2=109.27; Df=13; P=0.0000000
No
of o
bs
0102030405060708090
100110120
-1.2 -1.0 -0.8 -0.6 -0.4 -0.2 0.0 0.2 0.4 0.6 0.8 1.0 1.2

Logistic Regression Model of Lung Cancer Patients with N0-2, n=404
Normal Probability Plot of ResidualsLung Cancer Patients with N0-2, n=404
Logistic Regression ModelChi2=109.27; Df=13; P=0.0000000
Residuals
Expe
cted
Nor
mal
Val
ue
-3.5
-2.5
-1.5
-0.5
0.5
1.5
2.5
3.5
-1.2 -0.8 -0.4 0.0 0.4 0.8 1.2

SEPATH-Model: Clinicopathologic Characteristics-Survival of Lung Cancer Patients with N0-2 metastases
(n=404)Normal Probability Plot, Normalized Residuals
Lung Cancer Patients with N0-N2 (n=404), Global Chi2=378.69; Df 63; P=0.000000SEPATH-model: Anthropometry-Cancer-Surgery-Radiotherapy-
Ad.Chemoimmunoradiotherapy-Survival (5-year Survival, Life Span)Surgery P=0.276; Ad.CHIRT P=0.558; Ad.Radiation P=0.005;
Value
Expe
cted
Nor
mal
Val
ue
-3
-2
-1
0
1
2
3
-10 -8 -6 -4 -2 0 2 4 6

Survival of Lung Cancer Patients with N0-2 (n=404)
Cumulative Proportion Surviving (Kaplan-Meier)Complete Censored
Lung Cancer Patients, n=404 (N0-N1-N2)Global Chi2=92.32; Df=2; P=0.000000000
Time (munths) after complete resections
Cum
ulat
ive
Prop
ortio
n Su
rviv
ing
0.1
0.2
0.3
0.4
0.5
0.6
0.7
0.8
0.9
1.0
0 20 40 60 80 100 120 140 160 180 200
N0, n=223N1, n=97N2, n=84

Survival of Lung Cancer Patients with N1-2 (n=181)
Cumulative Proportion Surviving (Kaplan-Meier)Complete Censored
Lung Cancer Patients, n=181 (N1-N2)Global Chi2=11.951; Df=2; P=0.00254
Time (monts) after complete resections
Cum
ulat
ive
Prop
ortio
n Su
rviv
ing
0.2
0.3
0.4
0.5
0.6
0.7
0.8
0.9
1.0
0 20 40 60 80 100 120 140 160
Only comlete Resections, n=89Posoperative Radiotherapy, n=59Adjuvant Chemoimmunoradiotherapy, n=33

Proportional Hazard (Cox) Regression Model of
Lung Cancer Patients with N1-2, n=181 Survival Function for Mean Values of Independent Variables
Proportional Hazard (Cox) RegressionLung Cancer Patients, n=181 (N1-N2)
Chi2=53.01; Df=13; P=0.00000
Survival Time (Months)
Cum
ulat
ive
Prop
ortio
n Su
rviv
ing
0.2
0.3
0.4
0.5
0.6
0.7
0.8
0.9
1.0
0 20 40 60 80 100 120 140 160

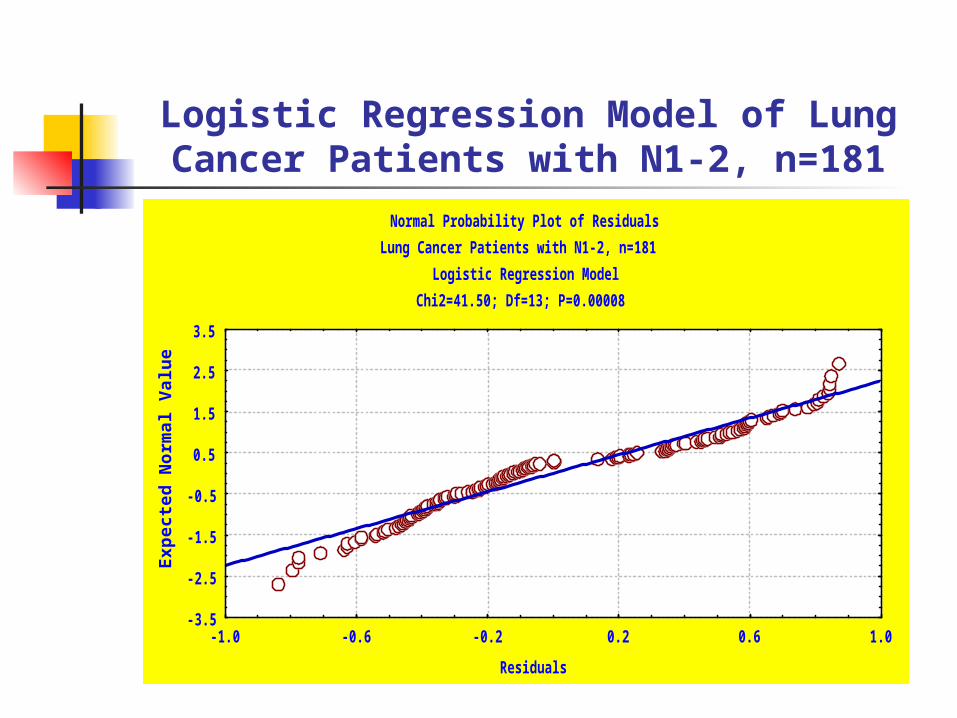
Logistic Regression Model of Lung Cancer Patients with N1-2, n=181
ExpectedNormal
Frequency Distribution: ResidualsLung Cancer Patients with N1-2, n=181
Logistic Regression ModelChi2=41.50; Df=13; P=0.00008
No
of o
bs
0
5
10
15
20
25
30
35
40
45
50
-1.2 -1.0 -0.8 -0.6 -0.4 -0.2 0.0 0.2 0.4 0.6 0.8 1.0 1.2
Logistic Regression Model of Lung Cancer Patients with N1-2, n=181
Normal Probability Plot of ResidualsLung Cancer Patients with N1-2, n=181
Logistic Regression ModelChi2=41.50; Df=13; P=0.00008
Residuals
Expe
cted
Nor
mal
Val
ue
-3.5
-2.5
-1.5
-0.5
0.5
1.5
2.5
3.5
-1.0 -0.6 -0.2 0.2 0.6 1.0

SEPATH-Model: Clinicopathologic Characteristics-Survival of Lung Cancer Patients with N1-2 metastases
(n=181) Normal Probability Plot, Normalized Residuals
Lung Cancer Patients with N1-2 (n=181), Global Chi2=193.45; Df=63; P=0.000000 SEPATH-Model: Anthropometry-Cancer-Surgery-Radiotherapy-
Ad.Chemoimmunoradiotherapy-Survival (5-year Survival, Life Span) Surgery P=0.905; Ad.CHIRT P=0.0000001; Ad.Radiation P=0.909;
Value
Expe
cted
Nor
mal
Val
ue
-3
-2
-1
0
1
2
3
-6 -4 -2 0 2 4 6 8

Results of Monte Carlo Simulation
-0.475 -0.055 0.364 0.783 1.203 1.622 2.041 2.460 2.880 3.299 above
Monte Carlo Data SimulationLung Cancer Patients with N0-2, n=404
-0.475 -0.055 0.364 0.783 1.203 1.622 2.041 2.460 2.880 3.299 above
Monte Carlo Data SimulationLung Cancer Patients with N1-2, n=181
-0.475 -0.055 0.364 0.783 1.203 1.622 2.041 2.460 2.880 3.299 above
Monte Carlo Data SimulationLung Cancer Patients with N0-2, n=404
-0.475 -0.055 0.364 0.783 1.203 1.622 2.041 2.460 2.880 3.299 above
Monte Carlo Data SimulationLung Cancer Patients with N1-2, n=181
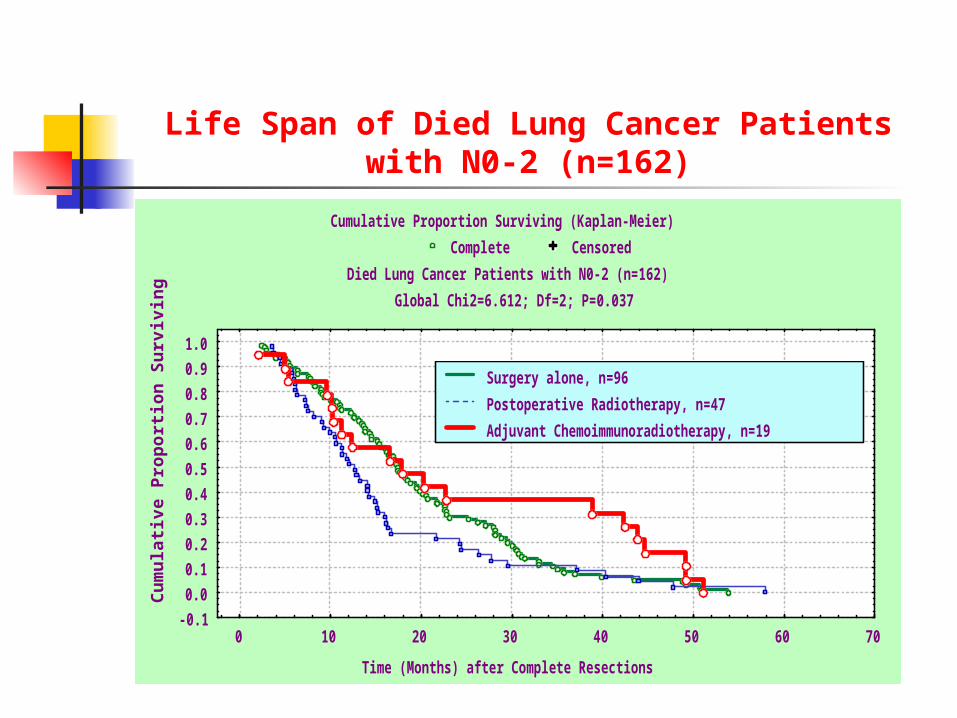
Life Span of Died Lung Cancer Patients with N0-2 (n=162)
Cumulative Proportion Surviving (Kaplan-Meier)Complete Censored
Died Lung Cancer Patients with N0-2 (n=162)Global Chi2=6.612; Df=2; P=0.037
Time (Months) after Complete Resections
Cum
ulat
ive
Prop
ortio
n Su
rviv
ing
-0.10.00.10.20.30.40.50.60.70.80.91.0
0 10 20 30 40 50 60 70
Surgery alone, n=96Postoperative Radiotherapy, n=47Adjuvant Chemoimmunoradiotherapy, n=19

Conclusions: Adjuvant chemoimmunoradiotherapy significantly
improved 5-year survival and life span of non-small cell lung cancer patients with N1-2 metastases after complete resections compared with surgery alone and postoperative radiotherapy.
One must be careful in using adjuvant chemoimmunoradiotherapy for lung cancer patients without lymph node metastases.

Address: Oleg Kshivets, M.D., Ph.D. Consultant Thoracic/Abdominal Surgeon Department of Surgery Siauliai Public Hospital Tilzes:42-16, LT78206, Siauliai, Lithuania tel (37041)416614 e-mail: [email protected]
Top Related