


Languages
Pages
Legal


Reporting with Public Sector Planning and Budgeting (PSPB)
Tiffany Ma and Andrea Zirman
UC Berkeley

Tiffany Ma
Hyperion Functional Administrator
Andrea Zirman Interim Director of Oracle EPM Tools, OSPM

Public Sector Planning and its related reporting have been important factors in supporting Berkeley's financial strategy, focused on financial reporting transparency and ultimately accountability for campus goals of remaining a center of innovation, discovery, growth, and sustainability.

About UC Berkeley
Overview of UC Berkeley’s Technical Architecture,
including Public Sector Planning and Budgeting (PSPB)
How PSPB & Related Reporting Have Been Helpful to
Berkeley
Challenges with PSPB
Enhancements to CalPlanning / PSPB
Q&A
Demos throughout

University of California, Berkeley
• Established 1868
• 27,126 undergraduates
• 10,455 graduate students
• 1,582 fulltime and 500 part-time
faculty members
• 8,959 Staff headcount
• 14 colleges and schools with 276
degree programs
• $2.5 billion budget (FY2015)

6
Growing Concerns About the Financial
Sustainability of Higher Education
Revenues Under Pressure As Costs
Continue to Grow
• State Budget Pressures ƒ
• Federal Budget Cuts ƒ
• Declining Median Incomes
• Employee Benefits
• Deferred Maintenance
• Rising Compliance Costs
• Legacy Programs
Revenue
Costs
34% of University Presidents
surveyed in 2014 are not confident in
the sustainability of their institution’s
financial model.
Decreased Funding for Berkeley
Inevitable Budget cuts
~70% of Berkeley’s budget is made up of employees
PSPB enables Berkeley to closely manage expenses and increase financial transparency

Tuition comparison
University Tuition FY15-16
UC Berkeley $13,878 (in state)
Harvard $45,278
Yale $47,600
Brown $49,346
Univ of Penn $49,536
Univ of Virginia $13,468 (in state)
Bucknell
University
$49.878

Berkeley’s Financial Roadmap We have made tremendous progress, and we have more work to do to fully realize our aspirations for financial transformation.
Financial Roadmap – Our path to the future state
Creating
Infrastructure
• Focused on building, implementing and enhancing CalPlanning
• Implemented standard reporting formats and chart of accounts improvements
• Delivered training, built awareness on budget and planning concepts
• Implemented all-funds budgeting
Optimizing and Aligning
with Strategy
• Divisions actively engaged in optimizing resources to further academic goals
• Robust academic planning that is tied to multi-year financial plans and annual budget
Enhancing
our Understanding
•Strengthen the budget processes at central and division levels
•Clarify authority, responsibility, and accountability
•Establish mechanisms to monitor performance

Overview of UC Berkeley’s Structure

UC Berkeley & Oracle
Existing ERP Footprint
PeopleSoft Financials
(GL, AP, AR) 9.3
PeopleSoft HCM, Version
9.0 (HR, Workforce Admin, Position Management)
Custom Data Warehouse
using Hyperion IR 11.1.2.3 and OBIEE/Answers
11.1.1.7
Back-end Platform
Windows * *Migration to
Linux in progress
Oracle Hyperion
Hyperion Planning
Public Sector Planning
Full-Use Essbase
V. 11.1.2.2*
* Upgrade in progress
Hyperion Financial Reporting
Studio
Hyperion Smart View (Planning
and Ad Hoc)

Flow and Timing In Our Technical Architecture
CALPLANNING
CalRptg
(ASO)
Dat
a En
try
Rep
ort
ing
HCPRptg (ASO)
Actuals Operating Budget & Forecast
Summarized Actuals
Summarized Compensation Data
Detailed Position & Compensation Data
BFS/IR
BFS (G/L)
Actuals & Encumbrances
EDW/IR (Data Warehouse /
Reporting)
CalPlan (BSO)
HCP (BSO - Human Capital
Planning)
Detailed Employee Actuals
Detailed Position & Employee Data
HOURLY
*
MONTHLY
SNAPSHOT
HOURLY*
Snapshot on 1/24/15 of active data from 7/1/14 and forward.
HOURLY
*
* Hourly schedule & frequency is determined based on budget process. Can vary from 4 times a day to
hourly.
DAILY
HR
HCM (Human Capital Management)
Position Management
PPS (Payroll Personnel
System)
MONTHLY

CalPlanning Application User Flow
CalPlan Review and edit plan for Revenue, Transfers, and Non-Comp Expenses and view summarized Compensation Expense plans from HCP.
HCP (Human Capital Planning) Review and edit planned Compensation Expenses for Employee and Position.
CalRptg Generate and review reports of budget data from CalPlan and detailed Actuals from BFS.
HCPRptg Generate and review Compensation Expense reports for budget data from HCP by Employee and Position.

Reporting Capabilities
Detail level accounts with variance and trend analysis from beginning of time (2011)
Automated daily Actuals loaded with
Ability to report in millions
CalRptg (ASO)
HCPRptg (ASO)
Detailed Position & Compensation Data
Reporting on detailed monthly closed Actuals
Reporting on Average FTE
Report combining non-comp and comp by employee
Plan member accounts with 2-year variance and trend analysis
Changes in Non-Compensation data immediately reflected in reports
CalPlan (BSO)
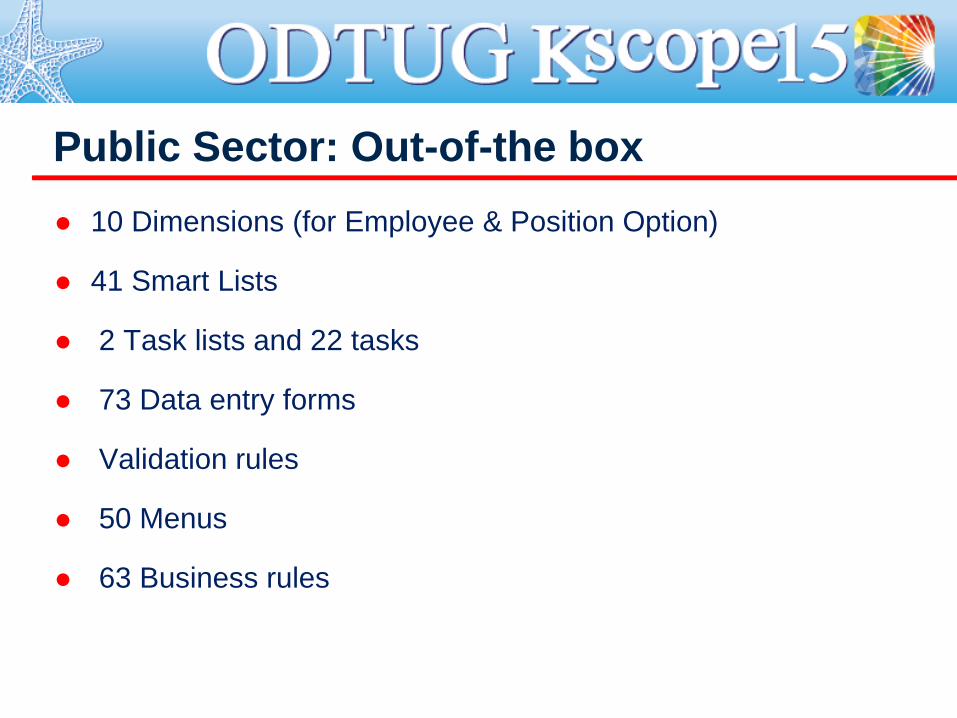
Public Sector: Out-of-the box
10 Dimensions (for Employee & Position Option)
41 Smart Lists
2 Task lists and 22 tasks
73 Data entry forms
Validation rules
50 Menus
63 Business rules

Specific Changes to PSPB HCP
● Consolidation of Employee & Position forms; hid large number of
HCM attributes
● Reordered right-click menus and added user cues
● Bring in only Regular Pay employees and provide functionality to
allow planners to pool the rest of the Pay types
● Fringe expense calculated for employee type (account) not
specific employee (health plan, etc.)
● Headcount-derived expense calculation
● Bypassed default position type by department
● Custom forms developed
All forms, tasks and tasklists were prefixed with “HCP” with the out-of-
the-box forms used as the starting point
Demo

From a Project to Operations
Phase 1
• Reporting (ASO)
• Aug 2011, 100 users
Phase 2
• Summary Budgeting (BSO)
• Mar 2012, 150 users
Phase 3
• Empl/Pos Budgeting (PSPB)
• Feb 2013, 350 users
Now
• Assess, Stabilize, & Automate
• Increase adoption, 700+ users
● Establish on-going governance model
● Converge solutions OBIEE, Hyperion Planning, and Hyp Interactive Reporting
● Improve the user experience and business process
● Multi-year and Quarterly Forecasting
● Integrated Learning and Community of Practice
Project Phases What’s Next
Implementation Partner for Phases 1-3: M2 Consulting Implementation Partner for Phases 1-3: M2 Consulting

Reporting Overview
Types of Reporting:
• Displays where the money comes from and spending restriction amounts Fund
• Multi-year Actuals to compare past results to current budget Trend
• Burst and email directly to Deans to show Division and Department budgets Leadership
• Detailed employee and position FTE and compensation with variance against Actuals
Employee and Position
Highlights how much money is
available and where and how to
spend it
Encourage financial analysis on
decisions that affect the
financial health of Berkeley
Financial transparency across
all levels of the organization to
encourage discussion and
strategic thinking vs
incremental planning
Improve resource allocation
and control expenses
How it’s Been Helpful to UCB

Transformative Comp and Non-Comp Expense
Detailed
Employee
Demo
Avg FTE
per
Employee
Budget to Actual
Variance by
person
Non-
compensation
Expense

How Do Users Get Reports?
o Run directly in the workspace report repository
o Task list links
o Smart View
o Report book bursting
• Convenient and efficient way to distribute to a large
audience
• Ability to distribute reports to non-users, including
Deans using email and / or Google Drive
• Currently partnering with Budget Office to develop a
strategy for increased adoption across campus

Scheduling Batches and Bursting Batches
Scheduling batches
delivers multiple report
through various
channels.
● CalPlanning
workspace
● Email functionality
● Google drive

Access to Report Books in Google Drive
Benefits of Sharing Reports through *Google Drive
● Users without CalPlanning access can
still access through Google Drive
● Direct links to report books can be
emailed to users
● Distribution lists can be created for long lists of report book
recipients through CalMail.
● Email addresses outside of the “berkeley.edu” domain can be
included in the Google Drive access and distribution lists
*Installed and configured a 3rd party software for $19.95: SyncDocs

Challenges with Public Sector Planning and Budgeting

Functional Team’s Challenges with PSPB
Challenge Result
HCP technology is complicated Resource intensive to maintain
HCP limitations on number of
intersections for reports to
successfully run
Designed forms rather than reports. Not ideal.
Smart List maintenance Cumbersome and time consuming
HCP Data Refresh load
limitation
No out-of-the-box functionality to allow users to
have selective data refreshes
Global Salary Adjustments
limitation
Time consuming as must run individually for
each salary admin plan
No published Oracle release
dates for PSPB on-prem
11.1.2.4 UI planning
enhancements
Timeline from Oracle on Enhancements to
simplify, streamline, and modernize UI for cloud,
mobile for PSPB

User Challenges with PSPB
Challenge Result
HCP is complicated Substantial training required
HCP is detailed Makes budget prep very time consuming
Smart View not intuitive for HCP Not used by many users
Data Push Delays timeliness of refreshed reporting data
FTE Reporting Out of the box functionality doesn’t meet user
needs
Global Salary adjustments Functionality wipes out future-dated rows
HCP Data Refresh load
limitation
No out-of-the-box functionality to allow users to
have selective data refreshes
Effective dating New and difficult concept for UC Berkeley
planners

Enhancements to CalPlanning / PSPB

User Training We need to provide planners very specific
guidelines on materiality to save user data
entry time, leave more analysis time
Planning to the penny is possible but not
most efficient or effective use of time
Lesson Learned…

FTE Reporting Future Enhancements
•In difficult budgetary times, FTE trend data is an important
indicator.
•FTE is a proxy for $$.
Related future enhancements:
Application Current State Future State
HCP FTE End dates lack alignment
with costing end dates
FTE end dates need
refinement to facilitate FTE
trend reporting
HCPRptg FTE displays based on the
employee’s primary managing
unit.
• FTE to reflect cost
center(s) that pay salary
expense
• Add Actual FTE to
reports

Future State of HCPRptg: Help simplify user experience and facilitate position controls
Position Control
● Position hiring approval processes to be implemented, supported by
HCPRptg reports
Planned Exception Reporting
● Reduce user efforts by analyzing where they are spending time in tool and
providing reports that better assist
● Employee Roster – only display changes so user need not review entire data set
● Trends by Entity across job categories
● Trend report of multi-year Actuals compared against current budget, highlighting changes
Create new reports that were formerly not possible
● FR Studio 11.1.2.3.503 has new feature: Suppress Missing Blocks
● Out-of-box HCP reports could not render, but after checking the Suppress Missing
Blocks, HCP report can retrieve data
Video
Top Related