


Languages
Pages
Legal


Kloukinas, P., Scotto di Santolo, A., Penna, A., Dietz, M. S., Evangelista, A.,Simonelli, A. L., ... Mylonakis, G. (2015). Investigation of seismic responseof cantilever retaining walls: Limit analysis vs shaking table testing. SoilDynamics and Earthquake Engineering, 77, 432-445. DOI:10.1016/j.soildyn.2015.05.018
Peer reviewed version
License (if available):CC BY-NC-ND
Link to published version (if available):10.1016/j.soildyn.2015.05.018
Link to publication record in Explore Bristol ResearchPDF-document
This is the accepted author manuscript (AAM). The final published version (version of record) is available onlinevia Elsevier at http://dx.doi.org/10.1016/j.soildyn.2015.05.018. Please refer to any applicable terms of use of thepublisher.
University of Bristol - Explore Bristol ResearchGeneral rights
This document is made available in accordance with publisher policies. Please cite only the publishedversion using the reference above. Full terms of use are available:http://www.bristol.ac.uk/pure/about/ebr-terms

Investigation of Seismic Response of Cantilever Retaining Walls: Limit Analysis vs
Shaking Table Testing
Panos Kloukinas
Department of Civil Engineering, University of Bristol, U.K.
Email address: [email protected]
Anna Scotto di Santolo
Telematic University of Naples, Pegaso, Italy
Email address: [email protected]
Augusto Penna
Department of Civil Engineering, University of Sannio, Italy
Email address: [email protected]
Matthew Dietz
Department of Civil Engineering, University of Bristol, U.K.
Email address: [email protected]
Aldo Evangelista
Department of Civil and Environmental Engineering, University of Naples Federico II, Italy
Email address: [email protected]
Armando Lucio Simonelli
Department of Civil Engineering, University of Sannio, Italy
Email address: [email protected]
Colin Taylor
Department of Civil Engineering, University of Bristol, UK
Email address: [email protected]
George Mylonakis*
Department of Civil Engineering, University of Bristol, UK
Department of Civil Engineering, University of Patras, Greece
Department of Civil and Environmental Engineering, UCLA, USA
Email address: [email protected]
*Corresponding author
0.90 Queens Building, University Walk, Clifton BS8 1TR
Telephone: +44 (0) 117 331 5838

2
Abstract
The earthquake response of cantilever retaining walls is explored by means of theoretical
analyses and shaking table testing conducted at University of Bristol (EERC - EQUALS). The
theoretical investigations employ both limit analysis and wave-propagation methods, which
take into account different aspects the problem such as inertia, strength, kinematics and
compatibility of deformations. The experimental program encompasses different combinations
of retaining wall geometries, soil configurations and input ground motions. The response
analysis of the systems at hand aim at shedding light onto salient features of the problem, such
as: (1) the magnitude of soil thrust and its point of application; (2) the relative sliding versus
rocking of the wall base and the corresponding failure modes; (3) the importance of the
interplay between soil stiffness, wall dimensions and excitation characteristics, as affecting the
above. (4) the importance of wall dynamics and phase differences between peak stresses and
displacements. The results of the experimental investigations are in good agreement with the
theoretical models and provide a better understanding on the physics of the problem.
Keywords
Retaining Walls, Seismic Earth Pressures, Soil-structure interaction, Model tests
1. Introduction
Earth retaining walls are among the earliest and most common geotechnical structures. Despite
the apparent simplicity of these systems, several aspects of their behavior are poorly
understood, especially for conditions involving seismic action. Moreover, little progress has

3
been achieved in improving design methods, the basic aspects of which have been laid down
over a century ago.
Despite a number of failures observed during post-earthquake investigations, it is recognized
that the majority of retaining walls are over designed [1]. This may be attributed to: (a)
conservative design approaches encompassing large safety factors, (b) overestimation of design
actions, (c) underestimation of system resistances stemming from conservative selection of soil
strength parameters, and (d) the beneficial effect of SSI mechanisms that is ignored in design.
With reference to design procedures, conservative global safety factors have been replaced in
modern seismic codes and design provisions (e.g. the Eurocodes EC7 and EC8, the U.S. FEMA-
NEHRP and AASHTO LRFD) by more rational Load and Resistance Factor Design (LRFD)
approaches [1-4]. The associated partial factors take into account the uncertainties of load
actions and the unfavourable variations of material parameters. The factored load combinations
have to fulfil the capacity/demand ratios for a set of ultimate and/or serviceability limit states
considered in the design.
Despite its known drawbacks, the classic pseudo-static Mononobe-Okabe (M-O) formula is still
the main method proposed for the analysis of yielding walls. Various alternative formulations
have been proposed in seismic codes and the literature, in addition to the M-O, to cover the
inherent limitations of the method, by limit analysis and alternative wave propagation theories
[1-11]. The validity of the pseudostatic M-O analysis has been criticised recently, following
observations from shaking table and centrifuge tests, which indicate small variations in earth
pressures for earthquake amplitudes up to 0.4g [12-14] in active conditions and 0.5g in passive
[15]. The interpretation of the aforementioned studies indicates that pseudo-static seismic earth
pressures and load combinations involving inertial forces are conservative, due to phasing
issues [16]. Also, the earth pressure distribution was found to be closer to hydrostatic, contrary
to the suggestions of the classical work by Seed & Whitman [17].

4
It is worth noting that, both the overestimation of the earth pressures and the underestimation
of the system strength have also been interpreted as the effect of conservative selection of soil
strength parameters, including the effect of cohesion which is generally neglected [18, 19]. A
new interpretation of theoretical and experimental test results in the framework of kinematic
soil-structure interaction has been recently presented by Brandenberg et al. [20].
In light of the foregoing, a better understanding of the behaviour of soil-wall systems and a
more accurate estimation of the lateral earth pressures and pertinent load combinations appear
desirable. In the ensuing, an analysis of cantilever retaining walls supported by spread footings
is presented, based on the results of an exact limit stress solution [21-23]. Findings from the
theoretical study are compared against observations from shaking table investigations of model
walls. This paper complements and extends previous results reported by the authors [24-27]. It
is emphasised that the theoretical investigations reported in the work at hand are restricted to
limit analysis solutions. Extended numerical simulations based on finite-element and finite-
difference analyses using non-linear constitutive models will be the subject of a future
publication.
2. Theoretical background
Reinforced concrete cantilever (“semigravity”) walls represent a popular type of retaining
system which is widely considered as advantageous over conventional gravity walls, since it
exploits the stabilizing action of the soil weight over the footing slab to improve stability.
The problem under consideration is depicted in Fig. 1: a sloping backfill () of dry cohesionless
soil having unit weight s and friction angle , is retained by a cantilever wall with unit weight
w, interface roughness w and dimensions Η (stem height), ω1, ω2, tt and tb, (stem inclination
angles and width), b1, b2, Β, and tf, (footing slab dimensions) and an embedment depth df. Under
the combined action of gravity (g) and seismic body forces (ah x g) and (av x g) in the horizontal

5
and vertical direction, respectively, resulting to the pseudo-dynamic seismic angle ψe = tan-1[ah
/(1–av)], the stress limit state of the backfill can be analysed by means of the uniform Rankine
tensor of Fig 2a. Indeed, following the infinite slope assumption, which is asymptotically exact
at large distances from the wall, the normal and shear stress acting at planes parallel to soil
surface are determined as functions of depth z, providing a constant obliquity ratio τβ/σβ =
tan(ψe) [21, 28-29]. This is evident from the position of the stress point (σβ, τβ) on the Mohr
circle. Accordingly, the pole of the Mohr circle is determined from geometry, facing the stress
point at an angle equal to the slope inclination, . Since the position of the pole is known, the
stresses acting on every plane can be established from trigonometry, based on the known stress
point σβ = sz (1–av) coscos(ψe)/cosψe, by means of the auxiliary Caquot angle 1e = sin-
1[sin(+e)/sin].
As can be seen in Fig. 2b, when the stress characteristics do not intersect the stem of the wall
(Eq.1), the aforementioned Rankine stress field in not affected by the roughness of the soil-wall
interface. Given that the inclination of the stress characteristic (Eq. 2) depends on
acceleration level, the Rankine condition is valid for the vast majority of cantilever wall
configurations under strong seismic action.
1
1 1cr tan b H tan (1)
1( )
4 2 2 2
e e
(2)
The traditional approach for analysing the system, is to assume that the soil thrust is acting on
a conceptual vertical surface AD (Fig. 2b) passing through the innermost point of the wall base
– the familiar vertical virtual back. Although the soil thrust can be evaluated on any arbitrary
plane inclined at an angle the use of the vertical virtual back AD (i.e. choosing ω = 0) results
to a simple geometry and equilibrium equations [30]. A contradictory issue in the literature
relates to the selection of a proper mobilized obliquity on the AD plane, ranging, naturally, from
6
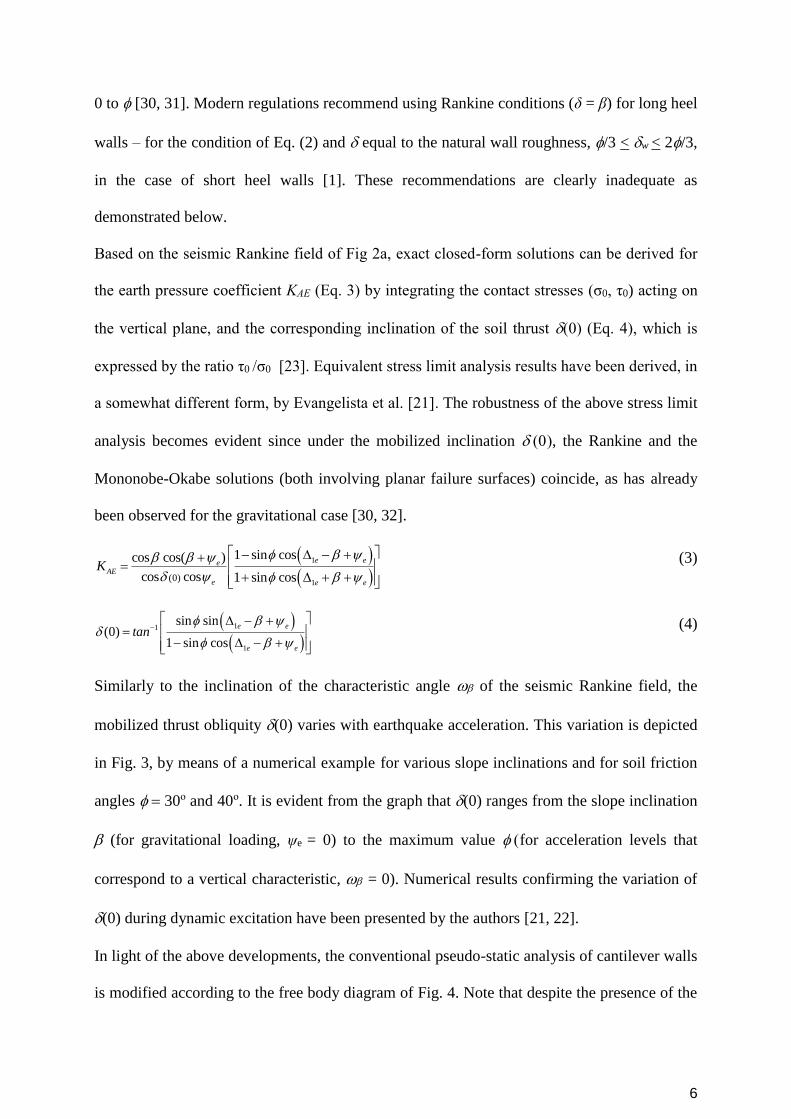
0 to [30, 31]. Modern regulations recommend using Rankine conditions (δ = β) for long heel
walls – for the condition of Eq. (2) and equal to the natural wall roughness, /3 < w < 2/3,
in the case of short heel walls [1]. These recommendations are clearly inadequate as
demonstrated below.
Based on the seismic Rankine field of Fig 2a, exact closed-form solutions can be derived for
the earth pressure coefficient KAE (Eq. 3) by integrating the contact stresses (σ0, τ0) acting on
the vertical plane, and the corresponding inclination of the soil thrust (0) (Eq. 4), which is
expressed by the ratio τ0 /σ0 [23]. Equivalent stress limit analysis results have been derived, in
a somewhat different form, by Evangelista et al. [21]. The robustness of the above stress limit
analysis becomes evident since under the mobilized inclination , the Rankine and the
Mononobe-Okabe solutions (both involving planar failure surfaces) coincide, as has already
been observed for the gravitational case [30, 32].
1
1(0)
1 sin coscos cos( )
cos cos 1 sin cos
e eeAE
e e e
K
(3)
11
1
sin sin(0)
1 sin cos
e e
e e
tan
(4)
Similarly to the inclination of the characteristic angle of the seismic Rankine field, the
mobilized thrust obliquity (0) varies with earthquake acceleration. This variation is depicted
in Fig. 3, by means of a numerical example for various slope inclinations and for soil friction
angles 30ο and 40ο. It is evident from the graph that (0) ranges from the slope inclination
(for gravitational loading, ψe = 0) to the maximum value for acceleration levels that
correspond to a vertical characteristic, = 0). Numerical results confirming the variation of
(0) during dynamic excitation have been presented by the authors [21, 22].
In light of the above developments, the conventional pseudo-static analysis of cantilever walls
is modified according to the free body diagram of Fig. 4. Note that despite the presence of the

7
vertical component of seismic action in the diagram, this loading is usually neglected in design,
since the vertical motion is considered to have a minor effect on the response of elastoplastic
systems such as the one at hand [33]. As can be seen from the graph, the Rankine solution is
strictly applicable to plane AD, whereas the active earth pressure on the vertical face of the
footing slab, AE, is considered to act under an inclination w. For convenience, the Rankine
solution can be extended to the whole vertical back ED [21]. The same inclination w can be
applied for the passive resistance on the left end of footing, which, however, is often neglected
for ordinary pad foundations, in the absence of significant embedment depth or a footing key
[1, 2].
The contact and body forces acting on the system are resisted upon the reactions Hd and Vd
acting on the foundation slab. The combination of these two actions, together with the resulting
eccentricity e, determines the bearing demand of the wall foundation, in the context of classical
limit analysis procedures for a strip footing subjected to an eccentric inclined load [2].
The seismic Rankine analysis reveals a beneficial mechanism for the system stability, which
decreases the horizontal thrust and increases the vertical contact force during the earthquake.
In the numerical example of Fig. 5, the performance of the different assumptions for the
inclination is compared for the case of a rough wall (w = 2/3) retaining loose horizontal
backfill (=0o, = 30o) in terms of horizontal and vertical component of the soil thrust and the
resultant moment with respect to the footing centroid, which is important for the reaction
eccentricity. More specifically, the horizontal and vertical components of total soil thrust PAE
are compared in Figs. 5a,b and the corresponding counterparts of the seismic increment PAE
are compared in Figs. 5c,d. It should be noted that in case of a varying inclination (0), the
conventional “seismic increment” approach (PAE = PAE – PA) cannot be employed directly,
since the vectors PAE, PA are not co-axial, but can only be defined on the horizontal and the
vertical components separately. In Fig. 5e, the seismic increment AE of the overturning
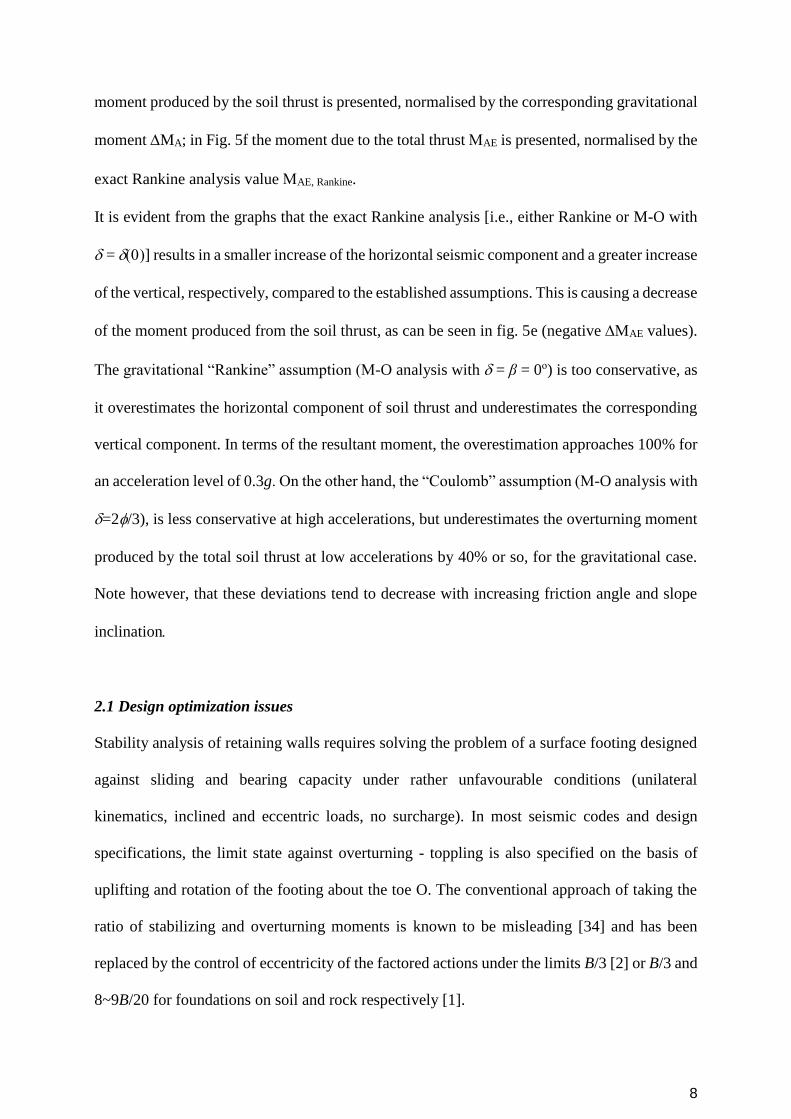
8
moment produced by the soil thrust is presented, normalised by the corresponding gravitational
moment MA; in Fig. 5f the moment due to the total thrust AE is presented, normalised by the
exact Rankine analysis value AE, Rankine.
It is evident from the graphs that the exact Rankine analysis [i.e., either Rankine or M-O with
= ] results in a smaller increase of the horizontal seismic component and a greater increase
of the vertical, respectively, compared to the established assumptions. This is causing a decrease
of the moment produced from the soil thrust, as can be seen in fig. 5e (negative AE values).
The gravitational “Rankine” assumption (M-O analysis with = β = 0ο) is too conservative, as
it overestimates the horizontal component of soil thrust and underestimates the corresponding
vertical component. In terms of the resultant moment, the overestimation approaches 100% for
an acceleration level of 0.3g. On the other hand, the “Coulomb” assumption (M-O analysis with
=2/3), is less conservative at high accelerations, but underestimates the overturning moment
produced by the total soil thrust at low accelerations by 40% or so, for the gravitational case.
Note however, that these deviations tend to decrease with increasing friction angle and slope
inclination
2.1 Design optimization issues
Stability analysis of retaining walls requires solving the problem of a surface footing designed
against sliding and bearing capacity under rather unfavourable conditions (unilateral
kinematics, inclined and eccentric loads, no surcharge). In most seismic codes and design
specifications, the limit state against overturning - toppling is also specified on the basis of
uplifting and rotation of the footing about the toe O. The conventional approach of taking the
ratio of stabilizing and overturning moments is known to be misleading [34] and has been
replaced by the control of eccentricity of the factored actions under the limits B/3 [2] or B/3 and
8~9B/20 for foundations on soil and rock respectively [1].

9
For foundations on compliant soil, overturning is clearly not the critical failure mechanism as
local bearing capacity failure under the wall toe precedes overturning, resulting to permanent
rotation [35]. Design regulations specify that sliding-type failure can be acceptable under
serviceability limits, but permanent rotation should be limited below 1/500 [1, 2]. Along the
same lines, replacement of the overturning limit state by a proper bearing capacity check under
more strict eccentricities limits of Β/6 and Β/4 for foundations on soil and rock, respectively,
has been proposed [36].
2.2 Design optimization example
Design of a cantilever wall system can be optimized for different design acceleration levels ahd,
to provide economical designs under pre-specified safety factors [37]. The equations from the
pseudostatic analysis of Fig. 4 are programmed in dimensionless form and the optimization is
performed by finding the minimum wall cross sectional area under the restrictions: b1/H > ωR
– ω1 (to ensure Rankine conditions), SFbear. capacity = Rd /Vd> 1 (to avoid bearing capacity failure),
tt /H > 0.035, tf = tb/H > 0.1 (minimum values from sizing rules), b2/H, ω1, ω2>0. In addition,
the embedment depth df was set equal to the footing thickness tf and the safety factor against
sliding, Sd /Hd, was left unrestricted. Ultimate sliding and bearing capacity resistances Sd and
Rd were calculated with EC7 formulae, without employing partial safety factors [2].
The parameters of the numerical example shown in Fig 6 are: soil friction angle = 35ο (both
for backfill and foundation soil), relative wall-soil density γs / γw = 0.8, backfill slope = 10ο
and wall roughness w = 2/3. The safety factor against bearing capacity was always maintained
above 1, and the one corresponding to sliding is reduced according to Fig. 6a. In Figs 6b and
6d, the optimized ratios b1/H, b2/H and the corresponding safety factors of the optimized
geometry for gravitational conditions, are plotted as function of design acceleration. Evidently,
safety against bearing capacity failure improves drastically, mainly because of the increase in

10
both b1/H and b2/H. On the other hand, sliding resistance is slightly improved with b1/H,
increasing both actions and resistances. Finally, Fig. 6c demonstrates that bearing capacity
failure takes place under decreasing eccentricities (which are much lower than the EC8 and
AASHTO limits), with increasing design acceleration. This highlights the sensitivity of the
retaining wall designs to bearing capacity considerations.
3. Shaking table experimental investigation
To resolve the above theoretical issues, a series of shaking table tests were conducted at the 6-
DOF Earthquake Simulator of the Earthquake and Large Structures Laboratory (EQUALS) at
the University of Bristol, UK. Despite some known difficulties related to scaling of the friction
angle , shaking table testing is in extensive use in earthquake geotechnical engineering practice
for understanding failure mechanisms and verifying design hypotheses [38].
The experimental program encompassed testing on scaled wall models on a compliant base
under different retaining wall geometries and input ground motions. The physical models were
constructed in the large Equivalent Shear Beam container of EQUALS, with inner dimensions
4.80m long, 1m wide and 1.15m deep, which is designed to match the shear stiffness of the
contained soil and ensure plane strain conditions [39, 40].
3.1 Shaking table model geometry and instrumentation
The model geometry adopted in the design, shown in Figure 7, had to take into consideration
the container dimensions and the restrictions of the shaking table regarding the maximum
payload. A maximum soil height of 1m was selected, corresponding to a backfill of 0.6m (equal
to the wall height, H) and a foundation soil layer of 0.4m (equal to wall footing width, Β). The
length of the retained backfill was selected at 5 times its height, whereas the corresponding free
length in the front of the wall was 3 times the wall height. These distances were deemed

11
sufficient to eliminate the boundary effects and ensure free field conditions.
Three basic types of instruments were employed for the measurement of accelerations,
displacements and strains, as shown in Figure 7. Twenty one (21) uniaxial accelerometers were
used to monitor the motion of the shaking table, the shear stack and the wall-soil system, with
the main area of interest being the wall itself, the retained soil mass and the free field. Four (4)
LVDT transducers were used to measure the transient and permanent displacements of the wall.
Additionally, thirty two (32) strain gauges were attached along the stem and the base of the
wall, on three different cross sections, to monitor the bending of the wall. Lastly, non-contact
displacement transducers were employed to monitor the backfill settlement, but proved to be
inefficient due to low operational range (~10mm) and were replaced by a grid of coloured sand
(see Fig. 12).
3.2 Wall models and soil material properties
The retaining wall model, depicted in Fig 8, was made of aluminium alloy 5083 plates with unit
weight γ = 27 kN/m3, Young’s modulus E = 70GPa and Poisson’s ratio = 0.3. A central wall
segment of 600mm width was created by two 1mm thick vertical slits penetrating 400mm down
into the stem, to ensure plane strain response unaffected from possible boundary effects. Along
the same lines, the base of the wall was subdivided into four 240mm-wide aluminium segments,
each secured to the wall stem with three M12 bolts.
A thickness of 32mm was selected for all aluminium plates, following the criterion to keep
bending deformations close to the lowest operational level of the strain gauges [ 2a d wM t D
~10-5, where bending stiffness 3 212(1 )w w wD E t v ], to simulate a relatively rigid wall. Despite
stiffening measures, the relative wall-soil flexibility parameter 3
w wd GH D [41] attained
values of approximately 15 to 25, corresponding to a somewhat flexible wall.

12
3.3 Soil material properties
Both the backfill and the foundation soil layer consisted of dry, yellow Leighton Buzzard 14 –
25 (Fraction B) silica sand at different compaction levels. The specific soil material has been
used extensively in experimental research and a wide set of mechanical and dynamic properties
is available in the literature [42, 43]. The soil configuration consists of a dense supporting layer
and a medium dense backfill. The base layer was formed by pouring sand in layers of 150-200
mm thickness from a deposition height of 0.6m, and then densifying by strong shaking. The
backfill was formed by pouring sand from a height of 200mm, to minimise the densification
effect of the downward stream of sand without further densification. The soil material properties
are summarised in Table 1. Based on the densities calculated for the soil layers, the peak friction
angles were estimated empirically at 42.5o and 33.5o, for the foundation layer and the backfill,
respectively [42].
The importance of keeping soil density low during testing under 1-g conditions is discussed in
[40]. It is well known that a very loose soil mass is sensitive to dynamic condensation during
seismic excitation. However, this mechanism was shown to have minor effect on the system
response, for the following reasons: (a) the foundation layer was relatively dense, (b) the
backfill was replaced following each strong shaking test series, (c) the soil material consists of
uniform coarse grained sand with rounded grain shapes and is, thereby, less sensitive to
dynamic compaction.
In addition to the soil properties, the mechanical properties of the interfaces are important for
the soil-wall system behaviour [44, 45]. Two kinds of footing interfaces were employed: a) a
smooth interface between an aluminium plate and soil; b) a rough interface created by pasting
rough sandpaper on the footing surface. The interface friction angles were measured directly
on the model via static pull tests. The resulting values are δw = 23.5ο for the smooth (aluminium
- soil) soil-wall interface and δw = 28.5ο for the corresponding rough one (sandpaper - soil).

13
3.4 Model Configurations
Three different model configurations (No1, No2 and No3) were tested: (a) Configuration No1,
corresponding to the reference geometry of Fig. 2 (B=400mm, b1=300mm, b2=70mm), with a
smooth footing interface, (b) Configuration No2, corresponding to a shorter footing width
(B=280mm, b1=250mm, b2=0) and (c) Configuration No3, with an identical geometry as
Configuration No2, but with a rough interface, as explained above.
The equilibrium characteristics of these configurations, as estimated based on the pseudo-static
analysis of Fig. 4, are summarised in Table 2. It is evident that the above configurations induce
different responses ranging from a sliding-sensitive wall (Configuration No1), to a rotationally
sensitive one mobilizing a bearing capacity failure mechanism (Configuration No3).
Configuration No2 represents an intermediate case having comparable safety factors against
sliding and bearing capacity. From Table 2, it is also evident that the safety factor against
bearing capacity is dramatically decreased with increasing acceleration compared to the
corresponding safety factor against sliding.
4. Experimental procedure
The three wall configurations were subjected to the following series of dynamic tests: (1)
Exploratory white noise testing to investigate the soil-wall system response; (2) Harmonic-
sinusoidal inputs at various excitation frequencies and increasing amplitude, until yielding of
the wall and sufficient plastic deformation of the system is recorded; (3) Dynamic excitation of
the system with scaled earthquake signals of increasing amplitude, until sufficient yielding of
the wall is recorded. Note that restoration of the wall-backfill system was needed after steps 2
and 3.
During exploratory white noise testing, a random noise signal of bandwidth 1-100 Hz and RMS

14
acceleration = 0.005g was employed. Harmonic excitation involved sine dwells consisting of
15 steady cycles, 5-cycle ramp up to full test level at the beginning and a 5-cycle ramp down to
zero at the end, to smoothen out the transition between transient and steady-state response. After
dynamic investigation of the system at various excitation frequencies and low acceleration
amplitude of 0.05g, a sole frequency of 7Hz was employed with increasing amplitude, until
failure.
For the seismic testing, a modified version of the Sturno record from the Irpinia-Italy, 1980
earthquake (Mw= 6.9, PGA=0.32g), was selected, characterized by a strong motion duration of
16.2sec and an energy transfer to a wide range of frequencies from 0.1 to 3 Hz (predominant
frequency of 0.4 Hz), as shown in Fig. 9. A frequency scale factor of 5 was applied to the
original signal, according to scaling laws for 1-g conditions [46]. The frequency-scaled signal
was applied starting at a low acceleration amplitude of 0.05g, which was increased until failure.
The excitation frequencies for both sinusoidal and seismic inputs were essentially pseudo-static,
as they are much below the resonant frequencies of the system. Regarding the data acquisition,
the output signals were filtered with a low pass Butterworth filter of 80 Hz and sampled at 1024
Hz, except of the white noise tests which were sampled at 256 Hz.
5. Experimental results - discussion
5.1 Dynamic properties
The estimation of the dynamic properties of the soil-wall system was based on the interpretation
of the white noise test results in the context of established empirical correlations for soil
stiffness [47] and the predictions of wave propagation theory. In Fig. 10, characteristic
frequency response functions (FRF) for Configurations No1 and No3 are presented for the
response of the wall, before and after the placement of the backfill, as well as for the backfill
itself. Regarding the wall stem response (sensors A5 – A6), a frequency of 25.5Hz measured

15
for Configuration No1 corresponds to the first vibration mode of a fixed base cantilever with
the same stiffness and inertial properties. On the other hand, due to foundation rocking in
Configuration No3, the fixed-base vibration mode of the cantilever cannot be mobilised, and a
lower resonance frequency of 19Hz is recorded. When the response of the wall with respect to
the input acceleration is examined (sensors A1 – A6), these values reduce to 23.5 Hz and 17
Hz, respectively, reflecting the effect of the compliant base.
When the backfill is added, resonant frequencies of 36, 47 and 52 Hz, appear (sensors A1 –
A15). From them, the frequency of 47Hz is identified as the fundamental natural frequency of
the backfill, as back-calculated shear modulus at low strain G0 = 16ρH 2 f = 20GPa is compatible
to the predictions of the empirical relation by Hardin & Drenvich [47], evaluated at the middle
of the soil column. With the overburden stress of the backfill taken into account, the same
correlation for the foundation layer yields G0 values of about 40GPa. Based on these values, a
resonant frequency of 36 Hz is derived by means of 1D wave propagation theory for a two-
layer medium [48], which is in good agreement with the frequencies recorded during white-
noise testing. Finally, because of the finite length of the backfill (length to height ratio L/H~5)
the corresponding resonant frequency increases from 47Hz to 52 Hz [11, 49]. This is essentially
an indication of the stiffening effect of the box boundary. A summary of the above model
parameters is presented in Figure 11. Additionally, the Poisson’s ratio ν = 0.3 and a damping
ratio of 2.5% to 5% were considered.
5.2 Experimental results for displacements, seismic loads and failure mechanisms
A set of key experimental measurements are presented in Figures 12 to 17, with reference to
failure mechanisms, accelerations, dynamic and permanent displacements and bending
moments, organised in sets of graphs suitable for comparisons. Most of the results presented
here relate mainly to Configurations No1 and No3, since they exhibit yielding for similar

16
acceleration conditions, yet under different failure modes.
Observations on failure mechanisms can be made based on settlement profiles such as those
depicted in Fig. 12, and from contour plots of acceleration distributions corresponding to the
time instant of peak acceleration during active failure drawn in Fig. 13. The assumed failure
mechanisms confirm the estimations based on the material properties, the stability analysis and
the yield accelerations outlined in Tables 1 and 2 respectively, although this comparison is only
indicative, as these are velocity characteristics not exactly coinciding with the corresponding
stress characteristics [50]. Distinct failure mechanisms were observed only for transient
earthquake loading, leading to large uniform deformations. Although there is no “rigid block”
response in the retained soil mass, the experimental observations indicate that the earthquake
excitation induces a more uniform acceleration distribution within the backfill over the
harmonic loading, which corresponds to a more uniform stress field, as assumed in the pseudo-
static analyses. The differences between backfill response to earthquake and harmonic loading
have been discussed by Nakamura [13].
Time histories for accelerations, wall displacements and dynamic bending moments at the base
of the wall stem are presented in Figs 14 - 17. Figures 14 and 15 pertain to harmonic loading
(acceleration amplitudes of 0.19g and 0.23g). The response of each configuration is as expected,
exhibiting a consistent, repeatable, behaviour with respect to yielding. A translational response
mode is evident in Configuration No1 and a rocking one in Configuration No3, respectively.
Sliding discontinuities are evident in the acceleration time histories of Configuration No1, at a
critical acceleration compatible with that predicted by limit analysis considerations in Table 2.
Note that the critical acceleration always increases as the wall toe penetrates the underlying soil
layer, thus resulting to an increase in sliding resistance. This has also been observed in
numerical simulations results [51]. On the other hand, Configuration No3 starts to rotate at
initiation of yielding, without any evidence of sliding discontinuities on the recorded

17
accelerations. Evidence of rigid body rotation in the direction away from the backfill can be
observed on the bending moment time history. Both configurations exhibit some rocking
response, as a result of foundation rocking (which is more evident in Configuration No3) and
possibly due to a pitch rotation of the shaking table itself.
Similar results for earthquake loading are presented in Figs 16 – 17. In this case, the input
motion contains higher effective peak accelerations, but the number of important strong motion
cycles (half cycle pulses) is only three. The sliding failure mode is, again, visible in
Configuration No1, as is the bearing capacity failure in Configuration No3 (caused by the high
eccentricities induced by the seismic thrust). An important observation about the failure modes
is that the bearing capacity failure is more affected by the input acceleration level, whereas the
behaviour of pure sliding mechanisms is mainly controlled by the duration of the strong ground
motion, as known from sliding block theory [52]. Accordingly, rotational mechanisms appear
to be more critical under strong ground shaking. Moreover, some rotational deformation is also
observed in Configuration No1 for high acceleration level, revealing that the compliant base
tends to induce local bearing capacity failure near the toe due to high stress concentration.
A noteworthy observation is that the bending moment at the base of the stem increases (positive
ΔΜ) when the wall moves towards the backfill, that is for an acceleration level which is not
critical for overall stability. On the other hand, during active conditions bending moment is
minimised while displacement is maximum. Similar remarks have been made on the numerical
simulations of a full scale cantilever retaining wall by Green et al. [51]. It appears that when
the inertial action drives the wall towards the backfill, stresses increase towards the passive
state, peak bending moments develop, and the backfill exhibits a stiffer behaviour.
5.3 Interpretation of results in light of sliding block theory
The ability to predict and control displacements under allowable limits for both sliding and

18
tilting is a key issue related to the performance based design of retaining walls. Although sliding
block models (i.e. Richards & Elms [52]) are broadly applied, the evaluation of permanent
rotation by means of equivalent rotational blocks (i.e. Zeng & Steedman [53]) is problematic
due to rigid base assumptions.
Results for the incremental permanent wall displacement and rotation, together with
corresponding eccentricities at the instant of failure, are presented in Figs 18 and 19, for
Configurations No1 and No3, for both harmonic and seismic tests series. The corresponding
critical acceleration values of Table 2, which are essential in the context of sliding block theory,
are indicated on the graphs. It is worth mentioning that the critical accelerations that can induce
uplift and overturning of the wall, in presence of a rigid base, are much higher (0.62g for
Configuration No1 and 0.43g for Configuration No3) than the yield accelerations, so the
overturning mechanisms are not feasible.
The following can be deducted from the graphs: First, the response of the systems with respect
to translation and rotation is compatible with the predicted yield accelerations in Table 2.
Second, the predictions of Richards & Elms [52] method overestimate the sliding
displacements. This is evident in the case of Configuration No1, which is a mainly sliding
mechanism, but not in the case of Configuration No3 where there is an underestimation of
displacements for accelerations lower than critical. This is because response of Configuration
No3 is mainly driven by the tilting failure mode, which is mobilised first. Third, both models
exhibit a tendency for rotation at lower accelerations than those predicted by rotating block
models, which arise from foundation yielding. In the particular case of Configuration No3, a
rotation significantly exceeding the 1/500 limit specified by AASHTO is observed,
accompanied by excessive settlement and bearing capacity failure. This rotation is related in
both models, to eccentricities lower than the B/6 limit. Fourth, Fig 17 suggests that for both
Configurations, accelerations over a limit of 0.32g-0.35g cannot develop in the wall-soil

19
system. As a result, the eccentricities and rotations at yielding stop increasing proportionally to
input acceleration. It appears that the plastic soil distortion under the wall toe, is beneficial for
the system, by reducing the seismic forces transmitted to the foundation, thus preventing wall
uplift and overturning.
5.4 Interpretation of dynamic bending moments
Given that no direct measurements of earth pressures were made, some observations regarding
dynamic stresses can be inferred from bending moment measurements on the wall stem. Note
that the strain gauges performed adequately in recording the dynamic increment of bending
moment, ΔΜ, but not the static part.
In Fig. 20 an interpretation of peak measured dynamic bending moments is presented, based on
simplified assumptions as to the variation of inertial forces and earth pressures behind the wall.
It is assumed that the bending moments on the wall stem are generated by the inertial force Fw,
due to the relative top-to-base acceleration Α6 - Α5 [14] and the variation of the earth pressures
ΔPE on the vertical virtual back. The latter is proportional to (ah/g)γz in the context of Wood’s
pseudostatic approach [54] under the assumption of linear variation of acceleration with depth,
based on measurements of sensors A13 and A16. On the other hand, the inertial force acting on
the soil mass over the footing slab (hatched area), which is moving in phase with the wall, is
not taken into account [1, 18].
In Fig 21, envelopes of minimum and maximum bending moment profiles, as recorded from
the strain gauges, are compared to the predictions of the theoretical approach for different
harmonic (0.15g, 0.19g and 0.23g) and seismic (0.17g, 0.35g and 0.55g) loading for
Configurations No1 and No3. A good agreement of measurements and predictions is evident in
the graph, especially for the cases of seismic loading.
The contribution of the inertial force of the wall stem on the dynamic bending moment is found

20
to be small, between approximately 2.5% and 10% of the total dynamic moment, which is
compatible to the findings of Al Atik & Sitar from centrifuge tests [14]. However, the inertia
of the entire wall mass and the soil mass over the footing slab are important and have to be
taken into account together with the active earth pressure on the virtual back determined by Eqns.
(3) and (4), when the overall equilibrium of the soil-wall system is examined, as shown in Fig.
4. The increase in bending moments during wall displacement towards the backfill, is an
indication that sizing the wall stem for active conditions is not conservative and different load
combinations need to be employed [51]. Additional research is required to develop design
recommendations.
6. Conclusions
In the work at hand, results from 1-g shaking table tests on scale models of cantilever retaining
walls were presented. The initial motivation of the study was the validation of recent stress limit
analysis solutions for the seismic design of this type of retaining structures [21-23], in
conjunction with the absence of specific design recommendations in seismic codes. Issues
related to design and dynamic response of walls on a compliant base, were discussed. Both
theoretical and experimental findings shed light on salient features of the problem. The main
conclusions of the study are summarised below:
1) The proposed seismic Rankine analysis provides an exact solution for the pseudo-static
seismic earth pressure acting under an acceleration-dependent inclination, (0), on the
vertical virtual back of the wall, which is valid for the vast majority of cantilever walls
supported by spread footings. The increase in thrust inclination with increasing seismic
acceleration is a beneficial response mechanism which can be employed for reducing
uncertainties and achieving rational and economic designs.
2) The experimental results confirm the predictions of the theoretical stress limit analysis,

21
with reference to the failure mechanisms and the critical yield accelerations of the
system. Pseudo-static stability analysis performs adequately for both harmonic and
seismic excitations. Earthquake loading leads to conditions which are closer to the
assumptions of the pseudo-static analysis, namely the uniform distribution of
acceleration and the “rigid block” response of the backfill.
3) The responses of the various experimental configurations examined, confirm the
predictions of the stability analysis of the retaining walls in terms of an equivalent
centrically-loaded footing and the relationship between wall tilting and bearing capacity
failure. The validity of design recommendations in seismic codes (ΕC7, AASHTO
LRFD) for avoiding excessive rotation is confirmed. The rotational mechanisms appear
to be more sensitive to strong seismic shaking as compared to sliding mechanisms. In
addition, an amount of tilting is observed in the majority of the tests and is attributed to
plastic deformation/local bearing capacity failure under the wall toe, due to high
eccentricities and inclination of soil reaction. The eccentricities are, nevertheless,
smaller than the limit values specified by seismic codes. These findings highlight the
importance of a proper design of walls founded on compliant base with respect to sliding
and tilting.
4) Regarding seismic loads acting on the structure, it is shown that the soil thrust
maximising the bending moment on the wall stem does not coincide with the critical
active earth pressure, but develops when the wall is moving towards the backfill, due to
the increased resistance and stiffness of soil, as the system is moving towards the
“passive” state. This indicates that different load combinations need to be employed for
the sizing of the wall stem and for the overall stability analysis of the wall against sliding
and bearing capacity, which happens as the system moves towards the “active” state,
away from the backfill. This observation is in agreement with the findings by Green et

22
al. [51]. Moreover, unlike the case of conventional gravity walls, inertial forces on the
cantilever wall are less important for the overall stability compared to soil overburden,
which mainly drive the behaviour of the system, and also have a small contribution to
the dynamic bending moment, in agreement with the findings of Al Atik & Sitar [14]
using centrifuge tests.
Acknowledgements
The research leading to these results has received funding from the European Union Seventh
Framework Programme (FP7/2007–2013) for access to the Bristol Laboratory for Advanced
Dynamics Engineering (BLADE), University of Bristol, UK under grant agreement 227887
[SERIES]. The authors are also grateful to two anonymous reviewers whose comments
improved the original manuscript.
References
[1] American Association of State Highway and Transportation Officials. LRFD Bridge Design
Specifications. 6th ed. Washington DC: AASHTO; 2012.
[2] EN 1997-1. Eurocode 7: Geotechnical Design, Part 1: General Rules. Bruxelles: CEN, E.C.
for Standardization; 2004.
[3] EN 1998-5. Eurocode 8: Design Provisions for Earthquake Resistance of Structures, Part 5:
Foundations, Retaining Structures and Geotechnical Aspects. Bruxelles: CEN, E.C. for
Standardization; 2004.
[4] NEHRP 2009. Recommended Seismic Provisions for New Building and Other Structures.
Washington DC: Federal Emergency Management Agency (FEMA P-750), Building Seismic
Safety Council; 2009.
23
[5] Shamsabadi A, Xu SY, Taciroglu E. Development of Improved Guidelines for Seismic
Analysis and Design of Earth Retaining Structures. Caltrans Final Report No. CA13-2270. Los
Angeles: UCLA; 2013.
[6] Arias A, Sanchez-Sesma FJ, Ovando-Shelley E. A simplified elastic model for seismic
analysis of earth-retaining structures with limited displacements. Proceedings of the
International Conference on Recent Advances in Geotechnical Earthquake Engineering and
Soil Dynamics, St. Louis 1981; 1: 235–40.
[7] Veletsos AS, Younan AH. Dynamic soil pressures on rigid vertical walls. International
Journal of Earthquake Engineering and Structural Dynamics 1994, 23: 275–301.
[8] Theodorakopoulos DD, Chassiakos AP, Beskos DE. Dynamic Pressures on Rigid Cantilever
Walls Retaining Poroelastic Soil Media. Part I: First Method of Solution. Soil Dynamics and
Earthquake Engineering 2001; 21(4): 315–38.
[9] Theodorakopoulos DD, Chassiakos AP, Beskos DE. Dynamic Pressures on Rigid Cantilever
Walls Retaining Poroelastic Soil Media. Part I: First Method of Solution. Soil Dynamics and
Earthquake Engineering 2001; 21(4): 339–64.
[10] Ostadan F. Seismic soil pressure for building walls: an updated approach. Soil Dynamics
and Earthquake Engineering 2005; 25(7–10): 785-93.
[11] Kloukinas P, Langousis M, Mylonakis G. Simple wave solution for seismic earth pressures
on nonyielding walls. Journal of Geotechnical and Geoenvironmental Engineering ASCE
2012; 138(12): 1514-19.
[12] Watanabe K, Kobayashi Y, Touhata I, Macda T. Shaking-table tests on seismic earth
pressure exerted on retaining wall model. Proc. 2nd Int. Conf. Earthquake Engineering; 1999.
[13] Nakamura S. Reexamination of Mononobe-Okabe theory of gravity retaining walls using
centrifuge model tests. Soils and Foundations 2006; 46(2): 135-46.

24
[14] Al Atik L, Sitar N. Seismic earth pressures on cantilever retaining structures. Journal of
Geotechnical and Geoenvironmental Engineering ASCE 2010; 136(10): 1324-33.
[15] Wilson P, Elgamal A. Full scale bridge abutment passive earth pressure tests and calibrated
models. Proceedings of the 14th World Conference on Earthquake Engineering. Beijing China;
2008.
[16] Athanasopoulos-Zekkos A, Vlachakis VS, Athanasopoulos GA. Phasing issues in the
seismic response of yielding, gravity-type earth retaining walls – Overview and results from a
FEM study. Soil Dynamics & Earthquake Engineering 2013; 55: 59-70.
[17] Seed HB, Whitman RV. Design of Earth Retaining Structures for Dynamic Loads.
Proceedings, Specialty Conference on Lateral Stresses in the Ground and Design of Earth-
Retaining Structures ASCE 1970. Ithaca, New York; 103-47.
[18] Anderson DG, Martin GR, Lam IP, Wang JN. Seismic Analysis and Design of Retaining
Walls, Slopes and Embankments, and Buried Structures. NCHRP Report 611. Washington DC:
Transportation Research Board, National Research Council; 2008.
[19] Shamsabadi A, Xu SY, Taciroglu E. A generalized log-spiral Rankine limit equilibrium
model for seismic earth pressure analysis. Soil Dynamics & Earthquake Engineering 2013; 49:
197–209.
[20] Brandenberg SJ, Mylonakis G, Stewart JP. Kinematic Framework for Evaluating Seismic
Earth Pressures on Retaining Structures Journal of Geotechnical and Geoenvironmental
Engineering 2015; 141. DOI: 10.1061/(ASCE)GT.1943-5606.0001312
[21] Evangelista Α, Scotto di Santolo Α, Simonelli ΑL. Evaluation of pseudostatic active earth
pressure coefficient of cantilever retaining walls. Soil Dynamics and Earthquake Engineering
2010; 30(11): 1119–28.
[22] Scotto di Santolo A, Evangelista Α. Dynamic active earth pressure on cantilever retaining
walls. Computers and Geotechnics 2011, 38(8): 1041-51.

25
[23] Kloukinas P, Mylonakis G. Rankine solution for seismic earth pressures on L – shaped
retaining walls. 5ICEGE. Santiago Chile; 2011.
[24] Kloukinas P, Penna A, Scotto di Santolo A, Bhattacharya S, Dietz M, Dihoru L, et al.
Experimental Investigation of Dynamic Behaviour of Cantilever Retaining Walls. 2nd
International Conference on Performance Based Design in Earthquake Geotechnical
Engineering. Taormina Italy; 2012.
[25] Scotto di Santolo A, Penna A, Kloukinas P, Bhattacharya S, Dietz M, Dihoru L, et al.
Experimental Investigation of Dynamic Behaviour of Cantilever Retaining Walls. 15th World
Conference on Earthquake Engineering. Lisbon; 2012.
[26] Kloukinas P, Penna A, Scotto di Santolo A, Bhattacharya S, Dietz M, Dihoru L, et al.
Experimental Investigation of Dynamic Behaviour of Cantilever Retaining Walls. Proceedings
of the 4th ECCOMAS COMPDYN Thematic Conference on Computational Methods in
Structural Dynamics and Earthquake Engineering. Kos Greece; 2013.
[27] Kloukinas P, Penna A, Scotto di Santolo A, Bhattacharya S, Dietz M, Dihoru L, et al.
Experimental Investigation of Dynamic Behaviour of Cantilever Retaining Walls. In: Ilki A,
Fardis MN, editors. Seismic Evaluation and Rehabilitation of Structures, Geotechnical,
Geological and Earthquake Engineering 26, DOI 10.1007/978-3-319-00458-7_27, Switzerland:
Springer International Publishing; 2014.
[28] Lancellotta R. Lower-Bound Approach for Seismic Passive Earth Resistance.
Geotechnique 2007; 57(3): 319-21.
[29] Mylonakis G, Kloukinas P, Papantonopoulos C. An Alternative to the Mononobe–Okabe
Equations for Seismic Earth Pressures. Soil Dynamics and Earthquake Engineering 2007;
27(10): 957-69.
[30] Greco VR. Active earth thrust on cantilever walls in general conditions. Soils and
Foundations 1999; 39(6): 65–78.

26
[31] Huntington WC. Earth Pressures and Retaining Walls. NY: John Wiley and Sons; 1957.
[32] Chu SC. Rankine analysis of active and passive pressures in dry sands. Soils &
Foundations 1991; 31(4): 115 – 20.
[33] Gazetas G, Garini E, Anastasopoulos I, Georgarakos T. Effects of Near-Fault Ground
Shaking on Sliding Systems. Journal of Geotechnical and Geoenviromental Engineering ASCE
2009; 135(12): 1906–21.
[34] Greco VR. Stability of retaining walls against overturning. Journal of Geotechnical &
Geoenvironmental Engineering ASCE 1997; 123(8): 778 – 80.
[35] Dacoulas P, Gazetas G. Insight into seismic earth and water pressures against caisson quay
walls. Geotechnique 2008; 58(2): 95-111.
[36] Caltrans. California amendments to the AASHTO LRFD bridge design specifications 4th
ed. Department of Transportation, State of California; 2011.
[37] Butterfield R. On dimensioning the base of a traditional retaining wall. Geotechnique
Letters 2012; 2: 25–8.
[38] Marketos G, Madabhushi SPG. An investigation of the failure mechanism of a cantilever
retaining wall under earthquake loading. International Journal of Physical Modelling in
Geotechnics 2004; 4: 33-44.
[39] Crewe AJ, Lings ML, Taylor CA, Yeung AK and Andrighetto R. Development of a Large
Flexible Shear Stack for Testing Dry Sand and Simple Direct Foundations on a Shaking Table.
In: Elnashai, editor. European seismic design practice. Rotterdam: Balkema; 1995.
[40] Bhattacharya S, Lombardi D, Dihoru L, Dietz MS, Crewe AJ, Taylor C. Role of seismic
testing facilities in performance-based earthquake engineering. Geological and Earthquake
Engineering 2012; 22: 135-58.
[41] Younan AH, Veletsos AS. Dynamic response of flexible retaining walls. Earthquake
Engineering and Structural Dynamics 2000; 29: 1815-44.

27
[42] Cavallaro A, Maugeri M, Mazzarella R. Static and dynamic properties of Leighton Buzzard
sand from laboratory tests. Proc. of 4th Int. Conf. on Recent Advances in Geotechnical
Earthquake Engineering and Soil Dynamics and Symposium in Honour of Prof. WD Liam Finn.
San Diego California; 2001.
[43] Dietz MS and Muir Wood D. Shaking table evaluation of dynamic soil properties.
Proceedings of the fourth international conference on earthquake geotechnical engineering.
Thessaloniki Greece; 2007.
[44] Lings M, Dietz M. The peak strength of sand steel interfaces and the role of dilation. Soils
and Foundations 2005; 45(6): 1-14.
[45] Dietz MS, Lings ML. Post peak strength of interfaces in a stress-dilatancy framework.
Journal of Geotechnical and Geoenvironmental Engineering ASCE 2006; 132(11): 1474-84.
[46] Muir Wood D, Crewe A, Taylor CA. Shaking table testing of geotechnical models.
International Journal of Physical Modelling in Geotechnics 2002; 2: 1-13.
[47] Hardin BO and Drenvich VP (1972) Shear modulus and damping in soils: design equations
and curves. Journal of the Soils Mechanics and Foundation Division ASCE 1972; 98(SM7):
667-92.
[48] Kramer SL. Geotechnical Earthquake Engineering. New Jersey: Prentice Hall; 1996.
[49] Veletsos AS, Parikh VH, Younan AH. Dynamic response of a pair of walls retaining a
viscoelastic solid. Earthquake Engineering and Structural Dynamics 1995; 24(12): 1587-89.
[50] Chen WF and Liu XL. Limit Analysis in Soil Mechanics. Amsterdam: Elsevier; 1990.
[51] Green RA, Olgun CG, Cameron WI (2008) Response and modeling of cantilever retaining
walls subjected to seismic motions. Computer-Aided Civil and Infrastructure Engineering
2008; 23: 309–22.
[52] Richards RJr, Elms DG. Seismic Behavior of Gravity Retaining Walls. Journal of the
Geotechnical Engineering Division ASCE 1979; 105(GT4): 449-64.

28
[53] Zeng X, Steedman RS. Rotating block method for seismic displacement of gravity walls.
Journal of Geotechnical and Geoenviromental Engineering ASCE 2000; 126: 709-17.
[54] Wood JH. Earthquake-Induced Soil Pressures on Structures. EERL 73-05 Earthquake
Engineering Research Laboratory, California Inst. of Technology, Pasadena CA; 1973.

29
Figure captions
Figure 1. Problem parameters
Figure 2. Seismic stress tensor (a) and characteristics in Rankine wedge (b)
Figure 3. Variation of active thrust inclination on virtual vertical wall back (0), as function of
horizontal seismic acceleration
Figure 4. Modified pseudostatic analysis of soil-wall system and wall stability in terms of
equivalent centrically loaded footing analysis
Figure 5. Deviation of static Rankine (Μ-Ο with δ = β) and Coulomb (M-O with = w =
2φ/3) analysis results, following the AASHTO recommendations, from the proposed exact
seismic Rankine solution
Figure 6. Results for optimized wall geometry (b1, b2) for various acceleration levels: a)
Safety factor against sliding, b) Optimised base dimensions b1 and b2, c) Eccentricity of soil
reaction on footing, d) Increase in Safety Factors of optimised geometry, under gravitational
loading
Figure 7. Geometry and instrumentation of the shaking table model (dimensions in mm)
Figure 8. Wall model geometry and positions of strain gauges (dimensions in mm)
Figure 9. Modified Sturno (1980) acceleration input motion
Figure 10. Characteristic frequency response functions (FRF) of soil-wall system
Figure 11. Interpreted dynamic parameters of soil-wall model
Figure 12. Failure mechanisms back-calculated from measured surface settlements profile
Figure 13. Typical acceleration distributions in the soil during active failure conditions
Figure 14. Comparison of typical experimental results for Configurations No1 and No3 under
sinusoidal - harmonic excitation of 0.19g with respect to: (a) wall accelerations, (b) wall
displacements, (c) maximum dynamic moment M on the cantilever wall stem
Figure 15. Comparison of typical experimental results for Configurations No1 and No3 under
sinusoidal - harmonic excitation of 0.23g with respect to: (a) wall accelerations, (b) wall
displacements, (c) maximum dynamic moment M on the cantilever wall stem
Figure 16. Comparison of typical experimental results for Configurations No1 and No3 under
seismic excitation of polarized PGA 0.35g with respect to: (a) wall accelerations, (b) wall
displacements, (c) maximum dynamic moment M on the cantilever wall stem
Figure 17. Comparison of typical experimental results for Configurations No1 and No3 under
seismic excitation of polarized PGA 0.55g with respect to: (a) wall accelerations, (b) wall
displacements, (c) maximum dynamic moment M on the cantilever wall stem
Figure 18. Increments of permanent displacement and rotation and back-calculated load

30
eccentricities acting at the instance of failure, for Configuration No1 and No3 under harmonic
excitation
Figure 19. Increments of permanent displacement and rotation and back-calculated load
eccentricities at failure, for Configuration No1 and No3 under seismic excitation
Figure 20. Actions contributing to the dynamic bending moment on the stem of the cantilever
wall
Figure 21. Variation of bending moments for Configurations No1 and No3, under harmonic
and seismic loading of amplitudes 0.15g, 0.19g and 0.23g and 0.17g, 0.35g and 0.55g,
respectively

31
Figures
Figure 1
Figure 2
(a)
(b)

32
Figure 3
Figure 4

33
Figure 5

34
Figure 6
Figure 7

35
Figure 8
Figure 9

36
Figure 10
Figure 11

37
Figure 12
Figure 13

38
Figure 14
Figure 15

39
Figure 16
Figure 17

40
Figure 18
Figure 19

41
Figure 20
Figure 21

42
Tables
Table 1. Soil properties
Soil layers Voids ratio
e
Relative
density,
Dr (%)
Unit
weight (kN/m3)
Foundation 0.61 60 16.14
Backfill 0.72 22 15.07
Leighton Buzzard 14 – 25 (Fraction B) sand properties:
Dmin = 0.6mm, Dmax = 1.18 mm, D50 = 0.82 mm,
Gs = 2.64 Mg/m3, emin = 0.486, emax = 0.78
Table 2. Pseudostatic critical accelerations and associated safety factors (SF) with respect to sliding and
bearing capacity.
Test
configuration
Critical accel.
ay, sliding
SFbearing capacity
at ay, sliding
Critical accel.
ay, bearing capacity
SFsliding
at ay, bearing capacity
Configuration No1 0.18g 7.45 0.35g 0.68
Configuration No2 0.14g 1.46 0.17g 0.93
Configuration No3 0.23g 0.44 0.17g 1.14
Top Related