


Languages
Pages
Legal


i
KINETIC, MORPHOLOGICAL, AND COMPOSITIONAL CHARACTERIZATION OF
THE UPTAKE OF AQUEOUS Ba2+, Mn2+, AND Cd2+ IONS BY CALCITE AND ARAGONITE OVER A
WIDE RANGE OF CONCENTRATION
A Thesis Submitted to the Graduate School of Engineering and Science of
Đzmir Institute of Technology in Partial Fulfillment of the Requirements for the Degree of
MASTER OF SCIENCE
in Chemistry
by
Özge TUNUSOĞLU
July 2007 ĐZMĐR

ii
We approve the thesis of Özge TUNUSOĞLU
Date of Signature
………………………… 16 July 2007 Assoc. Prof. Dr. Talal SHAHWAN Supervisor Department of Chemistry Đzmir Institute of Technology ………………………… 16 July 2007 Assoc. Prof. Dr. Ahmet E. EROĞLU Department of Chemistry Đzmir Institute of Technology ………………………… 16 July 2007 Assoc. Prof. Dr. Hürriyet POLAT Department of Chemistry Đzmir Institute of Technology ………………………… 16 July 2007 Assoc. Prof. Dr. Serdar ÖZÇELĐK Department of Chemistry Đzmir Institute of Technology ………………………… 16 July 2007 Assoc. Prof. Dr. Selahattin YILMAZ Department of Chemical Engineering Đzmir Institute of Technology ………………………… 16 July 2007 Prof. Dr. Levent ARTOK Head of Department Đzmir Institute of Technology
………………………… Prof. Dr. M. Barış ÖZERDEM Head of the Graduate School
iii
ACKNOWLEDGMENTS
I would like to express my grateful thanks to my supervisor Assoc. Prof. Dr.
Talal R. A. SHAHWAN, for his instructive comments, motivations, and valued support
throughout my thesis study and patience to my questions.
I would also like to thank Assoc. Prof. Dr. Ahmet E. EROĞLU and Assoc. Prof.
Dr. Durmuş ÖZDEMĐR for their helps and guidance throughout my study.
Special thanks to group members of Materials Research Center, Evrim YAKUT,
Mine BAHÇECĐ, Duygu OĞUZ, and Gökhan ERDOĞAN for their helps in XRD and
SEM/EDS analysis. Also, I would like to thank to Oya ALTUNGÖZ, Sinan YILMAZ,
Aslı ERDEM, Arzu ERDEM, Müşerref YERSEL, and Betül ÖZTÜRK at Department
of Chemistry, for their helps in ICP-AES, AAS, and FTIR analysis.
Also, I would like to thank to Demet ERDOĞAN, Çağrı ÜZÜM, and Nazlı
EFECAN, for their kindness in laboratory studies.
I am pleased to thank TUBITAK for its financial support for this study (TBAG-
2478 (104T089)).
Finally, I would like to express my endless thanks to my family and to Research
Assistant Erkin GEZGĐN, for their endless support, motivation, and patience.

iv
ABSTRACT
KINETIC, MORPHOLOGICAL, AND COMPOSITIONAL
CHARACTERIZATION OF THE UPTAKE OF AQUEOUS Ba2+, Mn2+,
AND Cd2+ IONS BY CALCITE AND ARAGONITE OVER A WIDE
RANGE OF CONCENTRATION
The large availability and widespread distribution of calcium carbonate, CaCO3,
in Earth’s crust makes it among the most important minerals to investigate in terms of
environmentally and geochemically important aqueous-metal partitioning interactions.
In this study, the interactions of Ba2+, Mn2+, and Cd2+ with calcite and aragonite
were investigated over a wide range of experimental conditions. The experiments were
conducted to examine the effects of time, concentration, pH, temperature on the uptake
process assess at low concentrations and the composition and morphology of the
precipitated carbonates. The kinetic data corresponding to adsorption were adequately
described by the pseudo-second order rate equation. At equilibrium, the extent of
adsorption on both minerals followed the order Cd2+ > Mn2+ > Ba2+. Precipitation of
metal carbonates proceeded at a slower rate and led to large removal of the ions under
consideration. The mass fractions of the precipitated metal carbonates were determined
using quantitative XRD. For this purpose, empirical equations were developed for
binary carbonate mixtures. FTIR was used to follow the possible modifications in
vibrational modes of calcite and aragonite, and the newly emerging vibrations of
various carbonate phases.
According to SEM results, BaCO3 crystals appeared to be 1-2 micrometers in
size with an olivary-like shape and MnCO3 crystals assumed a cubic shape with 200-
400 nm size. The particles of precipitated CdCO3 did not demonstrate a well defined
shape and its texture appeared to be composed of aggregated sub-micron crystals that
form micron sized particles with irregular appearance.

v
ÖZET
GENĐŞ DERĐŞĐM ARALIĞINDAKĐ Ba2+, Mn2+ VE Cd2+ ĐYONLARININ
KALSĐT VE ARAGONĐT TARAFINDAN TUTULMALARININ
KĐNETĐK, MORFOLOJĐK VE ĐÇERĐK OLARAK BELĐRLENMESĐ
CaCO3 mineralinin yer kabuğunda büyük miktarlarda bulunması ve çeşitli
katyonlara karşı yüksek tutma kapasitesine sahip olması jeokimyasal ve çevresel
açılardan özel bir öneme sahiptir.
Bu çalışmada, çevresel etkileri açısından risk taşıyan, periyodik tablodaki çeşitli
metal grup/periyotlara mensup Ba2+, Mn2+ ve Cd2+ iyonlarının kalsit ve aragonit
mineralleri ile etkileşimi araştırılmıştır. Yapılan araştırmalar kapsamında, düşük
derişimlerdeki tutulmanın belirlenmesinde zaman, derişim etkisi, pH, sıcaklık ve yüksek
derişimlerde çökelen karbonatların morfolojik, içerik ve yapısal özellikleri
incelenmiştir. Adsorpsiyon aşamasında tutulmanın hızlı olduğu ve ikinci-mertebeden
hız denklemine uyduğu görülmüştür. Dengeye ulaşıldığında, hem kalsit hem de
aragonitçe tutulan iyon miktarı bakımından sıralamanın Cd2+ > Mn2+ > Ba2+ şeklinde
olduğu tespit edilmiştir. Metal karbonatların çökelmesi yavaş hızla ilerlemiş ve söz
konusu iyonların büyük oranlarda uzaklaştırılmasına önderlik etmiştir. Kantitatif X-
Işınları Kırınımı (XRD) kullanılarak çökelen metal karbonatların kütle fraksiyonları
belirlenmiş; bu amaçla, ikili karbonat karışımları için deneysel denklemler
geliştirilmiştir. Yapılan Kızıl Ötesi Spektroskopi (FTIR) analizlerine göre, Mn2+ ve Cd2+
iyonlarının kalsitçe veya aragonitçe adsorpsiyonu sonucunda bu minerallerin titreşim
bantlarında çok az değişiklikler olurken, Ba2+ adsorpsiyonu çeşitli değişikliklere neden
olmaktadır.
Taramalı Elektron Mikroskobu (SEM) sonuçlarına göre, BaCO3 çökeltisinin
kristalleri 1-2 mikron boyutunda ve zeytin tanelerine (olivary-like) benzemektedir.
MnCO3 kristalleri ise küp şeklinde ve bir kaç yüz nanometre boyutunda oluşmuştur.
Çöken CdCO3’ın parçaları diğer karbonatlar kadar belirgin bir şekil sergilememekle
birlikte, bu parçalar genellikle mikron-altı ve toplu halde bulunan taneciklerden
oluşmaktadır.

vi
TABLE OF CONTENTS
LIST OF FIGURES ......................................................................................................viii
LIST OF TABLES ........................................................................................................xii
CHAPTER 1. INTRODUCTION .....................................................................................1
1.1. Heavy Metal Pollution ...........................................................................................1
1.2. Calcium Carbonate (CaCO3)..................................................................................3
1.2.1. Calcite .............................................................................................................3
1.2.2. Aragonite.........................................................................................................4
1.2.3. Vaterite ............................................................................................................5
1.3. Uptake Mechanisms of Metals by Carbonates.......................................................6
1.3.1. Ion –Exchange Mechanism.............................................................................6
1.3.2. Surface Complexation.....................................................................................6
1.3.3. Coprecipitation (Solid Solution) .....................................................................7
1.3.4. Precipitation ....................................................................................................9
1.3.5. Solid State Diffusion .....................................................................................10
1.4. Literature Survey..................................................................................................11
CHAPTER 2. SCOPE OF THE STUDY........................................................................14
2.1. Aim of This Work ................................................................................................14
2.2. Applied Methods..................................................................................................14
2.2.1. Atomic Absorption Spectrometry (AAS)......................................................14
2.2.2. Inductively Coupled Plasma-Atomic Emission Spectrometry (ICP-AES)...17
2.2.3. X-Ray Diffraction (XRD) .............................................................................18
2.2.4. Scanning Electron Microscope (SEM)..........................................................20
2.2.5. Energy Dispersive X-Ray Spectroscopy (EDS)............................................21
2.2.6. Fourier Transform Infrared Spectroscopy (FTIR) ........................................22
CHAPTER 3. EXPERIMENTAL...................................................................................24
3.1. Preparation of Samples ........................................................................................24
3.1.1. Aragonite Synthesis ......................................................................................24
3.2. Determination of Zero Point Charge (ZPC) of Calcite and Aragonite ................25
3.3. Particle Size Analysis...........................................................................................25

vii
3.4. BET Analysis .......................................................................................................26
3.5. Uptake Experiments .............................................................................................26
3.5.1. Kinetic Experiments......................................................................................26
3.5.2. Dependence of Metal Uptake on Temperature Change ................................28
3.5.3. Dependence of Metal Uptake on pH Change................................................29
3.6. Analysis of Aqueous Solutions ............................................................................30
3.6.1. AAS...............................................................................................................30
3.6.2. ICP-AES........................................................................................................30
3.7. Characterization of the Solid................................................................................31
3.7.1. XRD ..............................................................................................................31
3.7.2. SEM/EDS......................................................................................................31
3.7.3. FTIR ..............................................................................................................32
3.8. Chemical Speciation Analysis..............................................................................32
CHAPTER 4. RESULTS AND DISCUSSION..............................................................34
4.1. Characterization of Calcite and Aragonite ...........................................................34
4.2. Kinetic and Equilibrium Description of Metal Adsorption on Calcite and
Aragonite..............................................................................................................38
4.2.1. Kinetics .........................................................................................................38
4.2.2. Percentage Adsorption ..................................................................................42
4.3. Kinetics of Precipitate Formation of Metal Carbonates upon Interaction with
Calcite and Aragonite...........................................................................................45
4.3.1. Rate of Precipitate Formation .......................................................................45
4.3.2. XRD Quantitative Calculations.....................................................................50
4.3.3. EDS Mapping................................................................................................57
4.3.4. Effect of pH Change on Precipitate Formation.............................................59
4.3.5. Effect of Temperature Change on Precipitate Formation .............................61
4.4. The Morphological Aspects and FTIR Spectra of Precipitated Metal
Carbonates...........................................................................................................62
4.4.1. SEM Images ..................................................................................................62
4.4.2. Fourier Transform Infrared (FTIR)...............................................................64
CHAPTER 5. CONCLUSION........................................................................................69
REFERENCES................................................................................................................71

viii
LIST OF FIGURES
Figure Page
Figure 1.1. Structure of Calcite………………………………………………………….4
Figure 1.2. Structure of Aragonite………………………………………………………5
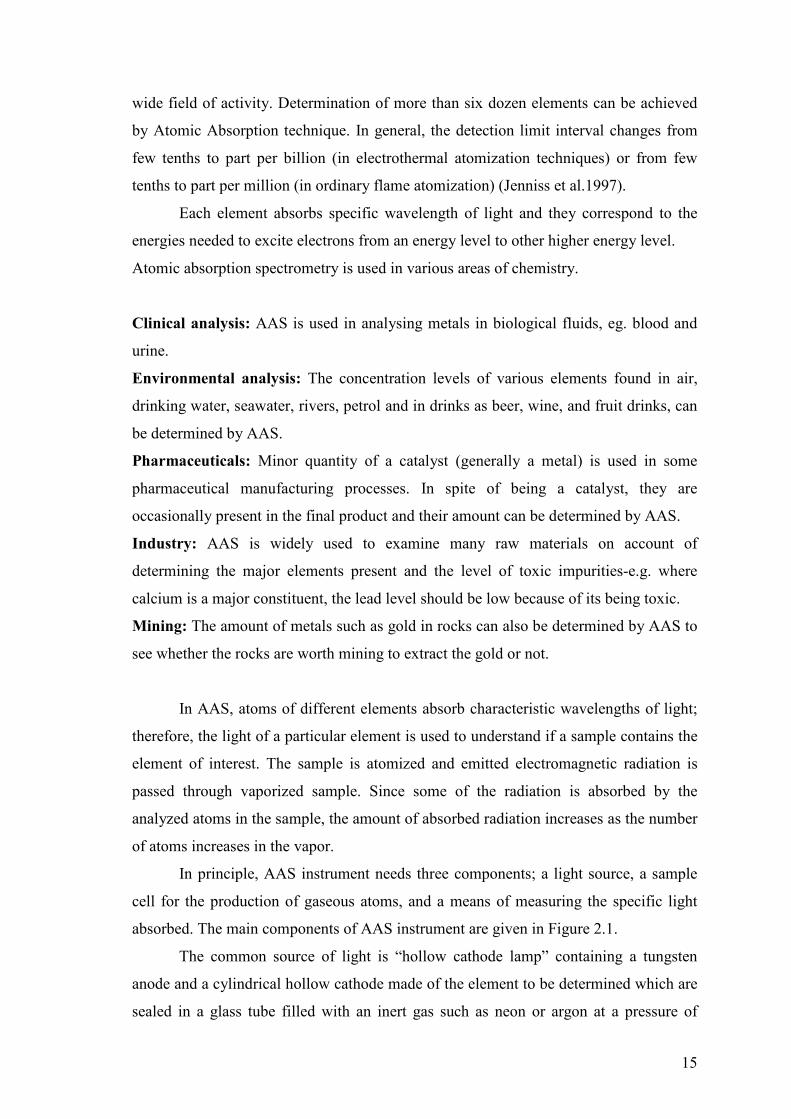
Figure 2.1. Instrumentation of AAS……………………………………………………16
Figure 2.2. Instrumentation of ICP-AES…………………………………………….....17
Figure 2.3. Instrumentation of XRD……………………………………………………19
Figure 2.4. Illustration of Bragg’s Law………………………………………………...19
Figure 2.5. Instrumentation of SEM……………………………………………………21
Figure 2.6. Instrumentation of FTIR …………………………………………...............22
Figure 3.1. Chemical speciation curves of (a) Ba2+, (b) Mn2+, and (c) Cd2+ at
initial concentration of 1000 mg/L in aqueous solution.
Ionic Strength (I): 0.001 and Temperature (T): 25oC……………………..33
Figure 4.1. XRD diagrams of (a) calcite and (b) aragonite used in this work………….34
Figure 4.2. Characteristic SEM images of (a) calcite and (b) aragonite……… ……….35
Figure 4.3. EDS spectra of (a) calcite and (b) aragonite……………………………….35
Figure 4.4. Particle size distribution (for particles less than 38 µm) for: (a) calcite
and (b) aragonite.………………………………………………………..…36
Figure 4.5. Variation of zeta potential with respect to pH for (a) calcite and (b)
aragonite…………………………………………………………………...37
Figure 4.6. The variation of uptake of the ions (a) Ba2+, (b) Mn2+, and (c) Cd2+
by calcite mineral with respect to mixing time…………………………….39
Figure 4.7. The variation of uptake of the ions (a) Ba2+, (b) Mn2+, and (c) Cd2+
by aragonite mineral with respect to mixing time…………………… ……40
Figure 4.8. The linear fits obtained by use of second order rate equation:
(a) adsorption of the ions on calcite, (b) adsorption of the ions on
aragonite……………………………………………………………………41
Figure 4.9. The change in 104 XRD signal of BaCO3 (witherite) precipitate
formed by the interaction of Ba2+ ions with calcite; (a) 1000 mg/L
Ba2+, (b) 5000 mg/L Ba2+, (c) 10000 mg/L Ba2+………………….………..46
Figure 4.10. The change in 104 XRD signal of BaCO3 (witherite) precipitate
formed by the interaction of Ba2+ ions with aragonite; (a) 1000 mg/L

ix
Ba2+, (b) 5000 mg/L Ba2+, (c) 10000 mg/L Ba2+ ……………………..……46
Figure 4.11. The change in 104 XRD signal of MnCO3 (rhodochrosite) precipitate
formed by the interaction of Mn2+ ions with calcite; (a) 1000 mg/L,
Mn2+ (b) 5000 mg/L Mn2+, (c) 10000 mg/L Mn2+ ……..………………….47
Figure 4.12. The change in 104 XRD signal of MnCO3 (rhodochrosite) precipitate
formed by the interaction of Mn2+ ions with aragonite;
(a) 1000 mg/L Mn2+, (b) 5000 mg/L Mn2+, (c) 10000 mg/L Mn2+ ……....47
Figure 4.13. The change in 104 XRD signal of CdCO3 (otavite) precipitate formed
by the interaction of Cd2+ ions with calcite; (a) 1000 mg/L Cd2+,
(b) 5000 mg/L Cd2+, (c) 10000 mg/L Cd2+ …………………….………...48
Figure 4.14. The change in 104 XRD signal of CdCO3 (otavite) precipitate formed
by the interaction of Cd2+ ions with aragonite; (a) 1000 mg/L Cd2+,
(b) 5000 mg/L Cd2+, (c) 10000 mg/L Cd2+ ………………………. ……..48
Figure 4.15. Variation of the mass fractions of MeCO3 in their mixtures with
calcite as a function of the intensity ratio of the MeCO3/calcite;
MeCO3= (a) BaCO3, (b) MnCO3, (c) CdCO3………………………...….51
Figure 4.16. Variation of the mass fractions of MeCO3 in their mixtures with
aragonite as a function of the intensity ratio of the MeCO3/aragonite;
MeCO3= (a) BaCO3, (b) MnCO3, (c) CdCO3…………………………….52
Figure 4.17. The change of mass fractions of precipitated BaCO3 as a function of
time and initial concentration; (a) on calcite surface, (b) on aragonite
surface…………………………………………………………………….54
Figure 4.18. The change of mass fractions of precipitated MnCO3 as a function of
time and initial concentration; (a) on calcite surface, (b) on aragonite
surface…………………………………………………………………….55
Figure 4.19. The change of mass fractions of precipitated CdCO3 as a function of
time and initial concentration; (a) on calcite surface, (b) on aragonite
surface…………………………………………………………………….56
Figure 4.20. X-ray maps showing the distributions of (a) Ca on BaCO3-calcite
surface, (b) Ba on BaCO3-calcite surface, (c) Ca on BaCO3-aragonite
surface, (d) Ba on BaCO3-aragonite surface………………………………58
Figure 4.21. X-ray maps showing the distributions of (a) Ca on MnCO3-calcite
surface, (b) Mn on MnCO3-calcite surface, (c) Ca on MnCO3-aragonite
surface, (d) Mn on MnCO3-aragonite surface…………………………….58

x
Figure 4.22. X-ray maps showing the distributions of (a) Ca on CdCO3-calcite
surface, (b) Cd on CdCO3-calcite surface, (c) Ca on CdCO3-aragonite
surface, (d) Cd on CdCO3-aragonite surface……………………………...59
Figure 4.23. XRD diagrams of the precipitates formed on calcite surface after the
pH of medium was adjusted to 10.0 (a) BaCO3, (b) MnCO3, and
(c) CdCO3. The initial ion concentrations are (i) 1000 mg/L,
(ii) 5000 mg/L, and (iii) 10000 mg/L…………………………………….60
Figure 4.24. XRD diagrams of the precipitates formed on aragonite surface after
the pH of medium was adjusted to 10.0 (a) BaCO3, (b) MnCO3, and
(c) CdCO3. The initial ion concentrations are (i) 1000 mg/L,
(ii) 5000 mg/L, and (iii) 10000 mg/L. ……………………..……………..60
Figure 4.25. XRD diagrams of the precipitates formed on calcite surface after
the temperature of medium was adjusted to 50oC (a) BaCO3,
(b) MnCO3, and (c) CdCO3. The initial ion concentrations are
(i) 1000 mg/L, (ii) 5000 mg/L, and (iii) 10000 mg/L…………………….61
Figure 4.26. XRD diagrams of the precipitates formed on aragonite surface after
the temperature of medium was adjusted to 50oC (a) BaCO3,
(b) MnCO3, and (c) CdCO3. The initial ion concentrations are
(i) 1000 mg/L, (ii) 5000 mg/L, and (iii) 10000 mg/L…………………….62
Figure 4.27. SEM images of BaCO3 precipitated on (a, b) calcite surface,
(c, d) aragonite surface…………………………………………………....63
Figure 4.28. SEM images of MnCO3 precipitated on (a, b) calcite surface,
(c, d) aragonite surface……………………………………………………63
Figure 4.29. SEM images of CdCO3 precipitated on (a, b) calcite surface,
(c, d) aragonite surface……………………………………………………64
Figure 4.30. FTIR spectra of (a): (i) calcite, (ii) Ba2+-calcite (500 mg/L Ba2+),
(iii) BaCO3-calcite (10000 mg/L Ba2+), (b): (i) aragonite,
(ii) Ba2+-aragonite (500 mg/L Ba2+), (iii) BaCO3-aragonite
(10000 mg/L Ba2+)………………………………………………………...66
Figure 4.31. FTIR spectra of (a): (i) calcite, (ii) Mn2+-calcite (500 mg/L Mn2+),
(iii) MnCO3-calcite (10000 mg/L Mn2+), (b): (i) aragonite,
(ii) Mn2+-aragonite (500 mg/L Mn2+), (iii) MnCO3-aragonite
(10000 mg/L Mn2+)………………………………………………………..67

xi
Figure 4.32. FTIR spectra of (a): (i) calcite, (ii) Cd2+-calcite (500 mg/L Cd2+),
(iii) CdCO3-calcite (10000 mg/L Cd2+), (b): (i) aragonite,
(ii) Cd2+-aragonite (500 mg/L Cd2+), (iii) CdCO3-aragonite
(10000 mg/L Cd2+)………………………………………………………...68
xii
LIST OF TABLES
Table Page
Table 1.1. Ionic Radius and Hydration Energy Values of Cations.…………….............3
Table 3.1. Initial and final pH values of solutions of Ba2+ in contact with calcite
or aragonite at different initial concentrations and contact times. The
temperature of the medium was 25oC.……………………………………...27
Table 3.2. Initial and final pH values of solutions of Mn2+ in contact with calcite
or aragonite at different initial concentrations and contact times. The
temperature of the medium was 25oC……………………………………....27
Table 3.3. Initial and final pH values of solutions of Cd2+ in contact with calcite
or aragonite at different initial concentrations and contact times. The
temperature of the medium was 25oC………………………………………28
Table 3.4. The pH change of Ba2+, Mn2+, and Cd2+ cations during interactions
with calcite at different initial cation concentrations and 50oC………….....29
Table 3.5. The pH change of Ba2+, Mn2+, and Cd2+ cations during interactions
with aragonite at different initial cation concentrations and 50oC…………..29
Table 3.6. The pH values of the samples before filtration in the experiments
carried out at pH of 10.0 at various initial concentrations………………….30
Table 4.1. Elemental content of calcite and aragonite obtained by EDS analysis……...36
Table 4.2. Mean, median, mode, and standard deviation for particle size analysis
of calcite and aragonite minerals.…………………………………….…..…36
Table 4.3. Results of surface area and pore size values of calcite and aragonite ...……37
Table 4.4. k2 and qe values obtained by use of second order rate equation....………….41
Table 4.5. The equilibrium results corresponding to the uptake of Ba2+ ions by
calcite and aragonite at various initial concentrations …………………......42
Table 4.6. The equilibrium results corresponding to the uptake of Mn2+ ions by
calcite and aragonite at various initial concentrations ……………….…..…43
Table 4.7. The equilibrium results corresponding to the uptake of Cd2+ ions by
calcite and aragonite at various initial concentrations……………….……...43
Table 4.8. The partition coefficients calculated by the thermodynamic model of
Wang’s and Xu’s (2001)……………………………………………………45
Table 4.9. ICDD card numbers of mineral carbonates relative to their crystal

xiii
structure..........................................................................................................45
Table 4.10. The equations of binary metal carbonates developed for quantitative
XRD analysis..................................................................................................53

1
CHAPTER 1
INTRODUCTION
1.1. Heavy Metal Pollution
Any metallic chemical that has a relatively high density and is generally toxic or
poisonous at low concentrations is named as a heavy metal. These metals are inherent
components of Earth’s crust and they cannot be demoted or annihilated. Heavy metals
enter to human bodies via food, drinking water, and air in a small extent. Although
being poisonous at higher concentrations, some heavy metals are essential to maintain
the metabolism of the human body. Drinking-water contamination (e.g. lead pipes),
high ambient air concentrations near emission sources, or intake via the food chain
could be the reason of heavy metal poisoning.
Heavy metals are dangerous as they incline bioaccumulation which means an
increase in the concentration of a chemical in a biological organism over time,
compared to its value in the environment. Heavy metals can come into the water
reservoir by industrial and consumer waste or from acidic rain that causes breaking of
soils and releasing them into lakes, rivers, streams, and groundwater. The cations Ba2+,
Mn2+, and Cd2+ applied in this study are known to be among the cations that possess
various risks from the environmental perspective.
Barium whose chemistry is analogous to that of the other alkaline earth metals is
detected in most surface waters with a median concentration of 43µg/L. Its
concentration range in surface waters varies between 2 and 340µg/L; hence, elevated
concentrations point out the presence of industrial pollution (Pagenkopf 1978). Barium
has a variety of radioactive isotopes. One of these, 140Ba (t1/2=12.8 d) is formed in a
great yield (6.21%) as a result of fission reactions (Lieser 1995), and as a result this
isotope is important in radioactive waste management. Two forms of barium, barium
sulfate (BaSO4) and barium carbonate (BaCO3) are naturally found in underground ores.
Barium compounds are used in paint, brick, tile, glass, eraser, insect and rat poisons, oil
industries, and as an additive in fuels. This element is taken into human body via
drinking waters contaminated with barium, eating waste entangled plants, or breathing

2
dust particles entangled with barium. If taken in high concentrations, barium
compounds may cause paralysis and death. When barium is taken in low amounts, it
leads to shortness of breath, increase in blood pressure, change in heart rhythm and
nerve reflexes, irritation of stomach, minor changes in blood, weakening of muscles,
suffering of kidney, heart, and spleen (WEB_1 2007).
Manganese is a common mineral having four positive oxidation states, +2, +3,
+4, and +7 and its most momentous compound is pyrolusite (MnO2). Divalent state of
manganese is stable in acid or nonoxygenated media, and trivalent state should be
stabilized by complexation. In addition, insoluble oxide is formed in natural waters by
tetravalent state and this oxide is colloidally dispersed or precipitates (Pagenkopf 1978).
Manganese is found in nature at elevated amounts. Low amount of this element is
necessary for regular physiological functions of human beings and animals. In addition
to being one of the natural constituents of some rocks and stones, manganese exists in
air, water, soil, and foods at low amounts. On the other hand, manganese is released into
air from coke furnaces and powerplants. People working on metallic manganese
production are exposed to this element via breathing and it is concluded by health
problems. Continuous exposures may cause permanent brain damages. While anorexia,
weakness, and dormancy are determined in earlier symptoms, it can be possible to come
across with speech and character defects, and also balance problems. Manganese may
cause Parkinson’s disease, allergy in lungs, damages in kidney and liver at very high
doses and long-term exposures.
Cadmium is one of the toxic metals with an oxidation state of +2. It can enter
waterways via native leaching of zinc blende, industrial releases, inappropriate mining
operations, or deterioration of galvanized pipe (Pagenkopf 1978). Cadmium is used in
electronic products, batteries, pigments, plastic stabilizers, metal sheets, and industrial
materials involving alloys. Extreme exposures of cadmium cause lungs to blister;
however, long-term low level effects evoke chronic kidney and lung diseases. In
addition to these effects, it can cause hypertension, other heart diseases and affects the
skeleton system. It is known that, cadmium may show carcinogenic effect on human
beings. Birds and mammals are relatively resistant to excessive influences of cadmium;
nevertheless, it is possible that chronic exposures to cadmium cause histologic changes
in kidney, liver, heart tissue, blood vessels, and bone marrows. Moreover, chronic
exposures lead to increase in death ratios, decrease in growing, and inhibition of
reproduction.

3
The ionic radius and hydration energy values of the studied metal ions in
addition to that of Ca2+ cations are given in Table 1.1.
Table 1.1. Ionic Radius and Hydration Energy Values of Cations
(Source: Langmuir 1997)
1.2. Calcium Carbonate (CaCO3)
Carbonates are very common minerals which form about 4% by weight of
Earth’s crust, and thus are among the most important minerals that play a central role in
the regulation of biogeochemical cycles of heavy metals in the environment. In addition
to this, carbonates control the aquatic environments through sorption, dissolution, and
precipitation reactions which occur between mineral lattice and bulk solution interface
(Shahwan et al. 2002). In addition to being found in structures of rocks, calcium
carbonate is a fundamental component of seashells and the shells of snails. Calcium
carbonate can be naturally found in three polymorphs; calcite, aragonite, and vaterite.
Calcium carbonate is also used in medicine as a calcium supplement or as
antacid. Furthermore, CaCO3 has applications in rubber, paint, paper industries and
cosmetics.
1.2.1. Calcite
Calcite, which obtained its name from the word “chalix” meaning lime in Greek,
is thermodynamically the most stable polymorph of calcium carbonate at room
temperature and atmospheric pressure (WEB_2 2007, Langmuir 1997). This polymorph
is the most important constituent of the carbonate rocks and forms 99% of these kinds
of rocks. Also, calcite can be found as limestone and marble. Under influences of high
CATION IONIC RADIUS
(Å)
HYDRATION ENERGY
(J/mol)
Ca2+ 1.00 -1577
Ba2+ 1.35 -1305
Mn2+ 0.83 -1841
Cd2+ 0.95 -1807

4
heat and pressure of metamorphic circumstances limestone is converted into marble.
The best property of calcite is its use in the acid taste since calcite always bubbles when
weak acids lay on specimens. The reason of this bubbling is the carbon dioxide gas
formation as in Equation 1.1.
CaCO3(s) + 2 H+ Ca2+ + H2O + CO2(g) (1.1)
Due to this test, the geologists can understand if the sandstone sample contains any
cementing mineral since cement in sandstones effervesces. Calcite is generally white or
colorless and possesses a rhombohedral crystal structure with the trigonal carbonate
ions being coplanar as seen in Figure 1.1. The planes including carbonate ions are
perpendicular to the c-axis and they are rotated by 60o from one carbonate layer to the
other carbonate layer.
Figure 1.1. Structure of Calcite
(Source: WEB_3 2005)
1.2.2. Aragonite
Aragonite is a universal carbonate mineral and thermodynamically unstable
polymorph of calcium carbonate at normal surface temperatures and pressures. It can be
stable at higher pressures, but not at higher temperatures since the dry mineral possess a
tendency to convert to calcite spontaneously at higher temperatures. Aragonite is

5
generally white or colorless and possesses orthorhombic crystal structure as seen in
Figure 1.2.
Figure 1.2. Structure of Aragonite
(Source: WEB_4 2006)
The structure of aragonite is composed of triangular carbonate ion groups,
(CO32-), where carbon is at the center of the triangle and the three oxygens are at each
corner. As it is known, the carbonate ions are situated in a single plane and each ion
points to the same direction. However, in aragonite, the carbonate ions are not situated
in a single plane and they do not point the same direction. By destroying the
characteristic trigonal symmetry of calcite structure, they lie in two planes pointing to
opposite directions (WEB_5 2007).
1.2.3. Vaterite
Vaterite is a rare mineral that only appears in highly supersaturated solutions
with respect to aragonite and calcite (Langmuir 1997). It takes its name from the
German mineralogist Heinrich Vater. Contrary to other calcium carbonate polymorphs,
vaterite is considered to be a metastable phase and possesses higher solubility than other
polymorphs. Consequently, when vaterite is subjected to water, it converts to calcite at
6
low temperatures or aragonite at high temperatures (about 60oC). It inherently exists in
mineral springs, organic tissues, gallstones, and urinary calculi.
1.3. Uptake Mechanisms of Metals by Carbonates
1.3.1. Ion –Exchange Mechanism
Any replacement of an ion in a solid phase in contact with a solution by another
ion is called as “ion-exchange” despite the fact that it possesses different meanings as a
word. In a more restrictive sense, the term is utilized for the characterization of
replacement of one adsorbed, easily changeable ion by another. This wariness, utilized
in soil science, indicates a surface occurrence including charged species in outer-sphere
complexes. Operationally, the amount of moles of adsorbed ion charge that can be
desorbed from unit mass of soil, under specified conditions of temperature, pressure,
soil solution composition, and soil-solution mass ratio is named as the ion exchange
capacity of a soil (or of soil-minerals in waters or sediments). Thus, the replacement of
(natural) effortlessly exchangeable ions by a standard cation or anion is usually included
in the measurement of an ion exchange capacity. For cations in contact with carbonate
minerals, ion-exchange is perceived as one of the possible uptake mechanisms at low
cation concentrations. The reaction between CaCO3 and Sr2+ is given as an example of
ion-exchange mechanism, as in Equation 1.2 (Stumm and Morgan 1996). Experimental
evidence based on structural techniques showed that at low concentrations Sr2+ ions
were six-fold coordinated implying no change in the structural environment of calcite.
This can take place only if a simple exchange of Ca2+ for Sr2+ occurs (Stumm and
Morgan 1996). In addition to cation concentration, the size of the particular cation is
also expected to affect the extent of ion exchange in carbonate mineral.
CaCO3(s) + Sr2+ SrCO3(s) + Ca
2+ (1.2)
1.3.2. Surface Complexation
At the interface, atoms, molecules, and ions exert forces on each other.
Adsorption, the accumulation of matter at the solid-water interface, is the essence of

7
most surface-chemical processes. It also involves surface complexation reactions in
which coordinative bonds are formed between metals and ligands at the surface (Stumm
and Morgan 1996).
In the MeCO3(s)-H2O-CO2 system the following reactions illustrate the surface
speciation. The values of logarithms of equilibrium constants are given in Equation 1.3-
1.8 where the metal ion is calcium (Capellen et al. 1993).
>CO3H0 >CO3
- + H+ log K = -4.9 (1.3)
>CO3H0 + Me2+ >CO3Me
+ + H+ log K = -2.8 (1.4)
>MeOH2+ >MeOH0 + H+ log K = -12.2 (1.5)
>MeOH0 >MeO- + H+ log K = -17.0 (1.6)
>MeOH0 + CO2 >MeHCO30 log K = 6.0 (1.7)
>MeOH0 + CO2 >MeCO3- + H+ log K = -2.6 (1.8)
In surface complexation model, the basic idea is the formation of chemical
bonds between water molecules and dissolved species at mineral surfaces. The initial
hydration surface sites for (hydr)oxide minerals are hydroxylated surface cation centers:
>MeOH0 which can either deprotonate (MeO-) or protonate (>MeOH2+). In the
carbonate-aqueous systems, the following two types of surface sites are produced with
hydration of a metal carbonate mineral surface: >MeOH0 and >CO3H0. Thus, by the
hydration of calcite surface >CaOH0 and >CO3H0 are formed, the existence of which
was proven spectroscopically (Capellen et al. 1993). Surface complexes are suggested
to be formed by the dissolved hydroxo metal complex Me(OH)+, at high pH values in
addition to Me2+, normally found at lower pH values. At carbonate surface metal
centers, such a complexation occurs via oxygen bridging (Capellen et al. 1993).
>MeOH0 + Me2+ MeOMe+ + H+ (1.9)
1.3.3. Coprecipitation (Solid Solution)
In natural systems, carbonate minerals precipitate in the presence of different
solutes. Even though trace amounts of components exist in the solution, these
components may get incorporated into the solid carbonate minerals (Stumm 1992).

8
Coprecipitation provides a thermodynamics construct between surface
complexation and bulk solid precipitation. It is predicted that, surface complexation
predominates at low sorbate/sorbent ratios. As the surface is loaded with sorbed ion, a
solid solution is formed as a precipitate until the surface sites become saturated (Zhu
2002, Stumm 1992).
Solid solution formation can be seen in the sorption of Cd2+ ion on CaCO3. In
an initial first step, Cd2+ (0.95 Å) ions are adsorbed by hydrated layer of the calcite
surface (ionic size of Ca2+ is 1.00 Å). Then, surface precipitation occurs in a slow step.
After a slow long term recrystallization, it is determined that a new crystalline material
in the presence of Cd2+ grow as a solid solution rather than as pure calcite. The reaction
between calcium carbonate and Cd2+ ion is given as below where some of CdCO3(s)
dissolves in CaCO3(s) (Stumm 1992, Stumm and Morgan 1996).
CaCO3(s) + Cd2+ CdCO3(s) + Ca
2+ (1.10)
A well known natural example of solid solution is magnesian calcite. It is a
predominant carbonate phase in seawater and in the analyses it is seen that, 30% mol of
natural calcites formed at low temperatures contain MgCO3. The reaction between
magnesium and calcium carbonate (either calcite or aragonite) proceeds as below;
Ca(1-x) MgxCO3(s) (1-x)Ca2+ + xMg2+ + CO3
2- ; Keq(x) (1.11)
Ca2+ + CO32- CaCO3(s) ; 1/Ksp(CaCO3) (1.12)
Ca(1-x) MgxCO3(s) + xCa2+ CaCO3(s) + xMg
2+ ; Keq(x) 1/Ksp(CaCO3) (1.13)
([Mg2+] / [Ca 2+])x = Keq(x) 1/Ksp(CaCO3) (1.14)
The Mg-calcite is less stable than CaCO3(s) if a Mg-calcite is in contact with a solution
whose ([Mg2+] / [Ca2+])x ratio is not greater than Keq(x) 1/Ksp(CaCO3). Hence, in marine
sediments high Mg-calcite should be transformed into calcite or aragonite. As the Mg-
calcite is dissolved, Mg2+ proportion becomes richer in the solution and pure CaCO3(s)
is precipitated. Beside calcite, low Mg-calcites (x=3-4 mol %) are plausibly stable;
however, higher Mg-calcites might carry on for substantial time periods in spite of
being thermodynamically unstable. As a consequence, surface processes fulfill a degree
of metastability rapidly whereas phase equilibrium is not accomplished in spite of long
time periods (Stumm 1992)

9
1.3.4. Precipitation
A precipitate is a very fine crystalline which is usually formed from vigorously
oversaturated solutions. In order to understand if a solution or natural water is over- or
undersaturated, the free energy of dissolution of the solid phase is examined if their
values are positive, negative, or zero.
CaCO3(s) Ca2+ + CO3
2- Ksp = 4.5 x 10⁻⁹ (for calcite)
Ksp= 6.0 x 10⁻⁹ (for aragonite)
The free energy of dissolution is given in Equation 1.15.
∆G = RT ln Q/Ksp (1.15)
= RT ln [Ca2+]act [CO32-]act = RT ln (IAP)/Ksp
[Ca2+]eq [CO32-]eq
The condition of saturation of solution with respect to a solid depends on the
comparison between ion activity product, IAP, and solubility product, Ksp. For a system,
the terms oversaturation, saturation, and undersaturation could be defined as;
IAP > Ksp (oversaturated)
IAP = Ksp (equilibrium, saturated)
IAP < Ksp (undersaturated)
In terms of concentration, the saturation conditions for all reactions including a solid
phase are determined by the comparison of quotient, Q, and Ksp values. A solid phase
dissolves when Q/Ksp is less than 1; in contrast, it precipitates when Q/Ksp is greater
than 1 (Stumm and Morgan 1996). In carbonate systems, the cation adsorbs to bulk
CO32- ion in order to achieve precipitation on surface.
For the cations studied in this work, the equations of bulk precipitations leading
to the formation of BaCO3, MnCO3, and CdCO3 together with the corresponding Ksp
values are given as Equation 1.16, 1.17, and 1.18, respectively.

10
Ba2+ + CO32- ⇔ BaCO3(s) Ksp = 5.0 x10
-9 (1.16)
Mn2+ + CO32- ⇔ MnCO3(s) Ksp = 5.0 x 10
-10 (1.17)
Cd2+ + CO32- ⇔ CdCO3(s) Ksp = 1.8 x 10
-14 (1.18)
These reactions correspond to systems containing dissolved carbonate ions
together with the given cation in solution. In the presence of a carbonate solid in the
solution, precipitation can take place at the solid surface even at metal concentration
below the values corresponding to supersaturation. This is caused by the higher metal
concentration in the vicinity of the carbonate particle due to the counter charge
attractions. According to the surface precipitation model (Zhu 2002), precipitation at the
surface is thought of as a pre-step to bulk precipitation, as the thing given by the
Equation 1.19 and 1.20, respectively.
= CaCO3o + M2+ + HCO3
- CaCO3(s) + = MCO3o + H+
(surface precipitation of the metal, M2+) (1.19)
= MCO3o+M2++HCO3
- MCO3(s) + =MCO3o+H+
(bulk precipitation) (1.20)
These equations illustrates also the presumed effect of bicarbonate ions which
are extensively present in carbonate system at pH values close of natural levels.
1.3.5. Solid State Diffusion
Countless chemical reactions and micro-structural modifications occur in solids
through solid state diffusion, i.e. migration and transfer of atoms in solid phases. The
diffusions occur due to the defects in solids such as, cavities and interstitial ions, grain
boundaries, dislocations, inner and outer surfaces. Various types of diffusion in oxide
and other inorganic compounds are caused by temperature, partial pressures of the
constituents of compounds, microstructure, and grain size (WEB_6 2007). In soil, since
lots of free ions exist, they can change from one state to another by the effect of
temperature and pressure when they are in solid form (MCayCO3). However, it requires

11
long time periods to occur and is thus not expected to contribute to metal uptake by the
carbonate minerals in the course of short adsorption processes.
1.4. Literature Survey
The sorption behaviors of various heavy metals and radioactive isotopes by
calcium carbonate were subject to plenty of researches. Natural CaCO3 samples
generally forming from calcite and to a lesser extent calcite-aragonite mixtures were
used in these studies; nevertheless, the number of studies in which pure aragonite was
used, is very limited. In addition to our knowledge, there is no data available on the
precipitate overgrowth kinetics of the studied metal carbonates.
In previous studies, it is reported that CaCO3 is especially important for
industrial and municipal waste control involving heavy metals (Sanchez and Ayuso
2002, Speck et al. 1998, Bilinski et al. 1991, Zachara and Cowan 1991, Johnson and
Furrer 2002, Kirby and Rimstidt 1994). In other studies, the sorption characteristics of
CaCO3 were evaluated for elements that are important in radioactive waste control
(Curti 1999, Piriou et al. 1997, Torstenfelt and Pankow 1982, Meece and Benninger
1993, Robbins et al. 1992, Magaritzl et al. 1990, Bancroft et al. 1977). In addition, a
large number of studies exist in literature pointing out the importance of precipitation
formation or co-precipitation phenomenon in the uptake of metals by calcite (Martin-
Garin et al. 2002, Stipps 1999, Ning et al. 1996, Weijden et al. 1994, Zachara et al.
1988, Fuller and Davis 1987, Davis et al. 1987, Zachara et al. 1989, Pingitore et al.
1988, Terekado and Masuda 1988, Kitano 1986, Lorens 1981).
Mechanistically, there are three major uptake processes of cations by carbonate
minerals; adsorption, co-precipitation (or solid solution formation), and precipitation
(appearance of cation carbonate as a separate phase). According to literature sources,
the plausibility of precipitation or solid solution formation is dependent on the size and
the charge of cation (Curti 1999). As the size and charge of retained ion approaches that
of Ca2+, the possibility of co-precipitation increases. It is reported that co-precipitation
is also dependent on the solubility products of retained cation-carbonate ions and this
phenomenon is based on Fajan’s “precipitation law”. According to this law, it is
expected that as the solubility of the substance formed by retained cation and anion

12
found in precipitate decreases, the amount of this cation increases in the substance
(Curti 1999).
The retention of alkali metal cations by calcite is reported to occur in the cavities
(interstitial positions) of mineral structure rather than co-precipitation. However, the
data obtained for uptake of these cations show that this mineral does not behave entirely
as calcite and that alkali metal ions are retained in vacant places which are formed after
leaving of Ca2+ ion (Kitano 1986).
In the studies with earth alkaline ions such as Sr2+ and Ba2+, the existence of co-
precipitation is detected at specific conditions. Nonetheless, it is seen that partition
coefficients of these kinds of cations are lower than that of transition elements (Curti
1999, Tesoriero and Pankow 1996, Gutjahr et al. 1996, Miyake et al. 1988). Several
studies on calcite and aragonite show that the partition coefficients of Sr2+, Ba2+ and
Ra2+ ions are very close to each other (Curti 1999, Pingitore and Eastman 1984) and it is
proposed that the similarities of behaviors between Ba2+ and Ra2+ ions are sourced by
adjacent size (1.35 and 1.48 Å) and electronegativities (0.9 for both ions) of these ions.
Comperatively, it is observed that other divalent cations such as Zn2+, Cd2+, Mn2+ and
Co2+ construct more stable precipitates with carbonate ions and that they have high
partition coefficient values (Curti 1999).
From a different perspective, it is reported that the presence of CaCO3 in soil
minerals enhances the uptake capacities of these minerals. The studies performed
previously on the sorption behavior of Ba2+ ion on CaCO3-montmorilonite mixture
support this approach (Shahwan et al. 2002). In other studies carried out to study the
sorption behavior of Zn2+ and Pb2+ ions on calcite-kaolinite and calcite-clinoptilolite
mixtures, the sorption efficiency of calcite in these mixture was documented (Shahwan
et al. 2005a, Shahwan et al. 2005b).
Various approaches are followed to examine the distribution of metal ions in
natural environments. While some of these approaches are dependent on
thermodynamic equilibrium basis, the others are kinetically-based (Martin-Garin et al.
2002). Especially, when precipitation mechanism is under consideration, understanding
the kinetic processes is essential for modelling of distribution of metal ions in nature.
Some metal ions (e.g. Mn2+, Fe2+) exceed the solubility levels of their concentration
values in water. This phenomenon is referred to the slow crystal growth kinetics of
metal carbonates (Jensen et al. 2002). The limited amount of kinetic data in literature
provides an important motivation to these kinds of studies (Martin-Garin et al. 2002).

13
It is known that, crystal growth kinetics are dependent on supersaturated
conditions, pH, and temperature during precipitation (either as pure compound or solid
solution formation) (Sternbeck 1997). It is proposed that, precipitation reactions pass
through an intermediate adsorption stage (Curti 1999, Stipps 1999, Kinsman and
Holland 1969, Chiarello et al. 1997, Shahwan et al. 2005a). In this intermediate stage,
an ion bound to solid surface generally forms an outer-sphere complex, a process which
is rapid but involve weak interactions. At last stage, this ion diffuses into the solid in
order to form a stable inner-sphere complex by a slower mechanism. Previous studies
on Mn2+ and Cd2+ indicated slow formation of MnCO3 and CdCO3 which can continue
up to several days (Fuller and Davis 1987, Wersin et al. 1989).
As it is understood from literature searches, studies investigating the formation
kinetics and morphologic properties of metal carbonates are very limited. Most of these
studies are related to calcite mineral, and a few of them deals with uptake by aragonite
(e.g. Prieto et al. 2003, Godelitsas et al. 2003).
14
CHAPTER 2
SCOPE OF THE STUDY
2.1. Aim of This Work
The preliminary aim of this study is to investigate the kinetic aspect of the
uptake of Ba2+, Mn2+, and Cd2+ ions by calcite and aragonite minerals over a wide range
of concentrations at the stages of adsorption and precipitate overgrowth. In addition to
that, the study includes morphologic and structural characterization of metal ion
carbonates formed on calcite and aragonite. Atomic Absorption Spectrometry (AAS)
and Inductively-Coupled Plasma Atomic Emission Spectrometry (ICP-AES) were used
for the determination of aqueous concentrations of Ba2+, Mn2+, and Cd2+ ions.
Quantitative X-ray Diffraction (XRD) was employed for elucidating the mass fraction
of metal carbonates formed by precipitation as calcite and aragonite surfaces. For this
purpose, equations were developed, based on relevant peak intensities of the metal
carbonate and calcite or aragonite that can be used for direct determination of the
carbonate binary mixtures. The distribution of the elements on the carbonate surface
was recorded using the mapping analysis of Energy Dispersive X-ray Spectroscopy
(EDS). Scanning Electron Microscope (SEM) was used to record the particle
morphologies of different carbonate phases. The changes in vibrational modes of
carbonate as a result of metal uptake were analyzed using Fourier Transform Infrared
Spectroscopy (FTIR).
2.2. Applied Methods
2.2.1. Atomic Absorption Spectrometry (AAS)
Atomic Absorption Spectrometry (AAS) is applied for the identification of trace
metals in a various environmental and biological matrices. The success of this technique
is dependent not only to its sensitivity and selectivity but also its rate, simplicity, and
15
wide field of activity. Determination of more than six dozen elements can be achieved
by Atomic Absorption technique. In general, the detection limit interval changes from
few tenths to part per billion (in electrothermal atomization techniques) or from few
tenths to part per million (in ordinary flame atomization) (Jenniss et al.1997).
Each element absorbs specific wavelength of light and they correspond to the
energies needed to excite electrons from an energy level to other higher energy level.
Atomic absorption spectrometry is used in various areas of chemistry.
Clinical analysis: AAS is used in analysing metals in biological fluids, eg. blood and
urine.
Environmental analysis: The concentration levels of various elements found in air,
drinking water, seawater, rivers, petrol and in drinks as beer, wine, and fruit drinks, can
be determined by AAS.
Pharmaceuticals: Minor quantity of a catalyst (generally a metal) is used in some
pharmaceutical manufacturing processes. In spite of being a catalyst, they are
occasionally present in the final product and their amount can be determined by AAS.
Industry: AAS is widely used to examine many raw materials on account of
determining the major elements present and the level of toxic impurities-e.g. where
calcium is a major constituent, the lead level should be low because of its being toxic.
Mining: The amount of metals such as gold in rocks can also be determined by AAS to
see whether the rocks are worth mining to extract the gold or not.
In AAS, atoms of different elements absorb characteristic wavelengths of light;
therefore, the light of a particular element is used to understand if a sample contains the
element of interest. The sample is atomized and emitted electromagnetic radiation is
passed through vaporized sample. Since some of the radiation is absorbed by the
analyzed atoms in the sample, the amount of absorbed radiation increases as the number
of atoms increases in the vapor.
In principle, AAS instrument needs three components; a light source, a sample
cell for the production of gaseous atoms, and a means of measuring the specific light
absorbed. The main components of AAS instrument are given in Figure 2.1.
The common source of light is “hollow cathode lamp” containing a tungsten
anode and a cylindrical hollow cathode made of the element to be determined which are
sealed in a glass tube filled with an inert gas such as neon or argon at a pressure of

16
between 1 Nm-2 and 5 Nm-2. The ionization of some gas atoms is provided by applying
a potential approximately 300-400 V between the anode and the cathode.
Figure 2.1. Instrumentation of AAS
(Source: WEB_7 2007)
In order to select the specific wavelength of light that is absorbed by the sample,
a monochromator is used. The light selected by the monochromator is sent to detector
which is typically a photomultiplier tube to produce an electrical signal proportional to
the light intensity. On the other hand, commonly two systems are used to produce atoms
from the sample: aspiration and electrothermal atomization. Aspiration includes sucking
a solution of sample into a flame while the latter is where a drop is placed into a
graphite tube and then heated electrically. In flame aspiration, most commonly selected
gases as oxidant and fuel are compressed air and acetylene. The highest temperature
obtained is about 2200oC. Nitrous oxide (N2O) which decomposes to give a 2:1 mixture
of nitrogen and oxygen can be replaced the air for higher temperature values. The
highest temperature it can gain is approximately 3000oC when burning acetylene
(Ewing 1985). In electrothermal atomization, the tube is heated by transferring a current
through it in a series of steps which are programmed beforehand. In order to vaporize
and atomize the samples, 5-10 seconds at 2000-2500oC is sufficient. Almost 100% of
the sample is atomized in electrothermal atomization; thus, the technique is much more
sensitive than flame AAS.

17
2.2.2. Inductively Coupled Plasma-Atomic Emission Spectrometry
(ICP-AES)
Inductively Coupled Plasma-Atomic Emission Spectrometry (ICP-AES) is an
emission spectrophotometric technique in which the excited electrons belonging to
elements of the analyzed sample emit energy at a given wavelength when they return to
ground state. In this process, each element emits energy at specific wavelengths. Thus,
in the ICP-AES technique, choosing a single wavelength for an element is widespread
despite the fact that it emits energy at multiple wavelengths. There is a direct proportion
between the intensity of the emitted energy at chosen wavelength and the concentration
of analyzed sample; therefore, the elemental composition of this sample can be
quantified by assessing the emitted wavelengths and their intensities (WEB_12 2007).
The main components of ICP-AES instrument are given in Figure 2.2.
Figure 2.2. Instrumentation of ICP-AES
(Source: WEB_8 2007)
In ICP-AES analysis, the sample analyzed should be in solution; that’s why,
water can be analyzed simply by dilution. On the other hand, all ICP-AES systems are
composed of several components which are grouped in three main parts: the sample
introduction system, the torch assembly, and the spectrometer. The aqueous sample is
pumped into the nebulizer and it produces an aerosol mist. Moisturized argon gas is
injected into the chamber throughout the sample. The mist is collected in the spray
chamber, where the larger mist particles are sent to waste and the appropriate particles
are drifted into the torch. As a result, latter particles are injected vertically up to the
length of the torch into the plasma with argon gas.
In order to produce vigorous atomic emission from chemical elements, the
temperature should reach a value considerably above than those of simple flames. The

18
maximum value for the highest amount of atomic emission is reached in range between
7000 K and 10000 K. A way of obtaining these temperatures is to produce an inert-gas
plasma. A gaseous state of matter involving free electrons and highly charged ions is
called as “plasma” that is a very efficient environment for atomization and
volatilization. A great many elements can be ionized efficiently (>90%). Nevertheless,
no molecules and ground state elements are found in the plasma.
In the plasma, great amount of energy is transferred to the atoms and ions to
elevate the excitation of higher energy levels. These excited atoms or ions emit
electromagnetic radiation of specific wavelengths (λ) in the UV/VIS range of the
spectrum when they come back to the ground state or lower excitation state. The light
emitted from the plasma is focalized through a lens and sent to entrance slit into the
spectrometer. The spectrometer can be either sequential (monochromator) or
simultaneous (polychromator). The detector (photomultiplier tube) is set at the far end
of the spectrometer (WEB_8 2007).
Because of its range and sensitivity, ICP-AES is analogous to flame atomic
absorption spectrometry. Even though, some atomic absorption spectrophotometers able
to measure up to five elements simultaneously, ICP-AES is more accommodating to
simultaneous multielement determinations. Moreover, in decreasing the chemical
interferences associated with atomic absorption spectrometry, the higher temperature of
the plasma is a significant aspect (Jenniss et al.1997).
2.2.3. X-Ray Diffraction (XRD)
X-ray Diffraction (XRD), which enables information about structures, phases,
preferred crystal orientations (texture) and other structural parameters such as average
grain size, crystallinity, strain and crystal defects, is a vigorous and non-destructive
technique for the characterization of crystalline materials. The production of X-ray
diffraction peaks are caused by constructive interference of monochromatic beam that is
scattered from each group of lattice planes at particular angles. The atomic decoration in
the lattice planes provides the determination of peak intensities. As a result, the X-ray
diffraction pattern is the fingerprint of periodic atomic regulations of materials. The
main components of XRD instrument are given in Figure 2.3.

19
Figure 2.3. Instrumentation of XRD
(Source: WEB_9 2007)
In XRD, the X-ray beam is reflected from a plane crystal and by the change of
theta angle the wavelength is selected (Figure 2.4). The reflected waves from successive
crystal planes should pass twice across the space between planes; so, Bragg’s equation
is applied in this technique where n is the order of reflection, λ is the wavelength of X-
ray radiation, d is the distance between adjacent planes in the crystal, and θ is the angle
between incident beam and lattice plane (Ewing 1985). In general, as the symmetry of
the material increases, the number of peaks in its diffraction pattern decreases and the
intensity of each peak increases.
Figure 2.4. Illustration of Bragg’s Law
(Source: WEB_10 2007)

20
High energy electrons irradiate the X-ray spectrum of a given material with
continuous superimposed discrete lines. The transitions from the L to the K shell are
specified as Kα X-rays. The transitions originating from different sublevels of the L shell
are called as Kα1 and Kα2. In addition, X-rays owing to the transitions from M to the K
shell is designated as Kβ (Ewing 1985).
Quantitative XRD technique is usually applied to determine the amount of
different phases in multi-phase samples. In quantitative analysis, an effort is to state the
structural characteristics and phase proportions with quantifiable numerical precision by
use of the experimental data itself. Present XRD techniques for this analysis depend on
four methods which are analyzing based on peak areas, usage of the same mass
absorption coefficient method, mineral diagnosing based on an internal standard, and
quantitative mineral appraisement by use of external standard, respectively. It is known
that there is a proportion between the intensities of the XRD pattern of an individual
mineral and concentrations of the different minerals present. Thus, some idea about the
relative quantities of each phase can be obtained by measuring the intensities of patterns
(Ouhadi and Yong 2003).
2.2.4. Scanning Electron Microscope (SEM)
SEM is a surface determination technique which is applied to get a physical
picture of the topology of the surface on a microscopic scale. Especially, the
smoothness of the surfaces is revealed by an optical microscope. SEM is an essential
technique since it gives information about the surfaces which involve details of grain or
crystal boundaries, lattice deficiencies, foreign inclusions, and other microphysical data
(Strobel and Heineman 1989). The main components of SEM instrument are given in
Figure 2.5.
In this device, the surface of the sample is scanned in a rectangular raster by a
finely focused beam of electrons. By the interaction with the specimen, electron beam
yields various products such as reflected or backscattered primary electrons, slowly
moving (secondary) ejected electrons, Auger electrons, and X-rays. In this technique,
either reflected or secondary electrons are produced along the surface of the sample in a
good fraction. Should the secondary electrons supply the intensity data, the detector
located at a low angle to the primary beam collects them.

21
Figure 2.5. Instrumentation of SEM
(Source: WEB_11 2006)
In the instrument, the potential applied on the electrodes of the gun causes
stream of emitted electrons which then pass through magnetic lenses. The electron
optics of the device is formed by the collection of lenses and apertures. A high vacuum
is required in an electron microscope because electron beams are vigorously absorbed
or scattered by molecules in air. The secondary electrons arising from a spot on the
sample generally interact with scintillator and are detected by photomultiplier tube.
Finally, the image is displayed on the CRT monitor (Strobel and Heineman 1989).
2.2.5. Energy Dispersive X-Ray Spectroscopy (EDS)
EDS is a technique to determine elements and their surface concentrations in a
sample. Generally, Si(Li) module is utilized as an energy-dispersive X-ray detector and
characteristic X-ray wavelength of an element is detected. There is a proportion
between local concentration of the analyte and the indirect X-ray image of the surface
developed intensity (Strobel and Heineman 1989).
In EDS technique, the dispersion of energy depends on the availability of a
detector which replies linearly the energy content of separate photons. Those detectors,

22
which are capable of measuring photon energies, are called as scintillation counters, gas
counters worked at a median range of voltages, and lithium-drifted silicon or
germanium detectors. Separate counting of signal pulses of successive energy brackets
is permitted by a series of electronic energy discriminators which are used to analyze
the signal from the solid-state detector. The pulses correspond to photons come
randomly (Ewing 1985). The elemental concentration for the top 1000 nm is
represented with SEM to which an energy-dispersive X-ray spectrometer is connected
(Strobel and Heineman 1989).
2.2.6. Fourier Transform Infrared Spectroscopy (FTIR)
Infrared Spectroscopy is the study of the interaction between infrared light and
matter. When infrared (IR) radiation interacts with matter, it can be absorbed by causing
the vibration of chemical bonds in the material. The functional groups which are known
as the chemical structural fragments within molecules tend to absorb IR radiation in the
same wavenumber range; however, the structure of the rest of the molecule may not be
in this range. There is a connection between the molecule’s structure and the
wavenumbers at which a molecule IR radiation. This relation allows the structure of
unknown molecules to be identified form the molecule’s IR spectrum; that’s why, IR
spectroscopy is a useful chemical analysis tool (Smith 1996).
An FTIR instrument is composed of an IR source, an interferometer, a sample
container, a detector, and a computer as shown in Figure 2.6.
Figure 2.6. Instrumentation of FTIR
(Source: WEB_12 2007)

23
One of the important features of FTIR is the speed of this technique. In stead of
spending several minutes, most measurements by FTIR are made in a matter of seconds
since all of the frequencies are measured simultaneously. In addition, it is a very
sensitive technique due to the detectors employed and the optical throughput is much
higher which results in much lower noise levels. Moreover, these instruments are self-
calibrating. As a result of these advantages, making measurements by FTIR is
extremely accurate and reproducible.

24
CHAPTER 3
EXPERIMENTAL
3.1. Preparation of Samples
Throughout this study the batch method was applied. Calcite used in this study
was obtained from Carlo Erba, while aragonite was synthesized in the laboratory. XRD
characterization showed that calcite mineral contained a minor amount of aragonite
while aragonite synthesized in the laboratory was pure. According to SEM images
calcite particles showed indefinite morphology with variable size (5-15 µm), while
aragonite possessed rod-like morphology with a crystal size of 5-10 µm.
3.1.1. Aragonite Synthesis
In order to synthesize aragonite, 1 liter solution of 0.10 M CaCl2 (ALDRICH
22,231-3) and 0.20 M MgCl2.6H2O (SIGMA-ALDRICH 7791-18-6) was prepared in
the same volumetric flask. After that, this solution was transferred to 1.0 L Erlenmeyer
flask and placed in Multimatics 9S water bath whose temperature was adjusted to 60oC,
beforehand. The solution was stirred in water bath until it came to thermal equilibrium
(approximately 2 hours).
On the other hand, 100 ml of 1.0 M of Na2CO3 (ALDRICH 22,353-0) solution
was prepared and placed into the water bath. After reaching to thermal equilibrium, this
solution was added to CaCl2-MgCl2 solution by using a peristaltic pump at a rate of 1.67
mL/min. The white precipitate which had a pH value of 8.6 was stirred in water bath for
30 minutes. Then, the precipitate was separated by vacuum filtration and washed
several times with distilled water. Finally, the filtrated solid particles were allowed to
dry in an oven adjusted at 110oC, beforehand.
The white precipitate was characterized using XRD analyses which showed it to
be entirely composed of aragonite. The powders were stored under dry conditions for
later use in the uptake experiments.

25
3.2. Determination of Zero Point Charge (ZPC) of Calcite and
Aragonite
In order to identify the surface potential of either calcite or aragonite mineral at
different pH values, zero point charge (ZPC) determination experiments were
performed by using ZETA-METER 3.0+ instrument. First of all, six samples were
prepared for each mineral with pH ranging from 7.0 to 12.0. For this purpose, 0.10 g
samples of calcite or aragonite powders were prepared and 100 ml of distilled water was
added in each. Then, the pH values were adjusted to intended value by using 1.0 M or
0.10 M of HCl and NaOH. Immediately after the pH adjustment, the sample was poured
into the GT-2 Type electrophoresis cell of Zeta-Meter.
In the instrument system, Molybdenum Cylinder Anode and Platinum Rod
Cathode electrodes are used. Then, the cell was positioned on the floor of the
microscope. The clearness of ocular micrometer containing tracking lines was regulated
by focusing the illuminators and microscope. After that, a voltage is applied to
electrodes in order to observe the tracking of particles through tracking lines. This
voltage is selected according to the maximum allowable specific conductance of
sample. The K factor was adjusted to 64 because of using Molybdenum anode.
According to the velocities of particles passing through tracking lines, either full scale
or quarter scale measurements could be performed. For the measurement, a particle was
selected and when it passed through a grid line, “track” button was pressed on the
keypad according to the passing direction, and it was hold down until the particle
crossed the next grid line. An average of 20 measurements was taken for each sample.
Following these measurements, pH versus zeta potential plot was constructed and ZPC
value was identified at the point where it intersected the pH axis.
3.3. Particle Size Analysis
Particle size of calcite and aragonite minerals were determined by using
Micrometrics SediGraph 1500 type instrument located at the Department of Chemical
Engineering at Đzmir Institute of Technology. At first, dry sieving was performed to
obtain particles with size les than 38 µm. Next, the particles less than this size were
prepared in a 50 ml Calgon solution involving %0.65 by volume solid sample. Then, the

26
samples were placed in the ultrasonic bath for 15 minutes. After this time period, the
particle size range was selected between 0.5 µm and 100 µm. The density values of
calcite and aragonite minerals were chosen as 2.710 g/cm3 and 2.935 g/cm3,
respectively. Cell temperature was selected as 37.4oC and analysis period was 10
minutes.
3.4. BET Analysis
In order to determine the surface area and pore size of calcite and aragonite
minerals, BET and Langmuir analysis were performed by using Micromeritics Gemini
V instrument. For the analysis, degas conditions were adjusted to 120oC and 3 hours.
Saturation pressure was 1014.810 mbar. The mass of calcite and aragonite samples were
0.1568 g and 0.0941 g, respectively.
3.5. Uptake Experiments
3.5.1. Kinetic Experiments
These experiments were carried out in a wide concentration range. In each
experiment, 25.0 ml aliquots of BaCl2.2H2O (SIGMA-ALDRICH 10326-27-9), MnCl2
(ALDRICH 7773-01-5), or CdCl2.5/2H2O (SIGMA 7790-78-5) solutions were mixed
with 0.25 g samples of calcite or aragonite powders using a thermostat multi-position
magnetic stirrer (Selecta, Multimatic 9S). The initial concentrations were 10.0, 50.0,
100.0, 500.0, 1000.0, 5000.0, and 10000.0 mg/L and the experiments were carried out at
ambient temperature and pressure for time periods ranging from 30 minutes up to 3
weeks. The flasks containing the samples which open to atmosphere were stirred up to 7
hours. Then, each flask was covered and left for time periods ranging from 24 hours to
3 weeks. At the end of the mixing period, the solid phase was separated from solution
by filtration and dried at room temperature. All the experiments were performed in
duplicates. The pH values of the solutions were measured before and after the
experiments. The measured values are given in Table 3.1, 3.2, and 3.3. As it is expected,
the pH value decreases as the concentration of the cation increases.

27
Table 3.1. Initial and final pH values of solutions of Ba2+ in contact with calcite or aragonite at
different initial concentrations and contact times. The temperature of the medium
was 25oC.
Table 3.2. Initial and final pH values of solutions of Mn2+ in contact with calcite or aragonite at
different initial concentrations and contact times. The temperature of the medium
was 25oC.
100 mg/L
500 mg/L
1000 mg/L
5000 mg/L
10000 mg/L
MIN
ERAL
TIME
pHi
pHf
pHi
pHf
pHi
pHf
pHi
pHf
pHi
pHf
10 min 9.7 9.2 9.2 8.9 8.9
30 min 9.7 9.2 9.2 8.9 8.9 1 h 9.7 9.0 9.2 8.6 9.2 8.6 8.9 8.5 8.9 8.2 4 h 9.7 8.3 9.2 8.5 9.2 8.5 8.9 7.8 8.9 7.4 7 h 9.7 8.2 9.2 6.5 9.2 7.9 8.9 7.2 8.9 6.8 24 h 9.7 8.0 9.2 7.7 9.2 8.0 8.9 7.6 8.9 7.2
CALCITE
48 h 9.7 8.0 9.2 8.1 9.2 8.0 8.9 7.5 8.9 7.4 10 min 9.7 9.6 9.4 8.6 8.4 30 min 9.7 9.6 9.4 8.6 8.4 1 h 9.7 9.6 9.6 9.2 9.4 8.7 8.6 8.1 8.4 8.4 4 h 9.7 8.8 9.6 8.3 9.4 8.0 8.6 7.4 8.4 7.5 7 h 9.7 8.5 9.6 8.1 9.4 7.9 8.6 7.4 8.4 7.3 24 h 9.7 8.3 9.6 8.1 9.4 7.8 8.6 7.3 8.4 7.2 A
RAGONITE
48 h 9.7 8.4 9.6 8.1 9.4 7.8 8.6 7.3 8.4 7.1
100 mg/L
500 mg/L
1000 mg/L
5000 mg/L
10000 mg/L
MIN
ERAL
TIME
pHi
pHf
pHi
pHf
pHi
pHf
pHi
pHf
pHi
pHf
10 min 8.4 8.1 8.2 7.9 7.7 30 min 8.5 8.2 8.4 8.0 7.9 1 h 8.3 7.9 8.2 7.7 8.2 7.1 7.8 7.0 7.7 7.1 4 h 8.5 7.7 8.3 7.5 8.0 7.5 7.7 7.1 7.6 7.0 7 h 8.6 7.9 8.3 7.7 8.2 7.4 8.1 6.9 7.8 6.8 24 h 8.3 8.0 8.1 7.9 8.0 7.2 7.8 6.9 7.6 6.8 C
ALCITE
48 h 8.4 7.8 8.1 7.5 7.2 7.6 7.3 7.0 7.2 6.9 10 min 8.8 8.5 8.2 7.9 7.7 30 mi 8.2 8.3 8.3 7.9 7.7 1 h 8.8 8.0 8.7 7.6 8.3 7.6 7.9 7.1 7.7 6.8 4 h 8.6 7.6 8.3 7.5 8.3 7.9 7.2 7.1 7.5 6.9 7 h 8.7 7.9 8.7 7.7 8.4 7.8 8.0 7.4 7.9 6.9 24 h 8.9 7.9 8.5 7.6 8.3 7.6 7.9 7.2 7.6 6.8 A
RAGONITE
48 h 8.9 7.8 8.6 7.6 8.3 7.5 7.9 7.2 7.7 6.8

28
Table 3.3. Initial and final pH values of solutions of Cd2+ in contact with calcite or aragonite at
different initial concentrations and contact times. The temperature of the medium
was 25oC.
3.5.2. Dependence of Metal Uptake on Temperature Change
In order to study the effect of temperature on the extent of uptake, 25.0 ml
aliquots ion solutions were mixed with 0.25 g samples of calcite or aragonite powders
using a thermostat multi-position magnetic stirrer (Selecta, Multimatic 9S) adjusted to
50oC, beforehand. The initial concentrations were 10.0, 50.0, 100.0, 500.0, 1000.0,
5000.0, and 10000.0 mg/L and the experiments were carried out at ambient pressure. At
the end of the 24 hours mixing period, the solid phase was separated from solution by
filtration and dried at room temperature. The measured initial and final pH values are
given in Table 3.4 and 3.5.
100 mg/L
500 mg/L
1000 mg/L
5000 mg/L
10000 mg/L
MIN
ERAL
TIME
pHi
pHf
pHi
pHf
pHi
pHf
pHi
pHf
pHi
pHf
10 min 8.4 7.3 6.8 6.7 6.7
30 min 8.5 7.6 6.9 6.7 6.8 1 h 8.7 8.4 7.2 7.8 6.6 7.9 6.6 6.4 6.3 6.4 4 h 8.4 8.2 7.2 7.8 6.7 7.8 6.3 6.4 6.4 6.3 7 h 8.3 7.9 7.3 7.8 6.7 7.8 6.6 6.5 6.3 6.4 24 h 8.3 8.2 7.6 8.0 6.7 7.7 6.4 6.5 6.3 6.5
CALCITE
48 h 8.4 7.8 7.2 7.6 6.7 8.0 6.5 6.6 3.2 6.5 10 min 7.4 7.3 6.6 6.3 6.2
30 min 8.3 7.3 7.4 6.5 6.5 1 h 7.0 8.0 6.9 7.5 6.7 8.0 6.4 7.3 6.3 6.6 4 h 7.3 7.7 6.7 7.4 8.1 7.8 6.1 7.2 6.0 6.7 7 h 7.4 8.0 6.7 7.8 8.3 7.9 6.6 7.3 6.3 6.6 24 h 7.6 8.2 7.0 7.9 8.0 7.8 6.5 7.6 6.0 6.6 A
RAGONITE
48 h 7.6 8.2 7.0 7.8 7.2 7.7 6.3 7.4 6.0 7.1

29
Table 3.4. The pH change of Ba2+, Mn2+, and Cd2+ cations during interactions with calcite at
different initial cation concentrations and 50oC.
10
mg/L
50
mg/L
100 mg/L
500 mg/L
1000 mg/L
5000 mg/L
10000 mg/L
CATION
pHi
pHs
pHi
pHs
pHi
pHs
pHi
pHs
pHi
pHs
pHi
pHs
pHi
pHs
Ba2+
9.6
8.3
9.6
8.3
9.6
8.3
9.5
8.3
9.4
7.8
9.3
8.9
9.1
9.7
Mn2+
9.1
8.1
8.7
7.8
8.6
7.7
8.3
7.6
8.1
7.4
7.8
6.9
7.7
6.8
Cd2+
9.1
8.1
8.7
8.1
7.8
7.8
7.3
8.0
6.7
8.0
6.2
6.3
6.1
5.9
Table 3.5. The pH change of Ba2+, Mn2+, and Cd2+ cations during interactions with aragonite at
different initial cation concentrations and 50oC.
10
mg/L
50
mg/L
100 mg/L
500 mg/L
1000 mg/L
5000 mg/L
10000 mg/L
CATION
pHi
pHs
pHi
pHs
pHi
pHs
pHi
pHs
pHi
pHs
pHi
pHs
pHi
pHs
Ba2+
9.8
8.4
9.8
8.6
9.8
8.2
9.7
7.8
10.2
8.3
10.1
7.7
10.1
7.5
Mn2+
9.4
8.3
9.0
8.0
8.8
7.7
8.5
7.4
8.2
7.4
7.9
7.1
7.1
6.4
Cd2+
9.4
8.5
7.9
8.3
7.3
8.2
7.4
7.9
7.6
7.8
6.2
8.0
6.0
7.3
3.5.3. Dependence of Metal Uptake on pH Change
In another set of experiments, the initial pH value was adjusted to 10.0 by using
0.50 M NaOH and 0.50 M HCl. In each experiment, 25.0 ml aliquots ion solutions were
mixed with 0.25 g samples of calcite or aragonite powders. The aim of these
experiments was to check the effect of pH on the extent of precipitation of metal ions.
The initial concentrations were 1000.0, 5000.0, and 10000.0 mg/L and the experiments
were carried out at ambient temperature and pressure. At the end of the 24 hours mixing
period, the solid phase was separated from solution by filtration and dried at room
temperature. Before filtration, the pH values were measured and given in Table 3.6.

30
Table 3.6. The pH values of the samples before filtration in the experiments carried out at pH of
10.0 at various initial concentrations.
1000 mg/L
5000 mg/L
10000 mg/L
MINERAL
CATION pHi
pHs
pHi
pHs
pHi
pHs
Ba2+
10.0
8.3
10.0
8.1
10.0
9.9
Mn2+
10.0
8.2
10.0
9.5
10.0
9.4
CALCITE
Cd2+
10.0
8.8
10.1
9.4
10.1
9.4
Ba2+
10.0
8.4
10.1
8.0
10.1
8.1
Mn2+
10.1
8.9
10.1
9.0
10.1
9.7
ARAGONITE
Cd2+
10.1
9.8
10.0
9.4
10.0
9.2
3.6. Analysis of Aqueous Solutions
3.6.1. AAS
Thermo Elemental SOLAAR M6 Series Atomic Absorption Spectrometer with
air-acetylene flame was used to determine aqueous barium, manganese, and cadmium
concentrations. The hollow cathode lamp used in the instrument for the determination of
Ba, Mn, Cd concentrations operated at the wavelengths of 553.6, 279.5, and 228.8 nm,
respectively.
3.6.2. ICP-AES
A Varian Liberty Series II Axial view ICP-AES was used in the determination
of aqueous barium, manganese, cadmium, and lead concentrations. ICP-AES instrument
was operated with incident power of 12 kW, plasma gas flow rate of 15 L/min, and
auxiliary gas flow rate of 1.5 L/min. Continuous nebulization was achieved by means of
a concentric glass nebulizer with cyclonic chamber. The sampling flow rate was 1.0
mL/min. Measurements were based on peak height with polynomial plotted background

31
correction method. In instrument, two wavelengths were chosen for each element which
were 233.527 nm and 493.409 nm for Ba2+, 293.930 nm and 259.373 nm for Mn2+,
214.438 m and 226.502 nm for Cd2+, and 317.933 nm and 422.673 nm for Ca2+,
respectively.
3.7. Characterization of the Solid
3.7.1. XRD
XRD analysis was performed using a Philips X’Pert Pro instrument which is
situated at Center of Material Research at Izmir Institute of Technology. The samples
were first ground, mounted on zero background sample holder then introduced for
analysis. The source consisted of Cu Kα radiation (λ=1.54 Å). Each sample was scanned
within the 2 theta range of 10-50. In XRD quantification analysis, BaCO3 (ALDRICH
cas:513-77-9), (SIGMA-ALDRICH cas:598-63-0), MnCO3 (ALDRICH cas:598-62-9),
and CdCO3 (ALDRICH cas:28,914-0) solids were each mixed with calcite or aragonite
in a way that the mixture would contain 10.0%, 20.0%, 30.0%, 40.0%, 50.0%, 60.0%,
70.0%, 80.0% and 90.0% by mass of the metal carbonate and have total mass of 1.0
gram. XRD analysis of each mixture was performed based on the basic reflections of
metal carbonates, calcite, and aragonite. The peak areas were found using MS Origin
5.0, and the ratios of IMeCO3/Icalcite or IMeCO3/Iaragonite were calculated. From these peak
ratios, a calibration plot was formed by drawing the peak ratios versus metal carbonate
percentage. These plots were finally fitted using MS Excel to obtain the representative
equations.
3.7.2. SEM/EDS
SEM/EDS characterization was carried out using a Philips XL-30S FEG type
instrument. Prior to analysis, the solid samples were sprinkled onto adhesive aluminum
tapes supported on metallic disks. Images of the sample surfaces were then recorded at
different magnifications. Elemental EDS analysis was performed at randomly selected
areas on the solid surfaces each being approximately 100µm×100µm in dimension. EDS

32
mapping was carried out at magnification of x1000 and applied the voltage was 18 kV
under vacuum conditions of 3.5x10⁻⁵ mbar.
3.7.3. FTIR
FTIR spectra of the samples were collected in the middle IR region, 400-4000
cm-1, using a Nicolet Magna 550 type instrument. After mixing with KBr, the samples
were introduced as pellets and KBr powder was used as a background. A total of 32
scans were recorded with a resolution of 4 cm-1 for each spectrum. Omnic 1.3 software
was used to process the results.
3.8. Chemical Speciation Analysis
The chemical speciation analysis of aqueous Ba2+, Mn2+, Cd2+, and Pb2+ ions
were performed using visual MINTEQ software. By use of this software, it is possible
to obtain theoretical knowledge about chemical speciation of the ions at various
concentrations, pH, temperature, and ionic strength values. For the purpose of
illustrations, the chemical speciation curves of Ba2+, Mn2+, and Cd2+ in aqueous solution
at initial concentration of 1000.0 mg/L and other specified conditions are given in
Figure 3.1.

33
0 2 4 6 8 10 12 14 16
BaOH +
Ba 2+
pH
(a )
0 2 4 6 8 10 12 14 16
M n(OH )+
M n2(OH )
3
+
M n 2+
pH
M n(OH )4
2 -
(b )
0 2 4 6 8 1 0 1 2 1 4 1 6
C d (O H )+
C d2(O H )
3
+
C d2 +
C d (O H )3
-
p H
C d (O H )2
( c )
Figure 3.1. Chemical speciation curves of (a) Ba2+, (b) Mn2+, and (c) Cd2+ at initial
concentration of 1000 mg/L in aqueous solution. Ionic Strength (I): 0.001 and
Temperature (T): 25oC.

34
CHAPTER 4
RESULTS AND DISCUSSION
4.1. Characterization of Calcite and Aragonite
The XRD diagrams showed that the purity of calcite and aragonite minerals used
in the experiments to be very high. Typical XRD diagrams of calcite and aragonite are
given in Figure 4.1. The basic reflections of each mineral are labeled.
10 15 20 25 30 35 40 45 50 55
Calcite (116)
Calcite (108)
Calcite (202)
Calcite (113)
Calcite (110)
Calcite (102)
Calcite (104)
2θ
(a)
20 25 30 35 40 45 50
Aragonite (202)
Aragonite (220)
Aragonite (221)
Aragonite (130)
Aragonite (112)
Aragonite (200)
Aragonite (012)
Aragonite (021)
Aragonite (111)
2θ
(b)
Figure 4.1. XRD diagrams of (a) calcite and (b) aragonite used in this work.
According to SEM characterization, calcite particles possess indefinite
morphological structure with particle size ranging from 5 µm to 15 µ. On the other
hand, aragonite mineral have a rod-like crystal structure with particle size ranging from
5 µm to 10 µm. Typical SEM images of calcite and aragonite are given in Figure 4.2.

35
(a)
(b)
Figure 4.2. Characteristic SEM images of (a) calcite and (b) aragonite.
As mentioned in section 3.1.1 MgCl2 was used in the synthesis of aragonite
mineral. In order to check the elemental contents of aragonite and calcite mılti-spot,
EDS analysis are performed. Typical EDS spectra are given in Figure 4.3. The
elemental contents are also provided in and Table 4.1. Mg2+ ions are used in aragonite
synthesis to avoid crystallization of CaCO3 into calcite. The results indicate that Mg2+
content in aragonite is very small suggesting that this ion affects CaCO3 crystallization
in the solution with minimal amount entering the solid structure of the mineral.
(a)
(b)
Figure 4.3. EDS spectra of (a) calcite and (b) aragonite.

36
Table 4.1. Elemental content of calcite and aragonite obtained by EDS analysis.
C O Mg Ca
MINERAL Atom
%
Mass
%
Atom
%
Mass
%
Atom
%
Mass
%
Atom
%
Mass
%
CALCITE 37.01 23.50 42.64 35.32 0.15 0.19 20.20 40.99
ARAGONITE 24.93 14.31 50.21 38.29 0.43 0.49 24.26 46.28
In particle size analysis, the particles greater than 38.0 µm were exposed to dry
sieving. The percent mass fraction values of these particles are 50.2% and 42.8% for
calcite and aragonite, respectively. The particle size distribution of calcite and aragonite
for particles below 38.0 µm is shown in Figure 4.4. The mean, median, mode, and
standard deviation of the obtained distribution are given in Table 4.2. Based on the data
obtained, it was determined that 74.4% mass fraction of calcite and 71.2% mass fraction
of aragonite had a particle size less than 10.0 µm.
Figure 4.4. Particle size distribution (for particles less than 38 µm) for: (a) calcite and
(b) aragonite.
Table 4.2. Mean, median, mode, and standard deviation for particle size analysis of calcite and
aragonite minerals.
PARTICLE DIAMETER (µm) MINERAL
Mean Median Mode Standard Deviation
CALCITE 7.633 5.867 6.310 7.928
ARAGONITE 7.350 4.473 8.414 9.145
30 25 20 15 10 5 00
20
40
60
80
100
cumulative mass percent
particle size diameter (µm)
(a)
40 30 20 10 00
20
40
60
80
100
cumulative mass percent
particle size diameter (µm)
(b)

37
The Zeta potential of calcite and aragonite was measured at various pH values in
order to determine the Zero Point of Charge (ZPC) of each mineral. Based on the values
given in literature, calcium carbonate is reported to have ZPC values varying from 8.2
to 11.0 (Kosmulski 2001, Moulin and Roques 2003). This variation is thought to be
caused by the pressure of carbon dioxide gas (PCO2) which enables partial
transformation of CO32- to HCO3
- released by dissolution of solid until gas-liquid
equilibrium is satisfied in the system (Moulin and Roques 2003). The zeta potential
variation of calcite and aragonite with respect to pH is shown in Figure 4.5. According
to the obtained data, ZPC of calcite and aragonite are achieved at the pH values of 10.59
and 10.55, respectively. Below these values, the surface is positively charged and above
them it is negatively charged.
6 7 8 9 10 11 12
-30
-20
-10
0
10
20
Zeta Potential (mV)
pH
10.59
(a)
6 7 8 9 10 11 12
-20
-15
-10
-5
0
5
10
15
pH
10.55
(b)
Figure 4.5. Variation of zeta potential with respect to pH for (a) calcite and (b) aragonite.
The surface area and pore size of calcite and aragonite were also determined
using BET-N2 analysis. The results are given in Table 4.3. The surface area of aragonite
appears to be almost twice that of calcite.
Table 4.3. Results of surface area and pore size values of calcite and aragonite
MINERAL BET Surface Area
(m2/g)
Langmuir Surface
Area ( m2/g)
Pore Size
(Å)
CALCITE 34.5 134.2 33.6
ARAGONITE 57.5 223.6 33.6

38
4.2. Kinetic and Equilibrium Description of Metal Adsorption on
Calcite and Aragonite
4.2.1. Kinetics
In order to determine the rate of sorption, solutions containing 100 mg/L and
500 mg/L Ba2+, Mn2+, and Cd2+ ions were stirred with calcite and aragonite minerals at
room temperature and ambient pressure for different time intervals. The results obtained
from these studies are given in Figure 4.6 and 4.7. The sorption of Cd2+ ions approaches
equilibrium in 30 minutes in both concentrations and this observation is valid for both
calcite and aragonite mineral. Nevertheless, longer time periods are required for Ba2+
and Mn2+ ions to reach equilibrium. The sorption process of Mn2+ ions attains
equilibrium within 6 or 7 hours on both of calcite and aragonite minerals. In the case of
Ba2+ at initial concentration of 100 mg/L, equilibrium is reached within 1 hour while as
the concentration is increased to 500 mg/L, several hours are required to approach
equilibrium.
In order to determine the kinetic rate constants, three models that are widely
used in sorption studies were applied. The models include first order rate equation,
Lagergren’s model (Lagergren 1898), second order rate equation (Ho and Mckay 1998),
and Elovich equation (Han et al. 2006). The equations of these model are, respectively,
given as:
t))kexp((1qq 1et −−= (4.1)
tqk1
tqkq
e2
2e2
t+
= (4.2)
)lnt1(
)ln(αq t
ββ
β+= (4.3)
In the equations, qt refers to the ion concentration on calcite or aragonite minerals at a
certain time, whereas, qe represents the ion concentration at equilibrium. In addition, the
constants k1 (min-1) and k2 (g.mg
-1.min-1) in the equations represent the first order and
second order rate constants, respectively. In Elovich equation, α (mg sorbate/mg
sorbent.min) and β (g sorbent/mg sorbate) are parameters related to initial sorption rate
and surface covering capacity, respectively.

39
Figure 4.6. The variation of uptake of the ions (a) Ba2+, (b) Mn2+, and (c) Cd2+ by calcite
mineral with respect to mixing time.
0 500 1000 1500 2000 2500 3000
0
10
20
30
40
50
100 mg/L 500 mg/L
[Mn2+] s, mg/g
time, min
(b)
0 500 1000 1500 2000 2500 3000
0
10
20
30
40
50
60
100 mg/L 500 mg/L
[Cd2+] s, mg/g
time, min
(c)
0 500 1000 1500 2000 2500 3000
0
2
4
6
8
10
12
100 mg/L 500 mg/L
[Ba2+] s, mg/g
time, min
(a)

40
Figure 4.7. The variation of uptake of the ions (a) Ba2+, (b) Mn2+, and (c) Cd2+ by aragonite
mineral with respect to mixing time.
0 500 1000 1500 2000 2500 3000
0
5
10
15
20
25
30
35
100 mg/L 500 mg/L
[Ba2+] s, mg/g
time, min
(a)
0 500 1000 1500 2000 2500 3000
0
10
20
30
40
50
100 mg/L 500 mg/L
[Mn2+] s, mg/g
time, min
(b)
0 500 1000 1500 2000 2500 3000
0
10
20
30
40
50
60
100 mg/L 500 mg/L
[Cd2+] s, mg/g
time, min
(c)

41
Among these models, the best correlation with the experimental data was
obtained by second order rate equation. This shows that the sorption of ions is very fast.
The linear fits, k2, and qe are shown in Figure 4.8, and the model constants are given in
Table 4.4, respectively. According to the values of the rate constant, k2, the sorption rate
is the fastest in the case of Cd2+. The values of qe indicate that both minerals
demonstrated the highest affinity towards Cd2+ ions, the removal of which appears to be
almost instantaneous as shown in the figure.
Figure 4.8. The linear fits obtained by use of second order rate equation: (a) adsorption of the
ions on calcite, (b) adsorption of the ions on aragonite.
Table 4.4. k2 and qe values obtained by use of second order rate equation
Calcite Aragonite Ion k2
(g.mg-1.min-1) qe (mg/g) R k2
(g.mg-1.min-1) qe
(mg/g) R
Ba2+ 3.1 x 10⁻³ 8.3 0.9979 4.4 x 10⁻³ 29.1 0.9998 Mn2+ 5.8 x 10⁻⁴ 44.3 0.9997 3.2 x 10⁻⁴ 44.5 0.9999 Cd2+ 1.8 x 10⁻² 49.7 1.0000 6.1 x 10⁻³ 49.9 0.9999
0 500 1000 1500 2000 2500 3000
0
100
200
300
400
Ba2+
Mn2+
Cd2+
t/q t
time, min
(a)
0 500 1000 1500 2000 2500 3000
0
20
40
60
80
100
Ba2+
Mn2+
Cd2+
t/q t
time, min
(b)

42
4.2.2. Percentage Adsorption
In order to determine the percentage sorption of Ba2+, Mn2+, and Cd2+ at
equilibrium condition, the sorption experiments are performed at initial concentrations
of 10, 50, 100, and 500 mg/L under 25oC temperature and ambient pressure. The
following equation was used in the calculations of percent sorption,
100%[C]
[C][C]Sorption%
0
l0 ×−
= (4.4)
Here, C0 is the initial and Cl is the equilibrium ion concentration. The values calculated
from experimental data are given in Tables 4.5, 4.6, and 4.7. The tables provide also the
equilibrium concentration of the ions in solution, [Cl] (mg/L), and on the solid, [Cs]
(mg/g). These concentrations are interrelated to the initial concentration through the
equation
( )M
V[C][C]s
[C] l0 ×−= (4.5)
Here, V is the solution volume, M is the mass of the adsorbent.
Table 4.5. The equilibrium results corresponding to the uptake of Ba2+ ions by calcite and
aragonite at various initial concentrations.
Mineral [C]o
(mg/L)
[C]l
(mg/L)
[C]s
(mg/g) Sorption %
10 3.7 0.63 63 50 24 2.5 52 100 67 3.3 33 C
alcite
500 420 8.0 16 10 0.3 0.97 97 50 8 4.2 84 100 26 7.4 74
Aragonite
500 241 28.6 52

43
Table 4.6. The equilibrium results corresponding to the uptake of Mn2+ ions by calcite and
aragonite at various initial concentrations.
Mineral [C]o
(mg/L)
[C]l
(mg/L)
[C]s
(mg/g) Sorption %
10 0.4 0.96 96.4 50 11.7 3.83 76.6 100 29 7.10 71.0 C
alcite
500 136 36.38 72.8 10 0.04 0.996 99.6 50 3.1 4.69 93.8 100 8.3 9.17 91.7
Aragonite
500 28 47.2 94.4
Table 4.7. The equilibrium results corresponding to the uptake of Cd2+ ions by calcite and
aragonite at various initial concentrations.
The equilibrium values show that, almost all Cd2+ ions are sorbed by both calcite and
aragonite minerals between 10mg/L and 500 mg/L concentration range. Mn2+ ions are
also adsorbed in a great proportion by these two minerals. Both minerals demonstrated
their smallest affinity towards Ba2+ ions. In the literature, there exist some resources
asserting that Cd2+ ions are adsorbed by calcite more than Mn2+ ions (Curti 1999, Wang
and Xu 2001). This is explained by the fact that the ionic radius of Cd2+ ions (0.95Å) is
closer to that of Ca2+ ions (1.00Å) than is that of Mn2+ ions (0.83Å) the thing that makes
Cd2+ ions suits more to the structural environment in calcium carbonate. This is valid,
according to our results, for both minerals. Another important observation is that Ba2+
ions are much more adsorbed by aragonite minerals compared to calcite. No
Mineral [C]o
(mg/L)
[C]l
(mg/L)
[C]s
(mg/g) Sorption %
10 ~ 0 ~1.0 > 99.9 50 ~ 0 ~5.0 > 99.9 100 0.2 9.98 > 99.9 C
alcite
500 ~ 0 ~50.0 > 99.9 10 ~ 0 ~1.0 > 99.9 50 ~ 0 ~5.0 > 99.9 100 ~ 0 ~10.0 > 99.9
Aragonite
500 0.2 49.98 99.7

44
experimental information is available in literature in regard to this. However, some
theoretical models exist that are based on a thermodynamic basis predicting the
preference of aragonite mineral towards Ba2+ uptake (Wang and Xu 2001). It is known
that, the ionic radii of the second group ions such as Ba2+ and Sr2+ are greater than that
of Ca2+ ion. Thus, it might be expected that they prefer the 9-foldcoordinated aragonite
environment instead of the 6-foldcoordinated calcite cells. However, experimental
evidence using structural technique collecting information on molecular level, such as
EXAFS, is required to validate this conclusion.
On a thermodynamic basis, in recent years some approaches are applied in order
to calculate the partition coefficients of adsorbed ions by CaCO3 during solid solution
(MexCa(1-x)CO3) formation process (Wang and Xu 2001, Sverjinsky and Molling 1992).
In order to determine the partition coefficients, DMe, of rhombohedral structures as
calcite, Equation 4.6 can be used (Böttcher et al. 1997).
log DMe,ideal = (∆Gof, CaCO3(s) - ∆G
of, MeCO3(s) - ∆G
of, Ca2+(aq) + ∆G
of,Me2+ (aq)) / ((ln (10))RT) (4.6)
In the equation, ∆Gof term represents the standard Gibbs free energies of adsorbed ions
and rhombohedral carbonate structures, T is the Kelvin temperature and R is the ideal
gas constant. Moreover, another equation was proposed by Y. Wang which included
some properties of adsorbed ions.
−2.303 RT log Kd = a*MHX(∆Gn,MH
Z+0 − ∆Gn,M0) + β*MHX(rM
Z+ − rn,MHZ+) − (∆Gf,M
Z+0 − ∆G0f,MHZ+) (4.7)
In the equation, Kd, a*, β*, and r represents partition coefficient, model constants,
and ionic radia, respectively. Based on this model, Kd values calculated for the
adsorption of Ba2+, Mn2+, and Cd2+ ions by calcite and aragonite are given in Table 3.5.
The obtained data generally obey to the order Cd2+> Mn2+> Ba2+, in line with the results
obtained by our experiments. However, the model prediction suggesting that Mn2+ ion is
adsorbed by both calcite and aragonite approximately at same proportion does not
correlate with the obtained experimental data.

45
Table 4.8. The partition coefficients calculated by the thermodynamic model of Wang’s and
Xu’s (2001).
4.3. Kinetics of Precipitate Formation of Metal Carbonates upon
Interaction with Calcite and Aragonite
4.3.1. Rate of Precipitate Formation
The rate of metal-carbonate precipitate formation was investigated by using the
initial concentrations 1000, 5000, and 10000 mg/L. In order to follow the kinetics of
precipitate formation, the contact periods were changed from 30 minutes up to 3 weeks.
The XRD diagrams of the samples obtained from the interaction of Ba2+, Mn2+, and
Cd2+ ions at various concentrations with calcite and aragonite minerals at different time
periods are shown in Figures 4.9-4.14. The most intense hkl reflections of metal
carbonates are marked in these diagrams. The ICDD card numbers used in the
identification of mineral carbonates are given in Table 4.9.
Table 4.9. ICDD card numbers of mineral carbonates relative to their crystal structure.
Log Kd Metal Ion Calcite Aragonite
Ba2+ -1.90 -0.86 Mn2+ 0.92 0.90
Cd2+ 2.52 3.09
Mineral ICDD Number CaCO3 (calcite) 81-2027 CaCO3 (aragonite) 03-0405 BaCO3 (witherite) 71-2394
MnCO3 (rhodochrosite) 44-1472 CdCO3 (otavite) 42-1342

46
20 25 30 35 40
3 weeks
1 week
24 hours
7 hours
2 hours
30 min
(a)
W (104)
C (104)
2θ20 25 30 35 40
3 weeks
1 week
24 hours
7 hours
2 hour
30 min
(b)
2θ
W (104)
C (104)
20 25 30 35 40
3 weeks
1 week
24 hours
7 hours
2 hours
30 min
(c)
C (104)
W (104)
2θ
Figure 4.9. The change in 104 XRD signal of BaCO3 (witherite) precipitate formed by the
interaction of Ba2+ ions with calcite; (a) 1000 mg/L Ba2+, (b) 5000 mg/L Ba2+, (c)
10000 mg/L Ba2+ W: witherite, C: calcite.
Figure 4.10. The change in 104 XRD signal of BaCO3 (witherite) precipitate formed by the
interaction of Ba2+ ions with aragonite; (a) 1000 mg/L Ba2+, (b) 5000 mg/L Ba2+,
(c) 10000 mg/L Ba2+ W: witherite, A: aragonite
20 25 30 35 40
3 weeks
1 week
24 hours
7 hours
2 hours
(a)
30 min
A (111)W (104)
20 25 30 35 40
3 weeks
1 week
24 hours
7 hours
2 hours
30 min
(b)
A (111)
W (104)
2θ
2θ
20 25 30 35 40
3 weeks
1 week
24 hours
7 hours
2 hours
30 min
(c)A (111)
W (104)
2θ

47
Figure 4.11. The change in 104 XRD signal of MnCO3 (rhodochrosite) precipitate formed by
the interaction of Mn2+ ions with calcite; (a) 1000 mg/L Mn2+, (b) 5000 mg/L Mn2+,
(c) 10000 mg/L Mn2+ R: rhodochrosite, C: calcite
Figure 4.12. The change in 104 XRD signal of MnCO3 (rhodochrosite) precipitate formed by
the interaction of Mn2+ ions with aragonite; (a) 1000 mg/L Mn2+, (b) 5000 mg/L
Mn2+, (c) 10000 mg/L Mn2+ R: rhodochrosite, A: aragonite
20 25 30 35 40
3 weeks
1 week
24 hours
7 hours
2 hours
30 min
2θ
(a)
R (104)
C (104)
2θ20 25 30 35 40
3 weeks
1 weeek
24 hours
7 hours
2 hours
30 min
(b)
R (104)
C (104)
20 25 30 35 40
3 weeks
1 week
24 hours
7 hours
2 hours
30 min
2θ
(c)
R (104)
C (104)
20 25 30 35 40
3 weeks
1 week
24 hours
7 hours
2 hours
30 min
(a)
R (104)
A (111)
2θ
20 25 30 35 40
3 weeks
1 week
24 hours
7 hours
2 hours
30 min
(b)
R (104)
2θ
20 25 30 35 40
48 hours
7 hours
2 hours
5 min
30 min
(c)R (104)
2θ

48
Figure 4.13. The change in 104 XRD signal of CdCO3 (otavite) precipitate formed by the
interaction of Cd2+ ions with calcite; (a) 1000 mg/L Cd2+, (b) 5000 mg/L Cd2+, (c)
10000 mg/L Cd2+ O: otavite, C: calcite.
Figure 4.14. The change in 104 XRD signal of CdCO3 (otavite) precipitate formed by the
interaction of Cd2+ ions with aragonite; (a) 1000 mg/L Cd2+, (b) 5000 mg/L Cd2+,
(c) 10000 mg/L Cd2+ O: otavite, A: aragonite.
20 25 30 35 40
1 week
24 hours
7 hours
2 hours
1 hour
5 min
(a)C (104)
O (104)
2θ
2θ20 25 30 35 40
3 weeks
24 hours
7 hours
2 hours
1 hour
5 min
(b)
O (104)
C (104)
20 25 30 35 40
3 weeks
24 hours
7 hours
2 hours
1 hour
5 min
(c)
O (104)
C (104)
2θ
20 25 30 35 40
(a)
O (104)
A (111)
3 weeks
48 hours
24 hours
2 hours
30 min
5 min
2θ20 25 30 35 40
O (104)
A (111)
(b)
3 weeks
48 hours
24 hours
2 hours
30 min
5 min
2θ
20 25 30 35 40
O (104)(c)
5 min
30 min
2 hours
24 hours
48 hours
3 weeks
2θ

49
As it is observed from diagrams, Ba2+, Mn2+, and Cd2+ ions form BaCO3
(witherite), MnCO3 (rhodochrosite), and CdCO3 (otavite) minerals, respectively. The
metal-carbonate peak signals increase in various proportions for different elements as
the initial concentration is raised. The interaction of each of the ions with aragonite is
seen to cause more metal-carbonate formation compared to the interaction with calcite.
Also, the carbonate amounts formed upon the interaction of the ions with aragonite are
more sensitive to the stirring time period in comparison to calcite.
As it is known, the precipitate formation of metal-carbonates in carbonate
solutions is dependent on both carbonate and metal ion concentrations. Beyond
saturation conditions, the reactions leading to BaCO3, MnCO3, or CdCO3 formations in
the solutions and the corresponding Ksp values (Skoog et al. 1997) are given below:
Ba2+ + CO32- ⇔ BaCO3(s) Ksp= 5.0 x10
-9 (4.8)
Mn2+ + CO32- ⇔ MnCO3(s) Ksp= 5.0 x 10
-10 (4.9)
Cd2+ + CO32- ⇔ CdCO3(s) Ksp= 1.8 x 10
-14 (4.10)
It is expected that the existence of calcium carbonate in contact with the
solutions will bring about surface precipitation. Based on the surface precipitation
model (Zhu 2002), the reactions are given by the equations:
>CaCO3o + Me2+ + HCO3
- ⇔ CaCO3(s) + >MeCO3o + H+ (4.11)
>MeCO3o + Me2+ + HCO3
- ⇔ MeCO3(s) + >MeCO3o + H+ (4.12)
In the reactions, the symbol ‘>’ indicates that carbonates are bound to the solid
surface. According to the reactions, while some portion of metal carbonates are formed
within the solution (bulk precipitation), another portion emerges by the interactions of
metal ions with the carbonate ions on the solid surface (surface precipitation). In the
bicarbonate-rich media, surface precipitation appears as a preliminary step for the bulk
precipitation of metal carbonates. Within the pH values of the performed experiments,
Tables 3.1-3.5, and the speciation of CaCO3, the concentration of bicarbonate (HCO3-)
ions is expected to be greater than that of CO32- ions, and thus will play an important
role in precipitate formation of the three metal carbonates.

50
4.3.2. XRD Quantitative Calculations
In order to determine the amounts of carbonates formed as a result of the
interaction of ions with calcite and aragonite minerals, quantitative XRD was applied.
For this purpose, empirical equations were developed for the quantification of binary
carbonate mixtures. In these equations, it is possible to calculate the carbonate amount
as a mass fraction by use of intensities of signals or peak areas obtained from XRD
diagrams of the binary mixtures of BaCO3, MnCO3, or CdCO3 minerals with calcite or
aragonite.
Theoretically, the intensities of the x-rays reflected from any component is
directly proportional with the amount of substances in that component and inversely
proportional with the mass absorption coefficient of the mixture (Ouhadi and Yong
2003). In the first step of the quantitative XRD studies, XRD diagrams were recorded
for synthetic MeCO3-calcite and MeCO3-aragonite mixtures formed from pure phases
of calcite, aragonite, and MeCO3 (MeCO3 = BaCO3, MnCO3, or CdCO3) minerals.
These mixtures were prepared by mixing metal carbonates with pure calcite or aragonite
containing 0.10, 0.20, 0.30, 0.40, 0.50, 0.60, 0.70, 0.80, and 0.90 metal carbonate as
mass fraction in a mixture. All these processes were repeated three times for each
carbonate mixtures. The peak areas of hkl lines of metal carbonates, 104 reflections of
calcite, witherite, rhodochrosite, and otavite 111 reflection of aragonite obtained from
XRD diagrams were obtained by use of Origin 5.0 program. Using the peak areas, the
ratios of MeCO3/calcite and MeCO3/aragonite were calculated and the calibration
curves were developed by drawing these ratios versus mass fractions. Finally, the
curves were fitted to mathematical equations using Microsoft Excel. It was observed
that the standard error fit of curves do not exceed 5%. The experimental data and
corresponding fits are provided in Figure 4.15 and 4.16 for metal carbonate
precipitation on calcite and aragonite, respectively.
In carrying out the quantification analysis, it is assumed that the mass absorption
coefficients of these synthetic binary mixtures are the same as those of the samples
formed as a result of precipitation of MeCO3 on calcite or aragonite surfaces. In
addition to this, the peak areas of the most intense reflections of metal carbonates were
used instead of using peak areas of all XRD reflection lines.

51
Figure 4.15. Variation of the mass fractions of MeCO3 in their mixtures with calcite as a
function of the intensity ratio of the MeCO3/calcite; MeCO3= (a) BaCO3, (b)
MnCO3, (c) CdCO3.
0 1 2 3 4 5 6 70,0
0,2
0,4
0,6
0,8
1,0
experimental theoretical
XW
Iw/IC
(a)
0,1 0,2 0,3 0,4 0,5 0,60,0
0,2
0,4
0,6
0,8
1,0
experimental theoretical
XR
IR/IC
(b)
0,1 0,2 0,3 0,4 0,5 0,6 0,7 0,8 0,90,0
0,2
0,4
0,6
0,8
1,0
XO
IO/IC
experimental theoretical
(c)

52
Figure 4.16. Variation of the mass fractions of MeCO3 in their mixtures with aragonite as a
function of the intensity ratio of the MeCO3/aragonite; MeCO3= (a) BaCO3, (b)
MnCO3, (c) CdCO3.
0 1 2 3 4 5 6 7 80,0
0,2
0,4
0,6
0,8
1,0
XW
Iw/IA
experimental theoretical
(a)
0 2 4 6 8 100,0
0,2
0,4
0,6
0,8
1,0
XR
IR/IA
experimental theoretical
(b)
0 2 4 6 8 10 120,0
0,2
0,4
0,6
0,8
1,0
XO
IO/IA
experimental theoretical
(c)

53
The equations obtained from calibration curves are given in Table 4.10. The
range of peak area ratios used in the development of the equations (IMeCO3/Icalcite or
IMeCO3/IAragonite) is also included in Table 4.10 together with the standard error fits. In the
equations, XW, XR, and XO represent the mass fractions of BaCO3 (witherite), MnCO3
(rhodochrosite), and CdCO3 (otavite), respectively. IW, IR, IO, and IC represent the peak
areas of 104 reflections of BaCO3, MnCO3, CdCO3, and calcite; while, IA indicates peak
area of 111 reflection of aragonite.
Table 4.10. The equations of binary metal carbonates developed for quantitative XRD analysis.
Carbonate
Mixture Equation
Range of Peak
Ratios Used
(IMeCO3/ICaCO3)
Standard Error
Fit of Curves
BaCO3-calcite )/(52.01
)/(61.0
CW
CW
WII
IIX
+= 0.0 - 6.64 3.3 %
MnCO3-calcite )/(83.01
)/(69.0
CR
CR
RII
IIX
−= 0.0 - 0.61 3.6 %
CdCO3-calcite )/(85.01
)/(31.0
CO
CO
OII
IIX
−= 0.0 - 0.83 5.0 %
BaCO3-aragonite )/(19.01
)/(28.0
AW
AW
WII
IIX
+= 0.0 - 7.75 1.8 %
MnCO3-aragonite )/(97.01
)/(99.0
AR
ARR
II
IIX
+= 0.0 - 8.39 2.9 %
CdCO3-aragonite )/(20.01
)/(25.0
AO
AO
OII
IIX
+= 0.0 - 11.07 2.4 %
The variation of the mass fraction of MeCO3 (calculated using the above
equations) with different times and initial concentrations are shown in Figures 4.17,
4.18, and 4.19. Since XRD signals originate from the upper part of the surface (several
microns), the calculated mass fractions are expected to be different from the fractions
within the bulk.
As can be seen from the figures, the amount of MeCO3 precipitates formed on
aragonite mineral are larger than those formed on calcite mineral at all concentrations.

54
The general trend indicates that, the precipitate formation kinetics increases at the initial
stages; then decreases, and finally approaches equilibrium. Depending on the
concentration and the type of the metal, days or weeks might be required for precipitate
formation kinetics to approach equilibrium.
Figure 4.17. The change of mass fractions of precipitated BaCO3 as a function of time and
initial concentration; (a) on calcite surface, (b) on aragonite surface.
0,0
0,1
0,2
0,3
0,4
0,5
0,6
0100
200300
40050010000
5000
1000
XW
time (hour)
concentration (mg/L)
(a)
0,0
0,2
0,4
0,6
0,8
0100
200300
400500
concentration (mg/L)
10000
5000
1000
XW
time (hour)
(b)

55
Figure 4.18. The change of mass fractions of precipitated MnCO3 as a function of time and
initial concentration; (a) on calcite surface, (b) on aragonite surface.
0,000,050,100,150,20
0,25
0,30
0,35
0,40
100200
300400500
1000
5000
10000
time (hour)
concentration (mg/L)
XR
(a)
0,0
0,2
0,4
0,6
0,8
1,0
100200
300400500
XR
1000
5000
10000
time (hour)
concentration (mg/L)
(b)

56
Figure 4.19. The change of mass fractions of precipitated CdCO3 as a function of time and
initial concentration; (a) on calcite surface, (b) on aragonite surface.
0,00
0,05
0,10
0,15
0,20
0,25
0,30
0,35
0100
200300
400500
100005000
1000
XO
time (hour)concentration (mg/L)
(a)
0,0
0,2
0,4
0,6
0,8
1,0
0100
200300
400500
XO
time (hour)
1000
5000
10000concentration (mg/L)
(b)

57
As the figures show, among these three carbonates, BaCO3 is demonstrating the
slowest kinetics. It is seen that, the increase of initial ion concentration affects
precipitated BaCO3 amount more than other metal carbonates. This is particularly
observed when the concentration is increased from 5000 mg/L to 10000 mg/L. The
mass fraction of BaCO3 on aragonite surface at 10000 mg/L initial ion concentration is
about 0.8 whereas that on calcite surface is approximately 0.6. While a limited amount
of Ba2+ ions are adsorbed by calcite mineral as was previously mentioned, larger
amount of Ba2+ are fixed during the precipitation process. This shows that in addition to
tightly fixing the ion in the solid matrix, the precipitation mechanism involves an
enhanced uptake of that ion. On the other hand, MnCO3 and CdCO3 show similar
behaviors with respect to precipitate kinetics and precipitated amounts. The mass
fractions of MnCO3 and CdCO3 formed on calcite surface at 10000 mg/L ion
concentration are approximately 0.30 and 0.35 whereas this fraction is 0.9 on aragonite
surface which means that aragonite surface is almost covered by MnCO3 and CdCO3.
4.3.3. EDS Mapping
EDS mapping was used to reveal the distribution of Ba, Mn, and Cd on the
surface of calcite and aragonite, following the precipitation of the carbonates of these
elements. The distribution of Ba2+ in the carbonate surface in comparison to that of Ca2+
was recorded over areas of approximate dimensions of 100µm×100µm. The elemental
maps were recorded for carbonates contacted with Ba2+, Mn2+, and Cd2+ at the initial
concentration of 10000 mg/L for a period of 3 weeks. The EDS maps are shown in
Figure 4.20. In the BaCO3-calcite sample, the Ca-rich cores appear to include large
spheroidal grains that are surrounded by more finely distributed Ba-containing phase
(presumably BaCO3). In BaCO3-aragonite case, more intense Ba maps were obtained.
Compared with BaCO3-calcite samples, the exterior rims of the carbonate grains are less
distinguishable and appear more uniformly distributed. However, closer inspection
reveals the presence of Ba- and Ca-rich regions corresponding to the two distinct
carbonate phases.
Similar results were obtained for the distributions of Mn and Cd on calcite and
aragonite surfaces. Typical maps of Mn, Cd in comparison to Ca distributions are
demonstrated in Figure 4.21 and 4.22, respectively.

58
Figure 4.20. X-ray maps showing the distributions of (a) Ca on BaCO3-calcite surface, (b) Ba
on BaCO3-calcite surface, (c) Ca on BaCO3-aragonite surface, (d) Ba on BaCO3-
aragonite surface.
Figure 4.21. X-ray maps showing the distributions of (a) Ca on MnCO3-calcite surface, (b) Mn
on MnCO3-calcite surface, (c) Ca on MnCO3-aragonite surface, (d) Mn on
MnCO3-aragonite surface.
(a)
(b)
(c)
(d)
(a)
(b)
(c)
(d)

59
Figure 4.22. X-ray maps showing the distributions of (a) Ca on CdCO3-calcite surface, (b) Cd
on CdCO3-calcite surface, (c) Ca on CdCO3-aragonite surface, (d) Cd on CdCO3-
aragonite surface.
As it is observed from the figures, Mn and Cd signals cover almost completely
aragonite in comparison to weak Ca signals, which is inline with the XRD quantitative
results discussed in the previous section. On the other hand, Mn and Cd signals on
MeCO3-calcite surface are seen to be weaker than that of MeCO3-aragonite surface, the
thing accompanied with stronger Ca signals compared to aragonite case.
4.3.4. Effect of pH Change on Precipitate Formation
In order to determine the effect of pH on precipitate formation, the pH of the
medium was adjusted to 10.0. The precipitates of the samples prepared in 1000, 5000,
and 10000 mg/L initial concentration and 24 hours stirring time are investigated. XRD
diagrams of MeCO3-calcite and MeCO3-aragonite (MeCO3= BaCO3, MnCO3, or
CdCO3) are shown in Figure 4.23 and 4.24, respectively. Theoretically, it is expected
that the increase of pH will cause an increase in the amount of carbonate ions, CO32-, in
(a)
(b)
(c)
(d)

60
the medium and consequently enhance precipitation. The aim of the experiments was to
reveal the comparative response of calcite and aragonite to the increase in pH of the
medium. The amount of precipitated metal carbonates was increased by various
proportions upon increasing the pH to 10.0. Generally, this increment is much more
distinct in aragonite case than calcite case for the three ions; Ba2+, Mn2+, and Cd2+. In
the case of calcite, the decrease in calcite signals which points to the extent of
dissolution and the consequent formation of MeCO3 on calcite surface, is most
pronounced in the case of contact with Cd2+ ions, and is the least upon contact with Ba2+
ions.
Figure 4.23. XRD diagrams of the precipitates formed on calcite surface after the pH of medium was
adjusted to 10.0 (a) BaCO3, (b) MnCO3, and (c) CdCO3. The initial ion concentrations are
(i) 1000 mg/L, (ii) 5000 mg/L, and (iii) 10000 mg/L W: witherite, R: rhodochrosite, O:
otavite, and C: calcite.
Figure 4.24. XRD diagrams of the precipitates formed on aragonite surface after the pH of medium was
adjusted to 10.0 (a) BaCO3, (b) MnCO3, and (c) CdCO3. The initial ion concentrations are (i)
1000 mg/L, (ii) 5000 mg/L, and (iii) 10000 mg/L. W: witherite, R: rhodochrosite, O: otavite,
and A: aragonite.
20 25 30 35 40
2θ 2θ
(iii)
(ii)
(i)
C (104)
W (104)
(a)
2θ
20 25 30 35 40
(iii)
(ii)
(i)
R (104)
C (104)
(b)
20 25 30 35 40
(iii)
(ii)
(i)
O (104)C (104)(c)
20 25 30 35 40
(iii)
(ii)
(i)
(a)
W (104)
A (111)
20 25 30 35 40
(iii)
(ii)
(i)
(b)
A (111)
R (104)
20 25 30 35 40
2θ2θ
(iii)
(ii)
(i)
(c)
O (012)
A (111)
O (104)
2θ

61
4.3.5. Effect of Temperature Change on Precipitate Formation
In order to determine the effect of temperature on precipitate formation, the
temperature of the medium is adjusted to 50oC in comparison to the earlier experiments
performed at room temperature. The precipitates of the samples prepared at the initial
concentration of 1000, 5000, and 10000 mg/L and stirring time 24 hours are
investigated. The obtained XRD diagrams of MeCO3-calcite and MeCO3-aragonite are
shown in Figure 4.25 and 4.26, respectively. The results indicated an apparent increase
in the intensities of precipitated metal carbonates. Our earlier experiments on the effect
of temperature on adsorption of these metal ions have also indicated an increase in the
fixed amounts of ions as a result of temperature increase. Although the same seems to
be valid at the stage of precipitation, according to our experiments, further elaboration
of the topic is required.
20 25 30 35 40
(i)
(i)
(iii)
(a) C (104)
W (104)
20 25 30 35 40
(iii)
(i)
(i)
R (104)
C (104)(b)
20 25 30 35 402θ 2θ 2θ
(iii)
(ii)
(i)
O (104)
C (104)(c)
Figure 4.25. XRD diagrams of the precipitates formed on calcite surface after the temperature
of medium was adjusted to 50oC (a) BaCO3, (b) MnCO3, and (c) CdCO3. The
initial ion concentrations are (i) 1000 mg/L, (ii) 5000 mg/L, and (iii) 10000
mg/L W: witherite, R: rhodochrosite, O: otavite, and C: calcite.

62
20 25 30 35 40
(i)
(iii)
(ii)
A (111)
W (104) (a)
20 25 30 35 40
(iii)
(ii)
(i)
C (104)R (104)
A (111)
(b)
20 25 30 35 40
2θ2θ
(iii)
(ii)
(i)
A (111)
O (104) (c)
2θ
Figure 4.26. XRD diagrams of the precipitates formed on aragonite surface after the
temperature of medium was adjusted to 50oC (a) BaCO3, (b) MnCO3, and (c)
CdCO3. The initial ion concentrations are (i) 1000 mg/L, (ii) 5000 mg/L, and
(iii) 10000 mg/L W: witherite, R: rhodochrosite, O: otavite, and A: aragonite.
4.4. The Morphological Aspects and FTIR Spectra of Precipitated
Metal Carbonates
4.4.1. SEM Images
Scanning Electron Microscope (SEM) was used to reveal the morphologies of
the minerals. Typical SEM images of BaCO3, MnCO3, and CdCO3 minerals formed on
calcite and aragonite surfaces are given in Figure 4.27, 4.28 and 4.29, respectively.
As it is seen from Figure 4.27, BaCO3 minerals precipitated on both minerals
appeared to predominantly possess olivary-like morphology with an average particle
size of 1-2 µm. Based on SEM images of MnCO3, the crystal size of the mineral is
about 200 nm, and it owns layered rhombohedral morphology (Figure 4.28). The
morphology of CdCO3 mineral is less distinct compared to other carbonates. In this
carbonate structure, there are aggregates with 1-2 µm size in a conic shape and each
aggregate consists of layers whose edge length is approximately 100 nm (Figure 4.29).

63
Figure 4.27. SEM images of BaCO3 precipitated on (a, b) calcite surface, (c, d) aragonite
surface.
(a)
(b)
(c)
(d)
Figure 4.28. SEM images of MnCO3 precipitated on (a, b) calcite surface, (c, d) aragonite
surface.
(a)
(b)
(c)
(d)
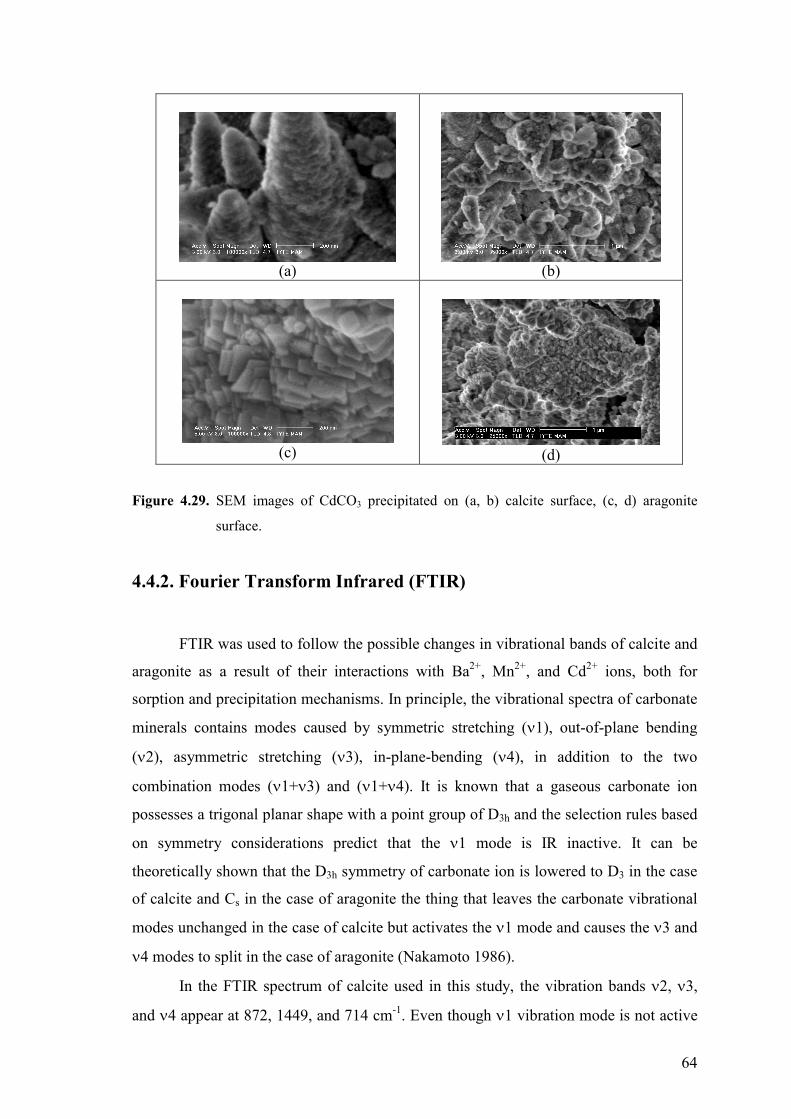
64
(a)
(b)
(c)
(d)
Figure 4.29. SEM images of CdCO3 precipitated on (a, b) calcite surface, (c, d) aragonite
surface.
4.4.2. Fourier Transform Infrared (FTIR)
FTIR was used to follow the possible changes in vibrational bands of calcite and
aragonite as a result of their interactions with Ba2+, Mn2+, and Cd2+ ions, both for
sorption and precipitation mechanisms. In principle, the vibrational spectra of carbonate
minerals contains modes caused by symmetric stretching (ν1), out-of-plane bending
(ν2), asymmetric stretching (ν3), in-plane-bending (ν4), in addition to the two
combination modes (ν1+ν3) and (ν1+ν4). It is known that a gaseous carbonate ion
possesses a trigonal planar shape with a point group of D3h and the selection rules based
on symmetry considerations predict that the ν1 mode is IR inactive. It can be
theoretically shown that the D3h symmetry of carbonate ion is lowered to D3 in the case
of calcite and Cs in the case of aragonite the thing that leaves the carbonate vibrational
modes unchanged in the case of calcite but activates the ν1 mode and causes the ν3 and
ν4 modes to split in the case of aragonite (Nakamoto 1986).
In the FTIR spectrum of calcite used in this study, the vibration bands ν2, ν3,
and ν4 appear at 872, 1449, and 714 cm-1. Even though ν1 vibration mode is not active

65
in pure calcite, a weak feature is observed at 1079 cm-1 which is stemming from minor
impurities.
The FTIR spectra of calcite and aragonite before and after interaction of Ba2+,
Mn2+, and Cd2+ ions are given in Figure 4.30, 4.31, and 4.32, respectively. The changes
in the vibrational bands are consequences of the change in the molecular environment of
carbonate groups. As it is understood from the figures, adsorptions of Mn2+ and Cd2+
ions by calcite and aragonite minerals, causes minor changes in vibration bands (Figure
4.31 (ii), and 4.32 (ii)). On the other hand, Ba2+ ion is seen to cause various
discrepancies (Figure 4.30 (ii)). It is known that these discrepancies are proportional to
the amount of ions but the results of the studies show that ionic radius is also effective.
Due to the scarcity of the information available about this subject, it was not possible to
compare the results with similar values in literature. The ionic radiuses of Mn2+, Cd2+,
Ba2+, and Ca2+ ions are 0.83, 0.95, 1.35, and 1.00 Å, respectively. The difference in size
between Ba2+ and Ca2+ is much larger compared to the difference between Mn2+or Cd2+
with Ca2+. Thus, the incorporation of Ba2+ in the lattice of calcite and aragonite as a
result of sorption can be expected to cause more impact than Mn2+ or Cd2+, yielding to
a change in intensities and energies of the vibration modes. At the stage of sorption, the
most distinctive change in calcite bands is an increase in intensity of ν1 vibration which
indicates a distortion in carbonate group symmetry. Another important alteration is a
splitting of double bands of ν2 and ν4 vibrations of carbonate groups in both calcite and
aragonite minerals. In general, the bands are observed to shift towards lower energy
values (red-shifts), indicating weaker interaction of Ba2+ ion, with CO32- ions in
comparison to he interaction of Ca2+ ions with CO32- ions in the carbonate matrix.
FTIR spectra of metal carbonates after precipitate formation on calcite and
aragonite surfaces are shown in Figure 4.30 (iii), 4.31 (iii), and 4.32 (iii), respectively.
As expected, the formations of metal carbonates cause more distinct variations than
adsorption. These variations are mostly pronounced as a result of BaCO3 formation.
When BaCO3 appeared as a distinct phase as a result of precipitation at concentrations
beyond 1000 mg/L, a split in the ν1 band took place and the splits in ν2 and ν4 modes
were greatly enhanced for both of calcite and aragonite cases. All the splits occurred at
lower wavenumbers. The emerging features were assigned to BaCO3 fractions in the
carbonate mixtures. To confirm this assignment, FTIR spectra of a separate pure sample
of BaCO3 were recorded and compared. According to the results, the bands of ν1, ν2,

66
ν3, ν4 in pure BaCO3 occurs at 1056, 854, 1432, and 690 cm-1, respectively, which are
very close to the newly emerging peaks after precipitation of BaCO3 on calcite and
aragonite.
3000 2500 2000 1500 1000 500
2451
2518
1753
1780
(iii)
(ii)
(i)
1449
1054
1083
872
691
714
wavenumber (cm-1)
3000 2500 2000 1500 1000 500
2529
1478
1754
1789
1055
1079
852709
691
(iii)
(ii)
(i)
wavenumber (cm-1)
Figure 4.30. FTIR spectra of (a): (i) calcite, (ii) Ba2+-calcite (500 mg/L Ba2+), (iii) BaCO3-
calcite (10000 mg/L Ba2+), (b): (i) aragonite, (ii) Ba2+-aragonite (500 mg/L Ba2+),
(iii) BaCO3-aragonite (10000 mg/L Ba2+).
(b)
(a)

67
3000 2500 2000 1500 1000 500
25181780
(iii)
(ii)
(i)
1449872
714
wavenumber (cm-1)
3000 2500 2000 1500 1000 500
25291789
(iii)
(ii)
(i)
1478
1079
852
691709
wavenumber (cm-1)
Figure 4.31. FTIR spectra of (a): (i) calcite, (ii) Mn2+-calcite (500 mg/L Mn2+), (iii) MnCO3-
calcite (10000 mg/L Mn2+), (b): (i) aragonite, (ii) Mn2+-aragonite (500 mg/L
Mn2+), (iii) MnCO3-aragonite (10000 mg/L Mn2+).
(a)
(b)

68
3000 2500 2000 1500 1000 500
2518
1780
(iii)
(ii)
(i)
1449
872
714
wavenumber (cm-1)
3000 2500 2000 1500 1000 500
2529 1789
(iii)
(ii)
(i)
1478
1079
852691
709
wavenumber (cm-1)
Figure 4.32. FTIR spectra of (a): (i) calcite, (ii) Cd2+-calcite (500 mg/L Cd2+), (iii) CdCO3-
calcite (10000 mg/L Cd2+), (b): (i) aragonite, (ii) Cd2+-aragonite (500 mg/L Cd2+),
(iii) CdCO3-aragonite (10000 mg/L Cd2+).
(a)
(b)

69
CHAPTER 5
CONCLUSION
In this study, the kinetic aspects of the uptake of Ba2+, Mn2+, and Cd2+ ions by
calcite and aragonite minerals over a wide range of concentrations at the stages of
adsorption and precipitate overgrowth was investigated. In addition to that, the
morphological and structural characterization of metal ion carbonates formed on calcite
and aragonite were also included in this study. Also, the effects of pH and temperature
change on precipitate formation were studied.
Analysis of the kinetic results has shown that Cd2+ ions approach equilibrium
more rapidly than Ba2+ and Mn2+ ions, the thing valid for both calcite and aragonite
minerals. Additionally, the results demonstrate that the kinetics of these three ions on
calcite and aragonite minerals is best described by the pseudo-second order rate
equation. The affinity demonstrated by both minerals appears to be the highest towards
Cd2+ ions and smallest towards Ba2+ ions. Moreover, the uptake of the three ions
appeared to be enhanced as a result of temperature increase.
The studies on precipitate formation of metal carbonates upon interaction with
calcite and aragonite showed that the more metal-carbonate formation occurred when
the ions were interacted with aragonite as compared to calcite. XRD quantitative
analysis was performed in order to determine the amounts of carbonates formed as a
result of interaction of ions with calcite and aragonite minerals. According to the three-
dimensional graphs of MeCO3 mass fractions calculated using derived equations at
different times and initial concentration, BaCO3 is demonstrating the slowest kinetics
among three carbonates and as initial ion concentration increases the amount of
precipitated BaCO3 is increased markedly. Comparatively, the increase in initial
concentration led to less enhancement in precipitate formation of MnCO3 and CdCO3.
At 10000 mg/L concentration, MnCO3 and CdCO3 appeared to cover almost completely
the aragonite surface, the thing confirmed also by EDS analysis of elemental
distribution. Furthermore, the increase of pH to 10.0, caused an increment of precipitate
formation, the thing more distinctly seen in aragonite. The formation of MeCO3 on
calcite surface is most pronounced in the case of contact with Cd2+ ions and is the least

70
with Ba2+ ions. In addition, the results have shown that the increase of medium
temperature to 50oC caused an apparent increase in the intensities of precipitated metal
carbonates.
According to SEM images, BaCO3 minerals possess olivary-like morphology
with an average particle size of 1-2 µm. MnCO3 demonstrated layered rhombohedral
morphology with particle size of about 200 nm. Comparatively, CdCO3 morphology
appeared to be less distinct than other carbonates, showing aggregates with a conic
shape that are1-2 µm in size with each aggregate consisting of layers whose edge length
is approximately 100 nm. Based on FTIR results, the ionic radius seems to be the most
effective parameter in affecting the vibrational modes of calcite and aragonite. So, the
incorporation of Ba2+ in the calcite or aragonite lattice appeared to cause more impact
than Mn2+ or Cd2+ yielding.
Further studies can be performed to assess the effect of pH and temperature on
precipitate formation kinetics of the metal carbonates.

71
REFERENCES
Bancroft, G., Brown, J.R., Fyfe, W.S., 1977. “Quantitative X-ray Photoelectron
Spectroscopy (ESCA): Studies of Ba2+ Sorption on Calcite”, Chemical Geology.Vol.
19, pp. 131-144.
Bilinski, H., Kozar, S., Plavšić, M., Kwokal .Z , Branica, M., 1991. “Trace Metal
Adsorption on Inorganic Solid Phases under Estuarine Conditions”, Marine
Chemistry. Vol. 32, pp. 225-233.
Böttcher, M.E., Tesoriero, A.J., Pankow, J.F., 1997. “Comment Solid Solution
Partitioning of Sr2+, Ba2+, and Cd2+ to Calcite”, Geochimica Cosmochimica Acta.
Vol. 61, pp. 661-662.
Capellen, P.V., Charlet, L., Stumm, W., Wersin, P., 1993. “A Surface Complexation
Model of the Carbonate Mineral-Aqueous Solution Interface”, Geochimica et
Chosmochimica Acta.Vol. 57, pp. 3505-3518.
Chiarello, R.P., Sturchio, N.C., Grace, J.D., Geissbuhler, P., Sorensen, L.B., Cheng, L.,
Xu, S., 1997. “Otavite-calcite Solid Solution Formation at the Calcite-water
Interface Studied in situ by Synchrotron X-ray Scattering”, Geochimica et
Cosmochimica Acta. Vol. 61, pp. 1467-1474.
Curti, E., 1999. “Coprecipitation of Radionuclides with Calcite: Estimation of Partition
Coefficients based on a Review of Laboratory Investigations and Geochemical
Data”, Applied Geochemistry. Vol. 14, pp. 433-445.
Davis, J.A., Fuller C.C., Cook A.D., 1987. “A Model for Trace Metal Sorption
Processes at the Calcite Surface: Adsorption of Cd2+ and Subsequent Solid Solution
Formation”, Geochimica et Cosmochimica Acta. Vol. 51, pp. 1477-1490.
Ewing, G.W., 1985. “Atomic Absorption”, in Instrumental Methods of Chemical
Analysis, (McGraw-Hill Book Co.-Singapore), pp.109-122.

72
Fuller, C.C., Davis, J.A., 1987. “Processes and Kinetics of Cd2+ Sorption by a
Calcareous Aquifer Sand”, Geochimica et Cosmochimica Acta. Vol. 51, pp. 1491-
1502.
Garcia-Sánchez A. and Álvarez-Ayuso E., 2002. “Sorption of Zn, Cd and Cr on Calcite.
Application to Purification of Industrial Wastewaters”, Minerals Engineering.
Vol.15/7, pp. 539-547.
Godelitsas, A., Astilleros, J.M., Hallam, K., Harissopoulos, S., Putnis, A., 2003.
“Interaction of Calcium Carbonates with Lead in Aqueous Solutions”,
Environmental Science and Technology. Vol. 37, No. 15, pp. 3351-3360.
Gutjahr, A., Dabringhaus H., Lacmann R., 1996. “Studies of the Growth and
Dissolution Kinetics of the CaCO3 Polymorphs Calcite and Aragonite II. The
Influence of Divalent Cation Additives on the Growth and Dissolution Rates”,
Journal of Crystal Growth. Vol. 158, pp. 310-315.
Han, R., Zou, W., Zhang, Z., Shi, J., Yang, J., 2006. “Removal of Copper (II) and Lead
(II) from Aqueous Solution by Manganese Oxide Coated Sand: I. Characterization
and Kinetic Study”, Journal of Hazardous Materials. Vol.137, pp. 384-395.
Ho, Y.S., Mckay, G., 1998. “Sorption of Dye from Aqueous Solution by Peat”,
Chemical Engineering Journal. Vol. 70, pp. 115-120.
Jenniss, S.W., Katz, S.A., Lynch, R.W., 1997. “Atomic Absorption Spectrometry”, in
Application of Atomic Spectrometry to Regulatory Compliance Monitoring, (Wiley-
VCH, Inc., New York), pp. 2-18.
Jensen, D.L., Boddum, J.K., Tjell, J.C., Christensen, T.H., 2002. “The Solubility of
Rhodochrosite (MnCO3) and Siderite (FeCO3) in Anaerobic Aquatic
Environments”, Applied Geochemistry. Vol. 17, pp. 503-511.

73
Johnson, C.A. and Furrer G., 2002. “Influence of Biodegradation Processes on the
Duration of CaCO3 as a pH Buffer in Municipal Solid Waste Incinerator Bottom
Ash”, Environmental Science Technology. Vol. 36/2, pp. 215-220.
Kinsman, D.J., Holland, H.D., 1969. “The Co-precipitation of Cations with CaCO3-IV.
The Co-precipitation of Sr2+ with Aragonite between 16° and 96°C”, Geochimica et
Cosmochimica Acta. Vol. 33, pp. 1-17.
Kirby, C.S. and Rimstidt, J.D., 1994. “Interaction of Municipal Solid Waste Ash with
Water”, Environmental Science Technology. Vol. 28, pp. 443-451.
Kitano, M.O., 1986. “Coprecipitation of Alkali Metal Ions with Calcium Carbonate”,
Geochimica et Cosmochimica Acta. Vol. 50, pp. 49-58.
Kosmulski, M., 2001. Chemical Properties of Material Surfaces, (Marcel Dekker, Inc.,
New York), pp. 207.
Lagergren, S., 1898. “Zur Theorie der Sogenannten Adsorption Gelöster Stoffe”, K.
Sven. Vetenskapsakad. Handl. Vol. 24, pp. 1-39.
Langmuir, D., 1997. Aqueous Environmental Chemistry, (Prentice-Hall, Inc., New
Jersey), pp. 193-230.
Lieser, K.H., 1995. “Radionuclides in the Geosphere: Sources, Mobility, Reactions in
Natural Waters and Interactions with Solids”, Radiochimica Acta. Vol. 70/71, pp.
355.
Lorens, R.B., 1981. “Sr, Cd, Mn and Co Distribution Coefficients in Calcite as a
Function of Calcite Precipitation Rate”, Geochimica et Cosmochimica Acta. Vol.
45, pp. 553-561.
Magaritzl, M., Brenner, B., Ronen, D., 1990. “Ba and Sr Distribution at the Water-table:
Implications for Monitoring Ground-water at Nuclear Waste Repository Sites”,
Applied Geochemistry. Vol. 5, pp. 555-562.
74
Martin-Garin, A., Gaudet, J.P., Charlet, L., Vitart, X., 2002. “A Dynamic Study of the
Sorption and the Transport Processes of Cadmium in Calcareous Sandy Soils”,
Waste Management. Vol. 22, pp. 201-207.
Meece, D.E. and Benninger, L.K., 1993. “The Coprecipitation of Pu and Other
Radionuclides with CaCO3”, Geochimica et Cosmochimica Acta. Vol. 57, pp. 1447-
1458.
Miyake, M., Komarneni, S., Roy, R., 1988. “Immobilization of Pb2+, Cd2+, Sr2+ and
Ba2+ Ions using Calcite and Aragonite”, Cement and Concrete Research. Vol. 18,
pp. 485-490.
Moulin, P., Roques, H., 2003. “Zeta Potential Measurement of Calcium Carbonate”,
Journal of Colloid and Interface Science. Vol. 261, pp.115-126
Nakamoto, K., 1986. Infrared and Raman Spectra of Inorganic and Coordination
Compounds, (John Wiley & Sons New York), pp. 86-87.
Ning, X., Hochella, Jr. M.F., Brown, Jr. G.E., Parks, G.A., 1996. “Co(II) Sorption at the
Calcite-water Interface: I. X-ray Photoelectron Spectroscopic Study”, Geochimica et
Cosmochimica Acta. Vol. 60, pp. 2801-2815.
Ouhadi, V.R. and Yong, R.N., 2003. “Impact of Clay Microstructure and Mass
Absorption Coefficient on the Quantitative Mineral Identification by XRD
Analysis”, Applied Clay Science. Vol. 23, pp. 141-148.
Pagenkopf, G.K., 1978. Introduction to Natural Water Chemistry, (Marcel Dekker, Inc.,
New York), pp. 1-16.
Pingitore, N.E., Eastman, M.P., Sandidge, M., Oden, K., Freiha, B., 1988. “The
Coprecipitation of Manganese(II) with Calcite: An Experimental Study”, Marine
Chemistry. Vol. 25, pp. 107-120.

75
Pingitore, N.E. and Eastman, M.P., 1984. “The Experimental Partitioning of Ba2+ into
Calcite”, Chemical Geology. Vol. 45, pp. 113-120.
Piriou, B., Fedoroff, M., Jeanjean, J., Bercis, L., 1997. “Characterization of the Sorption
of Europium(III) on Calcite by Site-Selective and Time-Resolved Luminescence
Spectroscopy”, Journal of Colloid and Interface Science. Vol. 194, pp. 440-447.
Prieto, M., Cubillas, P., Fernández-Gonzalez, Á., 2003. “Uptake of Dissolved Cd by
Biogenic and Abiogenic Aragonite: A Comparison with Sorption onto Calcite”,
Geochimica Cosmochimica Acta. Vol. 67, pp. 3859-3869.
Robbins, J.A., Lindner, G., Pfeiffer, W., Kleiner, J., Stabel, H.H., Frenzel, P., 1992.
“Epilimnetic Scavenging of Chernoobyl Radionuclides in Lake Constance”,
Geochimica et Cosmochimica Acta. Vol. 56, pp. 2339-2361.
Shahwan, T., Atesin, A.C., Erten, H.N., Zararsiz, A., 2002. “The Uptake of Ba2+ Ions by
Natural Bentonite and CaCO3: A Radiotracer, EDXRF and PXRD Study”, Journal
of Radioanalytical Nuclear Chemistry. Vol. 254/3, pp. 563.
Shahwan, T., Zünbül, B., Tunusoğlu, O., Eroğlu, A.E., 2005. “AAS, XRPD, SEM/EDS,
and FTIR Characterization of Zn2+ Retention by Calcite, Calcite-kaolinite, and
Calcite-clinoptilolite Minerals”, Journal of Colloid and Interface Science. Vol. 286,
pp. 471-478.
Shahwan, T., Zünbül, B., Eroğlu, A.E., Yılmaz S., 2005. “Effect of Magnesium
Carbonate on the Uptake of Aqueous Zinc and Lead Ions by Natural Kaolinite and
Clinoptilolite”, Applied Clay Science. Vol. 30, pp. 209-218.
Shahwan, T., Zünbül, B., Akar, D., 2005. “Study of the Scavenging Behavior and
Structural Changes Accompanying the Interaction of Aqueous Pb2+ and Sr2+ Ions
with Calcite”. Geochimica Journal. Vol. 39, pp. 317-326.
Skoog, M.D., West, D.M., Holler, F.J., 1997. Fundamentals of Analytical Chemistry,
(Harcourt Brace & Company, Florida), pp. A-6.

76
Smith, B.C., 1996. Fundamentals of Fourier Transform Infrared Spectroscopy, (CRC
Press LLC, Florida), pp.1-53.
Speck, P.J.H.R., de Graaf, J.W.M, Nieuwenhuis, J.D., Zijlstra, J.J.P., 1998. “Optimizing
the Process of Sulphuric Acid Injection into Limestones”, Journal of Geochemical
Exploration. Vol. 62, pp. 331-335.
Sternbeck, J., 1997. “Kinetics of Rhodochrosite Crystal Growth at 25oC: The Role of
Surface Speciation”, Geochimica et Cosmochimica Acta. Vol. 61, pp. 785-793.
Stipps, S.L.S., 1999. “Toward a Conceptual Model of the Calcite Surface: Hydration,
Hydrolysis, and Surface Potential”, Geochimica et Cosmochimica Acta. Vol. 63, pp.
3121-3131.
Strobel, A.S. and Heineman, R.W., 1989. Chemical Instrumentation: A Systematic
Approach, (John Wiley & Sons, Inc., New York), pp. 785-787.
Stumm, W. and Morgan, J.J., 1996. Aquatic Chemistry, (John Wiley & Sons, Inc., New
York), pp. 349- 608.
Stumm, W., 1992. Chemistry of the Solid-Water Interface, (John Wiley & Sons, Inc.,
New York), pp. 87-307.
Sverjinsky, D.A. and Molling, P.A., 1992. “A Linear Free Energy Relationship for
Crystalline Solids and Aqueous Ions”, Nature. Vol. 356, pp. 231-234.
Terakado, Y. and Masuda, A., 1989. “The Coprecipitation of Rare-earth Elements with
Calcite and Aragonite”, Chemical Geology. Vol. 69, pp. 103-110.
Tesoriero, A.J. and Pankow J.F., 1996. “Solid Solution Partitioning of Sr2+, Ba2+, and
Cd2+ to Calcite”, Geochimica et Cosmochimica Acta. Vol. 60, pp. 1053-1063.
Torstenfelt, B., Andersson, K., Allard, B., 1982. “Sorption of Strontium and Cesium on
Rocks and Minerals”, Chemical Geology. Vol. 36, pp. 123-137.

77
Wang, Y. and Xu, H., 2001. “Prediction of Trace Metal Partitioning Between Minerals
and Aqueous Solutions: A Linear Free Energy Correlation Approach”, Geochimica
et Cosmochimica Acta. Vol. 65, pp. 1529-1543.
WEB_1, 2007. The Metropolitan Emergency Response and Logistical Information
Network, 16/03/2006.
http://www.ndcrt.org/links/hazmat.html
WEB_2, 2007. The Mineral Calcite, 23/04/2007.
www.galleries.com/minerals/carbonat/calcite/calcite.htm
WEB_3, 2005. Calcite Structure, 14/12/2005.
www.uvgb.edu/DutchS/PETROLGY/Calcite%20Structure.htm
WEB_4, 2006. Crystal Structure Gallery, 09/03/2006
www.staff.aist.go.jp/nomura-k/english/itscgallary-e.htm
WEB_5, 2007. The Mineral Aragonite, 23/04/2007.
www.galleries.com/minerals/carbonat/calcite/aragonite.htm
WEB_6, 2007. Solid State Diffusion, 20/04/2007.
http://www.uio.no/studier/emner/matnat/kjemi/KJM5120/v05/undervisningsmaterial
e/KJM5120-Ch5-Diffusion.pdf
WEB_7, 2007. Atomic Absorption Spectroscopy, 22/02/2007.
www.cartage.org.lb/en/themes/sciences/chemistry/Analyticalchemistry/MethodsInst
rumentation/Spectroscopy/Atomicabsorption/Atomicabsorption.htm
WEB_8, 2007. Basic Overview of ICP-AES, 14/02/2007.
http://www.odp.tamu.edu/publications/tnotes/tn29/technot2.htm
WEB_9, 2007. Material Analytical Services, 15/02/2007.
http://www.mastest.com.htm

78
WEB_10, 2007. Centre of Diffraction Studies, 11/02/2007.
www.abdn.ac.uk/~che241/cdiff/index.htm
WEB_11, 2006. New Hampshire Materials Laboratory, Inc., 15/05/2006.
http://nhml.com/resources_NHML_Scanning-Electron-Microscopes.php
WEB_12, 2007. Keck Interdisciplinary Surface Science Center, 12/04/2007
www.nuance.northwestern.edu/keckii/ftir1.asp
Weijden, R.D., Weijden, C.H., Comans, R.N.J., 1994. “Sorption and Sorption
Reversibility of Cd on Calcite under Simulated Riverine, Estuarine and Marine
Conditions”, Marine Chemistry. Vol. 47, pp. 65-79.
Wersin, P., Charlet, L., Karthein, R., Stumm, W., 1989. “From Adsorption to
Precipitation: Sorption of Mn2+ on FeCO3(s)”, Geochimica Cosmochimica Acta.
Vol. 53, pp. 2787-2796.
Zachara, J.M., Kittrick, J.A., Harsh, J.B., 1988. “The Mechanism of Zn2+ Adsorption on
Calcite”, Geochimica et Cosmochimica Acta. Vol.52, pp. 2281-2291.
Zachara, J.M., Kittrick, J.A., Dake, L.S., Harsh, J.B., 1989. “Solubility and Surface
Spectroscopy of Zinc Precipitates on Calcite”, Geochimica et Cosmochimica Acta.
Vol. 53, pp. 9-19.
Zachara, J.M., Cowan, C.E., Resch, C. T., 1991. “Sorption of Divalent Metals on
Calcite”, Geochimica et Cosmochimica Acta. Vol. 55, pp. 1549-1562.
Zhu, C., 2002. “Estimation of Surface Precipitation Constants for Sorption of Divalent
Metals onto Hydrous Ferric Oxide and Calcite”, Chemical Geology. Vol. 188, pp.
23-32.
Top Related