


Languages
Pages
Legal


School of Management
Blekinge Institute of Technology
Key Success Factors in Internet
Advertising
- With emphasis on Online User Activity
and the Social Context
By
Symeon Papadopoulos
Under the supervision of
Prof. Klaus Solberg Søilen
Thesis for the Master’s degree in Business Administration
May 2009

Abstract
Internet advertising (also known as online advertising) is the delivery of advertising messages
and marketing communications through the Web. It has presented sustainable revenue growth
since its inception in the mid-1990s. Internet advertising takes a multitude of forms, ranging
from the “traditional” banners to today's rich media ads. Due to its wide success, internet
advertising currently constitutes a significant marketing channel for a large number of firms,
ranging from news agencies to car manufacturers and retailers, and it is thus gradually gaining
attention in the context of marketing communications strategy planning and implementation.
However, there has been relatively little empirical research and actionable knowledge on the
factors that affect the success of online advertising. Consequently, when relying on
insufficient knowledge to make decisions about their internet marketing strategy, companies
run the risk of missing marketing opportunities or damaging their image.
To this end, the work presented in the context of this thesis attempts to make a number
of contributions to the body of actionable knowledge pertaining to the planning of internet
advertising campaigns for a company. More specifically, this report aims at analyzing the
impact of the type of online user activity as well as of the user’s online social context on the
effectiveness of internet advertising. The objectives of the thesis are pursued through the
design and implementation of an online experiment that simulates four types of online
activities that are popular among today’s plethora of Web 2.0 applications. Such activities
range from “traditional” ones, for example online article reading, to recently adopted, for
instance photo tagging, social bookmarking and messaging. In addition to the role of online
activity type, the experiment plans to investigate the impact of a user’s social context, that is
the role of a user’s online social network on his/her receptiveness to internet advertising.
Starting from the study of the most influential research works in the area of internet
advertising effectiveness and following the principles of their experimental methodology, an
online experiment was designed and implemented that collected input from a set of 87 users.
The analysis of the obtained input reveals significant correlations between the type of online
activity of users and the effectiveness of internet advertising. Furthermore, there is evidence
that the content of a webpage and the degree of its congruency to the advertising content play
a significant role on the impact of online advertising.
Keywords: online advertising, online user activity, user cognitive mode, advertising
effectiveness, brand recall, priming study, social context

Acknowledgements
Upon completion of this work, which also marks the completion of the MBA program at the
Blekinge Institute of Technology, I would like to first thank the Institute and the Swedish
government for offering such a high-quality educational program for free to the public.
Further, I would like to thank the supervisor of this Thesis, Professor Klaus Solberg
Søilen who has supported and facilitated the planning and execution of the Thesis work.
A large part of this Thesis relied on the participation of a large number of users, whose
contribution to the findings of this study has been of primary significance. In order to
acknowledge their contribution, I provide a list of their names at Appendix B of this
document.
Additional thanks goes to a colleague of mine, Theodoros Semertzidis. Theodoros
provided valuable advice during the experiment planning phase regarding the development
and deployment of the experiment based on his own experience with the development of
similar online user studies.
Finally, I would like to acknowledge the supportive role of the Informatics and
Telematics Institute, where I work as a researcher.

Table of Contents
Abstract ................................................................................................................................. 2
Acknowledgements............................................................................................................... 3
Table of Contents.................................................................................................................. 4
Glossary / Acronyms ............................................................................................................ 5
1. Introduction ...................................................................................................................... 6
1.1 Context and Motivation................................................................................................ 6 1.2 Scope of Thesis Research ............................................................................................. 7 1.3 Outline of the Thesis..................................................................................................... 9
2. Literature Review and Problem Formulation ............................................................. 10
2.1 The Study of Internet Advertising Success ................................................................. 10 2.2 Problem Statement and Hypotheses Formulation...................................................... 14
3. Experimental Design ...................................................................................................... 19
3.1 Participants ................................................................................................................ 19 3.2 Online Content, Brands and Advertising Material .................................................... 19 3.3 Experiment Workflow................................................................................................. 20 3.4 Experiment Implementation ....................................................................................... 25 3.5 Learning points on designing and developing an online experiment......................... 26
4. Data Analysis and Research Findings .......................................................................... 28
4.1 Demographics of the Participants.............................................................................. 28 4.2 Evaluation of the Experiment ..................................................................................... 29 4.3 Research Hypothesis Testing ..................................................................................... 30 4.4 Additional Conclusions .............................................................................................. 35
5. Conclusions and Future Work ...................................................................................... 39
6. References ....................................................................................................................... 42
Appendix A: Experiment website screenshots................................................................. 45
Appendix B: Experiment participants ............................................................................. 53
Appendix C: List of Web Applications Referenced through the Thesis ....................... 55

Glossary / Acronyms
API Application Programming Interface
CTR Click-Through Rate
GWT Google Web Toolkit
IAB Internet Advertising Bureau
RIA Rich Internet Application

1. Introduction
This thesis aims at the study of the effectiveness of internet advertising under the perspective
of online user activity and online social context. At the outset, this Section provides some
background on the increasingly significant topic of internet advertising, as well as on a series
of related issues that have motivated this work. Subsequently, the scope of the presented
research work is delimited and the report structure is described in order to prepare the reader
for the core research discussion of the following sections, which comprises the related
research area, the particular problem formulation, as well as the adopted methodology for the
study of the posed research questions.
1.1 Context and Motivation
Internet advertising, that is the delivery of advertising messages and marketing
communications through websites, has presented sustainable revenue growth since its
inception in the mid-1990s (Hollis, 2005). Internet advertising takes a multitude of forms,
ranging from Search advertising to Banner and Rich Media Ads (i.e. ads that incorporate
sound, animation and interactive elements). According to the latest annual report issued by the
Internet Advertising Bureau (IAB) and conducted by PricewaterhouseCoopers (Internet
Advertising Bureau, 2009), online ad sellers have reported aggregate revenues totaling $23.5
billion for 2008 compared to $21.2 billion for 2007. In addition, since the third quarter of
2002, revenues have increased 22 out of the past 25 consecutive quarters, which reveals a
clear upward trend and increasing significance for the field. The increasing trend of ad
revenues is clearly illustrated in the revenue diagram of Figure 1, which has been copied from
(IAB, 2009).
Figure 1: Annual advertising revenue from 1997 through 2008 [taken from (IAB, 2009)]
The prevalent means of internet advertising are Search and Display Related
Advertising, which together are responsible for more than 70% of the total ad revenues (IAB,
2009). Search Advertising involves two basic methods, namely paid listings, where text links
appear at the top or side of search results for specific keywords and contextual search where
text links appear beside an article based on the context of the content. Throughout the thesis,
we will refer to such text-based ads as sponsored link ads. An example of a sponsored link ad
is presented in Figure 2.
Figure 2: Sample advertisement of type sponsored link
Alternative formats of online advertisements range from the well known banners, to
advertisements that incorporate animation and sound and even to digital video commercials.
Regardless of the particular ad format, displaying advertising content to online users is driven
by two major objectives: (a) build new or reinforce existing brands, and (b) stimulate
purchases. For that reason, the success (or effectiveness) of internet advertising has been
traditionally measured by means of the number of clicks attracted by the ads (direct or
behavioral response), commonly operationalized by means of the well-known Click-Through
Rate (CTR), which is defined as the ratio of the number of clicks over the number of
impressions. In addition, many advertising experts argue that the mere exposure of online
users to the advertising message can be beneficial in terms of building brand awareness
(Flores, 2000) and increasing purchase intentions, which is termed as attitudinal ad response
(Hollis, 2005). To measure ad success in these terms, it is necessary to set up controlled
experiments and measure the brand attitude, recall or purchase intention rates that can be
achieved for particular brands by test subjects. The Thesis adopts the latter method (attitudinal
response) to quantify ad effectiveness.
1.2 Scope of Thesis Research
The Thesis investigates the role of two factors on the effectiveness of online
advertising, namely (a) online activity type, for instance article reading, picture tagging, social
bookmarking and message exchanging, and (b) social context, that is the perceptual influence
that the friends of a user as well as their online behavior have on his/her attention and
processing of advertising content within a Web setting.

The decision to delve into the role of these two factors on the impact of online
advertising was mainly driven by the widespread success of highly interactive web
applications which incorporate social features, commonly known as Web 2.0 applications.
Internet users spend increasing amounts of time and attention to the content and features of
such applications (Gangadharbatla, 2008). Therefore, it is expected that such applications will
constitute one of the main online marketing channels in the coming years. A list of such
applications together with their websites is provided in Appendix C.
1.2.1 Online activity type
Online activities can be classified to types based on the nature of the task they involve.
In the early days of the Web, the sole online activity that could be performed in the context of
the browser was web page browsing, that is seeking and consuming information. The advent
of Rich Internet Application (RIA) technologies, such as AJAX and Silverlight, has resulted
in a multitude of new activities that can be performed online. Typical examples of such
activities are picture browsing, article reading and rating, video watching, reading and writing
emails, etc. It is natural to assume (based also on previous related studies) that the
receptiveness of users to advertising messages will vary greatly depending on the type of
online activity in which the user is involved. Thus, part of the thesis work was devoted to the
investigation of whether the effectiveness of internet advertising depends on the type of online
activity that a user is engaged in while being exposed to the advertising message.
1.2.2 Social context
In this thesis, the social context of users is considered with reference to some Web
application that incorporates social networking features. Within such applications, which are
frequently denoted by the term Social Web applications, users form and maintain online
friendships and carry out a host of social activities online. In this setting, the social context of
a user pertains to the set of influential forces that act on him/her as a result of his/her friends’
behavior and actions.
A common feature of Social Web applications, such as Facebook, is their attempt to
create viral phenomena by means of making their users aware of what their online friends are
doing (e.g. what they read, what they like, etc.). For that reason, part of the thesis work will
address the question of whether such kinds of mechanisms can be used to improve the
effectiveness of internet advertising. Also, the Thesis looked into the question of whether a
message exchange application (i.e. a social web application) can affect the receptiveness of
internet users to online advertising.

Although substantial research has been devoted to the study of internet advertising
effectiveness as a result of different factors present in the online environment during the
reception of the ad message (Burns and Lutz, 2006; Dahlén, 2002; Danaher and Mullarkey,
2003; Lohtia et al., 2003), no previous work could be identified that focused on the impact of
the aforementioned two factors on the effectiveness of online advertising. Taking into account
that a multitude of digital activities (e.g. applications) are now available through the Web and
that many of those activities involve social networking features, one can imagine that internet
advertising planners should be informed of how these novel Web aspects affect the success of
online advertising.
The Thesis objectives were pursued through the design and implementation of an
online experiment that simulates some of the online activities that are popular among users of
well-established Web 2.0 applications, such as Facebook, Flickr, Digg and Delicious. A set of
predefined sponsored link ads (advertising fictitious brands) were displayed to the users
during their engagement in these activities and their attitudinal response to these ads was
measured after completion of the experiment.
1.3 Outline of the Thesis
After introducing the context and motivation of the Thesis, as well as its scope, this
report continues in Section 2 with a presentation of the most prevalent research works on the
topic of online advertising effectiveness. The present work is positioned in relation to these
works and the specific research hypotheses are formulated. Subsequently, Section 3 details
the experimental design that was devised for the primary collection of user data. Sections 4
presents the analysis of the collected user input and summarizes the main findings of the
study. Finally, Section 5 concludes the Thesis. Following the Conclusions, a list of
References and three Appendices are provided: the first Appendix presents a series of
snapshots from the experiment website, the second Appendix contains a list of the experiment
participants and the third provides a list of popular Web 2.0 applications that have been
referenced throughout the document.

2. Literature Review and Problem Formulation
This section presents a summary of the main research findings that have been identified in the
literature with respect to the factors that affect the effectiveness of internet advertising.
During this discussion, the thesis scope is related to the one of existing works and the points
that differentiate the thesis research from them are highlighted. The section concludes by
framing the research problem of interest in terms of a set of concrete and testable hypotheses.
2.1 The Study of Internet Advertising Success
Modern literature on internet advertising abounds with theoretical constructs as well as
empirical works that investigate the role of a series of factors in the success of internet
advertising campaigns. Before proceeding with the discussion of what factors are considered
significant in this context, it is necessary to present the most significant measures employed in
these works to quantify advertising effectiveness.
2.1.1 Quantification of advertising effectiveness
The typical research paradigm adopted when attempting to investigate the
effectiveness of some advertising scheme involves a forced exposure to some advertising
message followed by some measure of consumer response (Pavlou and Steward, 2000). The
assumption behind this paradigm, according to Pavlou and Steward (2000), is that advertising
has a direct effect to consumers and therefore advertising is considered as the independent
variable, while consumer response to advertising is the dependent variable. The authors state
that such an assumption is not sufficient in the context of today’s highly interactive
environments and, that additional factors, such as the online context where advertising takes
place, should be taken into account in order to render the studies of advertising effectiveness
more insightful. To this end, the Thesis hypotheses incorporate several aspects of the online
context such as the type of online activity and the user’s social context in the study of the user
response to online advertising.
Since the inception of internet advertising, a series of operational measures were
employed to quantify the effectiveness of advertising campaigns. Common operational
measures range from the simplistic number of impressions or exposures (number of times an
ad was displayed to users) to the widely established Click-Through Rate (CTR, ratio of the
number of click-throughs to the number of impressions). CTR has been considered as the
predominant way to measure the performance of online ads. However, there has been a steady
decline in the reported CTR levels through the last years; the declined CTR figures (reported

to be below 0.5%) have been mainly attributed to the fact that online users avoid looking at
the ad items during browsing (Drèze and Hussherr, 2003).
A more sophisticated measure of online ad effectiveness is the number of post-
impressions that is the number of visits to a website, after exposure to an internet
advertisement, without clicking through the advertisement (Rettie et al., 2004). This measure
captures both the direct performance of the ad message and the subliminal effects that this
message may have on the online user. However, post-impressions are hard to track and miss
some aspects of advertising effectiveness, for example the attitudes of users towards the
advertised brand.
For the aforementioned reasons (viz. declining CTR and difficulty in tracking post-
impressions), traditional memory-based measures of advertising effectiveness have been
revived in the context of internet advertising. Such measures reflect the attitudinal response of
online users to the ads displayed to them. Unaided and aided recall, brand recognition (Drèze
and Hussherr, 2003), purchase intention, as well as purchase consideration sets (Yoo, 2008)
are suitable measures for quantifying the effect of online ads to the user, assuming that some
unconscious ad processing takes place during the pre-attentive webpage viewing (Shapiro et
al., 1997). Yoo (2008) differentiates between explicit and implicit memory and notes the
different measures that are suitable to quantify the effects of web advertising on them1: recall
and recognition tests measure the extent to which web advertising affects the explicit memory
of consumers, while priming studies quantify the implicit memory effects of advertising.
Priming studies constitute a significant class of ad effectiveness measurements
(Grimes and Kitchen, 2007). Priming refers to the exposure of a person to some prior event /
stimulus, the prime, that results in increased accessibility of information related to this
stimulus (Mandel and Johnson, 2002). Three types of priming are considered by Grimes and
Kitchen (2007): (a) feature priming, which tests the accessibility and readiness of the priming
information, for example by means of word-completion tests, (b) semantic priming, which
investigates the possibility for semantic changes in implicit memory through the measurement
of reaction times to stimuli following semantically related primes and (c) categorical priming,
which looks into implicit associations between categories, for instance implicit attitudes to
brands.
1 The author states that explicit memory is affected as a result of directed attention to ads, while implicit memory traces are formed independently in reduced attention mode. The Thesis adopts a different stance by considering that the implicit and explicit memory formation processes take place simultaneously during an online activity.

The experiment conducted in the context of the Thesis focused on two measures of
advertising effectiveness: (a) aided brand recall, to provide evidence on the extent of
conscious ad processing which takes place by online users, and (b) categorical priming,
implemented as a brand-product category association test, in order to quantify the implicit
memory effects of online advertising.
2.1.2 Factors affecting the effectiveness of internet advertising
Rodgers and Thorson (2000) introduced a model comprising a series of factors with an
influence on the processing of internet advertising by the consumer. Fundamentally, they
distinguish between functional and structural elements in their advertising model. Functional
elements pertain to the motives of online users and their behavior within the online setting,
i.e. they revolve around the user (who also happens to be the advertising target) of the online
application within which advertising takes place. On the other hand, structural elements of
advertising concern the physical presentation and format of the ads, for example their position
on the screen, size, type (banner, sponsor link, pop-up), and so forth.
The effect of page viewing duration was established as a major factor affecting brand
recall in the study described in (Danaher and Mullarkey, 2003); more specifically, the longer
a user was viewing a page, the more likely the user would remember the advertising material
on this page. In the same study, the influence of additional factors, such as background
complexity, was found to be insignificant, while the user viewing mode (goal-directed vs.
exploratory) appeared to affect ad recall, i.e. people in goal-directed mode were less likely to
remember the advertising material they had been exposed to. Related findings were gathered
by the study of Dahlén (2002), where the product type (functional vs. expressive) and number
of exposures were found to significantly affect user response as measured in terms of CTR. In
our study, we implicitly consider the user viewing mode through the investigation of the role
of user online activity on advertising effectiveness. The role of product type and number of
exposures is out of the scope of this thesis.
The impact of banner ad design elements (color, animation) and the provision of
incentives through the advertising message on the achieved CTR were investigated in the
work of (Lohtia et al., 2003). The study differentiated between Business-to-Consumer (B2C)
and Business-to-Business (B2B) advertisements. It was found that incentives and interactivity
have a negative impact on CTR. The presence of emotions was found to have a positive
influence on the CTR of B2C ads and a negative one for B2B banner advertisements. Medium

level of color resulted in the optimal CTR performance. In general, B2B presented a higher
CTR than B2C advertisements. Another study provided evidence on the effect of the type of
advertising material (inline, pop-up, pop-under) on user perceptions regarding the
attractiveness of the web pages (McCoy et al., 2007). Users appeared significantly more
frustrated by the intrusiveness of pop-up and pop-under type ads in comparison to the inline
ads. Also, they exhibited higher brand recall levels when the ad material was congruent with
the website content. Another study focused on the format of online advertising revealed
different user attitudes towards ad formats, e.g. users perceived pop-ups as more annoying
and skyscraper ads as more informative (Burns and Lutz, 2006). Compared to the
aforementioned works, our study attempts to mitigate the effect of design elements and ad
format in the online environment of the user by using text-based advertisements and neutral
design elements.
Regarding the role of social context on advertising effectiveness, most prior work has
concentrated on the topic of word-of-mouth / viral marketing effects. For instance, an online
recommendation network is studied in (Leskovec et al., 2007) and the observation was made
that online recommendations are not as effective as would be expected by epidemic or
innovation diffusion models. In contrast, Richardson and Domingos (2002) find that viral
marketing can lead to considerable profit increase over direct marketing when the social ties
between individuals of a knowledge sharing network are taken into account to devise the
marketing plan. Such studies study social context under a different perspective compared to
this thesis, since they do not focus on the “conventional” online advertising mechanism
(implemented through sponsored link ads), but investigate the viral processes taking place on
online social networks.
A recent study has dealt with the impact that a user’s social network may have on
his/her response to internet advertising. More specifically, the work in (Bagherjeiran and
Parekh, 2008) provides evidence to support the claim that social links are correlated with ad
response rates (measured by means of CTR) and whether they can be used as predictors of
these rates. Compared to this, the experimental study conducted within this thesis attempts to
uncover associations between social context and implicit ad response.

2.2 Problem Statement and Hypotheses Formulation
People resort to online activities to satisfy several of their needs or to pursue some of
their goals. Since RIA technologies enable rich functionality to be delivered over the Web,
today’s internet users engage in online activities of a varied nature, for instance information
seeking (through a search engine), entertainment (by watching video clips or playing online
games), keeping up-to-date (by reading news), communicating with each other (through some
online social network), and so forth. Lately, a series of activities have also become popular
that involve intensified user participation and interaction, for example creating and uploading
their own content (pictures, articles) or rating and commenting on online content uploaded by
others; such activities are often framed by use of the term Web 2.0, which additionally entails
connotations to the social aspects of web usage, that is the online social context of internet
users.
Since previous research on the topic of advertising effectiveness has revealed
connections between user related, as well as online-environment residing factors and the
effectiveness of online advertising, one could hypothesize that a connection exists between
the type of online user activity and the effectiveness of the advertisements that are displayed
during this activity. Such a hypothesis is particularly pertinent to the business model of a host
of popular Web 2.0 applications, such as Flickr, Digg and Delicious, which attract millions of
users on a daily basis.
At the moment, the following activities are considered for investigation:
1. Article reading and rating: Article reading has been a common online activity since
the first years of the Web. In the recent years, this activity has been enriched by rating
and commenting features, that is the reader is endowed with the capability to express
his/her opinion on the article and rate it according to some given scale.
2. Picture browsing and tagging: Once broadband internet became commonplace, online
users were increasingly attracted to photo sharing and organizing web applications,
such as Flickr. These applications enable their users to upload their own pictures and
organize them by attaching tags (keywords) to them. Most of the times, users share
their pictures with the rest of the online community or at least with their online
friends.

3. Social bookmarking: This activity involves the collaborative collection of interesting
hyperlinks and their access through a common application. When users discover some
interesting webpage, they can submit this hyperlink to a social bookmarking service so
that they can refer to it at a later time. Other users can give the thumbs up or thumbs
down to such links, thus leading to an online barometer of website popularity. Two
popular examples of social bookmarking sites are Delicious and Digg.
4. Message exchanges between online friends: Traditionally users have resorted to
instant messaging applications, such as ICQ and MSN Messenger for exchanging
messages between each other. Lately, a popular way of conducting this activity is by
means of social networking applications such as Facebook, where a user can either
send private messages to his/her friends or even post a message to their “wall”, so that
they are visible by the rest of his/her friends.
A primary hypothesis that the thesis will investigate was stimulated by previous
research on the effect of the user mode (goal-directed versus exploratory) on attitudinal
response to ads (Danaher and Mullarkey, 2003). We hypothesize that article reading and
rating as well as social bookmarking involve more reasoning and mental skills than picture
browsing and message exchanges between friends. Therefore, our first set of hypotheses
concern this distinction.
H1a. Users engaged in article reading and rating will present lower ad recall
rates than users engaged in picture browsing and tagging assuming that
during both activities the ad stimuli remain the same (in terms of both
content and position on the screen).
H1b. Users engaged in article reading and rating will present lower ad recall
rates than users engaged in message exchanges with their friends under the
same assumption as in H1a.
H1c. Users engaged in social bookmarking will present higher ad recall rates
than users engaged in picture browsing and tagging under the same
assumption as in H1a.
H1d. Users engaged in social bookmarking will present higher ad recall rates
than users engaged in message exchanges with their friends under the same
assumption as in H1a.

An additional hypothesis that the thesis will test was driven by previous research regarding
the unconscious processing of ad exposures (Drèze and Hussherr, 2003;Yoo, 2008). Among
the online activities described above, one can distinguish picture browsing as different from
the rest, since picture browsing stimulates visual analysis processes in the brain of the subject.
Consequently, the effect of peripheral website elements (such as ads) will be different in the
case of picture browsing than in all other activities.
H2. Users engaged in picture browsing and tagging will present different
priming response than users engaged in article reading and rating, social
bookmarking and message exchanges with their friends under the same
assumption as in H1a.
An additional aspect of unconscious ad processing that the Thesis will investigate is whether
congruence between the main page and the ad content affects the priming response of users to
the advertising message. Previous studies conducted on traditional media (TV and print news)
have suggested that under certain conditions the appreciation and congruence of ad context
can affect ad content and brand recall (De Pelsmacker et al., 2002). Previous studies have
demonstrated that affective response towards a target object (viz. brand) could be affected by
mere exposure to a target-related stimulus, that is preferences are partly formed without
conscious processing of stimuli (Zajonc, 1980). For that reason, we expect that even when
online advertising is not consciously attended by a user, its effectiveness will depend on its
congruence with the context (webpage) where it appears. For instance, users exposed to an
advertisement about an mp3 player when they read an online laptop review are expected to
develop more favorable attitudes to the mp3 player compared to the case that they were
exposed to the same ad during reading an article of a completely different topic (e.g. soccer).
H3. Users exposed to advertising during an online activity will present
increased priming responses when the advertising is congruent with the
activity content than in the opposite case.
The next hypotheses of this study have been driven by the work of Ramanathan and McGill
(2007), which indicates that at the presence of others, consumers are likely to be affected
when evaluating products, that is there is an element of mimicry and contagion in product
consumption. Stimulated by this observation, we expect that the awareness of a friend's online
activity (i.e. a kind of online presence) will affect the receptiveness of individuals to the
advertising message.

Assume that you are reading a review article about a new car and at the top of the
article you read the message “Your friend George has also read this article and found it
useful.” Then, your response to the advertising material beside the article may be different
compared to the case that you would receive no such message by your friend. This hypothesis
is based on the assumption that the knowledge of endorsement by a trusted person about a
piece of information (article) lends credibility to both this piece of information and its
surroundings (advertisement). More specifically, the testable hypothesis is formulated as
follows:
H4. If a user is made aware of the fact that one of his/her online friends
performed the same online activity (e.g. read the same article) as the one
he/she is currently involved, he/she is more likely to develop a positive
attitude towards the advertising material accompanying the current online
activity compared to the case that he/she would perform this activity in
isolation.
Further, imagine a web application offering the functionality of personal message
exchanges. If an advertising message is displayed in proximity with the last message left by a
friend, then the impression of the user towards the advertised object will improve. More
specifically:
H5. If the advertising message is placed close to the name of a user's online
friend from whom the user is receiving some notification, the user will
present increased purchasing intention towards the advertised object than in
the case where the message would be placed in its typical placeholder
(Figure 3).
Although this hypothesis may seem obvious, it could actually lead to the reverse conclusion;
that is the impression of the user of the particular object deteriorates. This could be the result
of the advertising message being perceived as an obstruction between the user and his/her
online friend (or even worse as a conscious recognition by the user that an attempt is made by
the advertiser to exploit his/her friendship).

Figure 3: Exemplary alternative positioning taking into account the social nature of web users.

3. Experimental Design
The hypotheses of the proposed research were tested through a controlled online experiment.
The experiment involved the simulation of a set of online user activities (searching, reading
articles, browsing and tagging pictures, browsing products, writing messages). During these
activities the users were exposed to a set of predefined advertising messages and at the end
their response to these messages was measured. This Section details the design of the
experiment and relates it to the research objectives of the Thesis.
3.1 Participants
After contacting a convenience set of potential participants from the professional and
social network of the author, 106 people expressed interest in participating in the experiment.
Together with expressing their interest in the experiment, the prospective participants were
asked to send a short list of keywords that describe their topics of interest. This was necessary
in order to collect online content that would be sufficiently stimulating for the users to get
involved in the experiment, thus avoid the situation that some user hurries through the
experiment tasks without paying attention to it. Since many of the participants were Greek
and some of them were not particularly fluent in English, the experiment instructions and
content (including ad messages) were available in both English and Greek. An additional note
regarding the participants is that several of them are acquainted or friends with each other,
which enabled the testing of hypotheses H4 and H5. A demographic analysis of the experiment
users is presented in the following section.
3.2 Online Content, Brands and Advertising Material
The online activities were based on content that was manually selected based on the
interests expressed by the participants during the invitation phase. In order to reduce the effort
required for the subsequent content collection step, the collected keywords were clustered in
the nine topic groups of Table 1. For each of those categories, online articles were selected
from the popular sections of Digg (English) and Digme, Pineza (Greek) as well as online
news articles; photos were downloaded from Flickr by use of the public Flickr API. In that
way, each user was assigned (based on the keywords he/she provided) to one or more of these
nine clusters. This enabled the personalization of the experiment content in some of the tasks
(viz. article reading, picture browsing) with the goal to render the experiment participation
more stimulating for the users.

Topic Keywords
arts architecture, literature, reading, art, theatre, painting, research on social interaction in the cityscape, photography, theater, arts, handcraft, Decoration, Art, urbanization, creativity, Photography & Digital Imaging, Literature Reading, cob houses, straw bale houses, earth houses, books
music music, dancing, rock music, dance, heavy metal music, Hip-Hop (Dancing), Jazz, Salsa, pop, rock, disco, dj-ing
cars cars, car, automobile, austin metro, corvette
travel travels, travel, traveling, camping, travelling, sailing, tourism, wandering-strolling, Travel, people, cheap flights, cultures
movies tv, cinema, tv-series, movies, Bollywood
computers internet, gadgets, computers, high technology, mobiles, software, technology, web technologies, PC, Computer science, programming, web data mining, video games, torrent, Warcraft, abandonware, electronics, apple
sports sport, football, sports, basketball, tennis, skiing, gymnastics, Water sports, swimming, athletics, trekking, ski, boxing
science Science fiction, science, math, extraterrestrial
general environment, food, nature, textile, puzzles, politics, news, sociology, health, psychology, foreign policy, animals, children, Judo, Aikido, economic crisis, unemployment, globalization, chess, finance, history, Japanese, roulette, paranormal, cooking, Anthropology, Horses, management, politics, marketing, production machinery, g700, zeitgeist, weapons, fashion, industrial design
Table 1: The nine topic clusters that were derived from the participants’ keywords and which were used to collect digital content (articles and pictures) from the Web
Four brand sets were considered: (a) laptops, (b) movie review sites, (c) hotels, and (d)
sunglasses. The hypotheses of paragraph 2.2 were tested by use of representatives from all
four brand sets to check whether the derived conclusions-observations can be generalized or
they are product specific. Each of the brand sets, listed in Table 2, contained three fictitious
brands. The advertising text was identical for each ad of the same brand set (the templates
used to create it are also presented in the table).
Laptops Movie reviews Hotels Sunglasses
AEGIS
TAMA
SOLUBO
BUZZM
SPLASH
M-POINT
AZZUR
INDIGO
AMETHYST
MELIBLU
JOLLIE
MONTY
X: Your new laptop!
Tap into the power of X!
Core Duo 2.8MHz, 4G RAM, 400HDD, EUR 1,600.
www.X-laptops.com
X: Read the latest movie reviews!
Independent movie reviews for latest Hollywood and European movies!
www.X-movie-reviews.com
Hotel X: Stay in comfort!
Visit our new hotel. Lux rooms, modest prices. Book now!
www.hotel-X.com
X sunglasses!
Ultimate protection for your eyes.
Summer collection.
www.X-sunglasses.com
Table 2: The four brand sets considered. The brands of a given brand set are advertised using the same advertising text. In order to derive the three different ad instances for each brand set, just
replace placeholder X with each brand’s name.
3.3 Experiment Workflow
The experiment comprised four major steps: (a) user registration and sign-in, (b)
online activities involving forced exposure to advertising, (c) decoy activities and a (d) test /
response measurement phase. Instructions were available throughout the whole experiment

that guided the user to the required actions. Snapshots of the experiment screens displayed to
the users are presented in the figures of Appendix A.
3.3.1 Registration and sign-in
Once the online experimental setup was prepared and beta tested, a mail was sent to all
enlisted candidates in order to request their participation to the experiment. The mail linked to
the experiment registration webpage (Figure 4 / Figure A.1), where the users were informed
that they would take part in “an online experiment that investigates the dynamics of website
usage”. In that way, the real research objective of the experiment would remain unknown to
them; thus, users would not be biased or predisposed to attending the advertising messages
that would be displayed to them. In the registration screen, the users were also informed that
some of their online actions would be tracked during the experiment. After filling-in some
necessary information (name, email, gender, age, country), the users were prompted to sign
in. Once signed in, each user was prompted with the list of participants and was asked to tick
only those that he/she considered as acquaintances or friends (Figure A.2). In that way, it was
possible to have a list of friends per user, which would enable the testing of Hypotheses 4 and
5 as specified in Section 2.2.
Figure 4: Registration screen of the experiment website

3.3.2 Online activities
After successfully completing the registration and sign-in process, each user went
through the core part of the experiment comprising a set of tasks based on the four different
types of online activity that were described in Section 2.2. The order that the activities were
presented to users was different per user in order to remove potential bias stemming from a
predefined activity ordering. For instance, the third user was requested to first read and rate
and article (Figure A.3), then tag a set of photos (Figure A.4), subsequently to comment on
socially bookmarked sites (Figure A.5) and finally to send messages to friends (Figure A.6),
while the fourth user performed these tasks in reverse order. The order of tasks was specified
at random when the user logged in the system. It was during these online activities that the
users were exposed to the predefined sets of ads that were described above. Note that some
users did not have any online friends within the participants group. For those users, the
message exchange activity was skipped.
In order to test the hypotheses of Section 2.2, a predefined ad scheduling scheme was
devised. This is specified in Table 3. To facilitate the discussion, we use the following
notation:
� �he four online activities are denoted as Ai (article reading and rating), Pi (picture
browsing and tagging), Si (social bookmarking), and Mj (message exchanges), where i
= 1, ..., 4 (since for each activity, each user will be asked to perform four tasks) and j
depends on the number of friends that the user has among the experiment participants.
� In some cases, we split the set of all participants U into two (almost) equally-sized
sets, which we denote as U1, U2. In some cases, we obtain reduced sets of users (e.g.
when a user has no friends among the participants, he/she does not go through the M
tasks). The reduced sets are denoted as U1�, U2�.
� The ads displayed to the users of the experiment are denoted by the names of the
brands that they advertise.
� In activities A3, A4 and P3, P4, the symbols C, NC are used to denote Congruence and
Non-Congruence of the content with the advertising message. For instance, in
activities A3, A4 (which are scheduled as C for the users of U1) half of the users are
given two articles related to movies, while at the same time they are exposed to an ad
about a movie review site (M-POINT). The rest of the users are exposed to the same
ad, but they are given two articles that have no association with movies (NC).
� In activities S3, S4, the symbols F and N are used to denote Friend recommendation
and Normal mode respectively. In the Friend recommendation mode, the user receives
a notification that the websites that he/she currently sees have been recommended by a
friend of his/hers, while in the Normal mode the user does not receive such a message.
� In activities M3, M4, the symbols S and N are used to denote Socially-aware and
Normal ad placement respectively. These two ways of ad placement were illustrated in
Figure 3.
task # A P S M
1 AEGIS BUZZM TAMA INDIGO AZZUR MELIBLU SPLASH JOLLIE
2 AEGIS BUZZM TAMA INDIGO AZZUR MELIBLU SPLASH JOLLIE
M-POINT MONTY SOLUBO AMETHYST 3
C NC C NC F N N S
M-POINT MONTY SOLUBO AMETHYST 4
C NC C NC F N N S
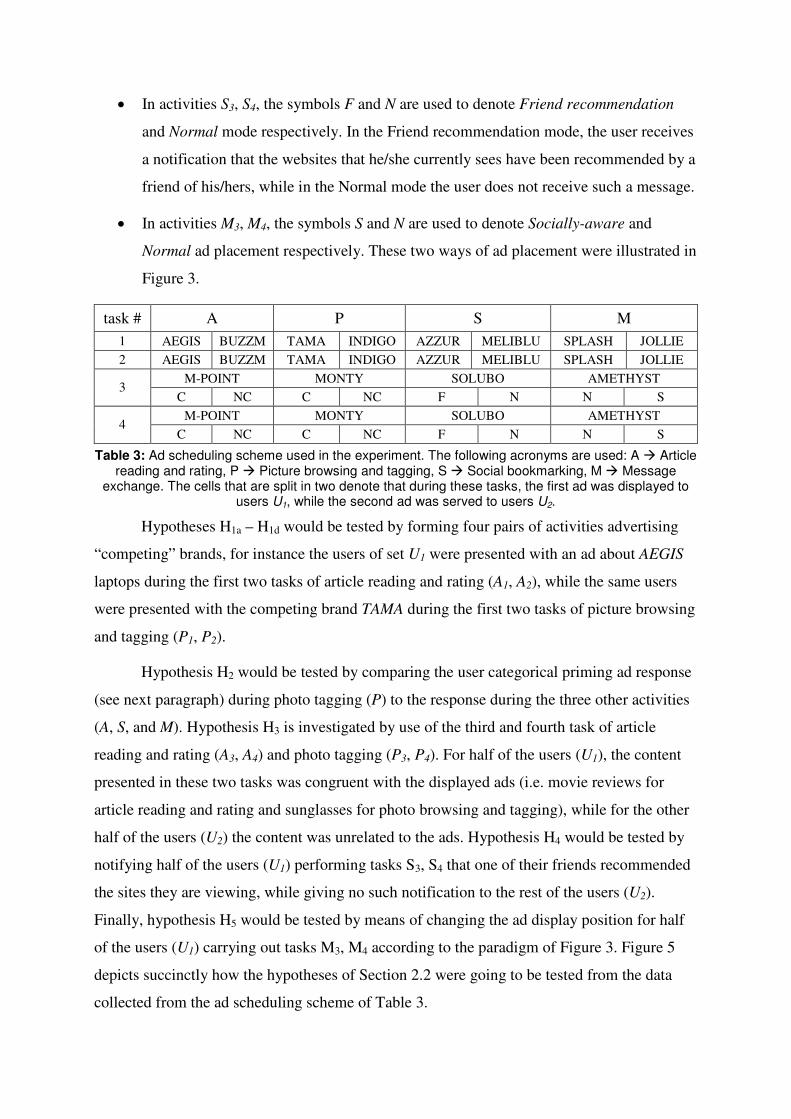
Table 3: Ad scheduling scheme used in the experiment. The following acronyms are used: A � Article reading and rating, P � Picture browsing and tagging, S � Social bookmarking, M � Message
exchange. The cells that are split in two denote that during these tasks, the first ad was displayed to users U1, while the second ad was served to users U2.
Hypotheses H1a – H1d would be tested by forming four pairs of activities advertising
“competing” brands, for instance the users of set U1 were presented with an ad about AEGIS
laptops during the first two tasks of article reading and rating (A1, A2), while the same users
were presented with the competing brand TAMA during the first two tasks of picture browsing
and tagging (P1, P2).
Hypothesis H2 would be tested by comparing the user categorical priming ad response
(see next paragraph) during photo tagging (P) to the response during the three other activities
(A, S, and M). Hypothesis H3 is investigated by use of the third and fourth task of article
reading and rating (A3, A4) and photo tagging (P3, P4). For half of the users (U1), the content
presented in these two tasks was congruent with the displayed ads (i.e. movie reviews for
article reading and rating and sunglasses for photo browsing and tagging), while for the other
half of the users (U2) the content was unrelated to the ads. Hypothesis H4 would be tested by
notifying half of the users (U1) performing tasks S3, S4 that one of their friends recommended
the sites they are viewing, while giving no such notification to the rest of the users (U2).
Finally, hypothesis H5 would be tested by means of changing the ad display position for half
of the users (U1) carrying out tasks M3, M4 according to the paradigm of Figure 3. Figure 5
depicts succinctly how the hypotheses of Section 2.2 were going to be tested from the data
collected from the ad scheduling scheme of Table 3.

Figure 5: Association between tasks-ad scheduling and the formulated hypotheses
3.3.3 Decoy
After completing the online activities of interest, several decoy activities in the form of
a quiz were presented to the users (Figures 7(I-IV)). These required some mental skill in an
attempt to distract the short-term user memory from the advertising content that he/she was
previously exposed to. More specifically, the first two decoy tasks (Figure 7(I)) involved the
recall of the correct version of two company logos (BMW and Google), the third (Figure
7(II)) and fourth (Figure 7(III)) were two logical puzzles and the fifth task involved a quiz
question about movies (Figure 7(IV)).
3.3.4 Test/Evaluation phase
This is the phase where the attitudinal user response to advertising was measured.
Each user was given two sets of questions:
� Aided recall questions (Figure 8(I)): For each brand that was displayed to the user, the
user is asked whether he/she recalls seeing this brand during the experiment (with
three possible answers Yes / No / Not sure).
� Categorical priming questions (Figure 8(II)): The user is asked to associate each brand
displayed during the test with its category. Apart from the four categories (laptop,
movie reviews, hotels, sunglasses), there is also an option “Other” in order to render
the task more challenging.
Care was taken to make sure that the selected brand names do not reveal the actual product
(e.g. we did not use “Eye Protector” as a brand name for sunglasses).
After the response measurement phase, two additional sets of questions were presented
to users. The first set of questions (Figure A.9) aimed at collecting additional demographics

and information about the users in order to check whether there is correlation between some
of these variables and the user response. The second question set (Figure A.10) concerned
their perception of the test, i.e. whether they found it interesting or boring and whether they
understood its real objective. Before the end of the experiment, the users were also asked
whether they would like to receive an electronic copy of this Thesis (Figure A.11).
3.4 Experiment Implementation
The experimental website was developed by use of the Google Web Toolkit2 (GWT).
The particular framework was selected for the following reasons:
� Java-based: GWT-based websites are written in Java, which enables a host of rich
interactivity functionalities to be quickly prototyped by means of asynchronous calls
to the server.
� State management at the client side: GWT promotes the paradigm of maintaining and
controlling user state on the client. This is particularly pertinent to the deployment of a
multi-user study, in order to relieve the server from the complexity and overhead of
user state management.
� Browser-independence: Although the development of the website is written once,
GWT takes care of translating the source code so that the rendering of the website is
identical (or at least very similar) across all major browsers (Explorer, Firefox, Safari,
Opera). After the experiment launch, some minor rendering problems were reported
by users of the latest version of Safari (4 Beta).
� Rich support for interactive testing: GWT offers extensive support for interactive
testing of the site during the development process. In that way, multiple debugging
and testing cycles can take place at relatively short time.
Before the experiment development, an additional implementation option was considered: to
launch the experiment in the form of a Facebook application, which was expected to bring
significant participation to the study. However, this option was rejected after discussions with
a colleague who had implemented such an application and reported significant development
issues and constraints.
2 http://code.google.com/webtoolkit/

3.5 Learning points on designing and developing an online experiment
Since the beginning of the thesis work, significant attention was paid to the issue of
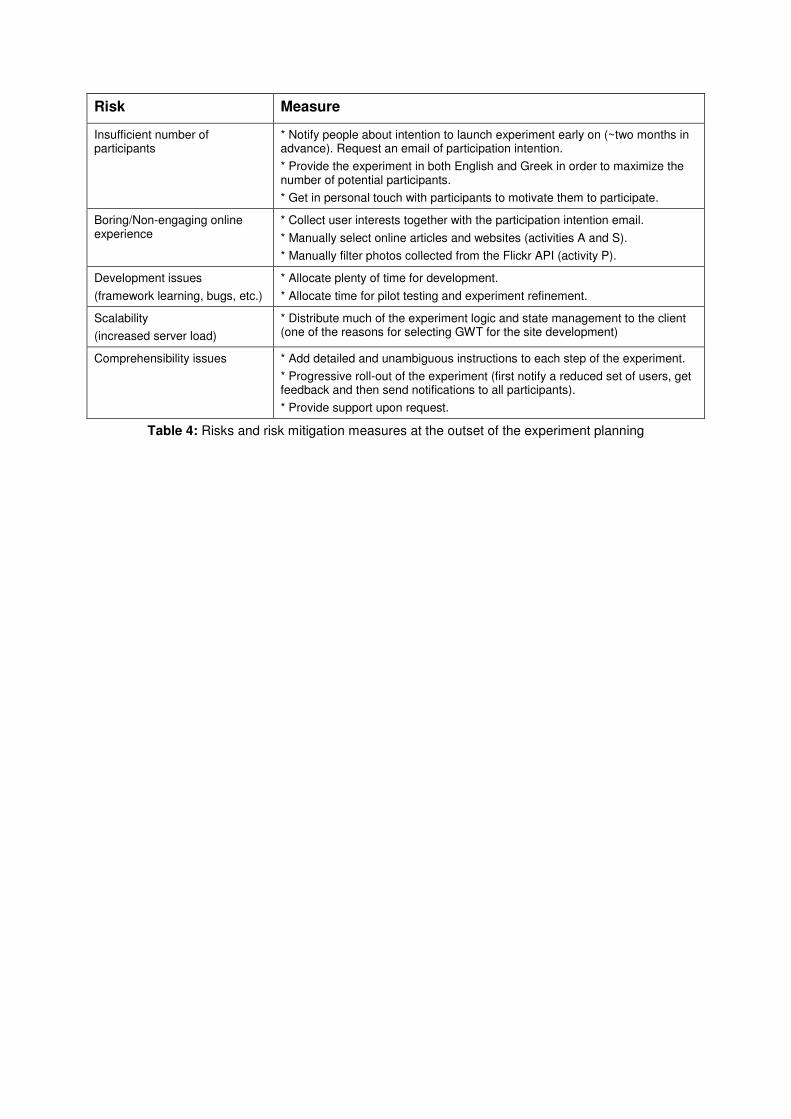
risk management for the development and deployment of the online experiment. Table 4
presents the risks that were identified at the outset of the experiment planning together with
the measures that were employed to mitigate them. Although additional effort was needed to
devise and execute this risk management strategy, it appeared that the risk mitigation
measures were necessary (and sometimes even insufficient) in order to ensure smooth
execution for the experiment.
In particular, after going through the whole process of designing, developing and
executing the thesis online experiment, a series of learning points have been identified which
may be used as recommendations for prospective designers of similar user studies /
experiments:
� Strive for increased user participation. The more users one can engage in their study,
the more reliable the findings that will come out of the study. In the case of this study,
user participation was mainly sought through the social and professional network of
the author, which resulted in moderate participation. Alternative forms of online
studies, which are known to attract higher user participation, are Facebook apps-
studies. However, those may come with several implementation difficulties and
constraints.
� Make the experiment engaging. Experiment participants have limited time and
patience. Therefore, the experiment should be either short (in the order of ten minutes)
or engaging. The present experiment was rather long (between 60 and 90 minutes); for
that reason, significant effort was paid to make it interesting and engaging. This was
especially difficult since each online activity of the users had to be repeated four times
(in order to collect sufficient data for testing the formulated hypotheses). Based on the
feedback collected from the participants (see Section 4.2), it appears that this goal was
achieved for most participants.
� Plan the experiment development/deployment. Launching online applications which
involve significant interaction with users may also be challenging from a development
point of view. In such cases, additional time should be allocated for potential delays,
debugging and implementation refinements.
Risk Measure
Insufficient number of participants
* Notify people about intention to launch experiment early on (~two months in advance). Request an email of participation intention.
* Provide the experiment in both English and Greek in order to maximize the number of potential participants.
* Get in personal touch with participants to motivate them to participate.
Boring/Non-engaging online experience
* Collect user interests together with the participation intention email.
* Manually select online articles and websites (activities A and S).
* Manually filter photos collected from the Flickr API (activity P).
Development issues
(framework learning, bugs, etc.)
* Allocate plenty of time for development.
* Allocate time for pilot testing and experiment refinement.
Scalability
(increased server load)
* Distribute much of the experiment logic and state management to the client (one of the reasons for selecting GWT for the site development)
Comprehensibility issues * Add detailed and unambiguous instructions to each step of the experiment.
* Progressive roll-out of the experiment (first notify a reduced set of users, get feedback and then send notifications to all participants).
* Provide support upon request.
Table 4: Risks and risk mitigation measures at the outset of the experiment planning

4. Data Analysis and Research Findings
This section presents the analysis of the user input that was obtained from the execution of the
Thesis online experiment. The experiment was launched on May 7, 2009 and remained online
for two weeks until May 25, 2009. Out of the 91 people that attempted to participate, 87
managed to successfully complete the experiment (three participants left the experiment
incomplete, and one participant faced a browser crush which resulted in partial loss of his
recorded information).
4.1 Demographics of the Participants
The characteristics of the participants’ population are presented in Table 5. According
to them, there is a balance between male and female participants, that the majority of
participants are in their mid- or late- 20s and that their education level is high (university
degree or higher). In addition, participants have either no or low income (students or just
began to work), but mostly they earn an average income. Finally, most of the participants
spend much of their time online, consider themselves as medium or advanced users and are
familiar with many popular Web 2.0 applications such as Facebook, YouTube and Flickr.
Variable Values
Number 87
Male Female Gender
52.9% (46) 47.1% (36)
[20-23] [24-26] [27-29] [30-32] [33-35] [36-39] Age
5.7% (5), 41.4% (36) 25.3% (22) 12.6% (11) 12.6% (11) 2.3% (2)
Greece NL Armenia, Cyprus, France, Mexico, Romania, Sweden, USA Country
89.6% (78) 2.3% (2) 1.1% (1 each)
High-school Vocational School Univ. Graduate Master’s / PhD Education
1.1% (1) 2.3% (2) 48.3% (42) 48.3% (42)
No Income Low Medium High Income
13.8% (12) 13.8% (12) 67.8% (59) 4.6% (4)
Rare Not much Regular High Very high Internet Usage
4.6% (4) 6.9% (6) 25.3% (22) 39.1% (34) 24.1% (21)
Basic Medium Advanced Guru Computer skills
0% (0) 35.6% (31) 44.8% (39) 19.5% (17)
Facebook MySpace LinkedIn YouTube Flickr
87.3% (76) 34.5% (30) 29.9% (26) 91.9% (80) 54.0% (47)
Last.fm Digg Twitter Delicious Web 2.0 usage
41.4% (36) 8.0% (7) 20.7% (18) 16.0% (14)
Table 5: Demographics calculated on the population of the participants

4.2 Evaluation of the Experiment
Table 6 presents the statistics that represent the impression that the experiment made
to the participants. Overall, the majority of the participants found the experiment interesting,
while there were some participants that found it indifferent. Fortunately, it was perceived as
boring by only few participants and annoying by only one. Regarding the time that was
necessary to complete the experiment, it was mostly found that the experiment requirements
were either reasonable or sometimes long (but not in an annoying way). Based on the free-text
feedback collected during the evaluation phase, it was noted that the main reasons for user
frustration were the repetitiveness of the tasks (four times for each online activity) and the
length of some articles that the users were requested to read.
Regarding the experiment tasks and instructions clarity, it appears that the instructions
provided throughout the experiment were sufficient to complete it (only 10% of the
participants reported facing several problems in their effort to understand the experiment
tasks). Finally, the exact goal of the experiment was not obvious to most of the participants
before the completion of the ad recall test. Even then, most of the participants could not relate
the experiment tasks to any of the research hypotheses of the Thesis. This is a desired
response, since it indicates that the ad response of most participants was not biased by their
preconception about the experiment objectives. Overall, the evaluation provided by the
participants suggests that the experiment was well-designed and in line with its original
requirements as described in Section 3.
Variable Values
Exciting Interesting Indifferent Boring Annoying Overall
3.4% (3) 74.7% (65) 17.2% (15) 3.4% (3) 1.1% (1)
Short Normal Long Excessively Long Time
5.7% (5) 57.8% (50) 27.6% (24) 9.2% (8)
Clear Almost clear Often unclear Confusing Clarity
23.0% (20) 66.7% (58) 10.3% (9) 0% (0)
Not understood
Understood mistakenly after the ad recall test
Understood partially after the ad recall test
Understood from the beginning
Purpose
25.3% (22) 45.9% (40) 20.7% (18) 3.4% (3)
Table 6: Experiment evaluation statistics calculated on the population of the participants

4.3 Research Hypothesis Testing
The ad response measurement phase resulted in the completion of Table 3 (the ad
scheduling table introduced in the previous section) with the following measurements (for
each brand):
� Y: Percentage of participants who could recall seeing the particular brand during the
experiment.
� M: Percentage of participants who were not sure whether they had seen the particular
brand during the experiment.
� C: Percentage of participants who could correctly associate a brand with its product /
service category.
Table 7 provides an overview of the participants’ responses for all brands that were advertised
during the experiment online activities.
A P S M
AEGIS
(43)
BUZZM
(44)
TAMA
(43)
INDIGO
(44)
AZZUR
(43)
MELIBLU
(44)
SPLASH
(42)
JOLLIE
(43)
Y 11 (.255) 2 (.045) 9 (.209) 8 (.182) 14 (.326) 13 (.295) 8 (.190) 6 (.139)
M 19 (.442) 15 (.341) 17 (.395) 16 (.364) 14 (.326) 8 (.182) 17 (.405) 20 (.465)
C 7 (.163) 11 (.250) 7 (.163) 10 (.227) 15 (.349) 10 (.227) 11 (.262) 25 (.581)
M-POINT MONTY SOLUBO AMETHYST
C (43) NC (44) C (43) NC (44) F (43) N (43) N (36) S (35)
Y 7 (.163) 3 (.068) 14 (.326) 4 (.090) 4 (.093) 6 (.139) 8 (.222) 7 (.200)
M 18 (.419) 16 (.364) 13 (.302) 17 (.386) 21 (.488) 15 (.349) 16 (.444) 12 (.343)
C 10 (.233) 7 (.159) 18 (.419) 7 (.159) 7 (.163) 5 (.116) 9 (.250) 12 (.343)
Table 7: User responses for each ad served to the experiment participants. The reported numbers are respectively (a) direct recall (Y), (b) fuzzy recall (M) and (c) implicit recall (C)
A first important observation on the collected responses is that online advertising is
effective for creating awareness for new brands. Considering that the brands, to which the
users were exposed during their online activities were fictitious, and that the participants were
exposed only twice to each one of them, one may consider the direct and implicit ad responses
of participants as high. Specifically, the aggregate direct brand recall over all participants and
all brands was as high as 18.3% (124 out of 677), while the correct brand-product category
association was even higher, 25.3% (171 out of 677). This implies that even limited online
exposure of subjects to advertising messages can lead to substantial percentages of brand
awareness, which is crucial for the marketing of new products and services.

Furthermore, in order to test for significant differences in the ad responses of users, the
response to ad i is considered to be described by two binomial distributions: one for the direct
ad response (whether participants could recall seeing the ad during the test) and the other for
the categorical priming response (whether the participants could correctly associate the
advertised brand with its category). Each binomial distribution will be described by a single
parameter pi, which respectively denotes the proportion of participants that could recall the
particular ad or that could correctly associate the advertised brand with its product category.
Thus, it is possible to conduct pairwise statistical tests between two responses x and y by
means of the z test statistic:
)11
()ˆ1(ˆ
ˆˆ
yx
yx
nnpp
ppz
����
�� ,
In the above formula, xp̂ and yp̂ stand for the observed proportions of participants that could
recall brands x and y respectively, nx and ny denote the numbers of participants who were
exposed to the respective ads and p̂ is the mean proportion of participants that could recall
either ad (i.e. p̂ is the mean value of xp̂ and yp̂ ). Note that z follows a standard normal
distribution and can therefore be used to infer the test p-value that is the probability of falsely
rejecting the null hypothesis. Apart from testing for significance between pairs of observed ad
response distributions, the standardized difference (Austin, 2009) between them is also
reported. The standardized difference between two binomial distributions px and py is
computed as follows:
2
)ˆ1(ˆ)ˆ1(ˆ
)ˆˆ(100
yyxx
yx
pppp
ppd
���
���
This measure provides an estimate of the extent (expressed as a percentage of the
mean response variation) to which the two observed responses differ from each other. This is
different from the reported p-value of the statistical significance test. In practice, distance
values greater than 10% denote non-negligible differences between the two observed sets of
measurements.

4.3.1 Role of online activity on ad effectiveness
Table 8 summarizes the pairwise comparisons between the users’ ad response during
different online activities. For each pair of online activities, two comparisons are conducted:
(a) one based on the particular pair of brands of the same category, and (b) one based on the
aggregate ad response irrespective of the advertised brand. Within each of these comparisons,
there are three statistical tests between pairs of binomial distributions where parameter p
stands respectively for: (a) percentage of participants who could recall brand X (denoted as DI
in the table), (b) percentage of participants who could either recall or were not sure about
recalling brand X (DII), and (c) percentage of participants who could associate brand X with its
true category (I).
Based on the tabulated results, one can see whether the four null sub-hypotheses of H1
can be rejected (and thus their alternate hypotheses asserted).
Ap̂ nA Bp̂ nB p̂ z p-val d (%)
DI .256 .209 .236 0.510 .610 11.03
DII .698 .605 .651 0.905 .365 19.61 Laptops (AEGIS-TAMA)
I .163
43
.163
43
.163 0.000 1.00 0.00
DI .132 .201 .167 -1.726 .084 -18.59
DII .523 .563 .543 -0.753 .451 -8.08
H1a A vs. P
All
I .201
174
.241
174
.221 -0.904 .366 -9.70
DI .045 .190 .118 -2.084 .037 -46.14
DII .386 .595 .491 -1.937 .053 -42.72 Movie reviews (BUZZM-M-POINT)
I .250
44
.262
42
.256 -0.126 .899 -2.73
DI .132 .186 .159 -1.332 .183 -14.73
DII .523 .603 .563 -1.455 .146 -16.09
H1b A vs. M
All
I .201
174
.365
156
.283 -3.306 <.001 -37.07
DI .326 .182 .254 1.541 .123 33.50
DII .651 .545 .326 1.052 .293 21.69 Hotels (AZZUR-INDIGO)
I .349
43
.227
44
.288 1.252 .211 27.09
DI .214 .201 .207 0.292 .770 3.14
DII .549 .563 .556 -0.264 .792 -2.84
H1c S vs. P
All
I .214
173
.241
174
.228 -0.611 .541 -6.56
DI .295 .139 .217 1.763 .078 38.49
DII .477 .605 .541 -1.192 .233 -25.77 Sunglasses (MELIBLU-JOLLIE)
I .227
44
.581
43
.404 -3.365 <.001 -77.37
DI .219 .186 .199 0.634 .526 6.99
DII .549 .603 .576 -0.979 .327 -10.83
H1d S vs. M
All
I .214
173
.365
156
.289 -3.025 .002 -33.88
Table 8: Ad response differences between pairs of online activities (p-value legend: green � significant @ 10%, blue � significant @ 5%, red � significant @ 1%)
H1a: From the collected results so far, it is not clear whether the ad response of the
users differs between article reading and picture browsing. Article reading appears to result in
slightly better ad response when the comparison is restricted to the laptop advertisements.

However in the case of aggregate comparison (i.e. comparison over all brands) picture
browsing appeared to favor ad recall and priming more than article reading. For instance,
direct recall of all brands during picture browsing was found significantly higher than the one
during article reading and rating (at a p-value of 0.084).
H1b: From the so-far collected results, notable differences can be observed in favor of
the ad response during message exchanging activities. Both in the case of comparing the ad
response between competing brands (BUZZM vs. M-POINT) and in the case of aggregating
the comparison over all brands, participants presented significantly higher ad recall and
priming response during message exchanging.
H1c: On the competing brands (AZZUR vs. INDIGO) recall and categorical priming
test, social bookmarking appears superior to picture browsing (but not at statistically
significant levels). When comparing over all brands, however, picture browsing appears to
lead to improved categorical priming responses.
H1d: Social bookmarking appears superior to messaging activities when the direct
recall between competing brands is considered (the number of participants stating that they
recall MELIBLU is significantly higher than the one of those stating that they recall JOLLIE).
However, the number of participants who could correctly associate the advertised brands with
their product category was significantly higher for message exchanging (both when
considering competing brands and when aggregating the comparison over all brands).
4.3.2 Priming response of picture browsing and tagging users
Table 9 indicates that the categorical priming responses between picture browsing and
the other online activities are not very different except for the comparison between picture
browsing and message exchanging (which favors message exchanging). Thus, the original
hypothesis which was based on the assumption that the presence of pictorial content would
affect the peripheral vision and thus the perception of side ads by users is not substantially
supported by the collected responses.
Ap̂ nA Bp̂ nB p̂ z p-val d (%)
P vs. A .241 174 .201 174 .221 0.904 .366 9.70
P vs. S .241 174 .214 173 .228 0.611 .541 6.56 H2
P vs. M .241 174 .365 156 .303 -2.446 .014 -27.22
Table 9: Ad priming response differences between picture browsing and other online activities

4.3.3 Ad effectiveness in relation to its congruence with the website
The role of ad-website congruence appears significant in this study. More specifically,
according to Table 10, there is measurable difference in the ad response (both direct and
implicit) of users that were presented with articles that were congruent with the advertised
brand (M-POINT). Moreover, there is statistically significant difference in the ad response of
users that were provided with photos that were congruent with the advertised brand
(MONTY). The direct ad recall and correct categorical association between the brand and its
product category was significantly higher for the participants who were exposed to the ad in
the context of congruent content.
Such findings provide evidence in favor of content-targeted advertising (Papadopoulos
et al., 2009) techniques, which aim at serving ads that are pertinent to the displayed webpage
content and partially justify the large success of the keyword-based advertising scheme
promoted by Google.
Ap̂ nA Bp̂ nB p̂ z p-val d (%)
DI .163 .068 .115 1.380 0.167 29.93
DII .581 .432 .507 1.395 0.163 30.26 C vs. NC (A)
I .233
43
.159
44
.196 0.863 0.388 18.59
DI .326 .091 .208 2.695 0.007 60.37
DII .628 .477 .552 1.413 0.158 30.65
H3
C vs. NC (P)
I .419
43
.159
44
.289 2.670 0.007 59.76
Table 10: Ad response differences between congruent and non-congruent web page content (with respect to the advertised brand)
4.3.4 Role of friend recommendation in ad response
Table 11 summarizes the difference in direct and implicit response between users that
were presented with an artificial friend’s recommendation (e.g. “Your friend X recommended
the following bookmarks!”) and those that were not presented with such a piece of
information. It appears that such messages (or the mental state created by them) do not
influence ad perception to a significant degree, that is there is not sufficient evidence to
support Hypothesis 4.
Ap̂ nA Bp̂ nB p̂ z p-val d (%)
DI .093 .139 .116 -0.673 .501 -14.55
DII .581 .488 .535 .865 .387 18.73 H4 F vs. N
I .163
43
.116
43
.139 .622 .534 13.45
Table 11: Ad response when a friend recommendation notification appears on the web page where the ad is displayed

4.3.5 Role of ad positioning
The ad placement with respect to a friend’s name appears to have only marginal effect
on the participants’ ad response. In particular, Table 5 leaves little room for speculation on the
role of ad positioning (in the sense of Hypothesis 5), as there is no significant difference in
neither the direct nor the implicit priming response of participants when the ad placement
changed.
Ap̂ nA Bp̂ nB p̂ z p-val d (%)
DI .222 .200 .211 0.229 .819 5.45
DII .667 .543 .605 1.067 .286 25.53 H5 S vs. N
I .250
36
.343
35
.296 -0.857 .392 -20.44
Table 12: Ad response when the ad is displayed in proximity to the friend’s name
4.4 Additional Conclusions
Apart from the investigation of the postulated hypotheses of Section 2.2, a series of
tests were conducted to investigate latent associations between demographic or other factors
and the response to the advertising message. Since the variation of country, education, income
and computer skills was not significant among the experiment participants, they were not
considered in this analysis. Among the demographic variables, the role of gender and age was
investigated. Both of them were found to be only marginally associated with the response to
the advertising message. Tables 13 and 14 illustrate that a hypothesis of the form “men are
equally likely than women to recall brands they were exposed to” cannot be rejected upon
statistical evidence. Therefore, one may conclude that gender does not affect a user’s response
to online advertisements. Similar conclusions were drawn for the age of participants (the
respective tables are not presented for the sake of brevity).
gender
male female total p-val (�2)
yes = 0 17 16 33 expected-yes = 0 17.5 17.5 0.612 yes = 1,2 15 16 31 expected-yes=1,2 15.5 15.5 0.857 yes >= 3 15 6 21
direct
expected-yes >= 3 10.5 10.5 0.049
Table 13: Association between gender and direct aided ad recall

gender
male female total p-val (�2)
yes = 0,1 17 16 33 expected-yes = 0,1 16.5 16.5 0.862 yes >= 2 29 25 54
direct
expected-yes >=2 27 27 0.586
Table 14: Association between gender and categorical priming response
Additional analyses of the associations between online content attributes and the
response to the side-ads indicate that there is not substantial correlation between how users
perceive a piece of online content (viz. article) and whether they can directly or implicitly
recall the brand that was advertised while they were reading the particular piece of content.
More specifically, Tables 15-20 present a chi-square comparison between the measured and
the expected ad response of participants as a function of their perception of the online content
read during ad serving. According to these tables, the interestingness and informativeness of
an online article appear to have almost no correlation (p-values >> 0.1) with the response of
users to the ads that were served together with the content. A measurable, but still statistically
insignificant (p-value=0.194), association was established between the direct ad recall and the
degree of content amusingness for a user (Table 19).
interesting
very (45.5%) medium (38.9%) not (15.6%) total p-val (�2)
yes 18 23 9 50 expected-yes 22.73 19.46 7.81 0.405 maybe 65 50 21 136 expected-maybe 61.82 52.93 21.25 0.848 no 77 64 25 166
direct
expected-no 75.45 64.61 25.94 0.965
Table 15: Association between article interestingness and direct aided ad recall
interesting
very (45.5%) medium (38.9%) not (15.6%) total p-val (�2)
yes 35 30 7 72 expected-yes 32.73 28.02 11.25 0.386 no 125 107 48 280
implicit
expected-no 127.27 108.98 55 0.783
Table 16: Association between article interestingness and categorical priming response
informative
very (46.3%) medium (42.9%) not (10.8%) total p-val (�2)
yes 22 23 5 50 expected-yes 23.15 21.45 5.39 0.905 maybe 66 54 16 136 expected-maybe 62.98 58.34 14.68 0.746 no 75 74 17 166
direct
expected-no 76.87 71.21 17.92 0.904
Table 17: Association between article informativeness and direct aided ad recall

informative
very (46.3%) medium (42.9%) not (10.8%) total p-val (�2)
yes 34 32 6 72 expected-yes 33.34 30.89 7.77 0.796 no 129 119 32 280
implicit
expected-no 129.66 120.11 30.23 0.943
Table 18: Association between article informativeness and categorical priming response
amusing
very (17.6%) medium (41.2%) not (41.2%) total p-val (�2)
yes 4 24 22 50 expected-yes 8.81 20.60 20.60 0.194 maybe 25 57 54 136 expected-maybe 23.95 56.02 56.02 0.934 no 33 64 69 166
direct
expected-no 29.24 68.38 68.38 0.680
Table 19: Association between article amusingness and direct aided ad recall
amusing
very (17.6%) medium (41.2%) not (41.2%) total p-val (�2)
yes 13 27 32 72 expected-yes 12.68 29.66 29.66 0.806 no 49 118 113 280
implicit
expected-no 49.32 115.34 115.34 0.946
Table 20: Association between article amusingness and categorical priming response
A final interesting observation with respect to the ad response of online users pertains
to the difference between their direct and priming response to the advertised brands. Figure 6
depicts the difference in priming response between users that stated to be ad-blind (i.e. that
they could not recall any of the advertised brands) and the rest (i.e. users who stated that they
could recall at least one brand). Surprisingly, only 20% of the ad-blind users produced the
expected priming responses (i.e. no correct association between brands and their categories).
A substantial number of these users could implicitly correctly associate two or more of the
brands with their product category. This substantiates previous studies that provided evidence
in favor of the subliminal effects of advertising (Shapiro et al., 1997; Yoo, 2008).

Figure 6: Distributions of implicitly recalled ads for users that stated that they had recalled (a) at least one brand (blue) and (b) no brand at all (red)

5. Conclusions and Future Work
The Thesis examined the effectiveness of online advertising within different online
activities and contexts that are prevalent in today’s Web environment, where rich interactivity
and social networking features are prevalent. More specifically, the Thesis attempted to
investigate the role of a user’s online activity on his/her response to the advertising messages
that are displayed in tandem with the current online activity. Furthermore, the Thesis studied
the role of social factors, such as friend recommendation and “socially-aware” ad positioning
on advertising effectiveness. The formulated research goals were pursued through a controlled
online experiment in which a series of online user activities and social networking features
were simulated.
Based on the experimental evidence collected from 87 participants, there is a
multitude of observations and conclusions that can be useful in the context of online
marketing strategy development. A significant conclusion, which also confirms previous
studies, is that online advertising constitutes an effective means for brand awareness creation.
Even though the brands employed within the Thesis experiment were fictitious and the
experiment participants were only exposed twice to each of them, a significant percentage of
them could either directly recall seeing these ads or could associate them with their product
categories. On the other hand, there were a substantial number of participants who stated that
they are ad-blind, that is they pay no attention to side ads during their online activities.
Despite their ad-blindness, a large number of these participants were able to correctly
associate the advertised brands with their correct product category, which substantiates the
subliminal effects of online advertising.
A further conclusion drawn from the conducted study is that the type of online activity
that a user is engaged in while being exposed to an advertisement affects the recollection of
the advertised brand at a later moment (hypotheses H1 and H2). Measurable differences in the
ad responses of users were found between pairs of online activities. The most pronounced
difference in the user ad response was observed between online message exchanging and the
rest of the online activities (Hypotheses H1b and H1d were found significant at 5% levels when
the direct recall was considered and at 1% when considering the categorical priming
responses of users). More specifically, a higher percentage of users could recall ads that were
displayed during message exchanging compared to the ones displayed during other online
activities. In contrast, no statistically significant evidence was gathered to support the
hypothesis regarding the role of pictorial content on the priming response of users to ads

(hypothesis H2). In the context of online marketing, one may interpret these conclusions as a
hint for directing advertising funds to certain types of online applications (e.g. applications
incorporating social networking features).
Furthermore, the congruence of the advertising message with the online content that is
displayed in the same webpage was found to constitute a significant factor affecting the
effectiveness of online advertising. More specifically, measurable differences were found
between the ad responses of users that were given to read articles which were related to the
advertised brands compared to the ones of users that were given articles that were irrelevant
with the advertisements (standardized difference ~30% in direct recall and ~20% in
categorical priming response rates). The differences were more pronounced (statistically
significant at 1% levels) in the case of pictorial content, that is when the content of the
displayed pictures was related to the advertised brand, users tended to recall the brand much
more often than in the opposite case. In summary, the postulated hypothesis H3 was supported
by the empirical observations.
Regarding the role of social context which was tested in the form of hypotheses H4
and H5, the collected responses did not provide conclusive evidence. Notifying users that one
of their friends recommended a certain website did not result in different (standardized
difference < 20%) ad response compared to the regular case (i.e. absence of such notification
during social bookmarking). In addition, the placement of ads near a friend’s name did not
affect the direct recall or implicit response of users to the ads (respective p-values in statistical
tests exceeded 0.2). One should note, however, that the simulation of social networking
features in an artificial experimental environment was only partially achieved, thus
encouraging such studies on data collected from the usage of real applications (e.g. Facebook)
to establish whether the online social context affects ad perception and recollection.
Finally, no other factor or variable could be identified that had significant impact on
the user response to online advertising. For instance, the gender and the age of participants
had no correlation (p-values for �2 test exceeded 0.5) with either their direct or their implicit
response to the advertised brands. Furthermore, several attributes of online content, such as
the degree to which it was perceived as interesting, informative and amusing, were found to
have no significant correlation with the measured ad response, apart from some marginal
correlation (p-value = 0.194 for the respective �2 test) between an article’s amusingness and
the number of users who could directly recall the side ads.

Following this study, there are a number of questions that remain open for future
research. First, one would need to conduct similar studies at a much larger scale (hundreds of
participants) in order to confirm or refute the findings of this study. Ideally, such studies
should take place in the context of a real web application, thus removing the perceptual bias
introduced by the artificial experimental process. Furthermore, additional investigations are
necessary in order to establish whether these findings can be generalized to more
product/service categories and even to real brands (although studying attitudes towards real
brands is complicated by prior user perceptions with regard to these brands). Finally,
additional implicit response measures, such as inclusion in purchase consideration sets and
brand name completion tests, are expected to yield additional insights to the mechanisms that
online ads act on the subliminal level.

6. References
Austin, P. C. (2009). Using the Standardized Difference to Compare the Prevalence of a
Binary Variable Between Two Groups in Observational Research. Communications in
Statistics - Simulation and Computation, 38 (6), 1228-1234.
Bagherjeiran, A. & Parekh, R. (2008). Combining Behavioral and Social Network Data for
Online Advertising. Proceedings of the 2008 IEEE international Conference on Data
Mining Workshops (December 15 - 19, 2008). ICDMW. IEEE Computer Society,
Washington, DC, 837-846.
Burns K. S. & Lutz R. J. (2006). The function of format: consumer responses to six on-line
advertising formats. Journal of Advertising, 35 (1), 53-63.
Dahlén M. (2002). Thinking and feeling on the World Wide Web: the impact of product type
and time on World Wide Web advertising effectiveness. Journal of Marketing
Communications, 8 (2), 115-125, Taylor & Francis Group.
Danaher P. J. & Mullarkey G. W. (2003). Factors Affecting Online Advertising Recall: A
Study of Students. Journal of Advertising Research, 43 (3), 252-267, Cambridge
University Press.
Drèze X. & Hussherr F. X. (2003). Internet advertising: Is anybody watching? Journal of
Interactive Marketing 17 (4), 8-23, Wiley Periodicals, Inc.
Flores L. (2000). Internet Advertising Effectiveness: What did we learn and where are we
going? Worldwide Advertising Conference, Rio de Janeiro, Brazil, November 2000.
Retrieved March 10, 2009 from
http://www.poolonline.com/archive/issue16/iss16fea3.html.
Gangadharbatla, H. (2008). Facebook Me: Collective Self-Esteem, Need to Belong, and
Internet Self-Efficacy as Predictors of the iGeneration’s Attitudes toward Social
Networking Sites. Journal of Interactive Advertising, 8 (2). Retrieved May 25, 2009
from http://jiad.org/article100.
Grimes A. & Kitchen P.J. (2007). Researching Mere Exposure Effects to Advertising:
Methodological Implications & Approaches. International Journal of Market
Research, 49 (2), 191-219.

Hollis, N. (2005). Ten Years of Learning on How Online Advertising Builds Brands. Journal
of Advertising Research, 45 (2), 255-268, Cambridge University Press.
Internet Advertising Bureau (2009). Internet Advertising Revenue Report: An Industry Survey
Conducted by PricewaterhouseCoopers and Sponsored by the Interactive Advertising
Bureau, March 2009. Retrieved April 5, 2009 from
http://www.iab.net/media/file/IAB_PwC_2008_full_year.pdf.
Leskovec, J., Adamic, L. A., & Huberman, B. A. (2007). The dynamics of viral marketing.
ACM Transactions on the Web 1(1), May 2007, ACM.
Lohtia R., Hershberger E. K., & Donthu N. (2003). The impact of content and design
elements on banner advertising click-through rates. Journal of Advertising Research,
43 (4), 410-418, December 2003, Cambridge University Press.
Mandel N. & Johnson E. J. (2002). When web pages influence choice: effects of visual primes
on experts and novices. Journal of Consumer Research, 29 (2), 235-245.
McCoy S., Everard A., Polak P., & Galletta D. F. (2007). The effects of online advertising.
Communications of the ACM, 50 (3), 84-88, ACM.
Pavlou P. A. & Stewart D. W. (2000). Measuring the Effects and Effectiveness of Interactive
Advertising: A Research Agenda. Journal of Interactive Advertising, 1 (1). Retrieved
March 15, 2009 from http://jiad.org/article6.
De Pelsmacker P., Geuens M., & Anckaert P. (2002). Media context and advertising
effectiveness: the role of context style, context quality and context-ad similarity.
Journal of Advertising, 31 (2), 49-61.
Papadopoulos S., Menemenis F., Kompatsiaris Y., Bratu B. (2009). Lexical Graphs for
Improved Contextual Ad Recommendation. Proceedings of the 31st European
Conference on Information Retrieval (Toulouse, France, April 7 - 9, 2009). ECIR '09.
Ramanathan S. & McGill A. L. (2007). Consuming with Others: Social Influences on
Moment-to-Moment and Retrospective Evaluations of an Experience. Journal of
Consumer Research, 34 (4), 506-524, University of Chicago Press.
Rettie R., Grandcolas U., & McNeil C. (2004). Post-impressions: internet advertising without
click-through. Academy of Marketing Conference, 6-9 July 2004, Cheltenham, United
Kingdom, ISBN 1861741480.
Richardson, M. & Domingos, P. (2002). Mining knowledge-sharing sites for viral marketing.
Proceedings of the Eighth ACM SIGKDD international Conference on Knowledge
Discovery and Data Mining (Edmonton, Alberta, Canada, July 23 - 26, 2002). KDD
'02. ACM, New York, NY, 61-70.
Rodgers S. & Thorson E. (2000). The Interactive Advertising Model: How Users Perceive
and Process Online Ads. Journal of Interactive Advertising, 1 (1). Retrieved March 10,
2009 from http://jiad.org/article5.
Shapiro S., Macinnis D. J., & Heckler S. E. (1997). The Effects of Incidental Ad Exposure on
the Formation of Consideration Sets. Journal of Consumer Research 24 (1), Chicago
Journals.
Yoo C. Y. (2008). Unconscious processing of Web advertising: Effects on implicit memory,
attitude toward the brand, and consideration set. Journal of Interactive Marketing, 22
(2), 2-18, Wiley Periodicals, Inc.
Zajonc, R. B. (1980). Feeling and Thinking: Preferences Need No Inferences. American
Psychologist, 35 (2), 151-175.

Appendix A: Experiment website screenshots
Figure A.1: Welcome screen: Preliminary information about the experiment is provided. Also, the screen contains some basic instructions on how to register and go through the experiment.
Figure A.2: Friend selection screen: The user is prompted to select up to four friends (if possible) among the experiment participants

Figure A.3: Article reading and rating screen: An article is presented to the user and his/her ratings for three aspects of this article are requested. This task is repeated four times (four articles).
Figure A.4: Picture browsing and tagging screen: The user is requested to select between three and five pictures from the picture array in order to tag them. Once clicking on a picture, a dialog pops up
that prompts for the user input (tags). This task is repeated four times.

Figure A.5(I): Social bookmarking screen I: The user is asked to rate and comment on one of the three sites appearing on the screen. This task is repeated four times.
Figure A.5(II): Social bookmarking screen II: The user is asked to submit a site of his own preference along with a short description of its content. This task is repeated four times (but the user may leave
the fields blank).

Figure A.6: Message exchange screen: The user is asked to send a message to one of his/her friends. The message should be accompanied by an emoticon (in order to make the task more
interesting and retain the user’s attention for some time).
Figure A.7(I): Decoy task screen I: The user is requested to identify the correct version of the logo. There is also a similar logo test for the Google logo.
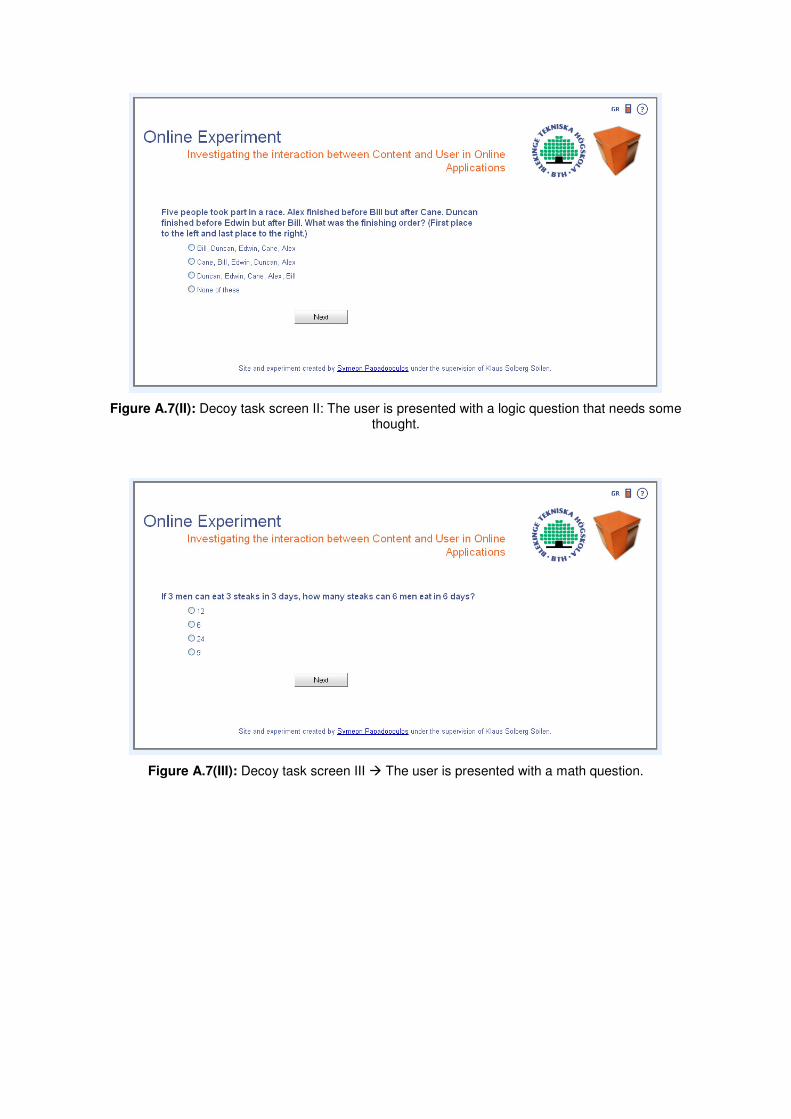
Figure A.7(II): Decoy task screen II: The user is presented with a logic question that needs some thought.
Figure A.7(III): Decoy task screen III � The user is presented with a math question.

Figure A.7(IV): Decoy task screen IV: The user is asked a question about movies.
Figure A.8 (I): Ad recall screen I: The user is asked whether he/she recalls seeing each of the brands he/she was exposed to during the experiment.
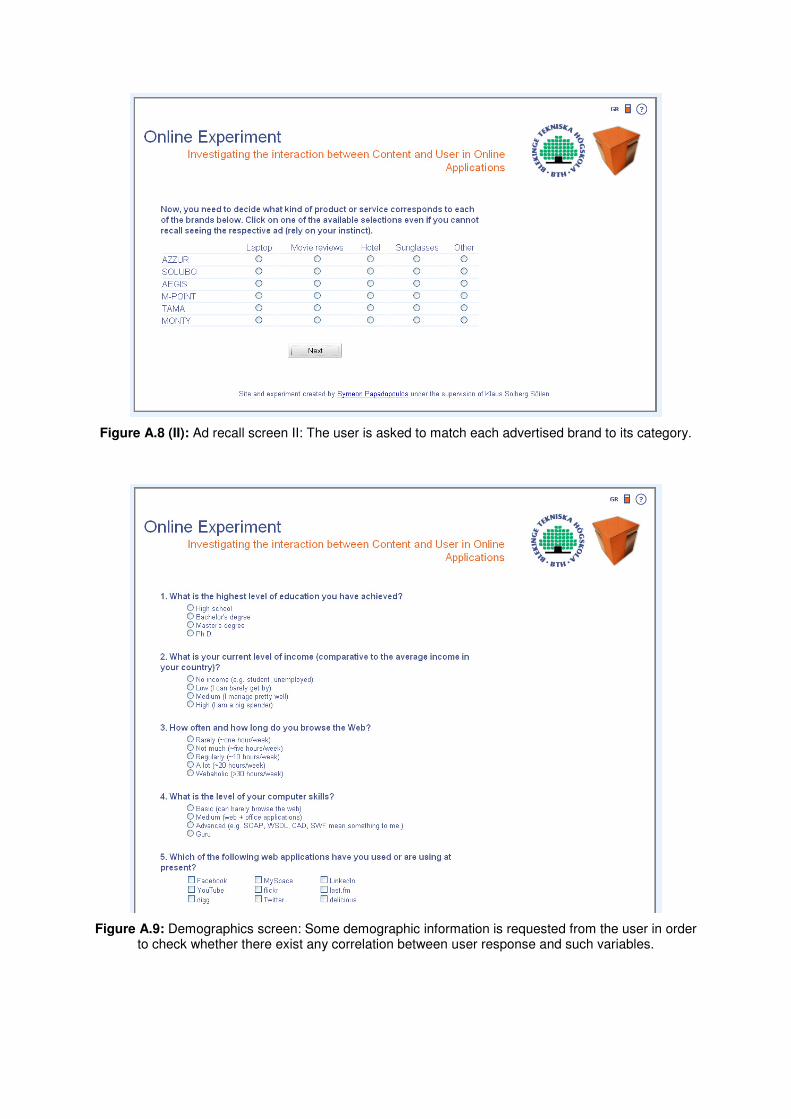
Figure A.8 (II): Ad recall screen II: The user is asked to match each advertised brand to its category.
Figure A.9: Demographics screen: Some demographic information is requested from the user in order to check whether there exist any correlation between user response and such variables.

Figure A.10: Experiment evaluation screen: The user is asked to evaluate the experiment. A significant question pertains to whether the user understood the purpose of the experiment.
Figure A.11: Goodbye screen: The user is thanked and is asked whether he/she wants to receive an electronic copy of the Thesis.

Appendix B: Experiment participants
Here I append a list of the people who made this study possible through their participation in
the online experiment. The participants are listed in alphabetic order. Some of them are
printed together with a blue dot, since they acted as attractors for additional participants. Also,
the participants that are printed together with a red dot acted as pilot users of the first version
of the experiment.
Afgerinakis Konstantinos
Alexoudi Theonitsa
Anagnostara Tatiana
Angeletou Angeliki
Arapakis Ioannis
Arvanitidou Marina Georgia
Asiklari Maria
Athanasiadou Mando
Billis Antonis
Bratzou Natasa
Cazares Cesar
Charalambidou Jenny
Chatziioannou Eleftheria
Chatzilari Elisavet �
Ciacci Massimo
Danelyan Hripsime
Dimou Anastasios
Dividis Kosmas
Dokouzgiannis Dimitris
Doulaverakis Mpampis
Doulga Natasa
Flouri Ioanna
Fragkouli Chrysa
Fragkoulis Alexandros
Froudaraki Nefeli
Georgopoulos Nikos
Giannakidou Eirini
Gidaros Spiros
Goniadis Yiannis
Greiner Charles
Greiner Claudia
Hengen Mylene
Kalfas Giorgos ��
Karandeinos Giorgos
Kargas Stefanos
Katsikas Dimitris
Kavakiotis Yiannis
Ketonis Niovi
King Paul
Kostantelou Lito
Kourkoulos Dimitris
Kourkoutis Leonidas �
Koutsari Maria �
Koutsari Matoula
Koutsonikola Vasiliki
Kritikos Apostolos
Kyropoulou Mili
Lakka Christina �
Litos Giorgos �
Malasioti Polyxeni
Manolaki Antigoni
Meletiadis Yiannis
Moraiti Marina
Moumtzidou Anastasia �
Mouratidis Giorgos
Mouratidou Maria

Nikolopoulos Spiros
Oikonomou Fanis
Papadopoulos Giorgos
Papadopoulos Thanos
Papadopoulou Maria �
Papamichael Michael
Pasvanti Angeliki
Psaltis Giorgos
Sarantopoulos Thanasis
Semertzidis Theodoros
Sevastiadis Christos
Sidiropoulos Panagiotis
Solachidis Vassilis
Spiridaki Efi
Stamos Kostas
Stasinos Dimitris
Trigidou Eva
Trigonis Panos
Tsampoulatidis Ioannis �
Tsangaraki Eugenia
Tsatsou Dorothea
Tserverli Ntina
Tsiminaki Vagia
Tsiopoulou Chamaidi
Varvaressou Cecile
Varvaressou Isabella
Vrochidis Stefanos
Xanthopoulakis Charalampos
Xyntas Ioannis
Zigkolis Christos
Zogopoulos Nikos ��
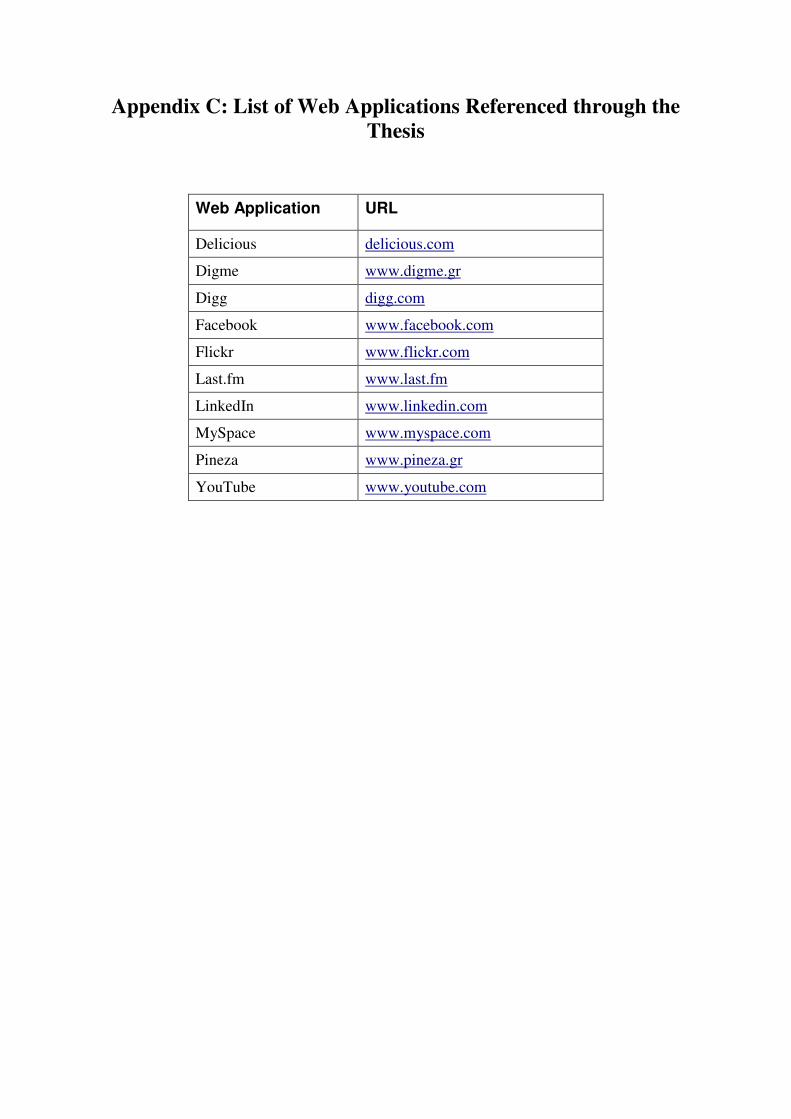
Appendix C: List of Web Applications Referenced through the
Thesis
Web Application URL
Delicious delicious.com
Digme www.digme.gr
Digg digg.com
Facebook www.facebook.com
Flickr www.flickr.com
Last.fm www.last.fm
LinkedIn www.linkedin.com
MySpace www.myspace.com
Pineza www.pineza.gr
YouTube www.youtube.com
Top Related