


Languages
Pages
Legal


kAD-A142 399 AIR FORCE CHDEMY AERONAUTICS DIGEST(U) AIR FORCE V2ACADEMY CO J DEJONGH ET FIL. MAR 84 USRFR-TR-84-5 VFNCLASSIFIED F/ 2/4 ML
... ..,. .
.4 . .-..
.2~
So. * 0
~~~~. .- .'- . .- ' . .
W. 1, I I.-0,p8ill,._,.++,= -L.
1111'2---5 III1 II111 .6
MICROCOPY RESOLUTION TEST CHART
NATIONAL OUREAU Of STANARDS - 1963 A
"44.
.+ ,-. +*
S _ .°. o *+.
.5-- ,.',., '
I * 5 -.
* ' =.'•V . + % *5 * % ,% % °
S . *k + . *I ,r* *d'

77 7 wNj , a
USAFA-TR-84-5
AIR FORCE ACADEMYAeronautics Digesta)
SEPARATION LINE
SEPARATED FLOW
ATTACHED FLOW
~MARCH 1984CFinal Report
C~)
a: APPROVED FOR PUBLIC RELEASE: DISTRIBUTION UNLIMITED
SDepartment of Aeronautics S J7: U ; 18Doan of the FacultyUnited States Air Force AcademyEColorado 80840
84 06 2F, 001
1r D 1 SW 10.J~~q
USAFA-TR-84-5
COVER:The cover shows a drawing of the results of a surface oil flow testconducted in the USAF Academy's 2 ft. x 3 ft. subsonic wind tunnel.The model tested is the Northrop top-mounted inlet vertical assistedtakeoff and landing (VATOL) configuration. The model was mounted ata 45-degree angle of attack in a freestream of 100 ft/sec. Additionalresults for this configuration are given in Major Jonas's article inthis issue of the Aeronautics Digest.
Editorial Review by Maj Robert M. Hogge, Department of EnglishUSAF Academy, Colorado Springs, Colorado 80840
This document is presented as a compilation of monographs worthy of
publication. The United States Air Force Academy vouches for thequality of research, without necessarily endorsing the opinions andconclusions of the authors.
This Digest has been cleared for open publication and/or publicrelease by the appropriate Office of Information in accordance with AFR190-1 and DODD 5230.9. There Is no objection to unlimited distributionof the Disest to the public at large, or by DTIC to the NationalTechnical Information Service.
This Dige-st has been reviewed and is approved for publication.
Thomas E. McCann, Lt. Colonel, USAFDirector of Research, Studies, and Analysis
UNCLASSIFIED
SECURITY CLASSIFICATION OF TIlS PAGE
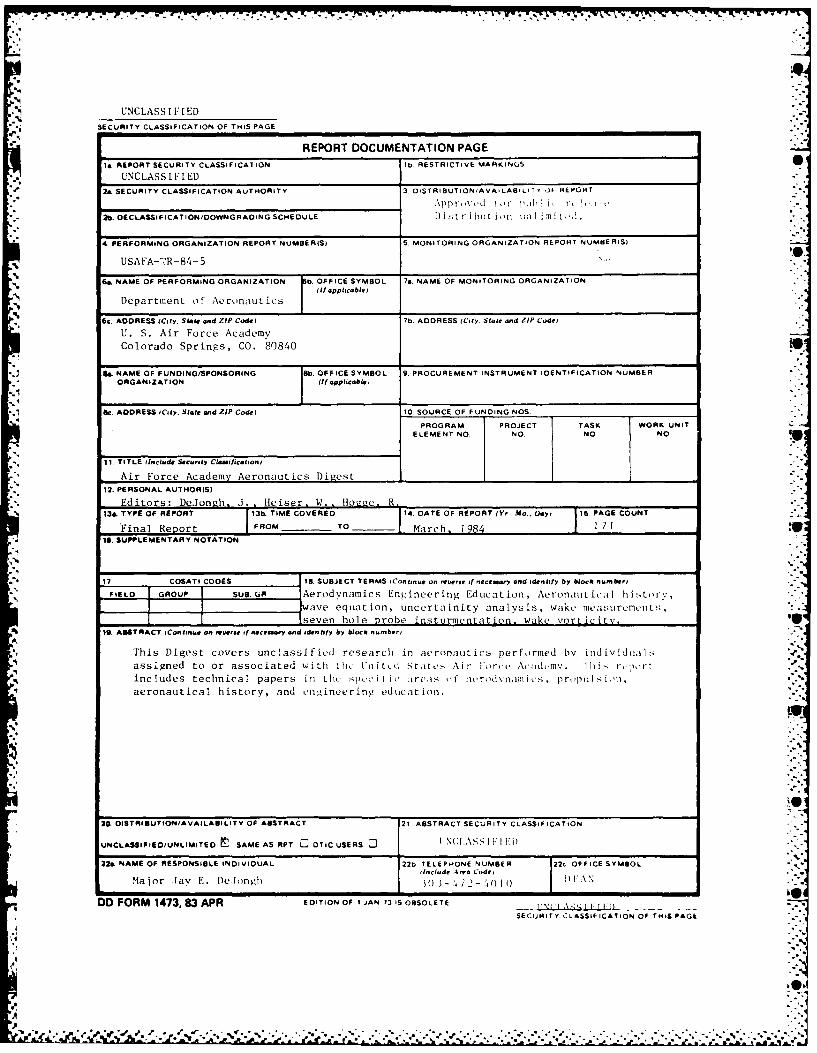
REPORT DOCUMENTATION PAGETo REPORT SECURITY CLASSIFICATION Ilb RESTRICTIVE MARKINGS0
UNCLASSIFIED
2e. SECURITY CLASSIFICATION AUTHORITY 3. DISTRIBUTIONIAVAILABILI T 0I REPORT
2b. DECLASSIFICATION/DOWNGRAOING SCHEDULE 1) 1st r I but ion l I I ll .
4. PERFORMING ORGANIZATION REPORT NUMBERIS) 5. MONITORING ORGANIZATION REPORT NUMBIERISI
USAFA-'R-84-5
Ga. NAME OF PERFORMING ORGANIZATION bI. OFFICE SYMBOL 7.. NAME OF MONITORING ORGANIZATION(If ppheablep
Department of Aeronautics
6c. ADDRESS (City. State and ZIP Code) 7b. ADDRESS (City, StaIe and ZIP Code)
U. S. Air Force AcademyColorado Springs, CO. 80840 i
4a AEO UDN/PNSRN b FIESMO 9. PROCUREMENT INSTRUMENT IDENTIFICATION NUMBER-ORGANIZATION (if applicable)
Sc. ADDRESS ICity. State and ZIP Code) 10. SOURCE OF FUNDING NOS
P ROGRAM PROJECT TASK WORK UNITE LE MENT NO. NO. NO. NO
* 11 TITLE fInclude Secuity Clawiaiciceton)
Air Force Academy Aeronautics Digest I________________________12. PERSONAL AUTHOR(SI
* Editors: DeJongh. J. . Heiser, W., H -oaee R.13a. TYPE OF REPORT 13b. TIME COVERED 14 DATE OP REPORT (Yr. Mo.. Dayi 15 PAGE COUNT
Final Re ortPRM____O ac I11U* 16. SUPPLEMENTARY NOTATION
17I COSATI CODES 1B. SUBJECT TERMS (ConinueSI on Wrevrs if neceiii.aiy and identify by black nu.mber)
*FIE=L GROUP SUB. GR Aerodynamics Engineering Education, Aeronautical historv,wave equation, uncertainity analysis, wake measurements,seven hole Pobe insturmentation, wake vorticitv.
a 19. ASTRA^CT (ConinueI an roye. if nice~ary nd identify by bloeb num~be,
This Digest covers unclassified research in aeronalutics performed 1w individuailsassigned to or associated With thc l lcd States Air Force Aaey i srst.
includes technical papers in thc' SIcct-iic :iro~i I aerodyniamics propllion,aeronautical history, and enn11ineerinv education.
20. DISTRISUTtON/AVAILABILITY OP ABSTRACT 21 ABSTRACT SECURITY CLASSIFICATION
UNCLASSIFIED/UNLIMITIED nSAME AS APT C3DTIC USERS C3 NCIASS I I' I)
22a. NAME OP RESPONSIBLE INDIVIDUAL 2bTELEPHONE NMBE R 22c OFF ICE SYMBOL
IsflCIIde A.'ma Code'Major Tay F.. DelonglI M 472 1 )F
DD FORM 1473,83 APR EDITION OF I JAN 73 IS OBSOLETE I' I_____.--I-I-- 1 S
SECURITY CLASSIFICATION OF THIS PAGE
AA
S7% 7o
USAFA-TR-84-5
PREFACEThis report is the eleventh issue of the Air Force Academy
Aeronautics Digest*. Our policy is to print articles which representrecent scholarly work by students and faculty of the Department of 4-
Aeronautics, members of other departments of the Academy and the FrankJ. Seiler Research Laboratory, researchers directly or indirectly Oinvolved with USAFA~sponsored projects, and authors in fields of
interest to the USAFA.
In addition to complete papers, the Digest includes, when %
appropriate, abstracts of lengthier reports and articles published inother formats. The editors will consider for publication contributionsin the general field of Aeronautics, including:
.Aeronautical EngineeringAerodynamicsFlight Mechanics
PropulsionStructuresInstrumentation
.Fluid Dynamics-Thermodynamics and Heat Transfer.Biomechanics,Engineering Education-Aeronautical History
Papers on other topics will be considered on an individual basis.Contributions should be sent to:
Editor, Aeronautics DigestDFANUS Air Force Academy
Colorado Springs, CO 80840"
The Aeronautics Digest is edited at present by Maj Jay E. DeJongh,PhD; William H. Heiser, PhD; and Maj Robert M. Hogge, PhD, who provided
the final editorial review. Our thanks also to Contract TechnicalServices, Inc. for editing and illustration services.
*Previous issues of the Digest can be ordered from the Defense TechnicalInformation Center (DTIC), Cameron Station, Alexandria, VA 22324J.
.4..
.3°
,p.
USAFA-TR-84-5
CONTENTS
e Section Page
I. AERODYNAMICS 1
EXTERNAL FLOW-FIELD MEASUREMENTS ON A TOP-MOUNTED, 2
INLET-VATOL CONFIGURATION AT HIGH ANGLES OF AT ACK'---- Frederick M. Jonas
EXPERIMENTAL MEASUREMENTS OF WAKE CHARACTERISTICS OF 48LOW ASPECT-RATIO DELTA AND FLAPPED-PLATE PLANFORMS---- C.R. Kedzie and K.E. Griffin
II. AERONAUTICAL HISTORY 87
THE EARLY DAYS OF AERONAUTICS' 88---- Sir Geoffrey I. Taylor
III. PROPULSION 111
UNCERTAINTY ANALYSIS: A NEW COMPUTER SUBROUTINE' 112---- Christopher A. Boedicker
IV. ENGINEERING EDUCATION 151
ONE-DIMENSIONAL UNSTEADY ISENTROPIC GAS FLOW' 152(PART TWO)---- Daniel H. Daley
V. THE ENGINEER'S BOOKSHELF 165
THE MYTH OF OBJECTIVITY IN THE WRITING OF ENGINEERS, 166---- Robert M. Hogge %'
9..
A~'%
p
I-
4
USAFA-TR-84-5
I:
SECTION I
Aerodynamics
Accession vor
N T S .' '
DTTC T'-lj.
,.,
4,0=
Av:,l .-, ' '" ty C ides."
'4 Dist JJ
A4.
S.
5 , .* * $ . . .% % " . % -
USAFA-TR-84-'
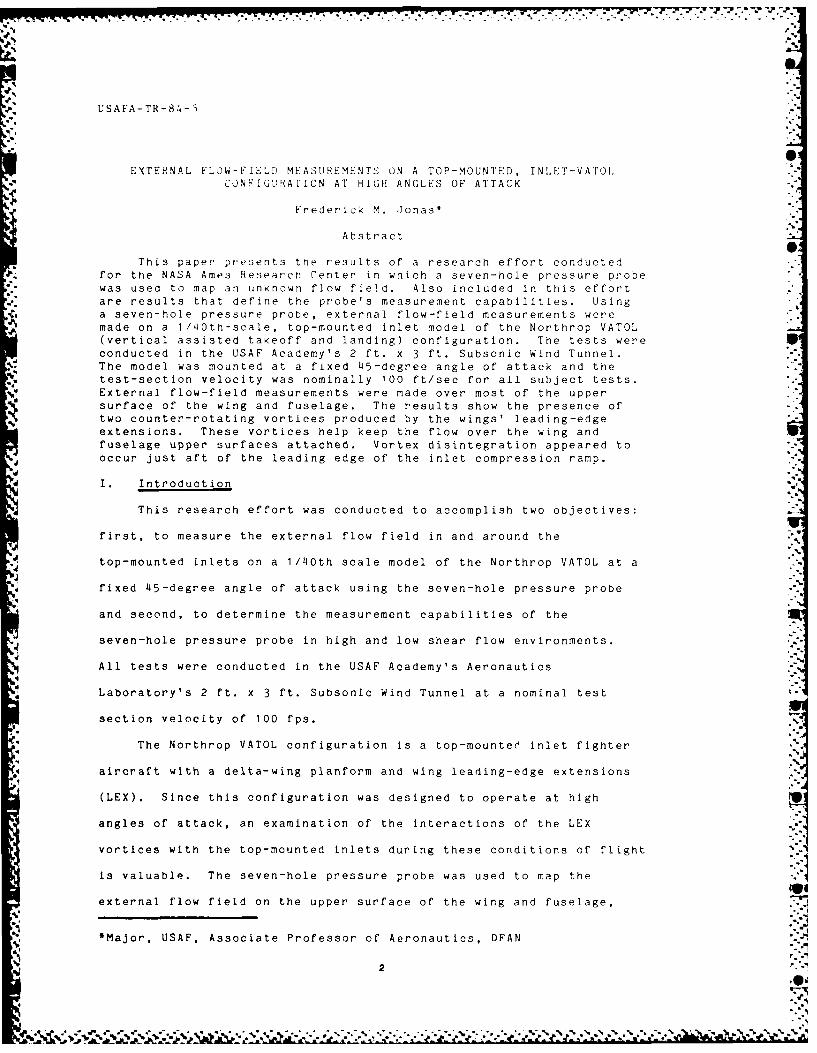
0EXTERNAL FLOW-FIELD MEASUREMENTS ON A TOP-MOUNTED, INLET-VATOL
CONFIGURATION AT HIGH ANGLES OF ATTACK
Frederick M -Jonas*
AbstractO
This paper, presents the results of a research effort conducted
for the NASA Ames Research Center in which a seven-hole pressure probewas used to map an unknown flow field. Also included in this effort
are results that define the probe's measurement capabilities. Using
a seven-hole pressure probe, external flow-field measurements weremade on a 1/40th-scale, top-mounted inlet model of the Northrop VATOL(vertical assisted takeoff and landing) configuration. The tests were
conducted in the USAF Academy's 2 ft. x 3 ft. Subsonic Wind Tunnel.The model was mounted at a fixed 45-degree angle of attack and the
test-section velocity was nominally 100 ft/sec for all subject tests.
External flow-field measurements were made over most of the uppersurface of the wing and fuselage. The results show the presence of
two counter-rotating vortices produced by the wings' leading-edgeextensions. These vortices help keep the flow over the wing and
fuselage upper surfaces attached. Vortex disintegration appeared to
occur just aft of the leading edge of the inlet compression ramp.
I. Introduction
This research effort was conducted to accomplish two objectives:
first, to measure the external flow field in and around the
top-mounted inlets on a 1/40th scale model of the Northrop VATOL at a
fixed 45-degree angle of attack using the seven-hole pressure probe
and second, to determine the measurement capabilities of the
seven-hole pressure probe in high and low shear flow environments.
All tests were conducted in the USAF Academy's Aeronautics
Laboratory's 2 ft. x 3 ft. Subsonic Wind Tunnel at a nominal test
section velocity of 100 fps.
The Northrop VATOL configuration is a top-mounter inlet fighter
aircraft with a delta-wing planform and wing leading-edge extensions
(LEX). Since this configuration was designed to operate at high
angles of attack, an examination of the interactions of the LEX
vortices with the top-mounted inlets during these conditions of flight
is valuable. The seven-hole pressure probe was used to map the
external flow field on the upper surface of the wing and fuselage,
*Major, USAF, Associate Professor of Aeronautics, DFAN
2
7- 2
USAFA-TR-84-5
starting just forward of the wing LEX and extending over the entire
body. Both qualitative and quantitative information on these
interactions was obtained. Crossflow velocities and loca: total
pressures are presented in graphical form for the data planes
investigated (Figures 12 and 14). Surface oil flow results for this
test condition are also presented (Figure 15).
In addition, as part of this research effort, the measurement
capabilities of the seven-hole pressure probe in high and low shear
flows were determined. It should be noted that this test was part of
an ongoing research effort at the USAF Academy to establish the
capabilities and limitations of the seven-hole pressure probe in
mapping unknown flow fields. The results of our research show this
probe to be a valuable and reliable instrument in making these kinds
of investigations. For this test, seven-hole pressure probe
measurements were compared to hot-wire anemometer results in the wake
flow behind an airfoil (low shear flow). Next, seven-hole pressure
probe measurements of local total pressure at a point in the vortex
wake (high shear flow) created by the wing LEX of the Northrop VATOL
model were compared to measurements of local total pressure obtained
using a total pressure probe. For this last effort the total pressure
probe was aligned first with the freestream flow and then with the
local flow.
The results of these investigations appear in Section V. A.
review of the basic flow characteristics, in terms of velocity and
pressure in viscous wake phenomena, appears in the Theory section
below. This section serves as a review of what one should expect to
see when measuring these wake phenomena. In the following section,
the apparatus and procedure used in the conduct of this investigation
are described. The paper closes with a description and summary of the
3
4V.
.---"." -3.
USAFA-TR-84-5
results of the investigation.
II. Theory
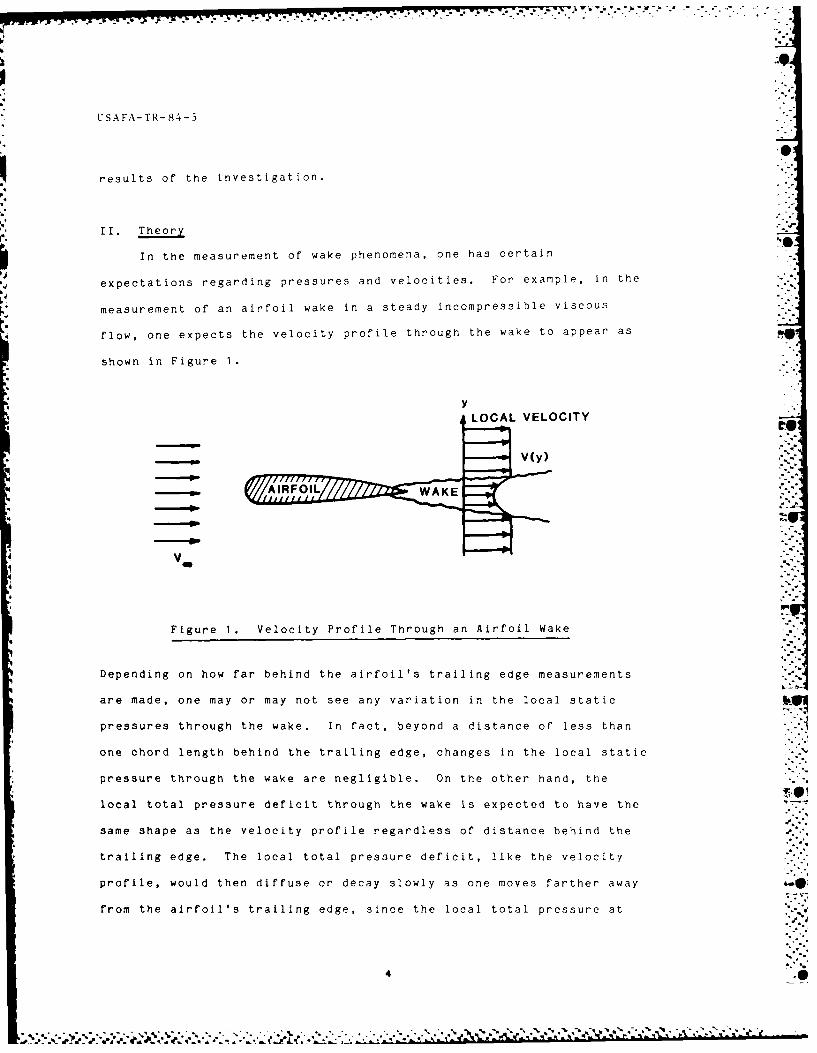
In the measurement of wake phenomena, one has certain
expectations regarding pressures and velocities. For example, in the
measurement of an airfoil wake in a steady incompressible viscous
flow, one expects the velocity profile through the wake to appear as
shown in Figure 1.
•y
LOCAL VELOCITY
V
Figure 1. Velocity Profile Through an Airfoil Wake
Depending on how far behind the airfoil's trailing edge measurements
are made, one may or may not see any variation in the local static
pressures through the wake. In fact, beyond a distance of less than
one chord length behind the trailing edge, changes in the local static
pressure through the wake are negligible. On the other hand, the
local total pressure deficit through the wake is expected to have the
same shape as the velocity profile regardless of distance behind the
trailing edge. The local total pressure deficit, like the velocity
profile, would then diffuse or decay slowly as one moves farther away 6i
from the airfoil's trailing edge, since the local total pressure at
A.:::-e:4 S@
USAFA-TR-84-5
any point is a measure of both local velocity and static pre:3sure. At
any point in a steady incompressible flow
P : PL + PV (I
The variation of P,, through the wake is, of course, caused by viscous
effects.
We would expect to see similar trends in a simple, two-dimensional
viscous vortex. These trends are easily verified by using a model: a
vortex filament that dissolves with time because of fluid friction
(Ref. 1).
Using a two-dimensional, time-dependent viscous vortex to model S
the characteristics of a three-dimensional, viscous-vortex filament
in steady flow may at first seem confusing, since we will be measuring
the latter. The decay of a three-dimensional viscous vortex with
downstream distance in a steady flow, however, can be related to the
decay of a two-dimensional vortex with time according to the relation ..
that distance equals velocity times time, or
t = d/V= or d V t (2
Thus, in the discussion that follows, for the two-dimensional vortex,
time can be replaced with distance along the three-dimensional vortex
filament. The change in the properties with time described for the
two-dimensional vortex thus corresponds to the change in properties for
the vortex filament as the vortex proceeds downstream along its
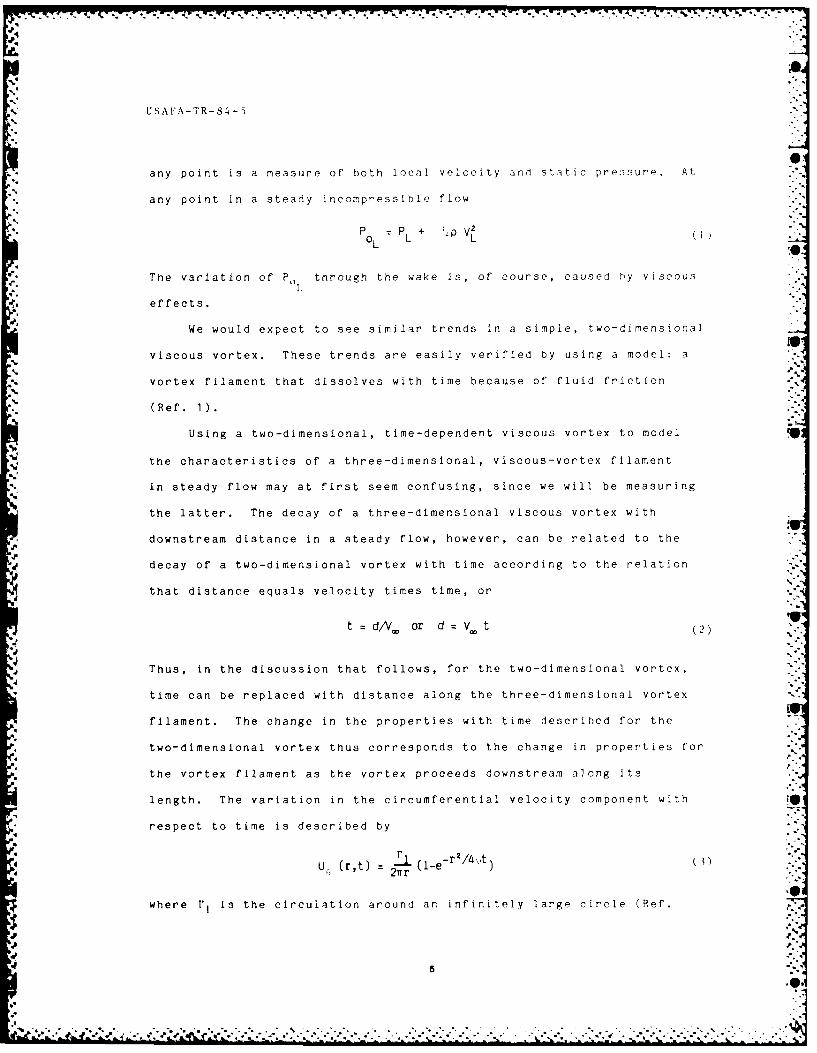
length. The variation in the circumferential velocity component with
respect to time is described by
U(, (r,t) = r (1-e- r 2/4 ,',t )21r r::'
where I is the circulation around an infinitely large circle (Ref.
II
USAFA-TrR-84- 5
1). The change in velocity with respect to time is shown in Figure 2.
.,.YIDEAL VORTEX FILAMENT
* 0
LU
INCREASING TIME OR DISTANCE
RADIUS,r t
Figure 2. Variation of Velocity with Radius, Viscous Vortex Filament
Note that as the center of the vortex is approached, the velocity
approaches 0, and as the radius becomes very large, the velocity again
approaches 0. From momentum considerations one can show that
1 ap 0 (4)
T) / 2 2l(le r/4,t) :
-P r
which describes the variation of local static pressure through the
filament. Note that for Eqn. (5)
>- >0 V r > 0
and
Z o as r., (7
S ar8r(7
e7
6I

USA FA- FR -8. .-
or, that the static pressure increases from some inimum v t, :
moves away from the vortex center and that the static p, v. a•. -
off far away from the vortex center. Finally, if one assur t
any point in this incompressible viscous flow the local tota! 'r
is the sum of the local static and dynamic pressures, or
POL PL + ',p1U2
L
then the change in the local total pressure with ralius is necrihe,
b y
L L + p)ar - r ar!
Substituting Eqn. (5) into this expression for ",P/)r and
differentiating Eqn. (3) to obtain ,U,,/'r results in the following
equation, describing the change in local total pressure through the
vortex.
3r =r vt :
Again, note that
,3 -> 0 V r > 0
andr
andp
- +0 as r + and as r +0 (12)ar '
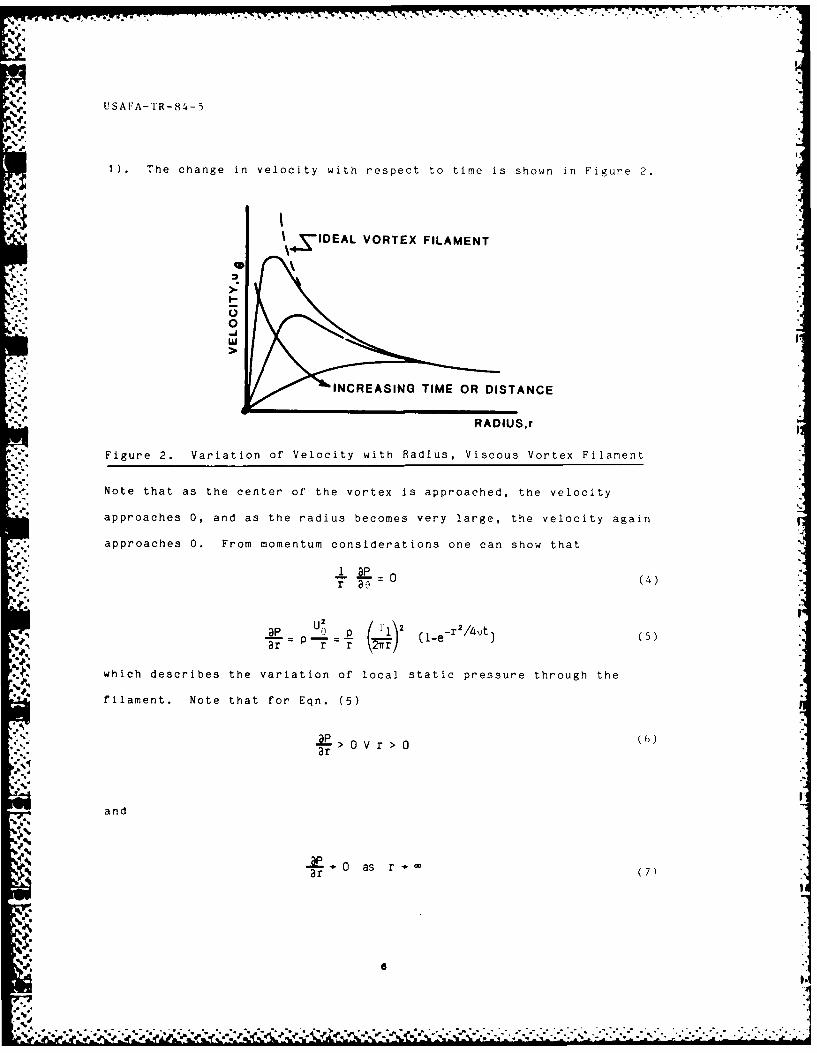
or that, as before with the local static pressure, the local total
pressure increases from some minimum value as one moves away from the p
center of the vortex and then levels off. From these descriptions we
would expect local total and static pressures to vary through the
vortex filament, as shown in Figure 3, at any time, t.
7I
-- ,7
%,.,
...
BOUNDARY CONDITION
Ix
k--
RADIUS.r
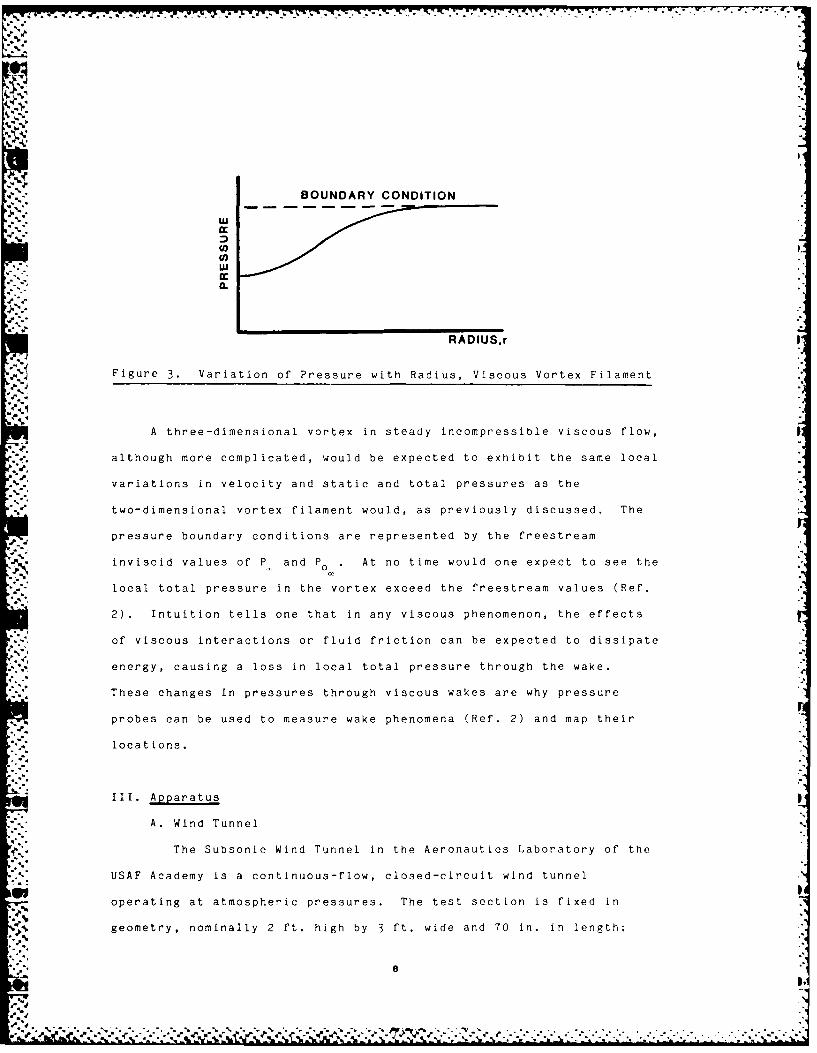
Figure 3. Variation of Pressure with Radius, Viscous Vortex Filament
A three-dimensional vortex in steady incompressible viscous flow,
although more complicated, would be expected to exhibit the same local
variations in velocity and static and total pressures as the
two-dimensional vortex filament would, as previously discussed. The
pressure boundary conditions are represented by the freestream
inviscid values of P- and Po. At no time would one expect to see the
local total pressure in the vortex exceed the freestream values (Ref.
2). Intuition tells one that in any viscous phenomenon, the effects
of viscous interactions or fluid friction can be expected to dissipate
energy, causing a loss In local total pressure through the wake.
These changes in pressures through viscous wakes are why pressure
probes can be used to measure wake phenomena (Ref. 2) and map their
locations.
III. Apparatus
A. Wind Tunnel
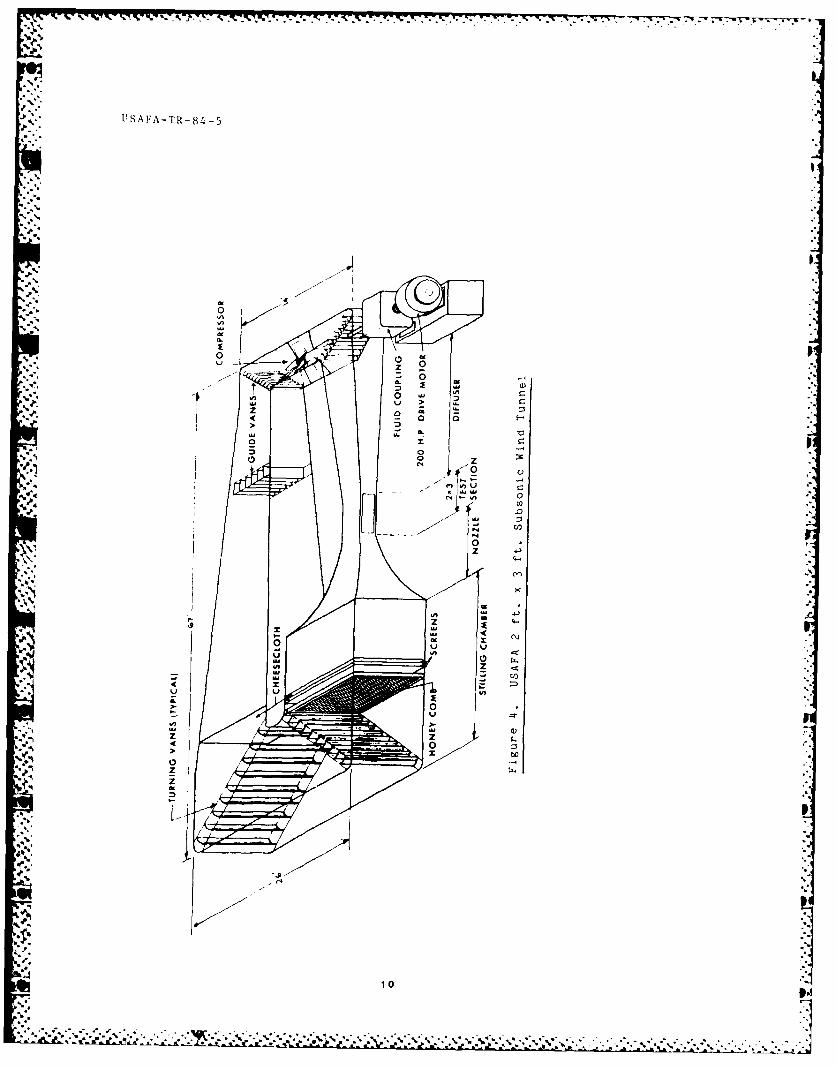
The Subsonic Wind Tunnel in the Aeronautics Laboratory of the
USAF Academy is a continuous-flow, closed-circuit wind tunnel
operating at atmospheric pressures. The test section is fixed in
geometry, nominally 2 ft. high by 3 ft. wide and 70 in. in length;
t'.p.
4- , .•"4 ",
-5. 4 . |-'4,- .w, -.. - -..- , -,,, , . - '- .
-- . , ,. -: ., .. • •.- . - .• .. ...-. '. " ..- - -,-

USAFA-TR-84-5
its sidewalls diverge approximately 1/2 degree with respect to the
tunnel centerline. The Mach number range is 0.04 M - 0.35, which
corresponds to a speea of 50 to 400 fps. The corresponding Reynolds
number per foot is 0.2 (106) to 1.3 (1 0 h) and the dynamic pressure
ranges from 1.8 psf to 130 psf. A schematic of the wind tunnel is
shown in Figure 4.
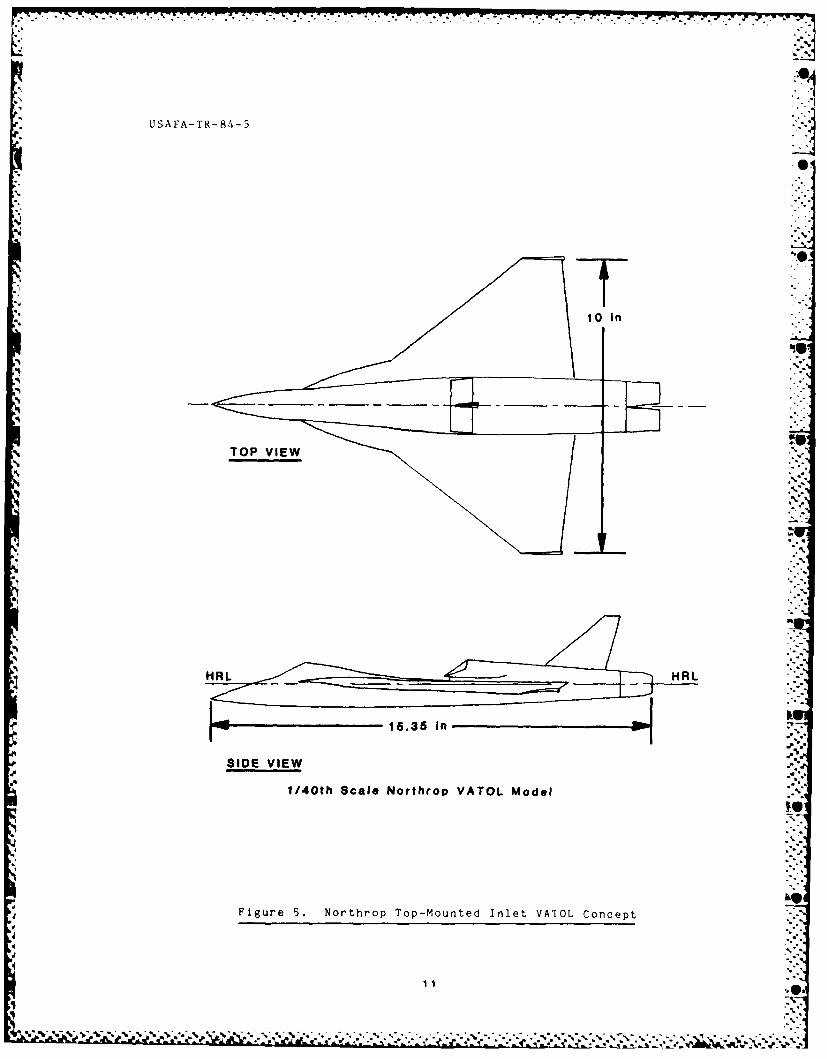
*6B. Model
A 1/40th scale model of the Northrop VATOL configuration
(Refs. 3 and 4) was used in this investigation. Flow into the
flow-through inlets of the model was adjusted to match conditions
typical of 0.9 Mach cruise, Ao/Ac = 0.66, for all tests. The model
was strut-mounted at a fixed angle of attack of 45 degrees with
respect to the aircraft horizontal reference line (HRL). All tests
were conducted at a nominal test-section velocity of 100 fps. A
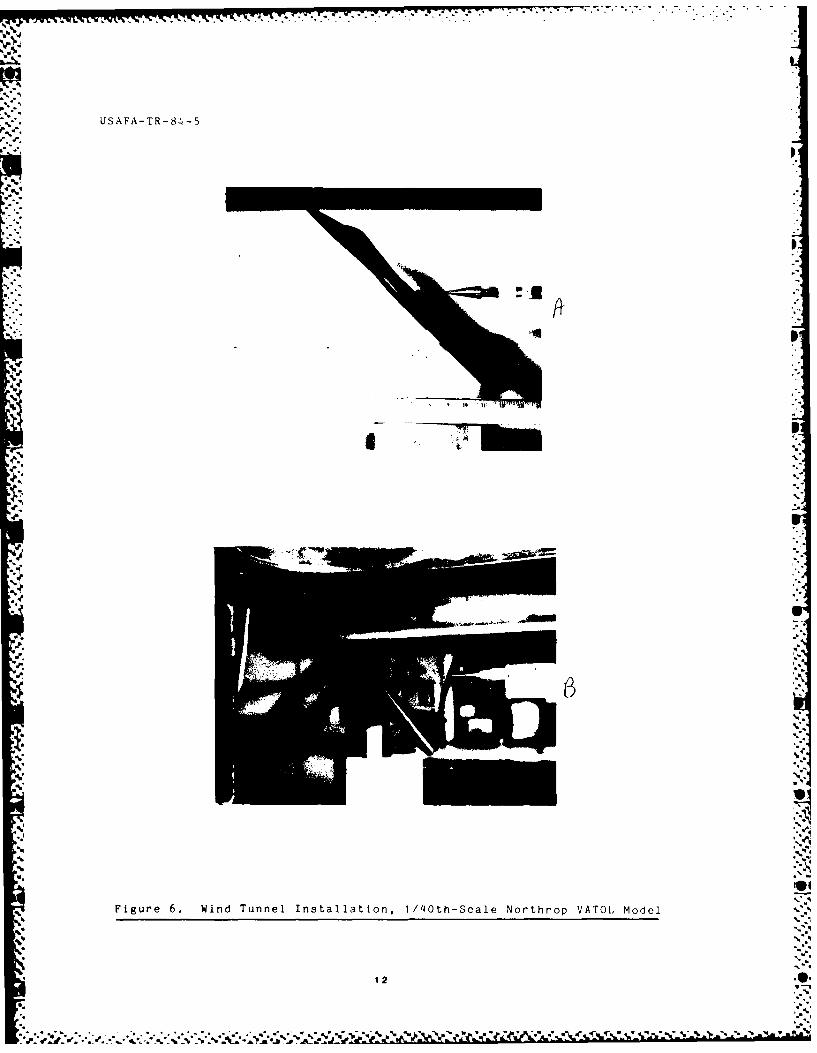
schematic of the model is shown in Figure 5, while a typical
installation is shown in Figure 6.
C. Pressure Probes
A 0.109 in OD seven-hole pressure probe (Ref. 5) was used to
map the external flow about the model. The probe was aligned with the
freestream flow direction for all of the tests, as shown In Figure 6.
In subsonic compressible flows, relative flow angles of up to 70
degrees with respect to the probe centerline are measurable to within
±1.6 degrees, while the ratio of local trtal pressure to local dynamic
pressure is measurable to within ±5 percent at 95 percent certainty
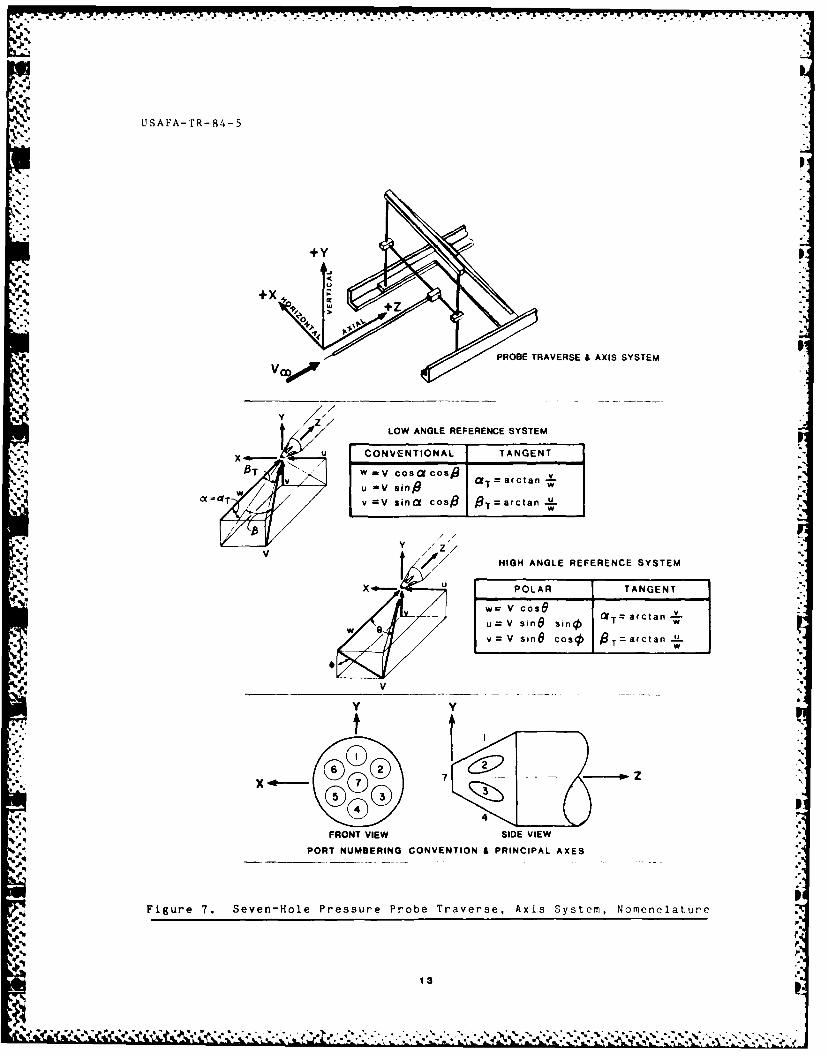
(Ref. 5). The seven-hole pressure probe data was collected, reduced,
and displayed by means of the seven-hole probe data acquisition system
(Ref. 5), which uses the PDP 11/45 computer system. The probe
traverse, axis system, and nomenclature are shown in Figure 7.
9
, . . . .. - U * .. °"
USAFA-TR84-5
0 ,
w' u
I 0
x wx
z L
90
'4.6
10
* USAFA-TR-84-5
10 In
TOP VIE
HRL ____
1535I
SIDE VIE1/0hSae otrpVAO oe
Fiue5 otrpTpMutdIltV'0 ocp
USAFA-TR-84-5
IWA.
1i12
.9 *USAFA-TR-84-5
+Y
"::I.
PROBE TRAVERSE & AXIS SYSTEM
/
SLOW ANGLE REFERENCE SYSTEM
X.- U CONVENTIONAL TANGENTOT ~ ~ ~ ~ -wM oi oi =arctan
-,V 01 T~ coacw u -V sinfl)a -=orv =V sinat cosi T= arctan u "
L
V ZHIGH ANGLE REFERENCE SYSTEM
POLAR TANGENT
w = V Cose 9 =
u= V sine s T= arcSan now-
v = V sine cos 4T=,ctan '-L%4w
V ___
VVY Y
.9FRONT VIEW SIDE VIEW,,** Z__ , PORT NUMBERING CONVENTION & PRINCIPAL AXES
I '11Figure 7. Seven-Hole Pressure Probe Traverse, Axis System, Nomenclature
13
------ ....... Y . - ' , - . . ' - , . . . , . . . . . . . . -,
USAFA-TR-84-5
p
Two separate total pressure probes were used to measure local
total pressures at specific points above the model for later
comparison with the seven-hole pressure probe measurements. The
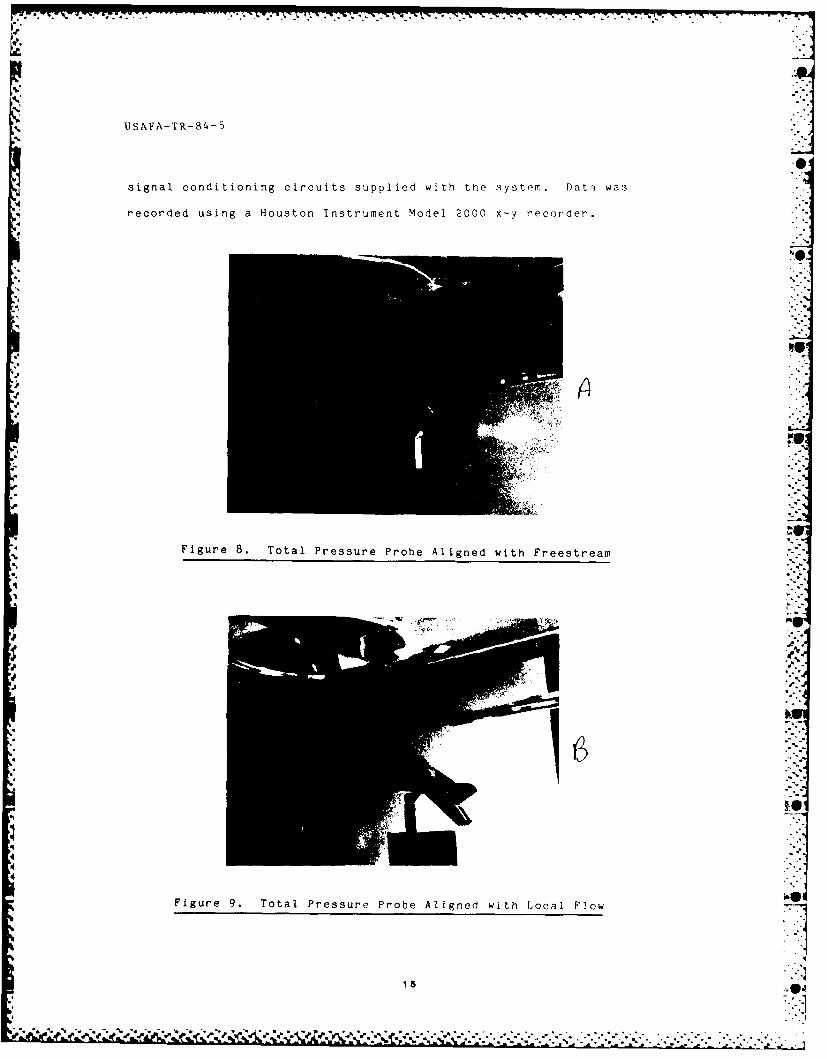
first total pressure probe, shown in Figure 8, is a 0.125 in OD-4%
hemispherical-head pitot tube. This probe was aligned with the
freestream flow for all tests. The second total pressure probe,
consisting of a 0.109 in OD and 0.086 in ID tube, was bent at a 23.8 ±
0.1 degree angle to correspond to the local flow angle (measured using
* the seven-hole pressure probe) at a specific point above the model.
The tunnel installation at this point is shown in Figure 9. Pressure
data for both probes was collected using the PDP 11/45 data
acquisition system.
D. Airfoil Model
An NACA 0015 airfoil model was used to obtain wake measurement
comparisons between the seven-hole pressure probe and the hot-wire
anemometer in the subsonic wind tunnel. The airfoil model spanned the
wind tunnel, thus representing two-dimensional flow. The model's chord
length was 6 in. and spanned the wind tunnel from the top to the
.4bbottom walls. The airfoil was set near 0 degrees angle of attack, and
tests were conducted at 60 fps and 100 fps.
.p-,
E. Hot-Wire Anemometer
A constant-temperature, hot-wire anemometry system
(Thermo-Systems Model 1050) belonging to the Frank J. Seiler Research
Laboratory (an AF Systems Command tenant organization) was used to4..'
make airfoil wake velocity measurements. A single-wire sensor probe.4'
was employed to measure freestream velocity components through the Si
airfoil's wake. Linearized anemometer signals were processed using %
14
-, ...-
ISAFA-TR-84-5
signal conditioning circuits supplied with the system. Data was
recorded using a Houston Instrument Model 2000 x-y recorder.
Figure 8. Total Pressure Probe Aligned with Freestream
-VA-

USAFA-TR-84-5
0
IV. Procedure
A. Flow Surveys
* 1. Seven-Hole Probe/Northrop VATOL Model.0
The seven-hole pressure probe was used to collect flow
field data at 18 data planes chosen to survey flow regions in and
around the top-mounted inlets. The probe was parallel to the
freestream velocity (a = 0 degrees) for all data planes. Each data
- plane was defined by a constant value of Z (Figures 7 and 10), and
data was collected in each plane normal to the freestream flow
(defined by x-y planes). The reference point for all data-grid points
(x-0, y=O, z=O) was the centerline top of the inlet lip, as shown in
Figure 6 and 10. All data planes consisted of 200 grid or data points
for a total of 3600 data points. The nomenclature pertaining to each
data plane is defined as follows:
Z M/P xPxx
-location, in., constant value of Z defining
% data plane location
minus or plus, corresponding to axis system withrespect to reference point
_ _ _ Z-axis %
For example, ZM5P25 corresponds to a data plane located at Z = -5.25
in. Data planes are shown in Figure 10 and are listed in Table I.
2. Pressure Probes/Northrop VATOL Model
For the measurement of local total pressures both the
seven-hole pressure probe and total pressure probes were used for the
purpose of comparison. The measurements were made in the data plane
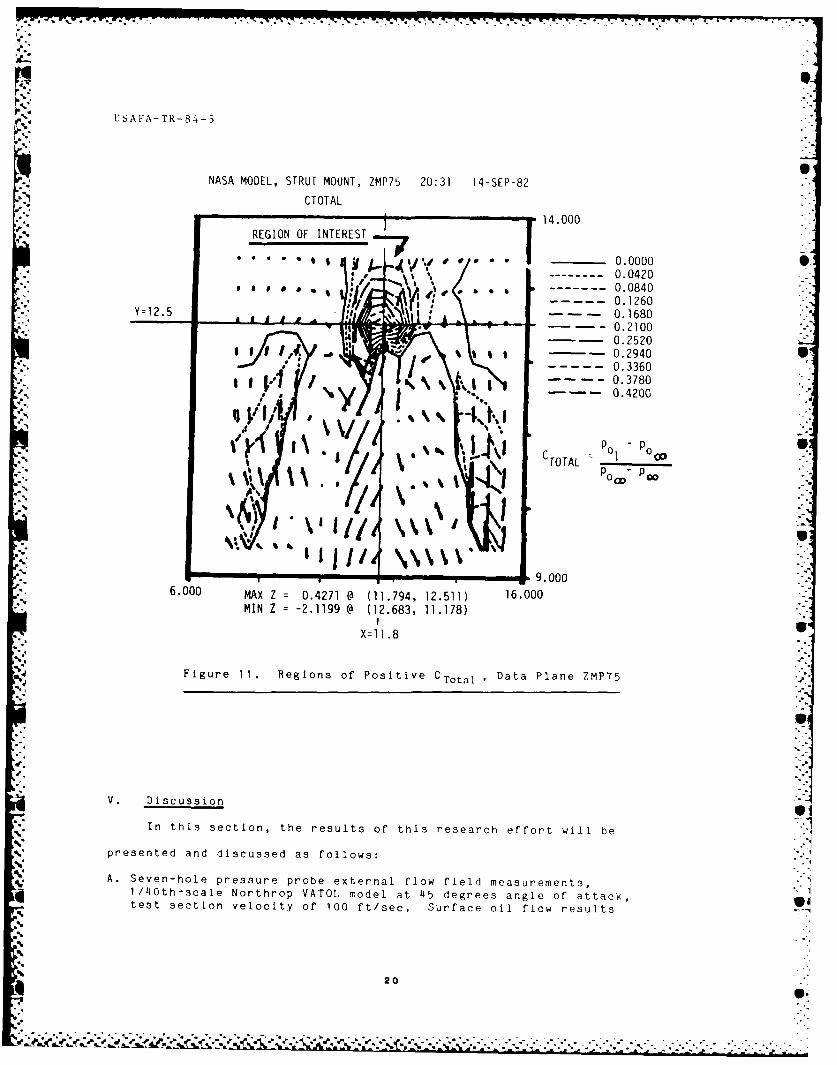
ZMP75. Regions of local total pressure greater than the freestream
total pressure were first identified using the seven-hole pressure 9
probe. These regions are shown in Figure 11 and coincide with the• 4
" i::

UZ>AkA- YR-84-5
outboard portions and top centerline of the vortices. Data grid
points and local flow angles in these regions were then identified for
further investigation using the total pressure probes. For the first
test, a total pressure probe was aligned with the freestream flow (as
was the seven-hole pressure probe) and 10 measurements were made at
three identified grid points. For the second test, a total pressure
probe was then aligned with the local flow at one selected grid point
(Figure 11) to measure the actual local total pressure associated with
the total velocity vector. A total of 69 data points was recorded at
this grid point. Note that each data point represents an average of '
50 samples rather than an instantaneous value.
3. Airfoil Model Test
For the wake investigations of the NACA 0015 airfoil model,
both the seven-hole probe and hot-wire anemometer were used. The data
was collected 3 chord lengths downstream from the model. Each survey
consisted of a data pass through the airfoil wake in a direction
normal to the airfoil wake centerline. Both probes were parallel to
the freestream velocity, and data was collected at the model midspan
to minimize wind-tunnel wall effects.
B. Surface Oil Flow
Surface oil flows were conducted on the Northrop VATOL model
mounted at 45 degrees angle of attack. Test section velocity was 100
fps. e
17""
aO
p * *. ~ *~. . - *.**.. .* .**.-...-4 . .4 4 . ..e* * 4 ~%% ~ . t . t t

USAFA-TR-84-5
Y (in)
o10.0
0.0
.NI T
vW ~ ~ IT - 100 fpITIT .0fill I TN p
VcalOO1pm HI2.01
o( 45 do I I
Jr AXIAL
I 2.0 4.0 6.0z z(in)
L
*J. ~ ~ ~ ~ ~ I on pln crae by- n
q.%'.. xNxi
I T
Figur P10.e Daotn Plneooatnctriedze

USAFA-TR-84-5
Table INORTHROP VATOL MODEL, SEVEN-HOLE PROBE DATA PLANES
Grid SizeData Plane (x by y, inches) Location
ZP6 16X8 1 inch aft of nozzlesZP2 16x8 Junction vertical tail
4 LE and fuselageZP1 1 4x7--zo 8x4 ~ Reference plane, top
of inlet lipZMP25 8x~4--ZMP5 8x4ZMP75 8x~4 LE of lower inlet rampZM1 8x4 -ZM1 P5 8x4 -ZM2 8x4 ~ Intersection of LEX
and wing LEZM2P5 ?x3.5--ZM3 6x3ZM3P25 5x2.5--ZM3P5 5x2.5--ZM3P75 41x2--ZM4P25 4x2
dZM14P75 ~4x2 Approximately where LEof LEX joins fuselage
ZM5P25 2xl Approximately wherecanopy LE joinsfuselage
1*19
W7 74 7 '17 __7- -b W7. -** -. . . . . . . . . . . . . . . . . . . . .
~~ USAFA-TR-84-5
NASA MODEL, STRUT MOUNT, ZMP75 20:31 14-SEP-82
C TOTAL
REGION OF INTEREST 14.000 000
0.0420--- - 0.0840S0.1260
Y=12.5 -0.1680
-- 0.2520% 0.2940S
--------------------------------------0.3360
PO- Po
0
6.000 MAX Z = 0.;271 @ (11.794, 12.511) 16.000
MNZ=-2.1199 @ (12.683, 11.178)
X=1 1.8
*0,I
Figure 1 1. Regions of Positive CTotai Data Plane ZMP75 p
V. Discussion
In this section, the results Of this research effort will be
presented and discussed as follows:
A. Seven-hole pressure probe external flow field measurements,1/40th-scaie Northrop VATOL model at 45 degrees angle of attack,IDtest section velocity of 100 ft/sec. Surface oil flow results
20
U SAFA-TR-84-5
will also be presented.
B. Seven-hole pressure probe and hot-wire anemometer measurements of
an airfoil wake, NACA 0015 airfoil, at a test section velocity of
60 and 100 ft/sec, nominal angle of attack near 0 degrees.
C. Investigations of local total pressure in a vortex wake using the
seven-hole pressure probe, pitot probe aligned with freestreamflow, and pitot probe aligned with local flow. Testing was
conducted on Northrop VATOL model mounted at 45 degrees angle of
attack, test section velocity of 100 ft/sec.
In reporting the results of the pressure probe testing the
nondimensional coefficient, C Total will be presented where
P P0L -0
C '1 (13)C~Total
P = local total pressure°L
P = freestream total pressure
P = freestream static pressure
A. Seven-Hole Pressure Probe/Northrop VATOL Model
The results of the external flow field measurements on the
Northrop VATOL model mounted at 45 degrees angle of attack at a test
section velocity of 100 ft/sec are presented in Figures 12a--i, 13, and
14a-c. Each data plane consists of 200 individual test or grid
points.
Figures 12a-i present the crossflow velocities and then contours
first for negative and then for positive values of CrctaI . The data
is presented by data plane, starting from the nose of the model and
moving downstream. The data planes are viewed looking upstream from
behind the model. As seen from the plots of crossflow velocity, there
is a slight side-wash or positive sideslip in the flow. This was due
to the model mounting in the wind tunnel and not to a flow condition
in the test section, -:s was later verified. In general, the magnitude
of this sideslip was negligible and did not appreciably affect the
2124 21
, .. . ' "," - .--1 .-.. .- -].'. . .- ' . .?- .- ..-. v ..-- .. • -..-. v -. -.. v - - "-... -...- .,.... -..-.. - .... S.
USAFA-TR-84-5
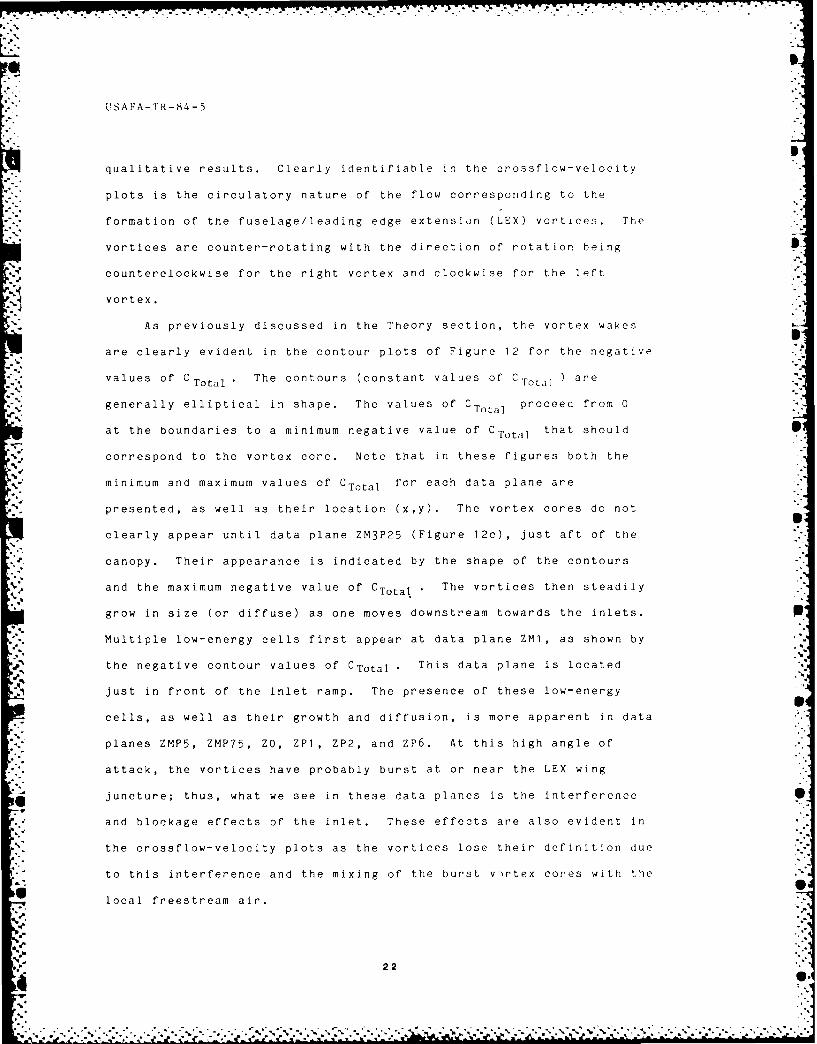
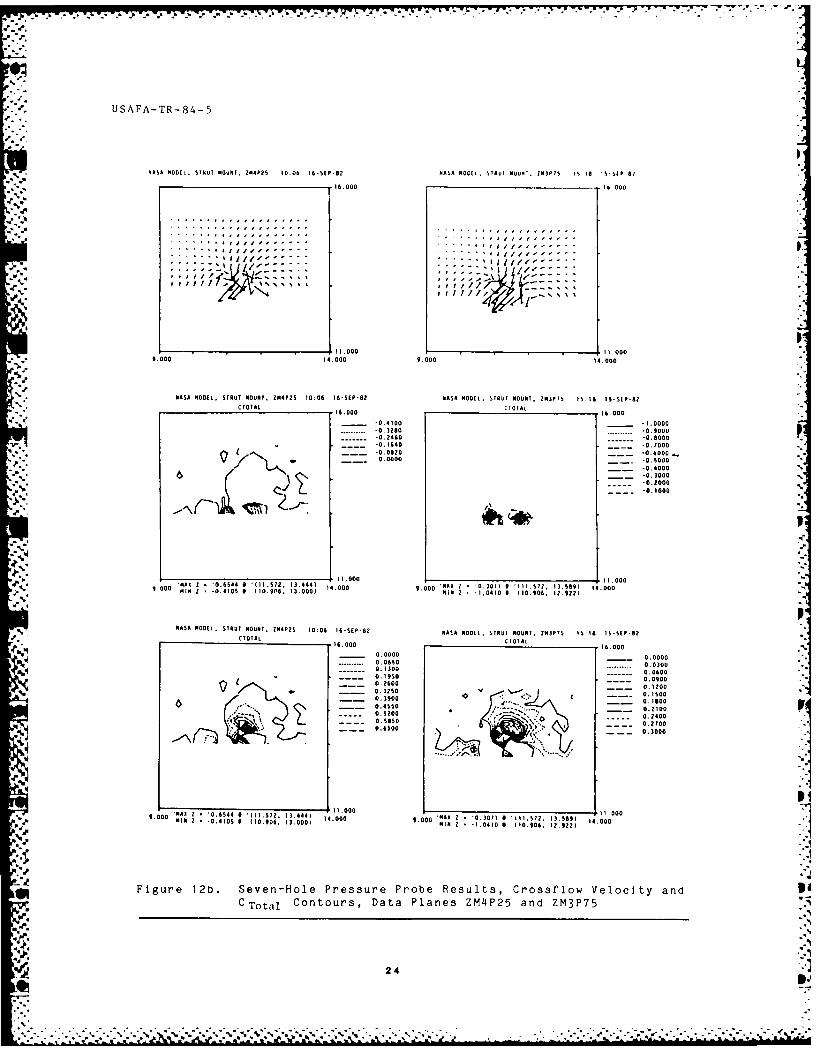
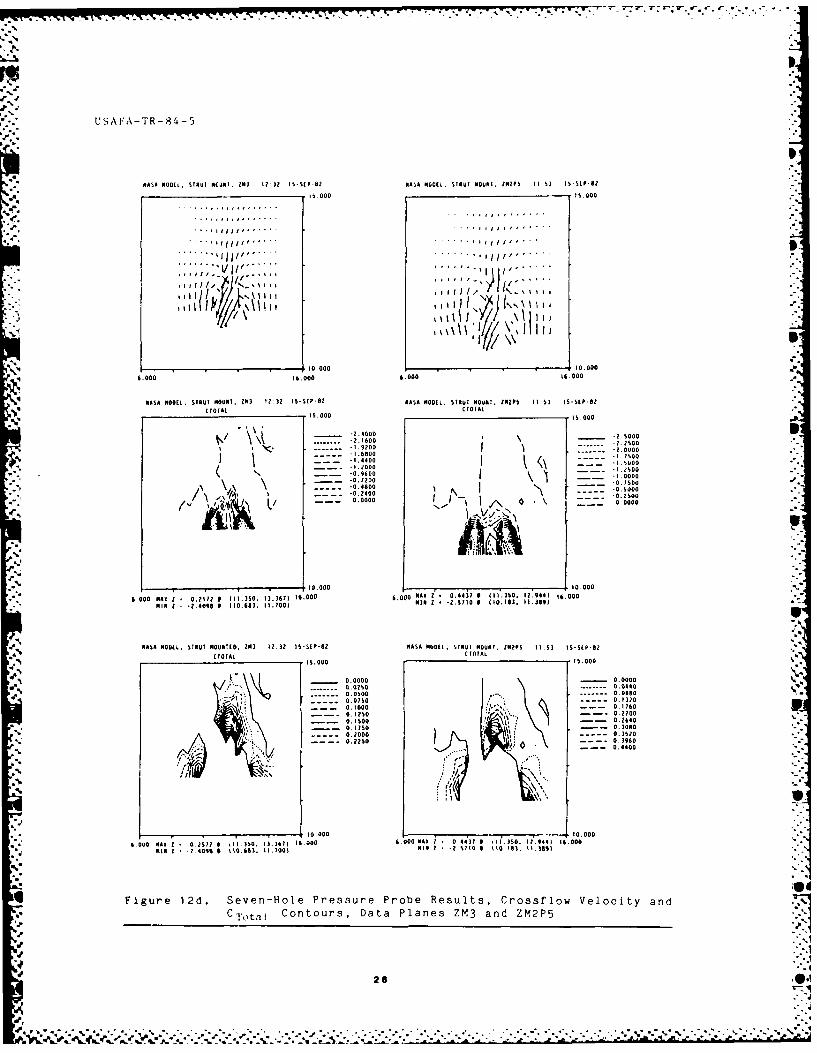
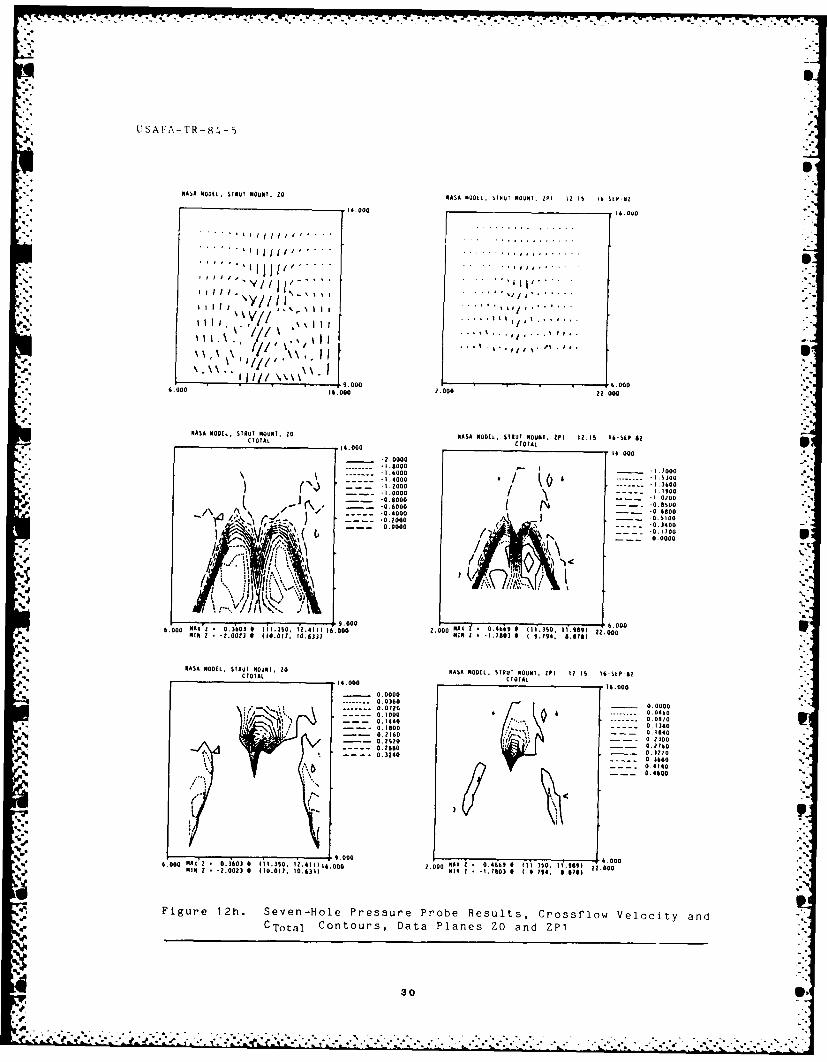
Iqualitative results. Clearly identifiable in the crossflow-velocity
plots is the circulatory nature of the flow corresponding to the
formation of the fuselage/leading edge extension (LEX) vortices. The
vortices are counter-rotating with the direction of rotation being
counterclockwise for the right vortex and clockwise for the left
vortex.
As previously discussed in the Theory section, the vortex wakes
are clearly evident in the contour plots of Figure 12 for the negativev s Cvalues of C Total The contours (constant values of C.l..)t) are
generally elliptical in shape. The values of CTotl proceed from 0
at the boundaries to a minimum negative value of CTotal that should
correspond to the vortex core. Note that in these figures both the
minimum and maximum values of CTota I for each data plane are
presented, as well as their location (x,y). The vortex cores do not
clearly appear until data plane ZM3P25 (Figure 12c), just aft of the
canopy. Their appearance is indicated by the shape of the contours
and the maximum negative value of CTotal ' The vortices then steadily
grow in size (or diffuse) as one moves downstream towards the inlets. p
Multiple low-energy cells first appear at data plane ZM1, as shown by
the negative contour values of CTotal . This data plane is located
just in front of the inlet ramp. The presence of these low-energy
cells, as well as their growth and diffusion, is more apparent in data
planes ZMP5, ZMP75, ZO, ZP1, ZP2, and ZP6. At this high angle of
attack, the vortices have probably burst at or near the LEX wing
juncture; thus, what we see in these data planes is the interference
and blockage effects of the inlet. These effects are also evident in
the crossflow-velocity plots as the vortices lose their definition due
to this interference and the mixing of the burst vrrtex cores with the
local freestream air.
22
4 le

L . .. a . --.
USAFA-TR-84-5
* NASA MODEL. STRUT MOUNT, ZOP2S 11T3S 16-SEP-02 NAUA MOUL, $IU NOU I. J4PTS 10.43 14SEP-0Z
1 ..6.000 16.000
1.00 11.0009 .O00 I1'.000 9.000 I4.00
NASA NODOEL. STRUT MOUNT. ZNSP2S l S 1T-SEP-82 NASA MOEL, STIAT N0OM. ZNNPTS 10.4) 16-SEP-NOC TOTAL C TOTAL
16.000 . 6.000__ .O000 -.0000-
.. 0 000 .......... -0 T0000 .600 0 0 .0 0
___ 0~ 4000
-0. 00000-0.0000 -0.1000
% 0 00
I1I.000 * 11.0009.000 NAX I . 0.4i31 0 I11.5T2. I3.,041 14.000 9.000 MAX 0 0.4100 N II,1.1 13.6441 14.000
I1N 1 -1.0805 0 (11.603. 13.4611 MI 0 * -0.07 0 ITI.04. 13:,001
N.A NOBEL. STRUT MOUNT, ZSP26 11'35 16-SEP-82 NASA MODOL. STRUT MOUNT. 7N4PS 10.43 I-SEP-OZCTOTAL 0TOTAL
00000,1
.......... 0.0000 I .o o. ... 0.1:40 . . . . O O Z0.00 002
0.2060 0.IZIU
0.4600- 0.6 0
0:.000
0.3so
%'.
__4
11 .000111"000
9.00 00 04631N 111.211 14 0.0Oo 0AX I 0,0 0410o ,11.002 10.641 14.000IN0 111.603. 13.4:1) NI 0 0O.100 N 011.004. 13.0001
. Figure 12a. Seven-Hole Pressure Probe Results, Crossflow Velocity and
C Total Contours, Data Planes ZM5P25 and ZM4P75
23
.4. .. . .. -0+
- -- 7777.
.-. -. TY
* - USAFA-TR-84-5
. .°.
NASA MOOEL, STRUT MOUNT. IMAP2 10.06 16-SEP-82 NASA 401 . STILT NOUN?. N43 15 Is Is is-sip 8z
16.000 46 000
,, oi. . . ''t o .- . - . .. 0 I ,, , e.. ..
41111.000~ 1
.. . Adl j//# '' " " " 4I IIi,---.4
. MO. . . STR-- . . ..# . . . .' SRUT I M N Z...... .. - ... . .... .. .- - - I// ..
16.000 1 .000S9000 14.000 9.00 4.0000
N'- #ASA 40001. STRUT 4000. 244P20 10:04 14-SEP-40 NASA 400 , STRUT 4004T. O PS 15:14 IS-SoP-sO*. CTOTAL . 0TOTA6
0.4100 .0000. 0 -0.. : O.000-0.0460 .0.000O
S-0. 1840 -0. 7000
*"o _ __0 .0 - .6 000.1"' 0. 0000 y.__ -0.5000
7 LA. 1 ., ..... -0.S'oo "
0.010:.0..
1.000 0 1.000 .00,.000 414 2 .o-0.4100 ,,,. . 1.000, ,,o0 o 4.000 'A, 0 0.0,, ...,,..,. i.0.. 0.004-412 -,0410 110.06. .90 - --
NS OE.547 001 NPS 104 6-P-2NASA 40001. STRUT MOUNT, 743PT5 15:14 IS-SE.P-NOCI(;OTAL CIOTAL
016.000 16.000
Soooo 0 000 0.1.00...... 0.0660 0.. . 0300OOl O
O,.1300 0 .0600 '
0.1500
-6_- -_ 0.3900 ' - ..100
- 0.4S .- 0100Uo 0. 24000.001., ---
0. 0100
- . ... O.SaSO . .
0.60 0.'2000
0.00 '0. I if 0.0 O
9, 00 E0.000
-0. ID .094.000 * 0.4544 4 I 1.070. 13.144)1 1.0419,0 -0.409 4 1790 3.0 1 7.000 9.000 4'4 0 0.30,1 , ,I,. 972 13.$89; 1.000.40.10 410.0641.000 -1.0410 , 110.906. I,.,21 .00 .
* Figure 12b. Seven-Hole Pressure Probe Results, Crossflow Velocity and9 CTotal Contours, Data Planes ZM4P25 and ZM3P75
4 24. . . . . . . . ..o . -.
tie PN,

USAFA-TR-84-5
N A S A M O D E L . S T R U T M O U N T . Z 3P 1 4 : 4 3 I S .P '8 U N A S A M O D E L , S T R U T M O U N T . 0 0P ? S I 3 I S - W- S P - M
________________________ I5.000 I 0.000
jji . . . . . . . .. . . . . 1 .000 :
6.000 16.• . 0O
NASA MODEL. STRUT MOUNT. ZN3PS 14;43 |5-SEP-82 NASA MODEL, STRUT NOUII. ZI3P25 13.39 iS-R -82CTL .-S.00 S.U0
- 0000
. .-0.70 .V
-0. .0 - - - .6400-0.6740 / _ -. e0.0
-0.400 0* - 16000..... -0.0 40 . -0.T640
-0.00 is 0I O.000.30020 D1.000
0 0 .0 40 1o.oo 06.000 MAN- 0 ; 0 00101 06. 12:11% ) 16' 000' 6.000 :AX 2 • .115900 (1. 00 .2 ) I6.000
"N Z •-0.8234 P I0 O~ IZ.R/81 N Z •-2.8035 1 (12.1, I.OOO1
NASA MODEL. STRUT MOUNT, ZN3F5 14:4J 15-5101-62 NASA NOVEL, STRUT MOUNT, Z4Fl)25 13 91 5 SESP-62
CTOTAL CTOTAL I.0 0.000.0 .0000 0O.0O0
..00 . ... 0. 3 ....... O.O.0
03
- -TO- 0 .080 C O 0..000V 0:.00
0.,.60 v_ 0.','0
0 . 0 0 0 00 . 0 6 0 0
-- - 0.1 0- -- 0.?100
0.000 . ,0.ORO30N.o0 MAX z 0 . l . 12.93 i . o.0o .0 0 M • o I 'I.)SO. 0.. 1.90
MN Z 0. 8234 0 (11.02. 12 .61 "to00.0 M -7.019 9 I 1?.013. 1 6.000
Figure 12c. Seven-Hole Pressure Probe Results, Crossflow Velocity and
CTotal Contours, Data Planes ZM3P5 and ZM3P25
lo2a
26
S"
.. 1!
USAFA-TR-84-5
3060A0A~ N L, SIlU! M( . llJ I?| 3 16-SEP-02 NASA MOOEL, STRUD MOUNT. ZMNPO II S3 15SWP' 11
-. 6 000 .000IS OOO I , 0
.. . . , l*1 ,, ... .~ Il .' .
" , 1 1 1 1/l' ' " . . " ll l l ' . . ."*
...... ...... ... . ......
10.000 10.000
0.000 16.000 6.000 16.000
NASA MODE. STUT MOUNT. 13 12 32 15-SP-82AANDLSD[NUI,[ $ I:] SSPD
.
CTO .AL NASA MODEL, Stout MOUNT. OMOPO 11.53 15.SEP0
I 0 000 6.000TA-. 0 i.000
........ .- ,750
------ -o : \ -,00 oo0
S-----
-?.0
-1.48400 -(.00
0.000_MAo. - .o o -'.
a'.
10.000 ,0.oo0
.02 O Z F 111.350. 13.361) 160.000 .000 MAI 1 0.44311 0 . I0.O44) 10.000MIN 1 -2.4018 g I 10.083. 1100 NIN 0 -0.60(0 O €0.103. 11.389s
MOOA MODEL. 5001 MOUNIED. 013 1:30 10-SEP-02 NASA MODEL. STRO MOUNT. 1N2PS 11.60 I-SEP.02
*C 1010L C TIT A LTOA I.000 015.000
/' " 0.000 - 0.080
..... 0.00. .001
0.000 ---- * 0.000
-1 0.)0 0.130
- 0.2000 \l1 0.11 0010.1000 )\6 ""0.2040
-- -- 0.1) 00 6 , 0.30-- -S. . 000oo I 1'_ . 6. 20
a- --... 0.20 .. 0.3960
% a
0.4400
SN 0 .0 10.000
O 1 . il.. 0,0000 000 NON 2 0 44'31 O III . 930. 1 M44) 16.000
? ) .406 IN 0 S.5,Il O M . , II . 11 1
Figure 12d. Seven-Hole Pressure Probe Results, Crossflow Velocity andCT1 )tat Contours, Data Planes ZM3 and ZM2P5
NP 26'%7
NNN( , .- ... ¢ ; : .. . . .. .. ,.... .. .. .: . _........ ..-. .. . . .. -.....-. .. . .. .. . , . -. ' ...:, ....... ,¢

USAFA-TR-84-5
ISS
0.000 000UNSA OD L. SRU T MlOUN. MZN 22.0 14-S" -82 NASA MODEL{ , S)iQuf ...... INIPS 21 43 . .. .14 .[P"
4.15 C I A 14 000
S. . . . .. . j -'l,. . .• ' ill/i " ".I
....... :12 ......
0 1.660 6.00 140:
400. 10 402.22 222 I-O - 1.40 106 40(1 00u 04. MP 143 I*[4
0 1200 24 000. . . . . .. 110I1- . . . . . . '
-0.2400 -0 0
'1 \o~ ".9200/-\ 260
02.600-.40
I4200.000 9 2006.-000 M' 1.000 . 160"0
1020 -1.0- -O 669
NASA N O L STRUT MOUNT, Z 2 22; U 14-S P- 2 NASA MODEL. SINUD MOUNT, ZNIPS 21 43 14-S[P-82",e
TOTAL C---
A ~JA
45.000 14.000
N 20. -00 4oo--.-.--- 0000/.00 2. 0 . 0 a.000 ...202.0
-2 40402_ II'O ."
. 00 . 0 100 0
S0.0000 a :000
0.04_ 0 -, 0440 "
/ .... -0.20 2 . 000U
- - - 0.1240 ,02
0..226., 0. 20 : , .' . - 0."
0.000 :A6 1 00400 11 11 IOU OD) b .MA0'0 0.4402 0 (4.0
MIt'-245 0.4240.461, 10.0460
0.60 0. 4.,0 400D
"IN Z 2 _9_ i O.B17 0.6NAS MU[. TR T oa Contours Data Planes Z4M2'0 aAANOL UnT, ZM P5 4 I-SP8 .
20i s. 000 /;... __. 00o _ 7
424 2462...20462...842014.O24292 4 22.02.204..
Fiur..e.Sve-Hl Prssr Proe esuts CrsUlo eoi andO
* '; 4o.ou ,
U 270 .lB -

USAFA-TR-84-5
NASA MODEL. STRUT MOUNT, 0I 1:.06 14SEP-02 NASA MODEL. STUT MOUNT. IMP? O u0 13 4 siP-O,14.000 14.000
q . ' # o i . . , , g i l. . .
" " ' I ,,, ' ' l l "
% ., .'- .. ..,"
I I , I , * I l •3 I \ s..I, II
JI. J
I Iooo/ "\\i111/ \\\\\"
%6.00 16.000 .,000i,. .00 0 •000 16.•000
.NASA MODL. STRUT MOUNT. ZMI 21:06 I4-SEP-MO NASA MODEL. STRUT MOUNT. ZNPYS 20 31 14"SEP-M?
CT N TTAL ATOTAL• -TL14.000 14.000
___S__ -2.zo000_ -,.01.000 - -1.1000
- -1.1600 . .. . .. - 000
-. -. -... .......... ... ....-.4000LI--D -0.0100
-- - 0,88,00 '% , X' - - -84,00
fY \ -0.600,.00 .. 100.. .. .0..oo .+,,....,,.2
".0.000
,,~00 A 0) 9.000 .. 000i i~. O0 :AZ 1 .0.i~ (1. .~ ".016. liO0 .O000 MN 2 0 .421l 0 IllIl . i ll 16.000
- .2 Pil 1 -0.lli9 0 3l2.3ll. II.l38l
.5 NASA MODEL. STRUT MOUNT, Zll 21:06 14-SlP-82 NASA MODSLP STRU OALMOUNT. IMP?$ 20.11 14-SEP-N2
mqCTOTAL COA
14.000 14.000
.1 000 SO 00000.0200 0.100i /,...,V' .... ~ oso:,S-....... .. ... o 4o0o
----- - 0.0900 - 0.100
-- - .13O0 O, 6I
S0.16000 .11-00 : ... 0.... 0.30
1.- 1
..... o. 310o603. II .0#3
..... ~~ 0..S4"20-0-
% +"
I'6,00 00 ~ •.O 0MAN6 1,N6 "0.400) 161+000 251) 6 0
WFigure 12f. Seven-Hole Pressure Probe Results, Crossflow Velocity and
CTotal Contours, Data Planes ZM1 and ZMP75
28 .p. ,,9

*~,r.,: .+: -'. ,; ' .-
i ..- 7- -. W' . . . : : :, "- -. ;-"W 5 -. '' r. " . ' -. • "- - - . .
USAFA-TR-84-5
NASA MODEL. STRUT MOUNT. IMPS 190sM " 14sP-? NASA MONDL. STRuT NUI. O I 'MP,
~14.000 - 4 IA D
L". . . . 1Illi . . ,. . . 'Il~i 1..."."
.. .. . Il 1l ".. .' .. . liii,,,. ..
-.- SS ",*'E l!,,~'' , ,,,- '"'.. l,, y .. .
/ / , I." \
1'% I ".'"V .'
I\ \ • II)? .DOD- I// ' ~Il\ , /
_ __. __00_. . . . 16 .000
.000 1, .000
NASA ODLL. STUT NOUN., ZNPS 1I;S] 14-StP-8 NASA MODAL. STOUl OUUNI. Z %POS,TAI 14.000 14.000
-1 - :1.0000
-I.0 8000
1.60 ---AD- j 1.6000- -...._ .000 /,I 0000o
1.. 400 - - --' 00
, _ _ .,.oDo - 1.20000I_ __. -1.000 1.0000
-DAA0_ ._ .4000
'%"~~~~D 0 I2.. OZ0 .. OZ000.- 0.000 T - o.o
-D0D0 1..000
-00.00
* OAO 1O. OO
NASA MODEL. STRUT MOUNIT, ZOlPS |9:53 14"51P'112 NASA 11OUIL, STRUT MlOUNIT. ZlMPZ "
Ct 0TAL (TOTAL 114.000 14.000
0000~~~ M'1 00 0-EPM
0.000 %
.. 00.0"
0.10S?" ".* < A --. o0o I
--- 4 O 4 OSOi
2. 000 0:. 000
10.0 .0
i. 000
0.00 MA, 1 0.1.11 111.111. '1.40 1 0.000M ilM 0 . "-.0 1 0 (1Z1.0. 10.4011
Figure 12g. Seven-Hole Pressure Probe Results, Crossflow Velocity andCTotal Contours, Data Planes ZMP5 and ZMP25
20* * * - .5...
. , .' ~ .* . ' ~ * -
l,. '.! _I _ I I ! I 7 ! 7 7 i ! . . 1 l .1 a , .. ,.- .. - - - . .
TS
USAFA-TR-84-5
NASA NOOiL. STRUT MOUNT. ZO NASA ITULL. SINUT NOUNT, 12l I S 1 I'SLP-8Z
Ill. OOO 6.DOO
.. .. . . I . ..
. .. N.. .I ... . . ..
6.0 161000 2.000 22.000111
NASA . -oill , . .. . .. . ... .,. STRUT ".'5
. ' - " ,As l ' W l, I I . . .. 0 0 "T A ..... 1,6,. ... .. "
. . i..... ., .,0.
l- DO\ .,\A\ '\" I \\.I
0,. 000 /1'6 .OO " 2.00 .000 .3600
NlASA 40O0E.. STRUt mOUNT, 00 nASA NO[L. STRUT NIOUlNI. 223 I2:IO I0-SiP-.02
cretaL .0..0 CT.IAL
0'00 0.0
- - --. 0000 00 ." D
142. - 0000-'.
-1.8000
'_ " -0.00o0" -0. 00S- . -I. 0000 -0.000
0 .000 6 0 .000
_, O Z @J -:-0
(10017 j y.31 f.: 000.30. 00 0000.000 N 1 . . 0 . 0:. o.0 oo AT 0 00.0 o
N - - .14N - O.N0eOO94 0
0.1.000
0 010 0 04 411 0 0 . 300O
-~ 0. 60- 0 0.2300. 0,280 0. TOO
32400000-000 _ _ o. o,-6m000 f 0. a "' "7
KIN z.000.NN N 0 "'0 2 2 0001 0 0'.' 0,"0
0 ~ Figure 12h. Seven-Hole Pressure Probe Results, Crossflow Velocity andCTotal Contours, Data Planes .0 and ZP1
• -
30lo
%-
..ooo , .. . '+] 5i.+ . ,'.o,, -5oozo • ol+, ;+o ,, ) z.o
...... a.0.0..

.........
USAFA-TR-84-5 +1
NASA ~ ~ ~ ~ ~ ~ ~ 40 MODEL. STRUT MON.Z2 4004-L-2NSAMDL 5 IMUT. 270 Is 2) 16 W-642
00 000 l. 000 41
.. .. .......... ....
. . .. . . . . ..... . ..
. I . . . . .. . . ..
0 .0 0 *i/i 6.000
*,,4 . 00 -.... ... ,\ ,,l0000....
% ,0 ".. • " " .000 '.04
- .O0 22.000 1.000 22.000
NASA MODL. ST UT MOUNT. ZPZ 14.40 1-SEP082 NASA MOELL. 0RU0 4U0I. IP I5 2) 16 2P+-$"CIOTAN CLOVAL
16.000 1.000
- I.000 . 140000
.... . 200 - .14 0o0 1 00400 - 1..00
.1.0001
0.1.0 10020
.0. l400 "O0gO00c - - -0.,1 o 00 -0o .oo"-
] _ - - ..o o ___0 -0 .1 0 0o"
JO
1.7
6.000 0.0000 MAX'Z • .i853 9 611.350, 6'.644) 1ZO0 .0 0
. 2 .0 0.443. 002. 11.3331 22.000IN Z - -. 407 0 1 1.60. 9.76)) O0' 70 Z -0.i252 0 0Il.70 , 1J 7l)
NASA NOOIL, STRUT MOUNT. ZP 14:46 16 S0-82 NASA MOEL. 0RU0 40U0I. I IS 7 16-EP 82.4CTOTAL C OA/
16.000 "16.000
- 0.0000... 0.0. 000.0_00__ 0.4400
S0.0.4000
1 0 0.1640( ........ 0.2|0
0.2900__ _ 0.3480*
0.4060'-- 0.4640
O.S220
TV 6 .00 , .00O
.2 .
,ooo.A, 1 .18, ,1., 68,,1 .o0 0oo .0:'1 1: ,,ONil- .-110.001035.* .43 I . l.INMi 1,000
41 000 4.il3. 4.0470 40 2 -1,0247 0 10.704. 0,0001
Figure 121. Seven-Hole Pressure Probe Results, Crossflow Velocity andCTotaI Contours, Data Planes ZP2 and ZP6
31 I
USAFA-TR-84-5
y (in)
LoatonMmC otIVortex Core 0 LEFT VORTEX
HR >8. 0 RIGHT VORTEX
T. N N N 6to
Ji
0&
45 do T I oT TNT. N N 2
A5dg IT I I To IT 4.0 1
o ,( 100IIIT N fp 1111 1 T
VOD 100 fps .
AXIAL
J I..1*-
.1*r
'p3
*0r
0- -4
Oat. Plaes Shownprojecte
Dan Planes showtn p rjecnd
x-xiFigure 13. Vortex Core Locations from Minimum Values of Ct
32 .
, 0
I'SA FA-TR-84-5
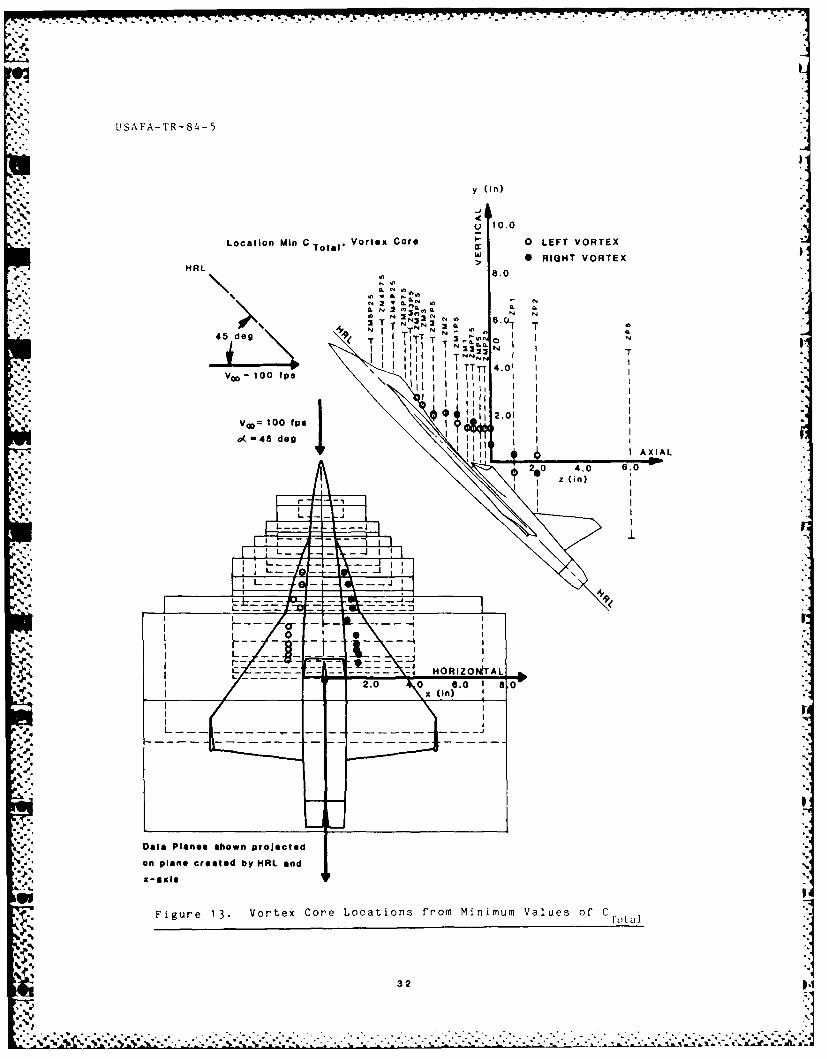
The trace of the vortex cores corresponding to the location of
the maximum negative values of CTota I is shown in Figure 13 for data
planes ZM3P25 to ZP2. As seen in this figure, the vortex cores seem
to originate from the point at which the leading edge of the LEX joins
the fuselage. The decay in the strength of the vortices as one moves
downstream is evidenced by the decreasing absolute magnitude of the
value of CTotaI identified with the vortex core. These values are
listed in Table II by data plane with the location of the particular
vortex associated with the minimum value of CTotS I (L being the left
vortex and R being the right vortex) given. The approximate location
of the vortex cores, in inches, is also presented with respect to the
probe axis system for each data plane. The values in parentheses
indicate approximate or average locations.
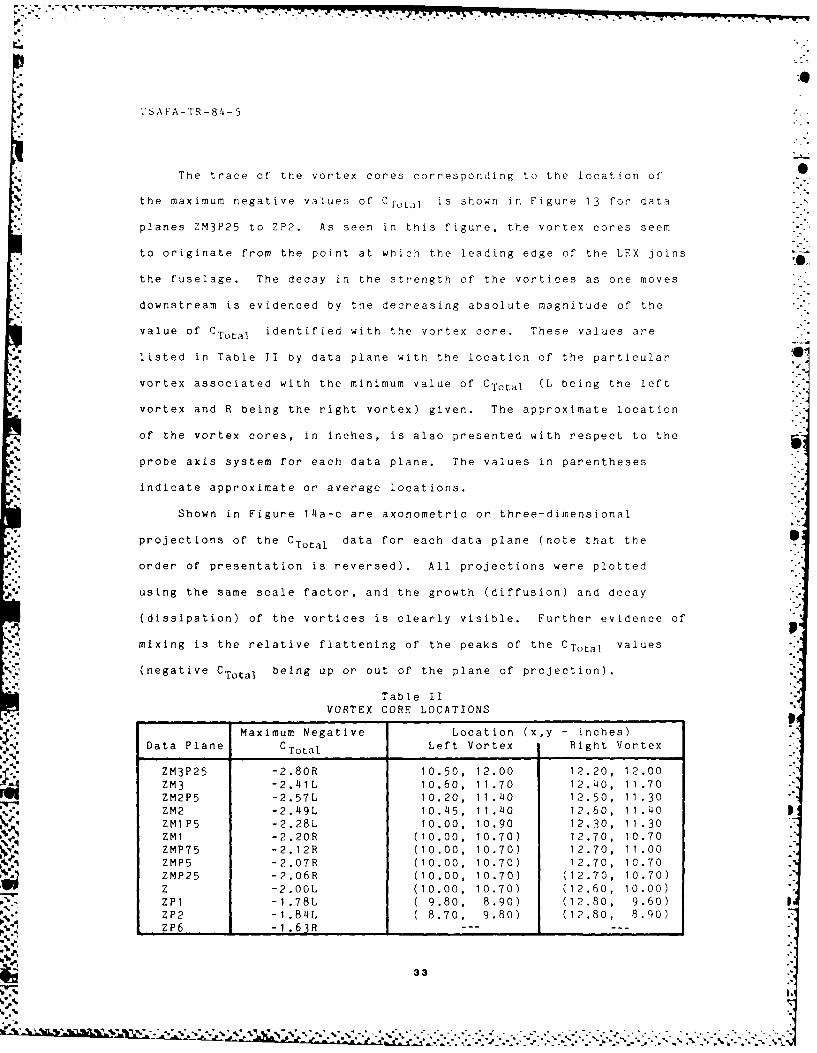
Shown in Figure 14a-c are axonometric or three-dimensional
projections of the CTotal data for each data plane (note that the
order of presentation is reversed). All projections were plotted
using the same scale factor, and the growth (diffusion) and decay
(dissipation) of the vortices is clearly visible. Further evidence of
mixing is the relative flattening of the peaks of the Clotal values
(negative CTotal being up or out of the plane of projection).
Table IIVORTEX CORE LOCATIONS
Maximum Negative Location (x,y - inches)Data Plane CTotal Left Vortex Right Vortex
ZM3P25 -2.80R 10.50, 12.00 12.20, 12.00ZM3 -2.41L 10.60, 11.70 12.40, 11.70
ZM2P5 -2.57L 10.20, 11.40 12.50, 11.30ZM2 -2. 49L 10.45, 11.40 12.60, 11.40ZM1P5 -2.28L 10.00, 10.90 12.30, 11.30ZM1 -2.20R (10.00, 10.70) 12.70, 10.70ZMP75 -2.12R (10.00, 10.70) 12.70, 11.00ZMP5 -2.07R (10.00, 10.70) 12.70, 10.70ZMP25 -2.06R (10.00, 10.70) (12.70, 10.70)Z -2.OOL (10.00, 10.70) (12.60, 10.00)ZP1 -1.78L ( 9.80, 8.90) (12.80, 9.60)ZP2 -1.84L ( 8.70, 9.80) (12.80, 8.90)ZP6 - 1.63 R ...... --
33
N,
~ ~ .. ~ - .-

---'.'-' .--- -.."
U S AFA- rTR- 8 4- 5
NASA MODEL, STRUT MOUNT. ZP6 15 27 16-SEP-82 NASA MODEL, STRUT MOUNT, ZOETOTAL C tOI AL
S16.000
6.000 .._00* .. 2.000 22.000 6.000 16 .000
6.6.00
NASA MODEL, STRUT MOUNT. ZP2 1 A46 i6-SEP-82 NASA MODEL, STRUT MOUNT, ZMP25" CTOTAL CTOTAL
16.000 14.000
2.000 6.000 9.000
2.000 2.000 6.000 .000
,. 5NASA MODEL, STRUT MOUNT, 27 1?15 16-SEP-82 NASA MODEL, STRUT MOUNT, ZMP5 19:53 14SEP- 82CTOTAL CTOTAL
16.000 4 .00077-6.000 \'. -~ - h900
2.000 22.000 6.000 6.000
N.,
'
* Figure 1 4a. Axonometric Projections, CTot;I , Data Planes ZP6 to ZMP5
34

U S A FA -1, - -8 5
NASA MODEL. STRUT MOUNT, ZMP75 20:31 14-SLP-82 NASA MODEL, STRUT MOUNT. MI I? 20 4-AEP U
CTOTAL (TOTAL
14 000 0.O006.000 6 000 6.000 16.000
NASA MODEL. STRUT MOUNT, ZMI 21:06 14-SEP-82 NASA MODEL, STRUT MOUNT, ZKZPS 11 53 TO SEP 82
CTOTAL CTOTAL
14.000 15.SOD
9.000 I0.000
6.000 16.000 6.000 16.000
NASA MODEL. STRUT MOUNT, OMIP5 21:43 14-SEP-82 NASA MODEL, STRUT MOUNT, ZM3 12:32 15-SEP-82
C TOTAL CTOTAL
J T4.000 15.000
9. 000 10.0006.000 16.000 6.000 16.000
Figure 1I4b. Axonometric Projections, C.ITtT1 , Data Planes ZMP75 to ZM3
35
I--0
L AFA- T R -4-5
NASA MODEL, STRUT MOUNT, ZM3PZ5 13 3 9 15-SEP-82 NASA MODEL, STRUT MOUNT, UM4PZ5 10 06 T6-St P-82%C TOTAL C TOTAL
1. 0 .0 0600
6.000 16.000
9.000 14 .'00 0
NASA MODEL. STRUT MOUNT, ZM3P5 14:43 15-SEP-82 NASA MODEL, STRUT MOUNT. UM4P?5 10:43 16-SEP-82CTOTA. COtAL
--Appp~v 15,.000 1.0
~K~\ 10.0006.000 16.000
11.0009.000 14.000
PNASA MODEL, STRUT MOUNT, ZM3P75 15;18 15-SEP-82 NASA MODEL. STRUT MOUNT, ZM5P25 11:35 16-SEP-82CTOTAL CTUTAL
11.00D 11.0009.000 14.000 9.000 14.000
Figure 14~c. Axonometric P-ojections, CrFotai1 Data Planes ZM3P25 to
% ZMS P25
36

S
USAFA-TR-84- 5
S
S
.4. SV..
*44***
S
S
S
'44. 134..
S
.4.-
S
~1'
Figure 15. Surface Oil Flow, Northrop VATOL Model at 245 Degree Angleof Attack
~.1**4.
- 4.
37
* S
~4~4 4 . .. -. .*.~**. .... '.\ ...-. >. *x> ~ 4**~4*** 4'. .. -- ,-. .4 - - - -- 4 ~. - ..............
- - ~ ~ .~.2. -. -
USAFA-TR-84-5
I
""1
'p'
+ I:
SEPARATION LINE SATTACHED FLOW +
SEPARATION LINE
SEPARATED FLOW
LU
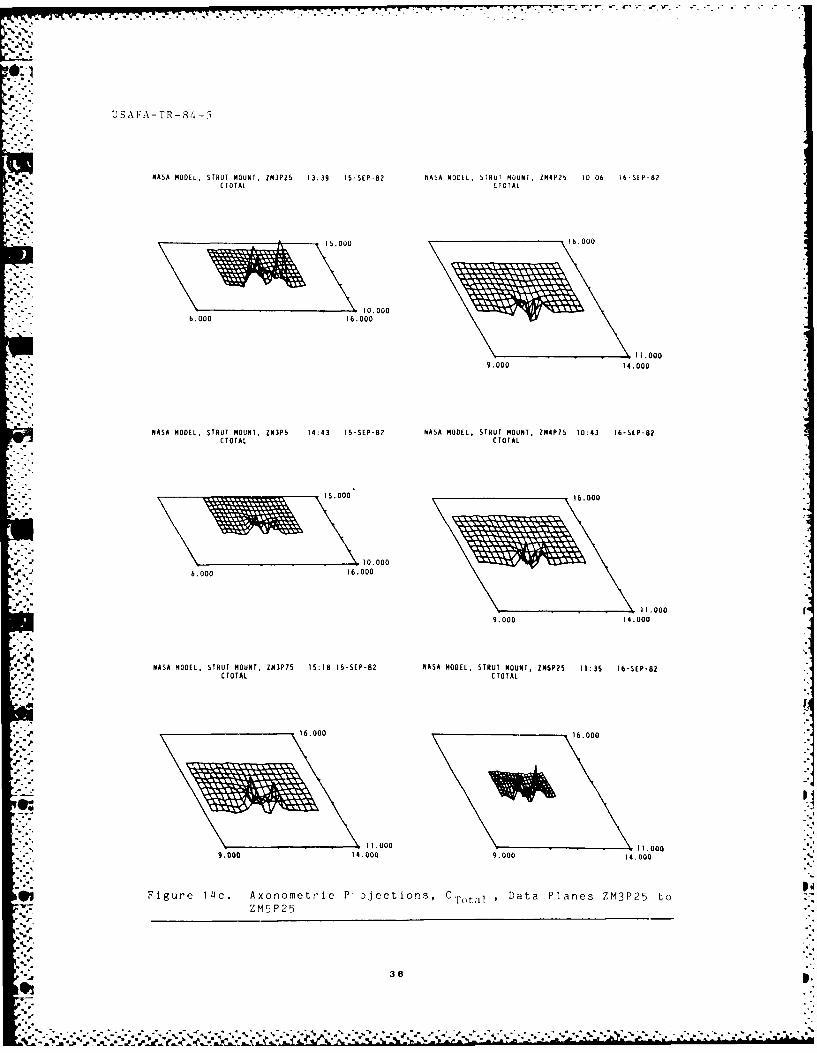
Figure 15. Surface Oil Flow, Northrop VATOL Model at 45 Degree Angleof Attack, Continued
Surface oil flow results at the same test conditions are shown in
Figure 15. The traces of the counter-rotating vortices productng an
*~:'' outwash and the separation line near the leading edge of the LEX are 4
clearly visible. The surface oil was applied rather liberally to
determine if there were any strong reverse flow patterns near the
trailing edge of the wing. As can be seen, the flow has fully
separated over the entire aft portion of the wing with no indication
of reverse flow. In fact, the main lifting surface shows regions of S-
separated flow except near the inlets. The flow around the inlets
38
~~~~~~~.. .. . . . . .......... ".................*..''......r| "" -I i- -I•
'4'
4--
USAFA-TR-84-5
'lei @1
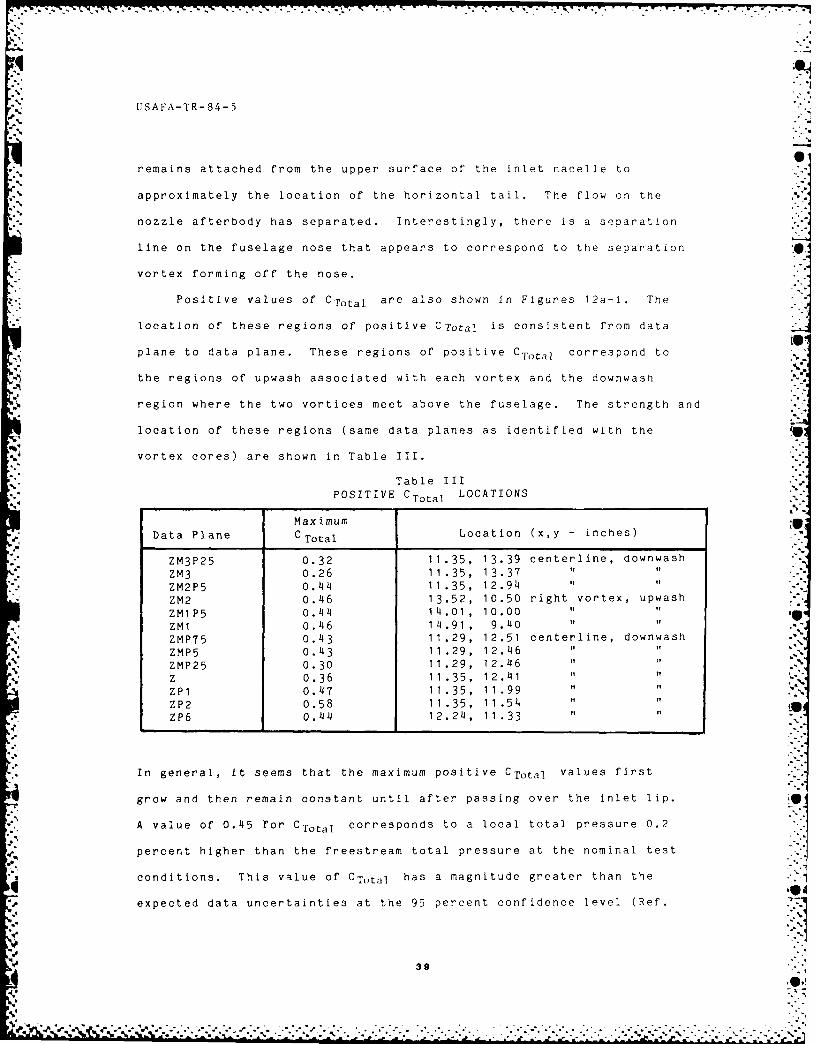
remains attached from the upper surface of the inlet nacelle to
approximately the location of the horizontal tail. The flow on the
nozzle afterbody has separated. Interestingly, there is a separation
line on the fuselage nose that appears to correspond to the separation "W
vortex forming off the nose.
Positive values of CTotal are also shown in Figures 12a-i. The
location of these regions of positive CTotal is consistent from data
plane to data plane. These regions of positive CTotaI correspond to .4
the regions of upwash associated with each vortex and the downwash
region where the two vortices meet above the fuselage. The strength and
location of these regions (same data planes as identified with the
vortex cores) are shown in Table III.
Table IIIPOSITIVE CTotal LOCATIONS
1%
Max i mum
Data Plane CTotaI Location (x,y inches)
ZM3P25 0.32 11.35, 13.39 centerline, downwash
ZM3 0.26 11 .35, 13.37 "
ZM2P5 0.44 11.35, 12.94 It
ZM2 0.46 13.52, 10.50 right vortex, upwash
ZM1P5 0.44 1 4.01 , 10.00 " It
ZM1 0.46 14.91, 9.140 " "
ZMP75 0.43 11.29, 12.51 centerline, downwash ,-ZMP5 0.43 1 1.29, 12.46 " "
ZMP25 0.30 11 .29, 12.46
Z 0.36 11 .35, 12.41 " " '.
ZP1 0.47 11.35, 11.99ZP2 0.58 11.35, 11.54 "
ZP6 0.44 12.24, 11.33""
In general, it seems that the maximum positive CTotal values first
grow and then remain constant until after passing over the inlet lip.
A value of 0.45 for CTotaI corresponds to a local total pressure 0.2
percent higher than the freestream total pressure at the nominal test
conditions. This value of CTotaj has a magnitude greater than the
expected data uncertainties at the 95 percent confidence level (Ref.
39
'-7-
'- 5.. .-
USAFA-TR-84-5
5). That these readings exist and are consistent from data plane to
data plane indicates that they either exist or are the result of an
idiosyncrasy of the seven-hole pressure probe. The second alternative
appears more likely at this time; that is, the positive CTota1
"* readings result from the physical interaction and limitations of the
probe in regions of high shear flow. Several studies of the
seven-hole pressure probe are being conducted at present to quantify
*' these limitations. The results of two of these efforts -- a correlation
of the seven-hole probe measurements with hot-wire anemometer
measurements in an airfoil wake or low shear flow and an attempt to
measure the actual pressures in these positive regions of CTotal using
total pressure probes -- appear in Sections B and C below.
B. Airfoil-Wake Measurements
*- Measurements of the velocity profile through the wake of an
NACA 0015 airfoil were made at a location 3 chord lengths aft of the
airfoil's trailing edge. The airfoil model was set at a nominal angle
of attack near 0 degrees, and the tests were conducted at test-section
velocities of 60 ft/sec and 100 ft/sec. Measurements of the velocity
profile (velocity deficit) were made using a single-wire, hot-wire
anemometer and the seven-hole pressure probe. The wake surveys were
made at the centerline spanwise station of the airfoil model. The
seven-hole pressure probe data consisted of three passes through the
airfoil wake at this location. Each pass through the wake was in the
opposite direction from the previous pass. Although the pressure data
is not presented, there was no evidence of positive values of CTotal
through the wake, and the static pressures were very nearly equal to
the freestream static pressure at this data plane location. This
correlation is to be expected from the theoretical model presented
40

o
. I I E B , .o-
USAFA-TR-84-5
earlier. As can be seen from Figure 16, the velocity profiles compare
very well, especially at the higher velocity (100 ft/sec), as one
would expect. The seven-hole pressure probe data is within 3.4
percent at 60 ft/sec and 0.7 percent at 100 ft/sec of the peak
velocity deficit measured by the hot-wire anemometer. Both values are
within the 95 percent confidence level of uncertainty, based on Mach
number, of the seven-hole pressure probe data acquisition system (Ref.
5). There was no evidence of hysteresis in the seven-hole pressure
probe measurements based on the direction of the probe' , traverse
through the wake.
C. Positive CTotal Measurements
Measurements of local total pressure, and thus CTota1, were
made using three different pressure probes at the data plane ZMP75 on
-. the Northrop VATOL model. Regions of positive local total pressure
coefficient, CTotalI were identified using the seven-hole pressure
-pprobe, as shown in Figure 11. At specific points in these regions,
two total pressure probes (one aligned with the freestream flow and
one aligned with the local flow) were inserted to measure the local
total pressure. The results for the point (11.80, 12.50) in the data
*Z plane ZMP75 are summarized in Table IV. It should be noted that the r
local flow angle at this point was determined from the seven-hole
pressure probe data to be c = -23.41 degrees with negligible sideslip.
The angle of the bent probe was 23.8 degrees, which is within the data
uncertainty of the seven-hole pressure probe measurements.
% 41
..
*• *

USAFA-TR-84-5
62
o 0
00
0 0_-
w58
1.0 2.0
DISTANCE (in)
0Seven Hole Pressure ProbeI
MenValue, Hot Wire Anemometer
001020
1. 0
> 0
00
:% 0-~98
1.w.DIT N E(n
Fi ur 6. Ve o it P o il s h ou h n Ai fo l Wa e, S ve -H lPrs ur ro ean otW r A e omt r tTe tSe t o
Figur 16.Velocitie Pofle thrug and Airoi Wakevn-ol
42
- %-4
USAFA-TR-84-5
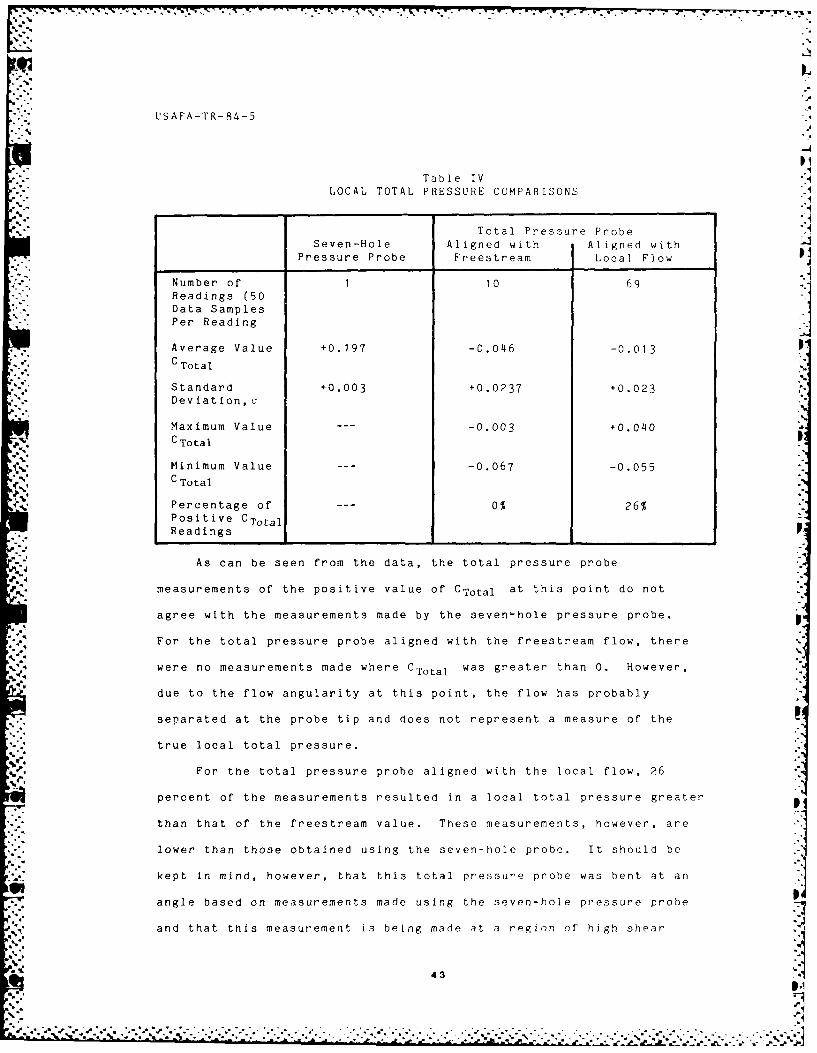
IITable IV
LOCAL TOTAL PRESSURE COMPARISONS
Total Pressure ProbeSeven-Hole Aligned with Aligned with
Pressure Probe Freestream Local Flow
Number of 1 10 69Readings (50
Data SamplesPer Reading
Average Value +0.197 -0.046 -0.013C Total
Standard +0.003 +0.0237 +0.023Deviation,o
Maximum Value -0.003 +0.040CTotal
Minimum Value -0.067 -0.055C Total
Percentage of 0% 26%Positive CTotaI
Readings
As can be seen from the data, the total pressure probe
measurements of the positive value of CTotal at this point do not
agree with the measurements made by the seven-hole pressure probe.
For the total pressure probe aligned with the freestream flow, there
were no measurements made where CTotal was greater than 0. However,
due to the flow angularity at this point, the flow has probably
separated at the probe tip and does not represent a measure of the
true local total pressure.
For the total pressure probe aligned with the local flow, 26
percent of the measurements resulted in a local total pressure greater
than that of the freestream value. These measurements, however, are
lower than those obtained using the seven-hole probe. It should be
kept in mind, however, that this total pressure probe was bent at an
angle based on measurements made using the seven-hole pressure probe
and that this measurement is being made at a region of high shear
43
a. I
-4
USAFA-TR-84-5
flow. If the shear or velocity gradient at this point is such that
holes on opposite sides of the seven-hole pressure probe see
significantly different velocities, then the local flow angularity
measurement could be in error as well. If this measurement of local I
flow angle is then substantially in error, the flow around the tip of
the total pressure probe supposedly aligned with the local flow could
also be separated. Separated flow around the tip would lead to
measurements which would not represent the true local-total pressure.
Nevertheless, the average value for CTotal based on these measurements
was negative, which corresponds to the theoretical model presented
earlier. The maximum positive value of CTotal measured with this
total pressure probe, +0.040, is within 2.3 standard deviations of the
mean value, -0.013, or within the 97.9 percent uncertainty band.
Although these contradictions do not exclude the possibility that
the regions of positive CTotal measured by the seven-hole pressure
probe do exist, they seem to indicate that the readings may be
erroneous in regions of high shear flow. It must be recalled that at
present the seven-hole probe is calibrated in a uniform flow. The
regions where the positive values of CTotal have been measured by the
seven-hole pressure probe are regions of high shear gradients whose
effect may not be properly accounted for in this data reduction and
whose limits need to be defined. These results do not imply, however,
that the seven-hole pressure probe data is not useful, since it has
more than demonstrated its value in mapping hitherto undefined
external flow fields.
VI. Summary
The external flow field on a 1/40th-scale model of the Northrop
VATOL configuration was mapped using the seven-hole pressure probe
44
.W -]'-+ ' . F '.-. . - ' • ' .... ".J- .'-' '-'- - . F' . -w-,w; 4 " -'-.w-.... . .. . .-. - -.- * .. .-. -... . - .
USAFA-TR-84-5
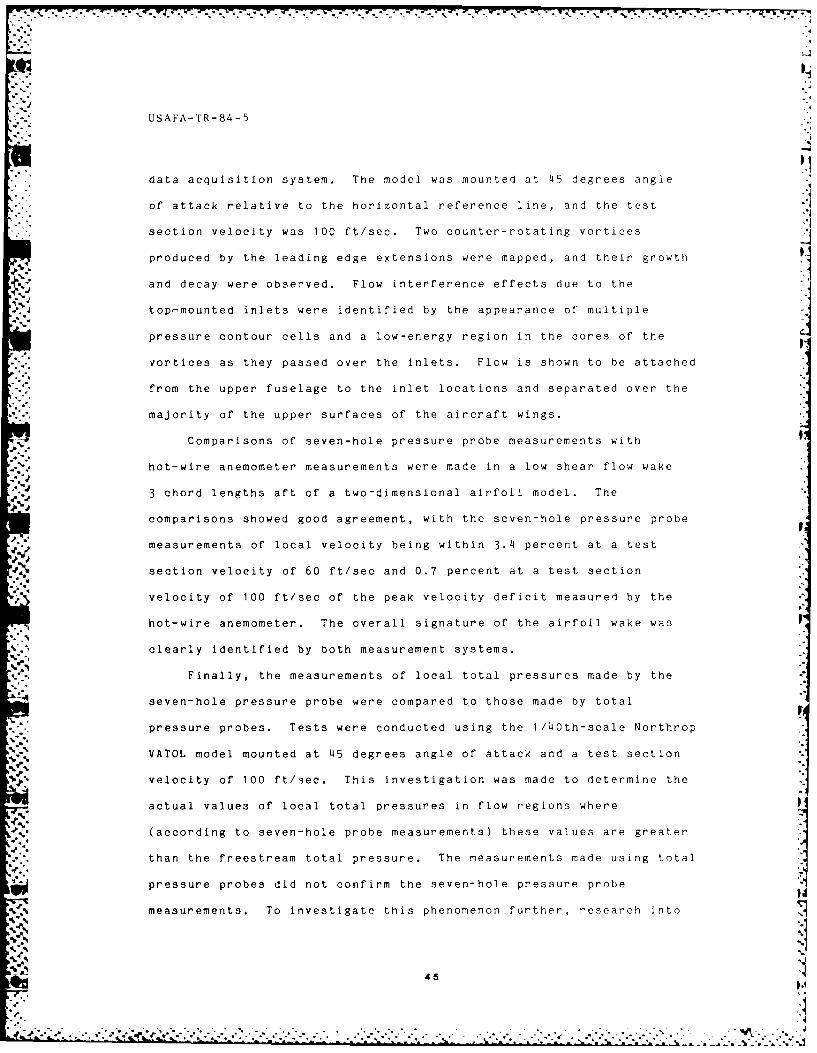
data acquisition system. The model was mounted at 45 degrees angle
of attack relative to the horizontal reference line, and the test
section velocity was 100 ft/sec. Two counter-rotating vortices
produced by the leading edge extensions were mapped, and their growth
and decay were observed. Flow interference effects due to the
top-mounted inlets were identified by the appearance of multiple
pressure contour cells and a low-energy region in the cores of the
vortices as they passed over the inlets. Flow is shown to be attached
from the upper fuselage to the inlet locations and separated over the
majority of the upper surfaces of the aircraft wings.
Comparisons of seven-hole pressure probe measurements with
hot-wire anemometer measurements were made in a low shear flow wake
3 chord lengths aft of a two-dimensional airfoil model. The
comparisons showed good agreement, with the seven-hole pressure probe
measurements of local velocity being within 3.4 percent at a test
section velocity of 60 ft/sec and 0.7 percent at a test section
velocity of 100 ft/sec of the peak velocity deficit measured by the
hot-wire anemometer. The overall signature of the airfoil wake was
clearly identified by both measurement systems.
Finally, the measurements of local total pressures made by the
seven-hole pressure probe were compared to those made by total
pressure probes. Tests were conducted using the 1/40th-scale Northrop
% VATOL model mounted at 45 degrees angle of attack and a test section
% velocity of 100 ft/sec. This investigation was made to determine the
actual values of local total pressures in flow regions where
.4. (according to seven-hole probe measurements) these values are greater
"' than the freestream total pressure. The measurements made using total
pressure probes did not confirm the seven-hole pressure probe
measurements. To investigate this phenomenon further, research into% %
45.
• 2i-~~~~~~~~.. ... :' +, ---- .. :........•.... ... :. .......- ,.-.-..........-.-..-.-.. ..- :+.......'~~~~~~~~~~~~~. ..- . .. . . ...... ,,.-. ...- '-.. , ++ . . .., . . . . . •.. .+.. .. .. . ,. .. : .+. -". :.

L
V-- .- USAFA-TR-84-5
seven-hole pressure probe characteristics in regions of high shear
flow, such as the flow typically encountered in viscous vortex wakes,
-"V is recommended.
Symbols
English Symbols
A area, inches 2 or feet 2
ALPHAT angle of attack, degrees
BETAT angle of sideslip, degrees
CStatic dimensionless coefficient, P7, P /Po P
. CTotal dimensionless coefficient, P. /PO P_
d distance, inches or feet
HRL horizontal reference line
M Mach number
p pressure, psi or psf
r radius, inches or feet
(r,q) polar coordinates
t time, seconds
(Ur U, velocity components, polar coordinates, fps
(u,v,w) velocity components, Cartesian coordinates,
fps
V velocity, fps
(x,y,z) Cartesian coordinates, inches or feet
iGreek Symbols
L "T angle of attack, degrees
% , T angle of sideslip, degrees
r circulation, ft'/sec
j'4 kinematic viscosity, ft-/3ec
density, slug/ft2
46
-.. 14" .".,".,,, -'. ,'% ' ''..,e, ",', '. ,, ',¢. ..r "L..".L~r ,' -' ,,. ",. ''. . "- ".". " ". " "' ","" -"." "'."'," " ."- ", -. '. ." -'."'-" -",
. .USAFA-T,,-84-5
standard deviation
Subscripts
local conditions
0 total or stagnation conditions
freestream conditions
References
1. Durand, W.F., Aerodynamic Theory, Vol. III. Div. F-i, Berlin,
Julius Springer, 1935.
2. Sisson, G. and R. Crandall, "Canard Wake, Measurement and
Description," Aeronautics Digest, USAFA-TR-81-4, USAF Academy, May
1981.
3. Nelms, W.P. and D.A. Durston, "Preliminary Aerodynamic
Characteristics of Several Advanced VSTOL Fighter/Attack Aircraft
%': Concepts," SAE Paper 801178, SAE Aerospace Congress and Exposition,
-. Los Angeles, California, 13-16 October 1980.
4. Smeltzer, D., W. Nelms, and T. Williams, "Airframe Effects on a
Top-Mounted Inlet System for VSTOL Fighter Aircraft," AIAA-81-2631,
AIAA/NASA Ames VSTOL Conference, Palo Alto, California, 7-9 December4.--.
1981.
5. Gerner, A., G. Sisson, et al., Seven-Hole Probe Data Acquisition
System, USAFA-TN-81-8, 18 November 1981.
%
~47
:,..-
* 4
L: I A --'A- 84R-- 5
EXPERIMENTAL MEASUREMENTS OF WAKE CHARACTERISTICSOF LOW ASPECT-RATIO DELTA AND FLAPPED-PLAT- PLANFORMS
C.R. Kedzie* and K.E. Griffin**
Abstract
This report documents the characteristics and location of the wakes
for two generic lifting-surface planforms. The geometric description
locates these wakes as they develop downstream from a low aspect-ratiodelta wing and a bent-plate wing. The wakes are depicted graphically
. at several locations downstream from these wings, with accompanying
cross-velocity vector plots to assist in their interpretation. The data
used to determine the wake characteristics was obtained by surveyingeach wing's flow field with a seven-hole pressure probe.
I. Introduction
For this project, we used a seven-hole probe to measure tle wakes
produced by two simple planform shapes: (1) a low aspect-ratio flat
plate with a 50 percent chord flap deployed 20 degrees and (2) a low
aspect-ratio delta wing. These planforms were tested at low speeds and
moderate angles of attack to study their wake characteristics. In the
past, R.H. Wickens worked with these planforms to demonstrate lifting'
surface wakes using such flow visualization techniques as the water
table and dye methods described in Ref. 1. The following data
4%: represents flow visualizations at higher Reynolds numbers (where the
vortex systems exhibit the turbulence that is characteristic of an
aircraft's lifting surfaces) and also at higher freestream pressure and
velocity values. The planforms analyzed here are the same as those used%*. to develop analytical methods (such as those found In Ref. 2) for
predicting the effects of lifting~surface wakes. These analytical
' ,.methods use mathematical functions called singularities to model the
wake trailing a lifting surface. Not knowing the location of the wake,
however, has limited the usefulness of these methods. The experimental
values of pressure and velocity reported here will provide the necessary
wake locations and downwash velocity values for correlation with the
e! *Cadet, USAF Academy
**Captain, USAF Academy, Associate Professor of Aeronautics, CFAN
48

analytical predictions for these planforms.
The first planform configuration (Figure 1) ' e t thn
midchord so that the trailing half simulates a trailing >: :fcte>
downward by a 20-degree angle. The angle of attack of this planform is
measured with respect to the front half of the plate. This bent plate
configuration is interesting because of the effect of the bend on the
structure of the tip vortex. The discontinuity in slope at the midchord
produces a secondary vortex, which interreacts with the main vortex
created at the wing tip. In fact, when we observe experiments with very
low Reynolds numbers, we see that this secondary vortex core becomes
embedded in the wake wrapped around the core of the wing tip's main
vortex. This secondary vortex core, caused by the midchord bend,
provides a pressure characteristic, or signature, in the main vortex
system that can be observed at downstream locations. The rotation rate
of the main vortex can then be determined by observing the change in
angular position of this pressure signature in successive locations
(planes) downstream of the plate.
The second planform configuration is shown in Figure 2. This
highly-swept delta configuration produces a leading edge/tip vortex
system similar to that observed around the strakes of modern fighter
aircraft. This vortex system builds in strength when moving streamwise
along the leading edge. Downstream, it wraps the trailing edge wake up
and in towards the centerline of the model. Since modern fighter
configurations use this strake vortex to delay flow separation over
their primary wings, it is of critical importance to know the location
and strength of this type of lifting-surface vortex system.
49
"'.

V ,
6I
v 3
12'1
Figure 1 . Model Geometrf. for Bnnt Plane
)727V -.
ce 6-
12"
* F i g ur e 2 . 'ld(, e I Co m et r V f or Del t .i P] ine
50

USAFA-TR-84-5
II. Background
Test engineers working at the Aeronautic Laboratory of the USAF
Academy have developed an experimental technique that can measure
pressure and velocity information from steady fields even with highly
irregular flows. The test technique uses a multi-port pressure probe
linked to a computer system that produces real-time flow field data for
any geometric location in which the pressure-probe tip can be
positioned. This particular seven-hole pressure probe was first
developed to measure incompressible flow at the USAF Academy under the
sponsorship of the NASA Ames Research Laboratory (Ref. 3). The probe's
capabilities were later expanded to include supersonic testing. This
probe is now being used in ongoing research to document the
characteristics of lifting-surface wakes, particularly those created by
the X-29 Forward-Swept Wing Flight Demonstrator. In the first wake
survey, experimenters used the seven-hole probe to study a generic
canard/swept-wing configuration (Ref. 5). This study of the delta and
bent-plate planforms provides background information on lifting-surface
wakes that will be used later in an in-depth investigation of the
canard/wing wake interaction of a 1/10 scale model of the X-29
Forward-Swept Wing Demonstrator Aircraft.
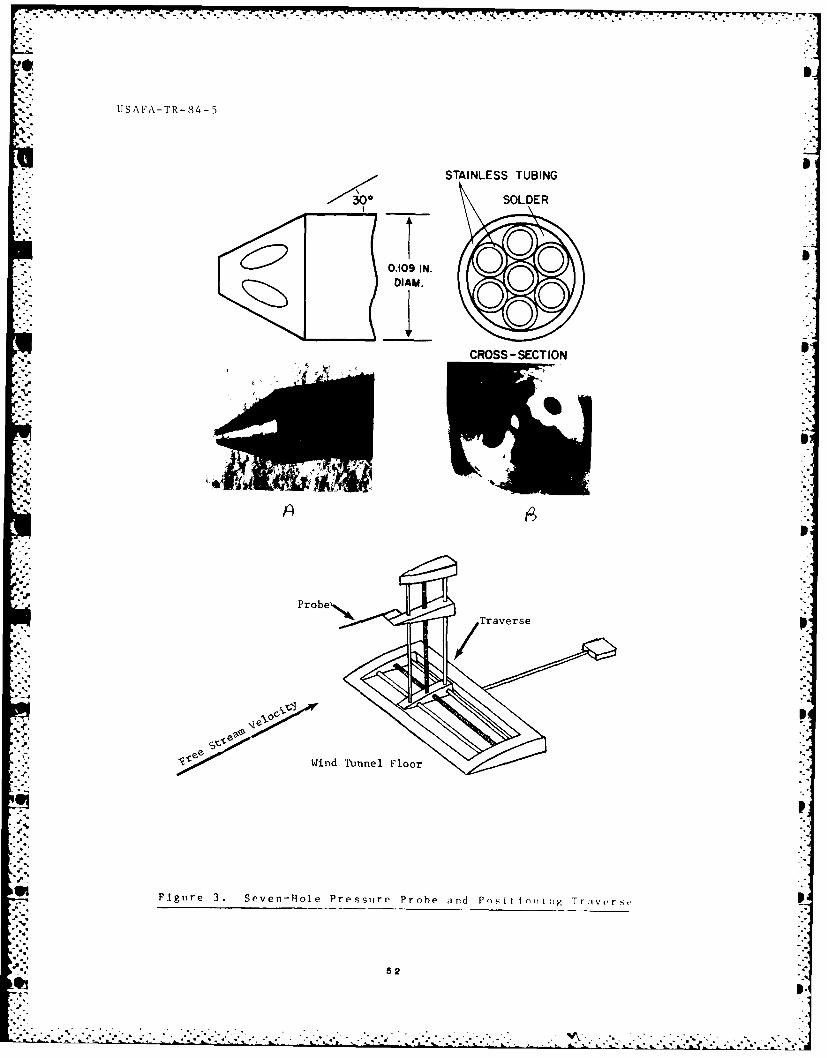
The seven-hole probe used for these wake studies is shown in Figure
3. Because the probe is small (.109 inches in diameter), one can
Vposition it inside the near flow fields of moderately-sized wind tunnel
models without significantly disturbing those flow fields. The position
of the probe is maintained by an automated device called a traverse, O
which can precisely position the probe anywhere in the test section.
Since this positioning traverse is controlled by the wind tunnel
computer, the probe location can be loaded into the computer as a series
of coordinate points.
"- WS]
USA FA - TR-84-5
STAINLESS TUBING
SOLDER
0.109 IN.0DIAM.
40 0CROSS -SECT ION
Prob~p. ~Traverse
I Wind Tunnel Floor
Figure 3. Seven-Hole Pressure Probe aind Positioniig Travors,.
52

UbA 'A-IK-64-i
The probe is made up of a pressure port at its centerline
surrounded by six pressure ports on its conical face. The seven
pressure ports are connected to electronic pressure transducers by
small-diameter tubing. With these transducers providing electrical
analogs to the pressures, a computer can then directly supply the
digitized values of raw pressure at these port locations.
Seven sets of fourth-order polynomial equations were used to derive
flow field pressures and velocities from the raw pressure values
measured at these seven pressure ports. These equations, along with the
non-dimensionalized forms of their coefficients, are presented in Ref.
4. Calibration tests at known flow conditions establish the
coefficients, which then remain stored in a data-acquisition computer
for use with unknown flow fields. Using the raw pressure data from the
seven-hole probe, these equations, with their calibrated coefficients,
provide a means of calculating the more useful values of total, static,
and dynamic pressures and velocity vectors at any selected point in the
S."flow. The pressure and velocity values for each data point are recorded
on high-speed disk storage for later use.
The data points for the tests are arranged in planes having common
streamwise coordinates. This procedure makes it easier both to acquire
and present data. The planes are chosen at various streamwise locations
"* as measured from the trailing edge of each model. By locating the wake
characteristics at each streamwise position in the flow, one can observe
and interpret their development as the flow proceeds.
With a complete set of pressure and velocity data stored for each
data point, one can quickly generate velocity-vector and pressure-
contour plots in the data planes as testing proceeds. This insures that
all of the important locations in the flow field are surveyed in each
data plane. Later, these plots can be used to locate important flow
53
.,... .' .' .. -. .. . . .- - -. - .,. * , - *' *" -- *-. .-. *, ' . - ..- . .. -.-. . . . . .- . .
USA FA-TR- 84- 5
characteristics such as vorticity, wakes, and downwash for final
interpretation of the lifting-surface wakes.
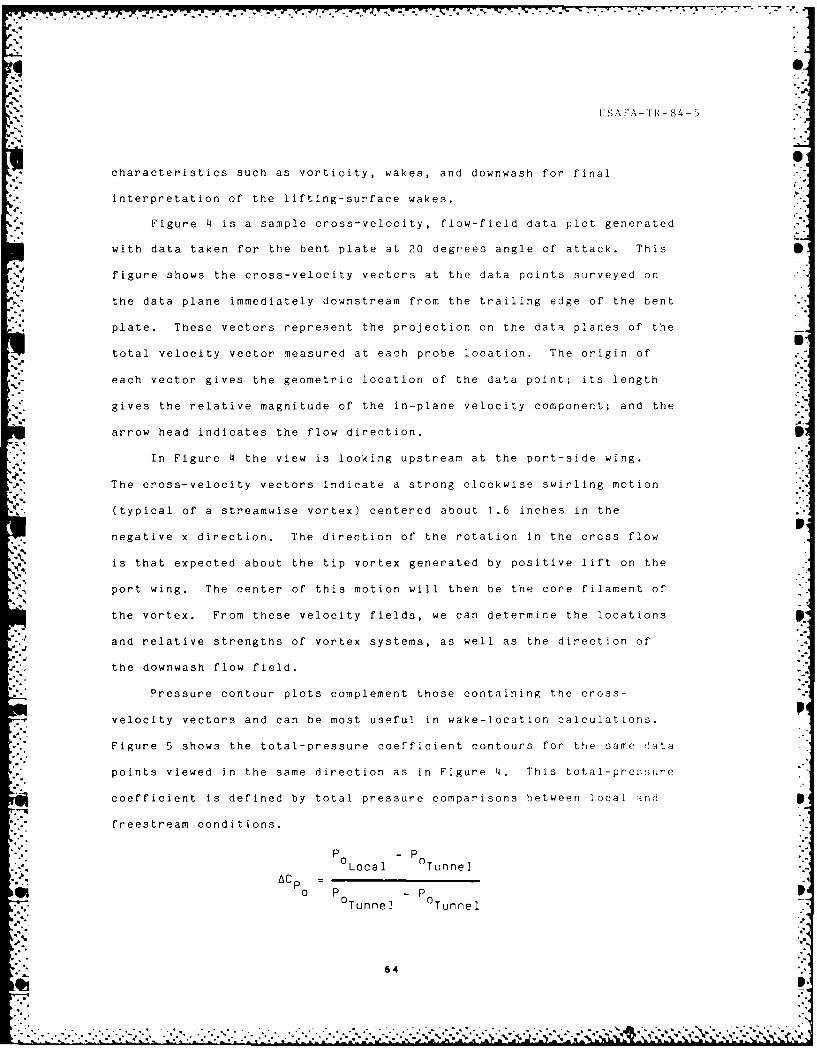
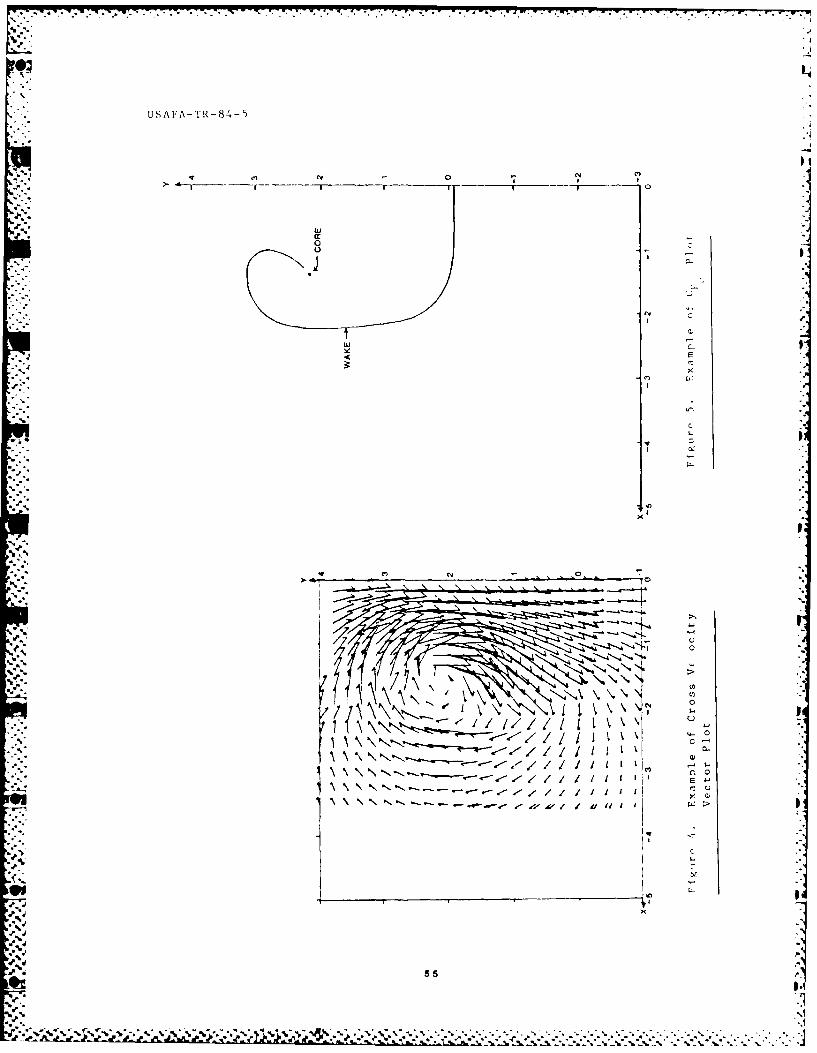
Figure 4 is a sample cross-velocity, flow-field data plot generated
with data taken for the bent plate at 20 degrees angle of attack. This
figure shows the cross-velocity vectors at the data points surveyed on
the data plane immediately downstream from the trailing edge of the bent
plate. These vectors represent the projection on the data planes of the
total velocity vector measured at each probe location. The origin of
each vector gives the geometric location of the data point; its length
gives the relative magnitude of the in-plane velocity component; and the
arrow head indicates the flow direction. S
In Figure 4 the view is looking upstream at the port-side wing.
The cross-velocity vectors indicate a strong clockwise swirling motion
(typical of a streamwise vortex) centered about 1.6 inches in the
negative x direction. The direction of the rotation in the crcss flow
is that expected about the tip vortex generated by positive lift on the
port wing. The center of this motion will then be the core filament of
the vortex. From these velocity fields, we can determine the locations
and relative strengths of vortex systems, as well as the direction of
the downwash flow field.
Pressure contour plots complement those containing the cross-
velocity vectors and can be most useful in wake-location calculations.
Figure 5 shows the total-pressure coefficient contours for the same data
points viewed in the same direction as in Figure 4. This total-presure
coefficient is defined by total pressure comparisons between local and
freestream conditions.
P -P
AC Local Tunnel
10 P 0P 0l
Tunnel Tunnel
54:-:.: , :?I
. .. . . . . . . . . . . . .',
USAFA-TR-84- 5
T r
Y c
wUE
x
0-
(C.
It I
55
" m.* * . .-
USAFA-TR-84-5
The difference between local (P, and freestream (P0 , totalLocal 'Tuin I
pressure is nondimensionalized by the freestream dynamic pressure. Cp
becomes negative as Irreversible losses in total pressure occur locally,
because of viscosity in regions having large velocity gradients. These
regions occur near the core of vortex filaments and in the boundary
layers of lifting surfaces. In downstream flow, this loss in total
pressure provides a signature, which identifies the freestream wake
* locations.
In Figure 5 contours of various values of Cp indicate regionsP
where losses in total pressure have occurred. Note that the wake of the
plate is apparent in the pressure values. Downstream from the tip chord
"".'0 of the plate, this wake wraps around the tip-vortex core. Using contour
plots like those in Figure 5, we can determine the wake locations and
the vortex systems (at their edges) for both the bent plate and delta
planforms in each plane. The plots of their wake locations appear at
the end of this report.
III. Test Apparatus
We tested two planforms in the subsonic, continuous-flow wind
tunnel (described in Ref. 5) in the Aeronautics Laboratory at the USAF
Academy. The freestream velocity was maintained at 100 ft/sec. The
bent-plate model of Figure 1 was mounted on a thin vertical strut from
the tunnel ceiling. To develop the following data, each model was set
at two angles of attack; 10 and 20 degrees with respect to the
freestream direction (as measured from the forward half of the model).
The unit normals of the planes defining the data point streamwise
locations were always parallel to the freesteam direction.
The delta planform model was also run at 10 and 20 degree
* angles of attack. Again, the unit normals of the planes used to
organize the data points were parallel to the freestream direction.
Q86
%J.4

USAFA-TR-84-5
IV. Results
The data obtained for the two planforms is presented graphically.
A cross-velocity plot appears for each set of data points, followed by
a second plot showing the lifting surface wake. The wake is plotted
from the centerline outward, showing the way it becomes wrapped in the
*tip vorticity until its pressure signature cannot be distinguished from
the inner field of the tip vorticity. The core location of the tip
vortex is also noted. If the data plane intersects the wing planform,
this too is noted. The steamwise development of the wake for different
wing angles of attack can be compared for both planforms.
k% A. Bent-Plate Results
The bent plate data is taken from the centerline towards the
port side of the plate. Since all flow configurations are symmetric
about a vertical plane passing through the planform centerline, the flow
field of only one side of the planform is presented to allow greater
detail in the plots. The coordinate system used for all the data points
has its origin at the intersection of the vertical plane of symmetry and
the trailing edge of the plate. The vertical direction (perpendicular
to the freesteam velocity vector) up (the positive lift side) from the
plate is the positive y coordinate. The lateral direction
(perpendicular to both the freestream direction and the y direction) is
positive towards the starboard wingtip and is designated the positive
x direction. All the plots are presented in such a way that the
freesteam velocity vector is out of the data plane. Thus the plots are
to be viewed as looking upstream.
The data planes for 10 degrees angle of attack are at streamwise
locations relative to the trailing edge origin of -2, .2, 2, 4, 6, 9,
and 12 inches. The data planes for 20 degrees angle of attack are at
'57
7"7
,.NA. . .. ..... - .- .,

OP° 7 7 7 3 3'
USAFA-TR-84-5
locations of -2, .2, 2, 4, 6, and 11.5 inches. The data is presented in
progressive steamwise locations. The cross-velocity and wake-location
-% plots are shown for each plane.
Figures 6 through 19 show the location of the wake, the velocity
-" .field, and the vortex core for the bent plate at 10 degrees angle of
--. attack. Figures 20 through 31 show the same at 20 degrees angle of
attack. For both angles of attack and any streamwise location, the x
location for the vortex core remains approximately -1.5 inches. There
are, however, changes in the y location of this vortex core.
The tip vortex core location in the y direction is influenced by
the direction and strength of the downwash from the lifting surface.
The downwash field - and therefore the movement of the vortex core in
the downwash direction - is stronger at 20 degrees angle of attack than
at 10 degrees. This is evident vhen one compares the locations of the
tip vortex core in Figure 15 and 29 or Figures 19 and 31.
B. Delta Planform Results
The results of the low aspect-ratio delta wing planform tests
are presented in Figures 32 through 55. Again, the data points lie
above and in the wake of the port side of the wing. The same coordinate
*system is used for the delta planform as was used for the bent plate,
with the origin at the centerline trailing edge location of the delta
planform.
A'S The data planes for 10 degrees angle of attack are at streamwise
locations relative to the trailing edge origin of -2, .2, 2, 4, 6, 9.
J..j and 12 inches. The data planes for 20 degrees angle of attack are at
.?.. streamwlse locations of -2, .2, 2, 4, and 6 inches. The plots of the
wake locations and cross-velocity vectors for each plane of data points
are presented in progressive streamwise fashion to indicate the movement
58
V* %.. .' ~ % .* * ~ ~ . ~ - . ..
USAFA-TR-84-5
of the wake as it travels downstream from the delta wing.
The delta wing results at 10 degrees angle of attack are contained
in Figures 32 through 45. The results at 20 degrees angle of attack
appear in Figure 46 through 55. The highly-swept leading edge develops
a strake-like vortex system that travels in both the spanwise and
downwash directions as progressively downstream data planes are
surveyed. The downwash velocity vectors can be seen in the velocity
vector plot for each data plane. Note the clockwise rotation of the
port-side, leading-edge vortex system. This is consistent with the
positive lift condition created at 10 degrees angle of attack. Similar
trends, only stronger, are found at 20 degrees.
The tip vortex core appears to seek the same location at either 10,
or 20 degrees angle of attack: approximately -2.3 inches on the x axis
and .2 inches on the y axis. This location for the tip vortex core
appears to have been achieved for both angles of attack in the data
plane 6 inches downstream of the trailing edge.
The shape of the delta wing's downsteam wake differs from that of
the bent plate. Downstream of the delta wing, the portion of the wake P
that becomes wrapped around the vortex core is wrapped in a looser
spiral than that found behind the bent plate. This is especially
noticeable in the x locations of the outboard wake that is wrapping
around the core.
P9
5,.9
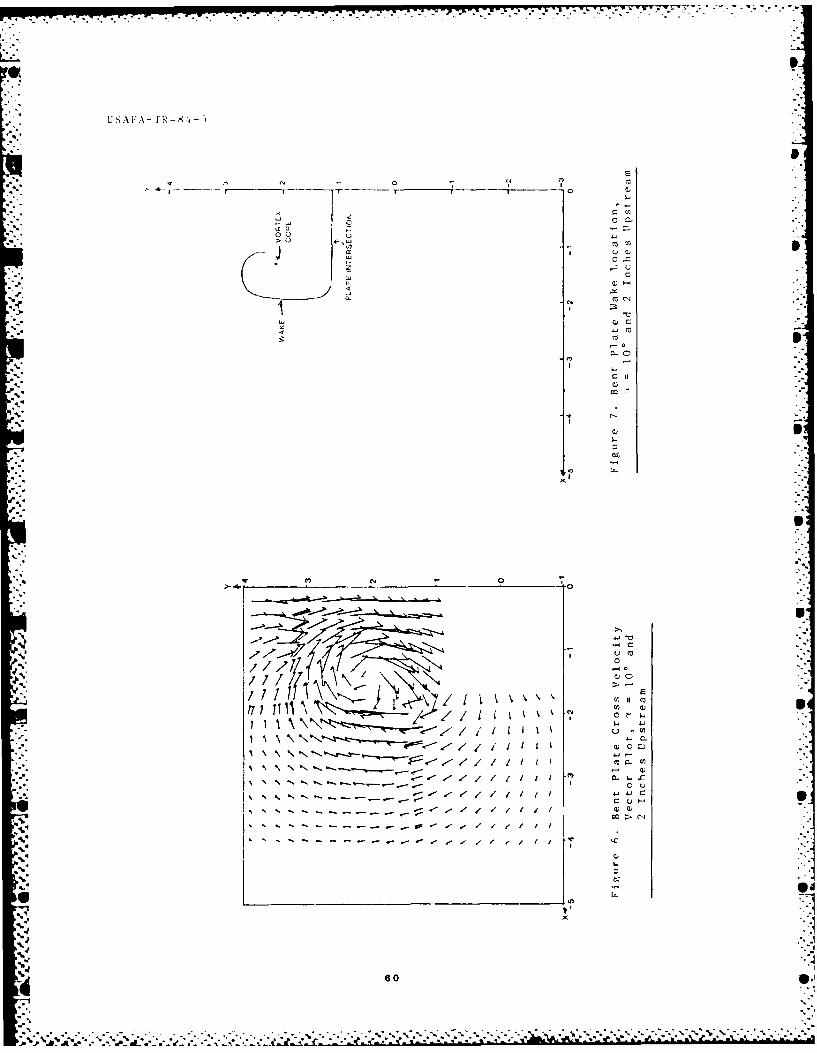
LSAFA-1 R-84-1
4 - 0
00Y 0 ~
5-, 0
1 L
U A-
% -e
600

U SA 'A - TR -84- 5
C4
cc m
Y c
-o a
CC C
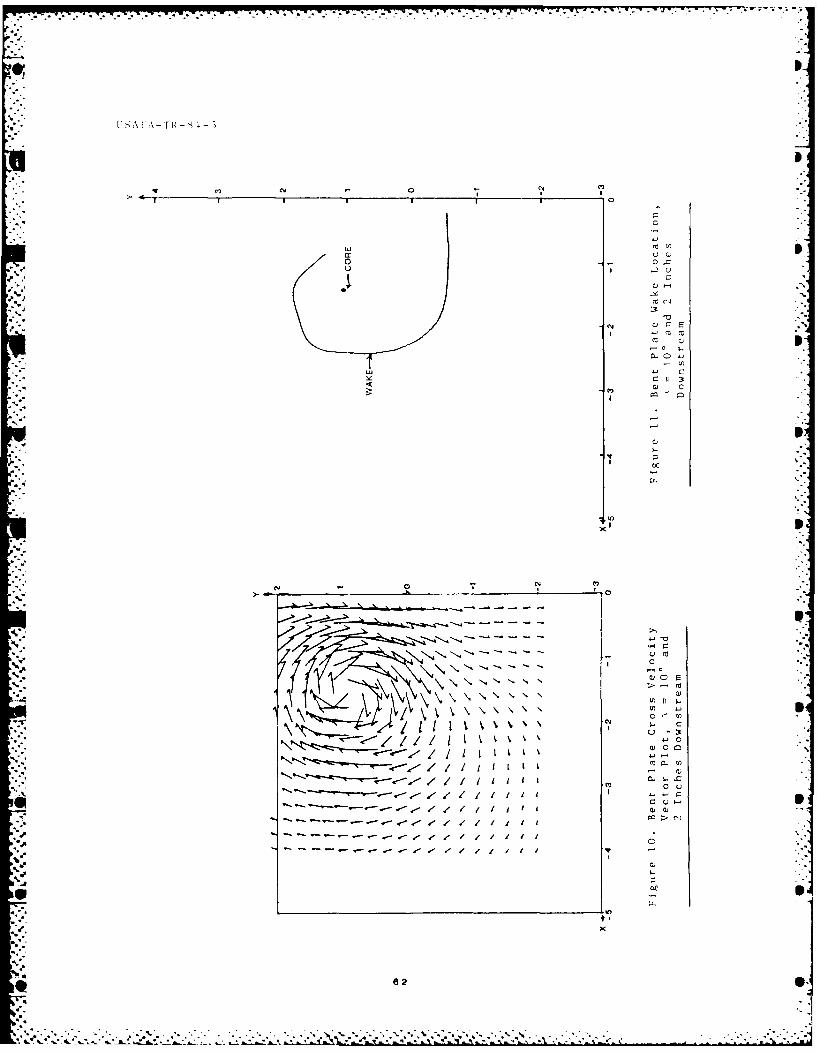
• " .- o--,v-< - -,, -- -v- '- " ."-- . -.- .. . . . .*-- _ - - -... , - .- * .. .- - " - " . .. ..-
"°* * ** * * •~w~
uii0°-
>II I I I I
CL
wy m
a:a
oo
) I
ul
CY $
" -,0 I-
x I I
c
cc >
-- ........ - - - - -...
* 72Nv.. o =
*1I I cct
!°
° .'..

LSAFA-TR-84-5
Ccm C'd 0 c'
j I00
CY
uJ
0 (C)
CQ CY
ell-
63C
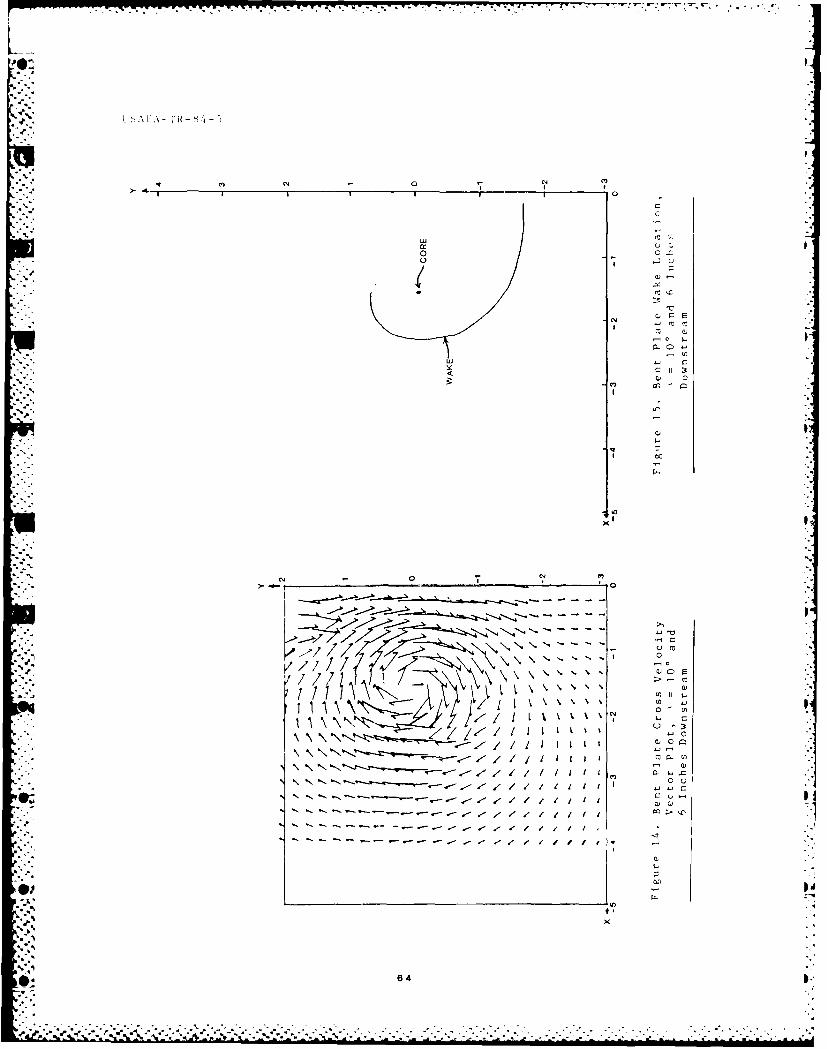
U S A 'A IR 8-
00
00LL -
yN
00
bci
n..
04 C0
In
CL 0
41$
/ie 4
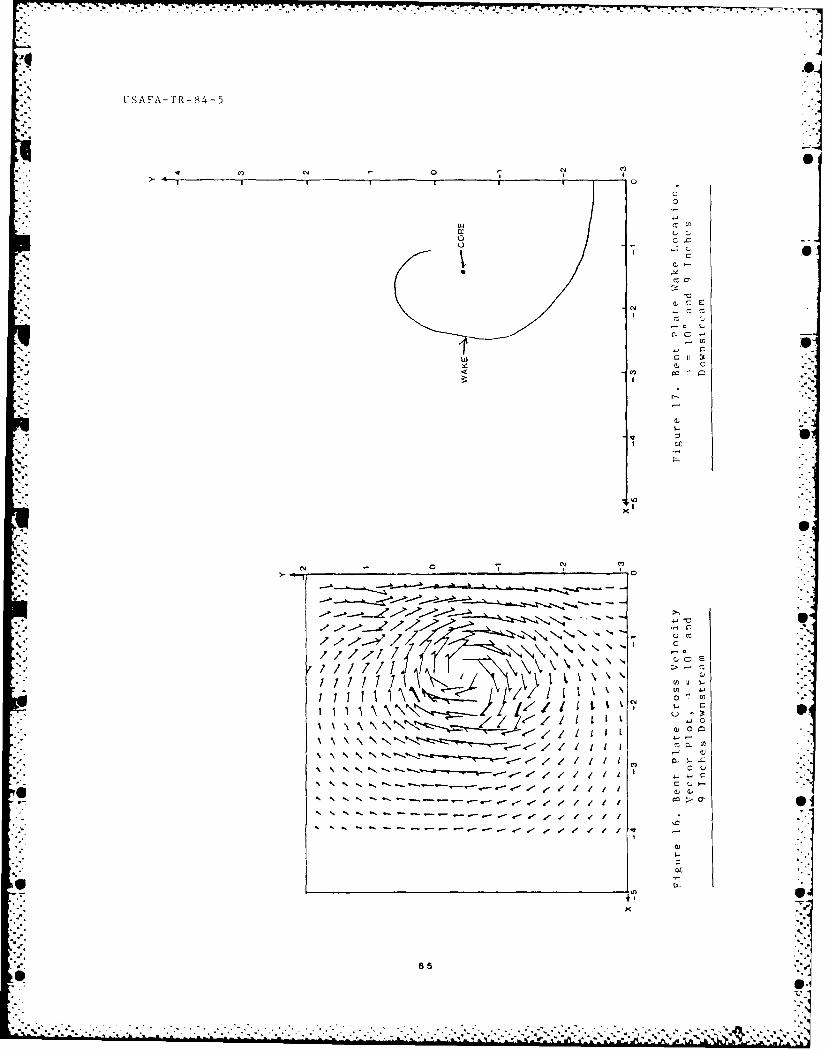
I4 0 ,II
USAFA-TR-84-5
©S
- .CIA
C-
CIC
CYC
u (t
ry
CY
NN
C C
rN
J P LO
C -
cci
65.
o. ,-% °
"3Z ×--
, * : "

, -
.-
6
SI -- - --- --- -
**- .
Cu
I -
I..
C3,
r-
, 0 ",,- . - - - - -N - rg
.. '. 7]: _. \[; ,l % .NNN ''N- - :,
'7-7* ' ''"
- .-
V - / ' ll. I C
. . . . .. .. ".- , ", . . .. . n - ". - . . . "l - I " I / l 1- / -I -I I I • 1
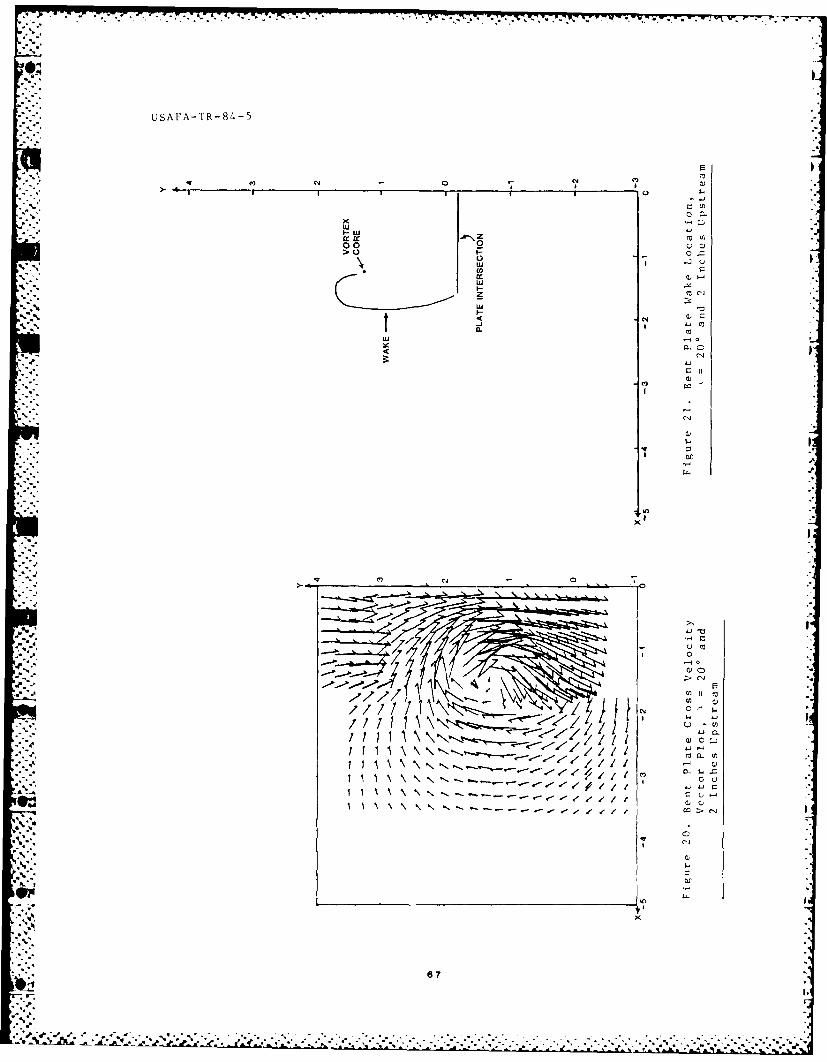
USAFA-TR-84-5
>-~~1 & 45
O0 _ aww
LUU '- a< 04 ,
,.. i
V m~ Cl
wu
a)C
C.
CD
IL-
,. ' .. I 1 \ \ . .. . . .
:,4')
67
% P
-4 .4. i __x ;' ' ." -" " " " ' ',,_.'' :/ ,".:'"" '-,.-.''''' ''."'. ''..-.,,.'-' "..",.,0 -",.",,"-"

U'SAFA-TR-84-5
C4
kM I ~ CCf(
UU
v Cu
'a U
C
w -40
(v
x

* •
al
USAFA-TR-84-5
41o
110CC
4 -
4-.4
x0
V) CY
00
CN
L~C 0 7!!
C4
w _2
( ' ""
00
,4.
S'.S
S., %
,.".r, _ ' -' 'i -' ' 'L"::- .,.. " . " , " . . . . . . " , C".".".- -. ." . ". ' ' S .......- ".,,- '.. ' '>
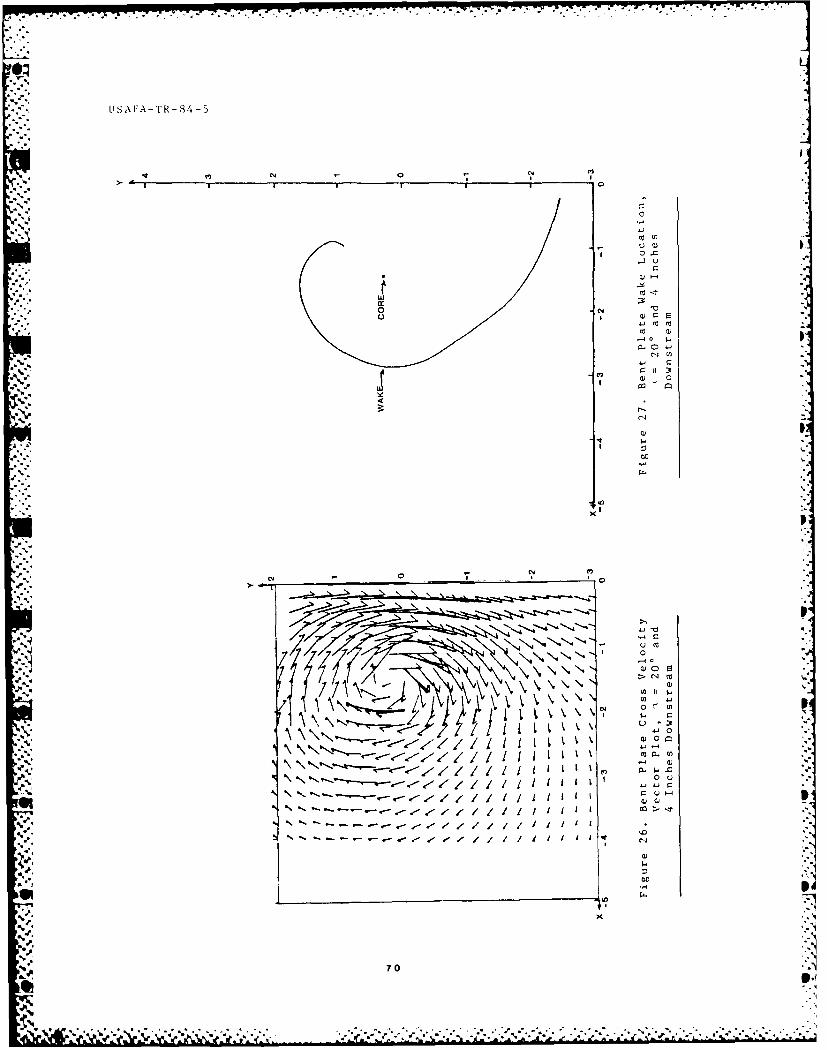
. . 4 . .
USA FA-TR-84-5
F
o N
N
S I I
I
I 0
0
I 0.0-'U
C
*
3) I-,r4
1
4.'
4..
wo N
o
* -
(~C~
,-4O ~
0404-'
.4
C..) U)
4%
013:3 I
3)I-
A a
4-
U-4.
In
p
IN -. -
N
4-' 0
\ \ \ ~ ,-40"2
.444
-. .,-~ ~
A.
3)0
U) II)~
U) 4-,
0~ U)
~ P
I:~
'I I I I I I
/ / 'IJ~
C I
U.
~170
S.'
4.-
4
' *.4.
.r r --
I- *'~*~ ..- 4*.-*44449 *~~4

.- ---.- - --. 45VT. ow 7:7 Y T; 1 . W. * 7
USAFA-TR-84-5
0
-. i
C7
w0~x. Cl
Od
C113
I C
_ _ _ _ _ _ _ _ _ _ _ _ _ _ _ _ 0.
-4CL
'r co
71 I

77 , W. 7..
4r USAFA-,rR--84-5
C4 W
cc
o O C
M C --l
C-
CYC
- o F-.
>~ C-4
j )l
1..1
% 4
4.'2

s..- -. . 777-777:-..-T
* USAFA-TR-84-5
cil (0* Ci -0 Cd C
w , 0)
ot
73~LJ
2.~c-
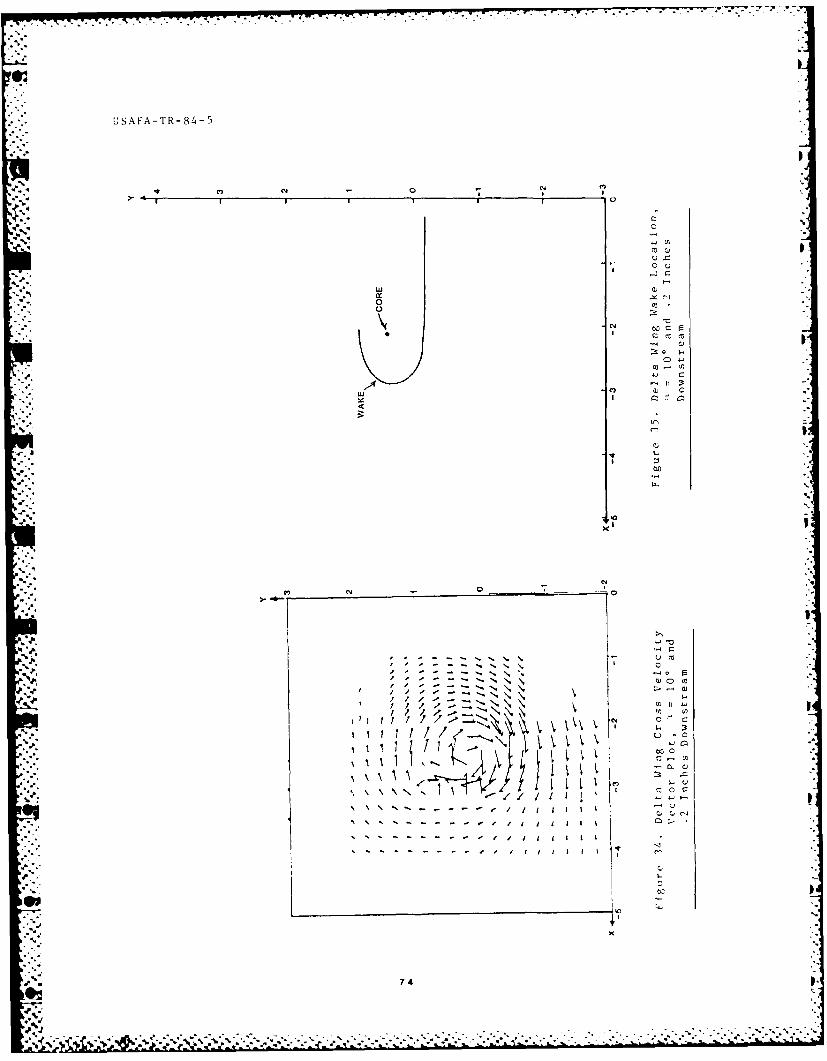
|I
W7 7.
USAFA-TR-84-5
c",I
1!
.o -0n
rC
744
U -U
pW.C
",,'2"-- i ~oo
w •
? . i - ..- .o
.'- ,
25
5-
,'2-." I
-. 4 - 5 . " ,
- - - --. 5- '-'."
- --- *,,\.-
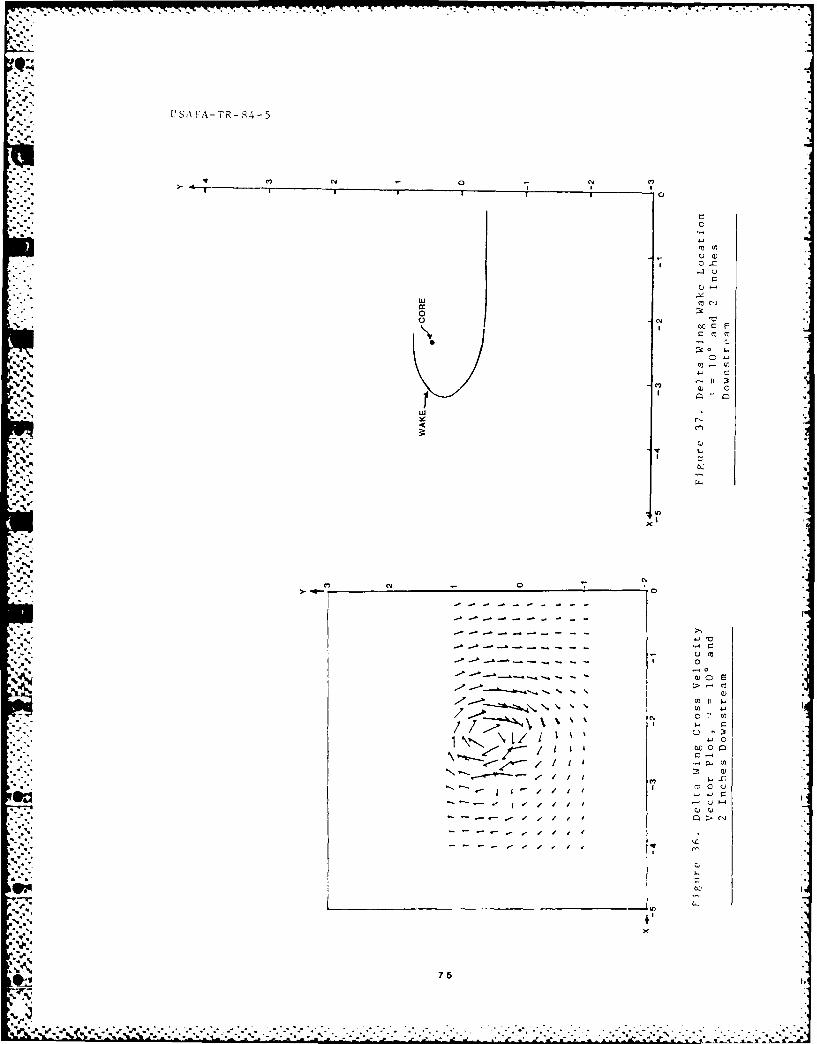
USA FA- TR-84-
Ci
r) CY
01
75N

-V--
USAFA-TFR- 84-5
0
CC f
0'
tuc
CYC
oo- -
.j) I
76C

U SA FA-T R - 8 4 -5
040
g'2w" ! T"! -
lrs
,- l .
7 7-
,-
.C
II - :
C,--
). .4.-
0 o
-.
'.oo
4 % > .C0 . . "
, -. . _. .. .. , . ..-.. .- .. .. -.. ..- . -. . . .. _. .: .. . ... .. '.-.. .2 .- .. .. - .. . - . . .. . N . ...- .. .. - . :,:,.- . . -- . .;" " ' ." L
r: ,,' i'- -" . ... *, -'I i -
-' - " ",' " ' " " " '-' " ; : " " "' O
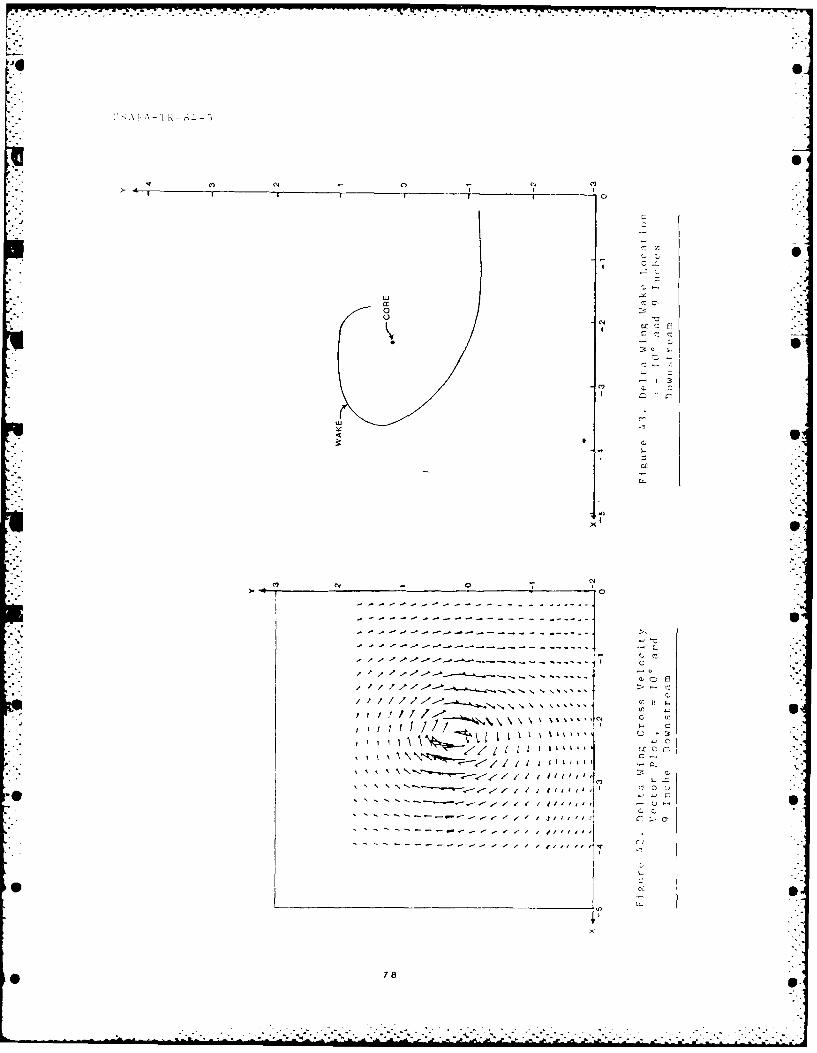
40
ClC.
o~ -%
LLo
CI
C
78S
r 1

-III N . ".- S,. -A-I' g
mQ I
VI _
C! I
p.
---- ,'-.. -o ::
iI
F
• "/ II k L-
::: : C , '- \ ..
: :.. . . . .. . . . . . . . .. ..
" a, - I ' "'"a
7., ,p,.C
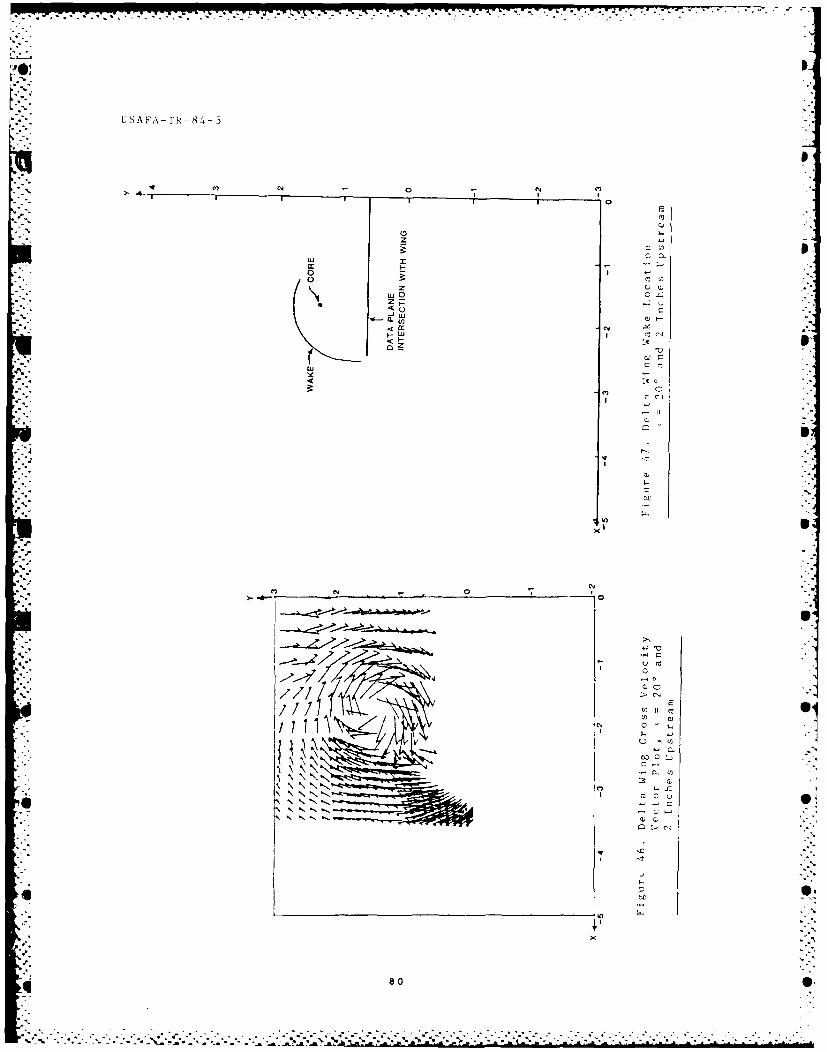
USAFA- rR-84- 5
Cl) - o
0 I
wz
Lu I C C
CCHlo I
o iZ Uc
Lu ) CC
T.
-W-I
800
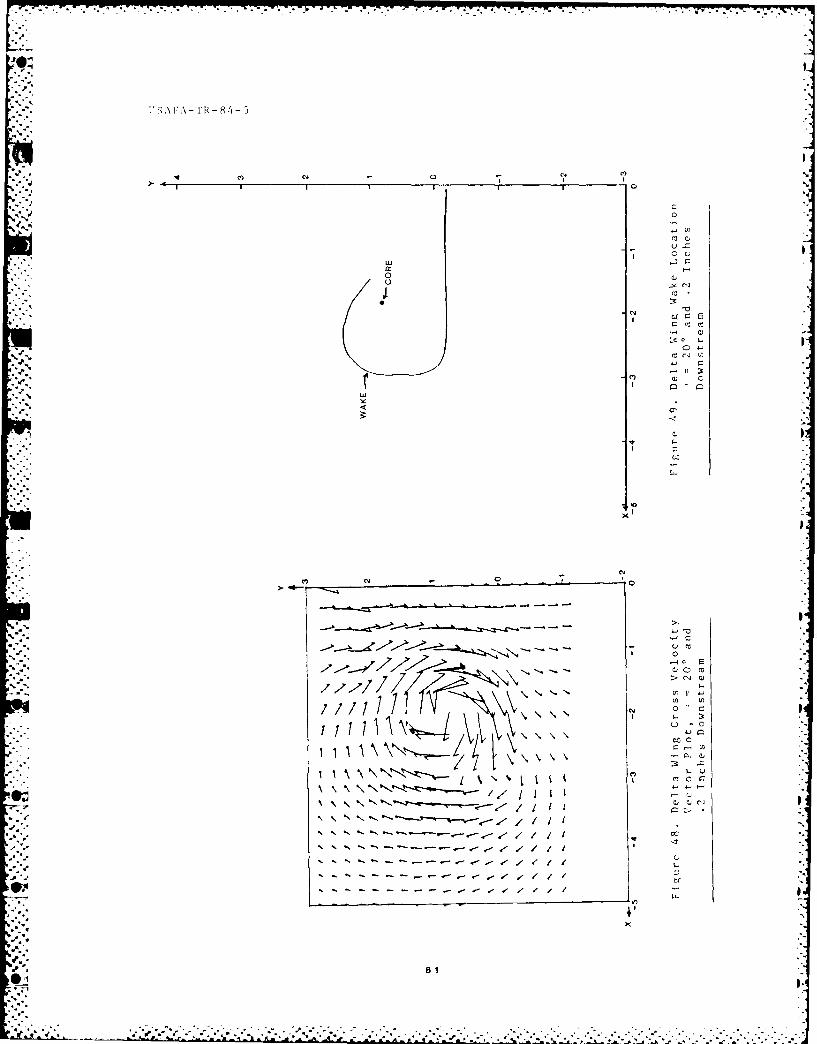
U SAFA -T R- 8 4- 5
-l 0 0 1~
N'l C,
CC.
wle
a a)
C, c
to I
c) C7
rL
I-
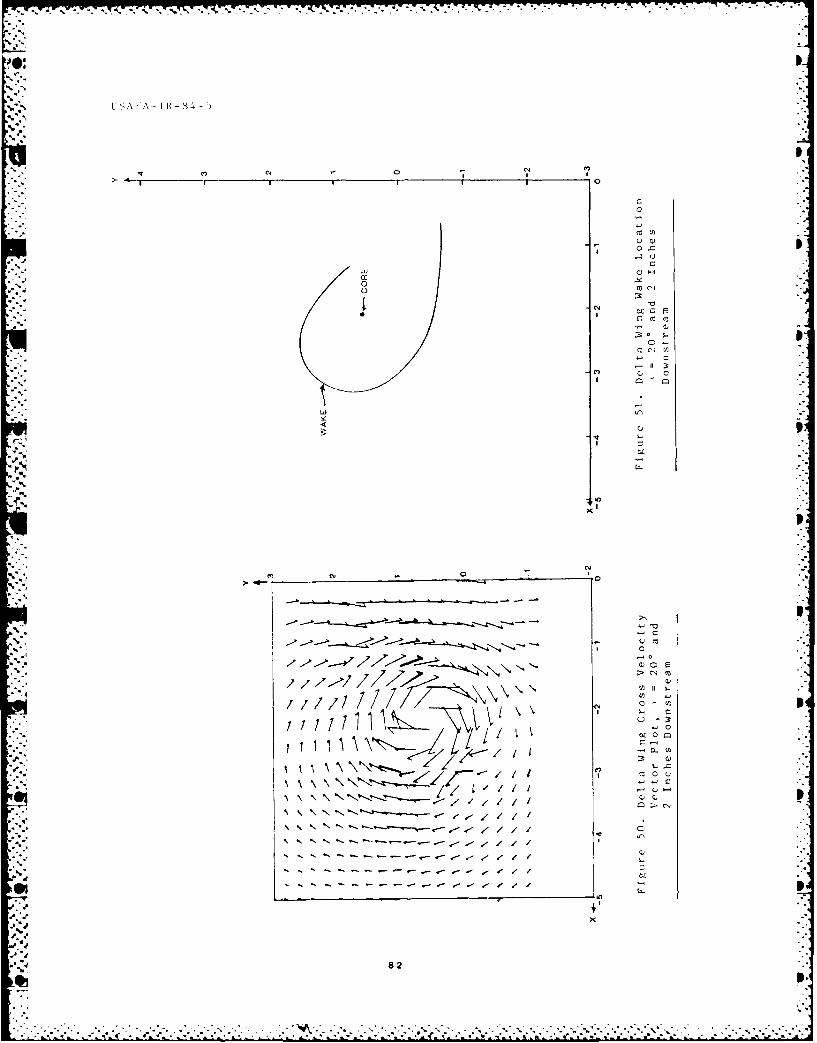
Nu 0 )
i I.-,
IINo~p
w C frn
C fn
0z C> c,4
82

F*6 USAIFA-TR-84-5
Il c 0
cc3
o :o
U cU
C 4
.u m
30
10

U'S A A-rR- 84 -5
u (D
0
0
0*
C
4- 1
U))
Ic
u c
> N- co0
>. .4- 0
-. ~~c -. -u.
-l m. u~
-U ~ -. - *
4 .-de
A -' .- ~84
l'- A}'A-T- 8 4 - 5
V. Conclusions
The low aspect-ratio delta wing demonstrates wing wake
- . sensitivities to leading-edge sweep. The leading-edge sweep of the
planform significantly affects both the way the wake becomes wrapped
around the lifting-surface, tip-vortex system and the movement of the
vortex system downstream. With large leading-edge sweep, the wake
bulges in a more spanwise fashion. Also, the tip vortex moves spanwise
due to sweep effects but tends to go to approximately the same
X ~ downstream location relative to the delta wing trailing edge provided
%the angle of attack is not too large.
The bent-plate configuration addresses camber effects on wake
characteristics using the 20-degree bend at midchord. The secondary
vortex system caused by the discontinuity in slope at the midchord of
the bent plate could not be discerned in the pressure data. This is due
" to the turbulence of the interior vortex flow field. The wake strength
tended to determine the downstream vortex core location within the
* downstream range available in this test. Very little outward drift of
the vortex core was noted regardless of plate angle of attack.
The actual pressure and velocity values for each data point in
these test cases (recorded on magnetic tape) can be obtained by
contacting the Director of the Aeronautics Laboratory, Department of
Aeronautics, 'JSAF Academy.
References
1. Wickens, R.H., "The Vortex Wake and Aerodynamic Load Distribution of
Slender Rectangular Wings," Canadian Aeronautics and Space Journal, June
1967.
2. Clark, D.R., J.K. Wathman, and F.A. Dvorak, "Forward Swept Wing
Configuration Evaluation and Validations of Analytic Methods,"
-%-o8
'p.
AFWAL-TR--82-3033, July 1982.
3. Crandall, R. and G. Sisson, "Canard Wake Measurement and
Description," Aeronautics Digest, USAFA-TR-81-4, UJSAF Academy, May 1981.
4. Gerner, A. and G. Sisson, "Seven-Hole Probe Data Acquisition System,"
r. USAFA-TN-81-8. November 1981.
5. Griffin, K.E. , "Measurement of Wake Interactions of a Canard and a
Forward Swept Wing," USAFA-TN-82-4, July 1982.
...

L'SA14A-I'R-84- 5
.,4."
SECTION II
Aeronautical History
-..,-87
.. 1
,2--,I€'% "j

• ~ ~ U A'"" FA s~~ -I'- 84, -
i. . '"!!E A.LY b AY.: AH.H()bA!rTIp;
•.r J,'f'ey I. Taylor
I-: d ''s N t
The f " w arti I har been r p;ririt from the Journal of theRoyal Aeruna i.t i ; oc i ty Volume 70, Number 661, January 1966, withthe perrmiss in o f te Rova] Afr'nautica Society. The author, Sir G. I.Taylor, was ; pro ii( retoearcher who, in his 60 plus years as ascientist arid academici in, published more than 200 papers on a varietyof subjects including aerodynamics, hydrodynamics, meteorology, andmechanics of solids. His career spanned the development of aeronauticsfrom the first days of heavier-than-air aircraft to the days of manned
spaceflight. Hio expertise and breadth of experience combine to make
his recollections of the early days of aeronautics a very interestingpiece of reading. Most of Taylor's published works have been collectedin the four-volume set The Scientific Papers of G. I. Taylor, edited by
G. K. Batchelor and published by the Cambridge University Press between1958 and 1971. Anyone looking through these volumes can only marvel at
the quality and quantity of research produced by this remarkable man.
It is always rather risky to ask old people to talk about what
things were like when they were young. Having turned on the tap you may
*_ not see how to turn it off again. Fortunately there is a circumstance
which keeps this trouble under control. Old people remember a lot of
things when there is no call for them to do so but seldom when there is.
That is the reason why I have written down most of what I can say for
this lecture.
I cannot attempt to give a complete or an objective picture of
aeronautical science when I started thinking about it. The best I can
do is to describe a few of the things which happened to me in those days
to try to convey some pictures of our primitive ideas.
My earliest aerodynamic experiences were all connected with sails.
I built a boat in our home in St John's Wood while I was at school. It
was before the days when woodworking firms would supply ready-made kits
so I had to do all the design and construction work myself. Fic. I was
taken while the sails my mother had made were being fitted. Those of
you who know about boats will see it is old fashioned, but it was quite
fast. After building the hull in my bedroom on the second floor we had
88

-° . -- .."
-- o. -
L' S A I A - T[R - 8 4 - 5
to get it through the window. It was a :a:sh window which coi t
out. We turned the boat on it side because it was wider than the
window frame. We put slings round it and attached them to a rope which
we slung over, a borrowed builder's pulley at the end of a joist
projecting from my parents' bedroom on the top floor. After making the
lower end of the rope fast to the garden roller we got the boat out of
the window and left it hanging while we went down into the garden. We
then detached the rope from the garden roller and my brother, my cousin,
and I started to let it out. As we were doing this the boat above our
heads slipped slightly in the slings. My brother let go to run upstairs
to refix it and we then discovered that the boat was a little heavier
than my cousin and me. Fortunately we both held on, no further slipping
occurred and my brother caught us almost before we had left the ground.
It was a good lesson in practical mechanics.
a,.
Figure 1. The boat in th garden
89. ............................................-..... *.....-.

JoJ-
U S A - I R- 8
AFter I-ur r ''e cat at 1a mrn rsmith I sai lel how, t [o th.r.
and across to ,O, -. , . j very uncromforta y with or 1'. w
A oh si e o f' o I'i e-, I r n t th ink much i n t D . : v
about the " A r, N: hv ro-dynamic forces b tween 'ai I ,nI
hul . It wa'- er ' to kn()w th;t s l s push one ahong, but .4 v )'f.e,
taught me a I It e t out thW" ways of seamen. On the turn journev up
the Thames I met a ti-oesome sea and a head wind i n Se: Reach. There
were some 'C or 60 sailing barges heating up at the time" and I mznO(<
to hook onto one of them and get a tow for the boat and a passage fCr
., me. Somewhere off Woolwich my barge was involved in a very interestit;
triple collision with two others, each barge hitting both of the othor-
One of them ultimately sank. The verbal exchanges which passed between
the three skippers and their mates when we interlocked, were an
eye-opener to me. I listened with admiration, never thinking that an
-. " analogous experience might one day cal I forth an unexpected, although of
course far smaller talent in me. I was taking my 19-ton cutter before a
_ strong wind into the sea lock at the end of the Crinan Canal when my
crew failed to belay in time the rope which should stop the way. I
thought we were going to ram the lockgates and in the heat of' the ,Nomr-t
said a few words about the situation. I was later told that a :summr
visitor who was standing on the lock side watching this manoev-e was
seen to pick up her little Peke, and stop up its ears.
The triple collision was also educative in another, way. All th,,
three skippers gave different accounts of the cause of the accident.
The skipper of the barge cal led the "Jolly Dogs" was certai nl v in the
*"""wrong hut he put the blame on my skipper who fortunately for m, was
entirely correct in his actions. A pretty case was brewing for decio nr
in the law courts and the counsel for my skipper asked me to go to hio
o ff ice and deacribe what happened. I was able to give a consistent
<.:.
90
iA

-.-s
"0
picture of the sequence of events and a r eed to civ, ey :,h
court. A short time afterwards the lawyer wrote t 'it this ,ot
necessary because when he told the oppos l og y 1 wr that he h t
independent witness who could describe the colli-ion, they new 't s
useless to go on, even tho )h the wi tness was onl v a s choolr , t
.. withdrew their allegations.
My first introduction to fluid mechanics as -soier es, , r : n
meteorology. After studying the subject in its theoretical as
time, I was appointed meteorologist to the old wooden whali[r I
Scotia which was chartered in 1913 by the government and the a.h p
companies to look for icebergs in the North Atlantic and report t
positions by means of the newly invented metnod of wireless teplorapy.
You may remember that the Ti anic went down in 1912 through striking in
iceberg. The Scotia was a wooden barque of 238 tons. Fig. I shows her
quarterdeck. I took this picture one sunny morning when we were sti-i,
in ice firm enough for me to stand on. The Scotia had been usesJ by the
explorer Brure in the Antarctic and was equipped with an auxiIary sta
engine of almost unbelievable inefficiency which would drive her u to
* 1/2 kn ots in a cIm, al though yhe would mke t ot n rts under sal
in a gale. She had two whale boats which wern, seldom, if ev'r, used
on our expedi tion. They were, th o'riginal boats 'sed wh'- T wh :f I 5w
carried Ut by rowing up t- a wha e a n d ct io " r se r 1 I ) it.
They wer', ver"y tuch in my wasi wh,-n T f w . t - ., i' t ,,r ..
instruments frem ha,,' quartrd , A o e t ' d, t'
boom. I net ioed thait. th, sk
him why. 11e s id the ho ' ,0a-m q et t t,
kept it in i r , war hr n 1 "
O, my spankor I. lnthin-;,'.? A't, r .
l unde while the- cr'"ws t , r' . ' -. h-
.* 91
D-Ai42 399 RJR FORCE ACADEMY AERONAUTICS DIGEST(U) AIR FORCE 2/2ACADEMY CO J DEJONGH ET AL. MAR 84 USAFR-TR-84-5
UNCLASSIFIED F/G 20/4 NL
1sm/mmmmmmm
EhhEEIhEEEEIIIEEIIIIEIIIIEEEEEEEEEEEE~lEElllEEEEEEEEllEllEllEEEEElllE

Y.7.7, 777-7 '70.O,:
- .~~' rbrr.O
1.0 '" .O
L=2. 2.2
-• -. .mi
•
la.p.
%%
111 ' ' 11111,1.8 - ..11111 iiiiil !i!!i : i
MICROCOPY RESOLUTION TEST CHART a "-'.
.*. %,'.-=
.. *--.:-... :._
°- . *% *., *- .
S >~k -J 6 *-* .- o*".
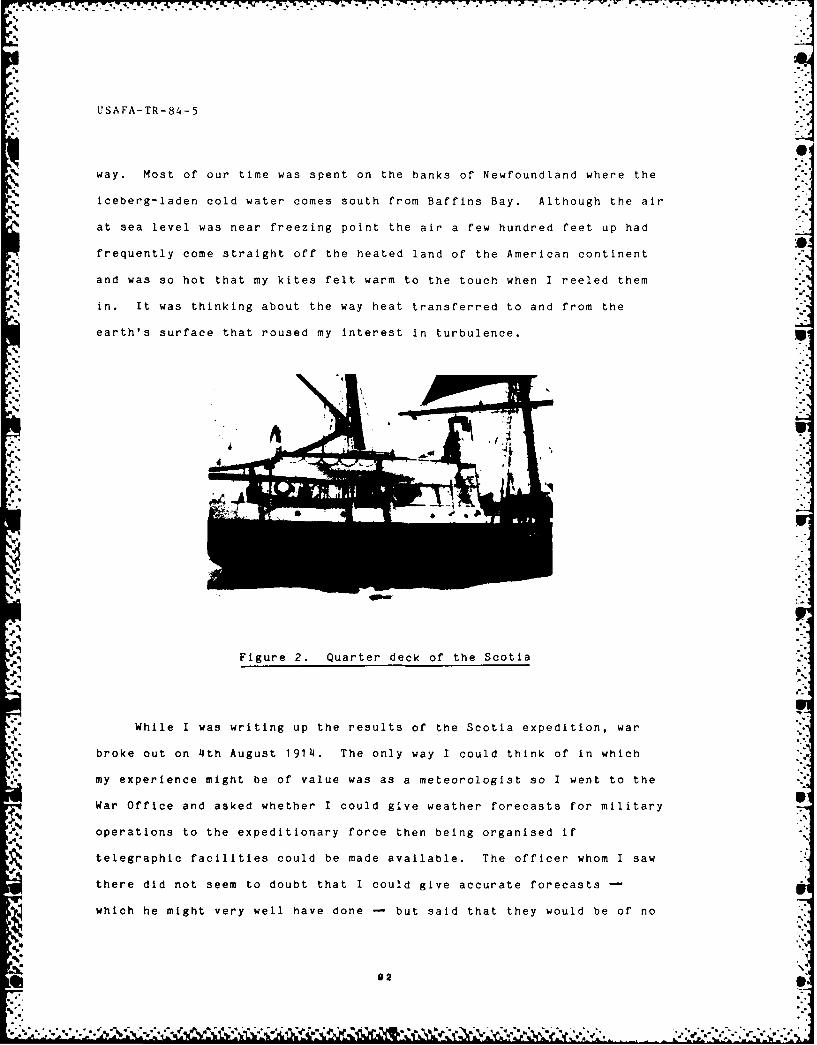
USAFA-TR-84-5
way. Most of our time was spent on the banks of Newfoundland where the
iceberg-laden cold water comes south from Baffins Bay. Although the air
at sea level was near freezing point the air a few hundred feet up had
frequently come straight off the heated land of the American continent
N and was so hot that my kites felt warm to the touch when I reeled them
in. It was thinking about the way heat transferred to and from the
earth's surface that roused my interest in turbulence.
\t. 4
Figure 2. Quarter deck of the Scotia
.P1
While I was writing up the results of the Scotia expedition, war
broke out on 4th August 1914. The only way I could think of in which
my experience might be of value was as a meteorologist so I went to the
War Office and asked whether I could give weather forecasts for military
operations to the expeditionary force then being organised if
telegraphic facilities could be made available. The officer whom I saw
there did not seem to doubt that I could give accurate forecasts
which he might very well have done - but said that they would be of no
V.
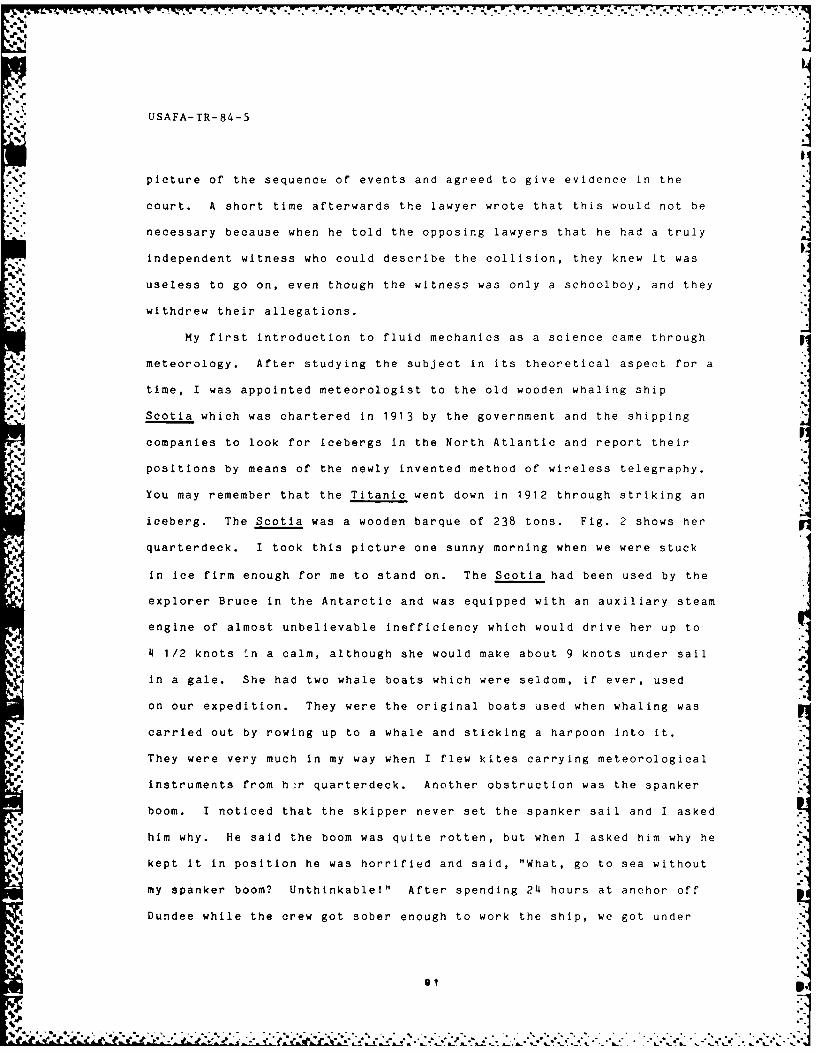
picture of the sequence of events and agreed to give evidence in the
court. A short time afterwards the lawyer wrote that this would not be
necessary because when he told the opposing lawyers that he had a truly
independent witness who could describe the collision, they knew it was
useless to go on, even though the witness was only a schoolboy, and they
withdrew their allegations.
My first introduction to fluid mechanics as a science came through
meteorology. After studying the subject in its theoretical aspect for a
time, I was appointed meteorologist to the old wooden whaling ship
Scotia which was chartered in 1913 by the government and the shipping
companies to look for icebergs in the North Atlantic and report their
positions by means of the newly invented method of wireless telegraphy.
You may remember that the Titanic went down in 1912 through striking an
iceberg. The Scotia was a wooden barque of 238 tons. Fig. 2 shows her
quarterdeck. I took this picture one sunny morning when we were stuck
in ice firm enough for me to stand on. The Scotia had been used by the
explorer Bruce in the Antarctic and was equipped with an auxiliary steam
engine of almost unbelievable inefficiency which would drive her up to
4 1/2 knots in a calm, although she would make about 9 knots under sail
in a gale. She had two whale boats which were seldom, if ever, used
on our expedition. They were the original boats used when whaling was
carried out by rowing up to a whale and sticking a harpoon into it.
They were very much in my way when I flew kites carrying meteorological
instruments from h~r quarterdeck. Another obstruction was the spanker
boom. I noticed that the skipper never set the spanker sail and I asked
him why. He said the boom was quite rotten, but when I asked him why he
kept it in position he was horrified and said, "What, go to sea without
my spanker boom? Unthinkable!" After spending 24 hours at anchor off
Dundee while the crew got sober enough to work the ship, we got under
e1
...," ... .' . . . . . . .
* USAFA-TR-84-5
value in military operations even if accurate. "Soldiers don't go into
battle under umbrellas - they go whether it is raining or not." I
expect he was politely telling me that the army had all the science it
needed, but when six months later our people found that the French army
derived great benefit from their meteorological service our
meteorological office was asked to organise one; and one of its staff,
Colonel Gold, did so very successfully.
Returning to the War Office, the officer asked me to leave my name
and address in case anything turned up for which a scientist could be
used. I went home, I must confess, rather disappointed, for I had no
desire to become a dispatch rider. That evening a messenger came from
the War Office saying that if I went down to the Royal Aircraft Factory
at Farnborough I would be employed there as a scientist. I went there
on the 5th or 6th August. What had happened in the War Office was that 9% Major Sefton Brancker, then I think head of the flying wing of the Army
had happened to go into the room of the man with whom I had just had an
interview. This officer had told Brancker of my visit and asked him
whether he could find any use for academic scientists in his branch.
Brancker said he could use as many as he could lay his hands on. He
took my name and sent his messenger at once.
On arriving at Farnborough O'Gorman, who was then the director,
introduced me to a fascinating character called Teddy Busk who asked mE
to join his mess in Arnold House. This mess was run chiefly by memberz
of the Naval airship section among whom was Cave-Brown-Cave who
afterwards became Professor of Engineering at Southampton University. P1
At first only Busk and I and F. M. Green were not in the Navy, but
later we were joined by other civilians, F. W. Aston, the inventor of
the mass spectroscope and the principal discoverer of isotopes, and
Lindemann, afterwards Lord Cherwell. The mess subsequently moved to a
o3
-J

lk7 I%-
USAFA-TR-84-5 Ihouse called "Chudleigh"; I cannot remember who were members at the time
of the move, but Farren, Glauert, R. H. Fowler, George Thomson, E. D.
Adrian and Melvill Jones were certainly "Chudleighites."
When I arrived at Farnborough I was put to work in H department
onto which the odd jobs that did not fit in with any other branch were
decanted. It was housed in a building with a tin roof which looked out
over the airfield. The aeroplanes used to come in close to the roof
making a fearful noise and quite often crashed just outside our windows.
Some of the things we were set to do now seem futile in the light
of hindsight, and some even then seemed rather wild, but of course we
were under orders from the Army and had to do what we were told.
O'Gorman, however, gave us a pretty free hand and we were able to turn
down quite a number of things which could not possibly have worked. One
job which was put on us, although we never thought it would be useful,
was the designing of darts to be dropped on troops from aircraft.
Melvill Jones and I were the principal people concerned and both he and
I have described the sequence of experiments involved, so I will only
give a brief account now. The French had used pointed steel
"flechettes" but we found that they whirled when dropped, even though
the centre of pressure when falling obliquely was well behind the centre
of gravity. In any case it seemed to be a matter of prestige that we
must have English darts so we designed and tested some with the
necessary aerodynamic properties. Our last test was to find their
distribution on the ground when dropped from an aeroplane out of a
container, and we got a pilot to drop them onto an unused piece of
ground. To measure their distribution we searched the ground and
whenever we found the rear end of a dart projecting from it we pushed
a square of paper over it to mark its p sition. We had just completed
this work and were preparing to photograph the field when a cavalry
94% S- AZi

USAFA-TR-84-5
officer came up and asked what we were doing. When we oxplairied t:;at
the darts which covered the field had been dropped from an aeroTL fan, ho
looked at them, seeing each piercing a white square and said, in a
surprised tone, "If I had not seen this I would never have believed that
it was possible to make such good shooting from the air." Having
., finished that job, the darts were never used, not apparently for the
reason we had originally raised as an objection, namely that missiles
descending vertically would have a much smaller chance of hitting a
standing man than the same weight of bomb going off on contact with the
ground and throwing its fragments horizontally. The reason we were
given was that darts were regarded as inhuman and could not be used by
gentlemen.
All the things we did were not so absurd as our work on darts and
by way of contrast I should like to trace one set of ideas which
originated at Farnborough at that time. One of the troubles which we
were asked to look at was the weakening of propeller shafts for
transmitting power owing to key-ways cut in them. About this time a
young man called A. A. Griffith arrived at the factory. He was
obviously very able and he came and worked with me on the subject. We
devised what is now called an analogue computer for obtaining
mathematical solutions of the stress distribution near internal corners
in keyways. Thus we formulated rough rules for deciding on the amount
of rounding necessary to prevent too big a concentration of stress at
the internal corners, both In torsion and in bendirig. This work led to
our thinking about what it is that determines the strength of materials.
We knew that consideration of Intermolecular forces leads to an
expectation that solids should be much stronger than they are and we
came to the conclusion, as I think others had already done, that all
materials have cracks or faults in them that entail far greater local
#4
95

LVL
- a %.j
USAFA-TR-84-5
stresses than the mean applied stress. This qualitative idea had little
value unless one could form a quantitative model for relating definable
faults to the reduction in mean stress which they cause. It was a
brilliant idea of Griffith's that made this possible. He pointed out
that it is not necessary to know the exact distribution of stress near
the sharp ends of a crack, but only the strain energy which is spread
over a much larger area, and the surface energy or surface tension of
the material. The condition that the crack can extend can be found by
equating the loss of elastic energy during this extension to the surface
energy gained. Although this idea proved very fruitful and was verified
by some beautiful experiments which Griffith did at Farnborough with -
brittle materials, glass and quartz, it explained only the reduction in
strength due to a crack. The longer the cracks the weaker the
material. Griffith and I and Lockspeiser, who was also interested, knew
that in fact most metals tend to get stronger when they are strained so
that the Griffith crack theory could not be used to give a theoretical
picture of the strength of metals. We made some unsuccessful attempts %
to modify the Griffith theory to include such cases. I tried to
describe mathematically the situation where the stress distribution
round one Griffith crack might inhibit the growth of another, and thus %
appear to strengthem the metal, but mathematical difficulties defeated
this attempt. It was not until 19 years later, in 1934, that I formed.4..
the conception that when the Griffith crack is a shear crack which does
not pull the two newly formed faces apart but allows them to slide over
one another, the molecular force will still operate across it. Under
these circumstances the faces may join up again, reforming the crystal
structure and leaving a highly stressed region near both its ends. The
stress concentrations at the two ends become what the mathematicians
call singularities and the stress distributions due to each of these can
96S..
%.[ Xblq, 1 . .7 o, I" ", ' - %,' € . " . -, -% .' ." ,.'.- "'" """ .". ' "- " ""- ."""

USAFA-TR-84-5
be summed as though they were independent, irrespective of how they we'ro
produced. This idea cleared up the mathematical difficulties, and the
dislocation theory of the strength of metals started as an offshoot of
or, in the modern phrase, a fallout from, the association of Griffith
and me in our efforts to think about stress concentrations in crankshaft
keyways of aircraft.
Much of our work at Farnborough consisted in designing instruments
for use in aircraft and it soon became obvious to me that many of our
difficulties arose because we could not form a clear picture of the
experiences that pilots tried to explain to us. In many cases they did
not really understand what they tried to describe and often
unconsciously described as facts things that were really only their own
theories about the causes of their experiences. It seemed to me that
I ought to fly myself if I was going to be any use as a deviser of
gadgets for use in the air. After some discussion, O'Gorman came to
agree with me, but the idea that a scientist should fly appeared
unorthodox and indeed unnecessary to the Service chiefs at that time,
and they turned it down. Instead O'Gorman released me from his staff
and in May 1915 I joined the Royal Flying Corps as a pupil in the
ordinary way, leaving my scientific proclivities in abeyance. I was
sent to the flying school on the old motor racing track at Brooklands
and took a course on the old 1913-model Maurice Farman then called a
Longhorn or a "Rumpety" for reasons which I never fathomed. It was a
pusher biplane with an elevator in front and a tailplane supported on
long struts behind. Its maximum speed was, I think, about 60 miles an
hour and it would stall about 37 mph. One tried to land it at about 42.
At that time aircraft were so scarce that pupils were not allowed to fly
if there was enough wind to put a match out. We went on to the field
in the calm of the early morning and again in the evening. If there was
97i
S.%
'a <:~;22
U , S A~* -FU A - T R~ - K7. .' - 5
' USAFA-iTR-84-
any wind we had the day or night off. It was an easy life but to kc ep
in it one had to learn certain rules. In my case the most important was
never to touch the controls of the dual control machine on which I was
being instructed. The reason for this was that the instructor to whom
-• I had been assigned was a nervous character who had been been injured,-% .
- or at any rate frightened, in a crash caused by a mistake of one of his
pupils, and he decided this must not happen again, so if one of his
pupils applied any appreciable force to the control or joy stick, as it
"'U was called, he reported that this man was heavy handed and would never
make a good pilot. At this time many more people wanted to learn to fly
than there were machines to teach them in, so the danger of being thrown
out of the course was a very'real one. The consequence was that the
first time this instructor's pupils went solo was the first time they
had taken control and consequently they were apt to do funny things on
* that occasion. I was fortunate because having been nearly a year at
Farnborough I knew what the controls were expected to do. My first
landing was too far along the field and ended in the sewage farm just
outside it.
One of the things that troubled the pupils was that at the low
speeds our machines would fly, a cross"wind made one seem to be
side-slipping badly if one looked at the ground. People were apt to
correct this by manoeuvres which gave rise to a dangerous real
* side-slip. Although I fear I was a bad pilot when it came to judging
distances I was not bad in the air and could do the loops and steep
banking that people did in those days. I was able to do fairly violent
manoeuvres close to the ground because, unlike most pilots at that time,
I had complete faith in my instruments and did not look at the ground
till it was necessary to land on it. A rumor even went round that on
one occasion this faith was misplaced because while I was turning, as I
98
ii' f ~ A
o.4
USAFA-TR-84-5
thought about 2000 feet up, the tail of my eye caught sight of a tree
quite close to. It turned out that the instrument I was relying on was
the rev counter, not the altimeter.
After getting my wings, as the completion of the training course
was called, in July 1915 I did a short course on what was then called
reconnaissance. This consisted in flying over a farm which was supposed
to be the target of artillery fire. People on the ground let off puffs
of smoke in its neighborhood and we were instructed to tap out in morse
code the bearing and distance of the puff from the target. At that time
wireless telephony had not been invented and the transmitting apparatus
had a long wire aerial with a weight at the end which the pilot had to
let down when he wanted to transmit. I failed at the first attempt
because I forgot to wind it up again before I landed and it was torn off
near the edge of the airfield.
When I had passed the necessary tests O'Gorman asked me to return
to Farnborough and rejoin his group of experimental officers. Although
I had not been given a flying training as a scientist I think that the
fact that nothing very dreadful occurred when I was, may have
contributed to the decision of the authorities about a year later to
accept other scientists like Lindemann, Farren, G. P. Thomson, Melvill
Jones and others as suitable candidates for this experience.
One of the first things I did on my return to Farnborough was to
design and then use apparatus for making pressure measurements over a
section of a wing in flight. To understand the urge to do this work one
must think of the state of the art at that time. Although Lanchester's
ideas about trailing vortices were known to us, Prandtl's independent
development into a usable form had not penetrated, and we had not
thought of regarding wing drag as having two separable components, form
drag and induced drag. To predict the aerodynamic ch-ractpr of the wing
.. 5
98 'N.4
S .4 . , " 4, . 4. , %'•
USAFA-TR-84-5
we could only rely on tests of models in a wind tunnel and there was
much controversy about the magnitude of scale effects. The only method
for comparing model tests with full scale performance was to compare the
overall performance of the whole machine with that predicted by
extrapolation of the model tests and in this comparison there were so
many possible sources of error that discrepancies could be attributed
to a wide variety of causes according to one's fancy. It seemed to us
that direct measurements of the pressure distribution of a wing in
flight could be made and that a comparison could then be made between
these and similar measurements over a model in a wind tunnel. I do not
think that any measurements of that type had been made in 1915 when I
started, so I had to design the necessary apparatus. I got the
workshops to make a metal strip with 20 pressure holes and insert it in
the wing of a BE2c machine. This was a really stable machine. I could
- *not have made the measurements I did if it had not been stable. I made
a multitube manometer with photographic paper which could be wound over
tha bank of tubes, each of which was connected with one of the pressure
holes, and arranged a light which I could switch on for an instant when
\s I had the machine flying level and steadily on course on a calm day.
Fig. 3 shows the results. In the upper section the positions of the
holes are shown and in the lower the pressure coefficient for each hole
over a range of speeds from 50 to 97 mph. Since I only made
p.3. measurements over one section I could not achieve a comparison between
the known weight of the aeroplane and the integrated upward lift
produced by the observed pressure, but I did get quite good lift and
drag curves for the section, and since the object of the exercise was
to obtain a comparison between something which could be measured
-' ~ directly on a full scale wing and on a geometrically similar model wing
.~.in a wind tunnel, I had done what I set out to do. When the comparable
100
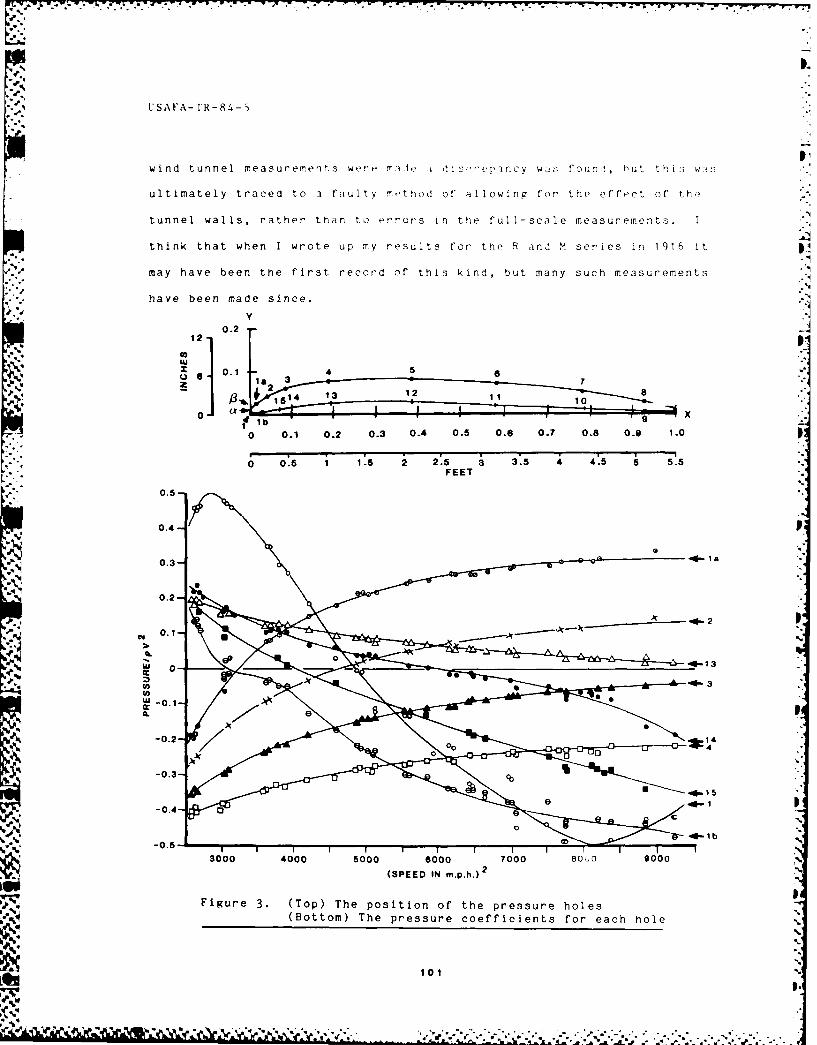
%% )II V 77 . ' .'
%.
tSAFA-ITR-84- 5
wind tunnel me as urements3 w k'r e m:I Ie ri 1s p a rCY W 5: ; fourIns, hut th1i :3 W :iO
ultimately traced to 3 fa--ultyv method of' allowing for the effect or t h,
tunnel walls, rather than to or'-ors in the full-scale measurements. I
think that when I wrote up my results for the R and M series in 1916 it
may have been the first record of this kind, but many such measurements
* have been made since.
0.2p
2
0.1
0.4x
0.5-
0.4--
0-3- 1
b .5 4-l
0.2-
(SPEE 1N m4ph.-22
0---
U) 3
- ~ 0 -1 11 1 :: 10 1S 1*. - * . . . . - . . . . . * * * . -- .
- -% ~~~~~.. ...... . o.. . ...... .-
1-61USAFA-TR- 84-5
Before leaving this phase of my leronautical ;xpor'Irc i
mention one of' the less pleasant machines I used. It was tL: IL;xperimental machine BE2b which had warped wings instead of' aiir'r
was longitudinally very unstable. If it got up to 90 mph while living,
the pull on the stick was enough to require most of my strength to pull
it out of its dive. I must confess that when this happened I was rather
frightened. Since there must be rather few people about who have flown
warped wing machines I might- describe how they operated. They had no
ailerons. Wings in those days were so flexible that unless they were
stiffened by numerous bracing wires they could be twisted without
applying much force, until the angle of incidence at the wing tip was
changed by a degree or so. In warped wing machines some of the bracing
wires were led to the control stick so that a movement of the stick to
the right, say, would decrease the angle of incidence of the right wing
tip and increase that of the left. They were very uncomfortable in
gusty weather because if a gust struck one wing with greater force than
the other the control wires moved the control stick with much greater
force than the pilot could apply. Thus although the machine would bank
on application of a steady force on the stick, the stick itself would be
moving violently and uncontrollably. I found this most uncomfortable in
the BE2b and also in a Caudron warped wing machine which I used.
I left Farnborough, I think, in 1917, and became a meteorological
adviser to the Royal Flying Corps. One of the jobs I did then was to
help organise night flying experiments and in particular to help set
up in France a method devised by Bertram Hopkinson for night bombing.
This was quite simple. Two searchlights were set up about a mile apart
on the line to the target. Their vertical beams could be seen on most
% nights owing to a slight haze in the atmosphere. The pilot got them in
line and set a compass course which would take him along the line
102
* 0°.°
% USAFA-TR-84-5
joining them. He started a stop-watch when passing over the first and
stopped it at the second. By multiplying the time thus recorded by the
ratio of the distance of target to distance between the searchlights the
pilot estimated his time of arrival, assuming the wind remained
constant. At the estimated time he dropped his bombs and went home -
at least that was the theory, but it was never put into practice. We
had set up the equipment in France near the south end of the line and J.
were expecting to bomb Coblenz the next night, but happily peace was
declared during the day and put a stop to the operation.
Methods like those I have described must seem very amateurish to
modern aviators, but it must be remembered that the idea that one could S
navigate at night in an aircraft that was heavier than air was quite new
and very few people could do it. I think a stimulus which made it
important to fly at night was the advent of night bombing raids by rigid
airships. The first time I saw one of these, it was coming down in
flames. I was on leave one night at my parents' home in St Johns Wood
when I was wakened by anti-aircraft fire and suddenly I saw the whole
sky lit up. I realised that something spectacular must be happening and 5
I went to the back of our house and saw an airship falling vertically in
flames. I watched it till it disappeared behind a house whose garden
backed onto ours. I noticed that it appeared just the same length as a
chimney behind which it disappeared. I knew that most airships were
then about 600 feet long so as soon as it was light enough to see
anything I got out my sextant and measured the angle subtended by the
chimney. I also took its compass bearing and so could pin-point the S
position on the map. This point lay in a NNE direction and was about
11 miles away near a place called Cuffley. There was a railway station
near the spot on the Great Northern line. I took the earliest train
there in the morning. I was one of the first there and saw a grisly
103%4,
' .. - -. . - * o. - . -.. '.. .

..
USAFA-TR-84-5
sight with the bodies of the crew still lying about. The whole ruined
structure of the airship, which turned out to be a Schuttei-Lanz, was
Nconfined to an area about equal to its cross section.
Although my only experience as an aircraft pilot was with powered
aeroplanes and a parachute I have been in almost all other types except
gliders, as a passenger. Perhaps t !e passage I enjoyed most was a trip
in a free balloon. It was so beautifully quiet. During the 1914 War
balloons were sometimes used at night as targets for training
searchlight crews and one night I was one of three passengers and a
pilot in the basket. We went up from Kennington Oval and after a short
time we went into the clouds at about 4000 feet. Since we were then of'
no use to the searchlight crews the pilot pulled a cord and released
some gas. We began to go down and very soon broke through the clouds.
Putting my hand out of the basket I could feel a strong upward breeze 5
so we were evidently descending pretty fast. After a time the pilot
thought it was time to let out some sand which we carried as ballast,
for otherwise we would have hit the ground. The sand rapidly dispersed
and fell more slowly than the balloon so, relative to us, it wentdm
upwards. Then as our downward velocity stopped and reversed the sand
caught up and filled the air all round us. It was like a sandstorm. '.
The landing was also interesting. When he wanted to land the pilot let
out a long and rather heavy rope which I should have thought would have
broken any telephone wires it met. As the rope dragged along the ground
it kept us at a more or less constant height of about 100 feet or less
and slowed up our drift. The pilot then directed an electric torch beam
downwards and as the light fell on trees or houses or gardens the
illuminated patch jumped up and down. After a time it stayed down andC.
*the pilot said we must be over a field, so he pulled the gas release
cord and we descended with a moderate bump and bounced I guess some 30
.
104
...... ,C..,,,-...,...,.,..-,-....,- . ; . . . : . ..

USAFA-TR-84-5
feet.
When the war ended I was expecting to return to Cambridge in
October 1919 as lecturer in mathematics. I had half a year to spend
the gratuity which the Government handed out to demobilised officers,
so I was glad when Handley Page offered me the job of watching the
weather and teaching celestial navigation to the navigator of his entry
for the Daily Mail prize for the first direct crossing of the Atlantic.
The crew consisted of H. G. Brackley, pilot, Tryggve Gran, a Norwegian,
as navigator, and Admiral Mark Kerr, whose function I never really-- .
discovered. The engineer who did most of the organ1sing was Stedman,
who afterwards became head of the technical side of the Canadian Air
Force. There were, if my memory is right, four competing parties who
all assembled in St John's, Newfoundland, some time in May 1919.
Although four firms, Vickers, Martinsyde, Sopwith and Handley Page
entered, the affair was essentially a sporting event rather than an
organised commercial competition. There were no aerodromes then in
Newfoundland and each party set to work to make itself its own, erect a
hangar If needed (In fact I do not think any were completed) and then
build its machine. Fig. 4 is a photograph of the Handley Page under
construction in the open. At first we all lived in the only reasonably
comfortable hotel in St John's. Every morning each party rushed off to
Its own site and tried to get ready before the others. At the beginning
of a month there were cheerful parties. This timing was a side effect
of prohibition. When prohibition was introduced in Newfoundland doctors
were allowed to prescribe alcohol in extreme cases for those patients O
who needed it medicinally. They did this at a dollar a time. One of
them, I was told, prescribed about 30 000 a month. A rule was then
introduced which permitted each doctor to prescribe only a limited
number of "scrips" per month. At the beginning of the month, therefore,
%%
, . % . " ... 'w ..-.. . ... . ... . . - .. .- .. -.-..- .. - .- -

r.. :.
USAFA-TR-84-5
the doctors had scrips available and parties were possible.
5%~
'Ca
Figure 4. The Handley Page under construction in Newfouna±and in 1919
The first outfit to get ready was the Martinsyde. They crashed at
the take-off and were never airbourne. The navigator, a man called
Morgan, was slightly injured I believe and when the papers gave out that
the machine was to be repaired but that Morgan might not be able to act
as navigator, people came rushing up from all over America, even from
the Argentine, to offer themselves as substitutes. The hotel became so
crowded one could hardly move. The next to start was the Sopwith with
Hawker as pilot and McKenzie Grieve as navigator. I saw them take off,"4-
which they did apparently without difficulty. They were not heard of
again for over a week, when they turned up in a Norwegian freighter.
They had been picked up at sea and everyone marvelled at the ways of a
beneficlent providence which supplied a ship In the unfrequented area
where they came down at exactly the time and place necessary to save
them. The fact was that when things began to go wrong - I think an pg
oilpipe fractured - they searched the sea for a ship and ditched
106
106

L
USAFA-TR-84-5
themselves alongside when they found it.
The next to take off were Brown and Alcock in the Vickers. That
was a really spectacular affair. Their aerodrome was a rough stretch
on some high ground behind St John's. They ran the full length without
appearing to take off and disappeared from our view apparently below the
level of the ground we were standing on. People near where I was
standing thought they must have crashed, but in a few minutes they came
back at a level which seemed to be about 100 feet and shot straight out
to sea; Brown, the navigator, was not very knowledgeable about celestial
navigation but he pretended to be less than he was, and I remember
talking to him about how he would know where he had got to when he saw
land below him on the other side. He replied "Oh well, if I see ladies
in mantillas I will know it's Spain. If I see people eating frogs I
will know it's France and if I see people hitting one another over the
head it will be Ireland." This is not such a very exaggerated caricature
of the method of navigation actually employed.
When the Vickers got across, the Handley Page, being a lot bigger
than the others, had not completed her flight tests, so they wisely
decided not to attempt the Atlantic crossing but to go down to New York,
where they arrived after some delay caused by a forced landing in a
strawberry field in Nova Scotia. One of the more absurd things that
sticks in my memory was the reaction of Tryggve Gran when he heard the
news that Brown and Alcock had been knighted. He was a very courageous
fellow not very good at English and not very clever. He had recently
married an English actress and sent her a telegram every day to tell her
of his progress. When he heard that Brown and Alcock had been knighted
he thought in his slow way, "If the Handley Page had got across first I
would have been knighted, and then my wife would have been Lady Gran" so
his telegram to her that day was, "Sorry you aren't a lady". He
107
' % %

USAFA-TR-84-5o-,.
couldn't think what was wrong with it.
-e In the years 1914-19 aeroplanes had increased greatly in numbers,
power and reliability but the basic knowledge of fluid mechanics which
was needed for a proper understanding of how they work had not advanced
so rapidly. The advantage of reducing resistance by streamlining struts
and wires was appreciated, but it was not until Melvill Jones pointed
out that the part of the drag due to skin friction and turbulence could
%theoretically be reduced to near that of a flat plate of the same area
% as the wing that designers had an ideal against which they could measure
their performance. The conception that drag is separable into two parts
is a natural consequence of the Lanchester-Prandtl theory of lift. The
combination of this theory with the Jou wsky theory of how circulation
is related to aerofoil section and the boundary layer theory of surface
friction, provided the main themes of aerodynamic research until speed
increased so much that effects of compressibility became important.
Although these ideas provided a basis for design there was a gap
between them and the classical theory of hydrodynamics, so well
expounded in the great treatise of Horace Lamb. Although some of the
conclusions of classical hydrodynamics had been verified experimentally,
those on waves and on slow viscous flow are instances, those on flow
past solid bodies had not. In particular the sphere, geometrically the
simplest, is aerodynamically one of the most complex of bodies, and the
inability of theory to describe flow round what seemed to be the
simplest possible shape told heavily against it in the minds of
practical engineers. When I returned to Cambridge in 1919 I aimed to
bridge the gap between Lamb and Prandtl. In following that course I was
". fortunate enough to interest Rutherford who gave me a room near his own
in the Cavendish Laboratory to work in. The reason for the discrepancy
between classical theory of bodies moving in a fluid and what is
108

USAFA.-TR-84-5
observed was understood at that time. The classical theory permitted
perfect slipping at solid surfaces and the existence of viscosity makes
this surface condition unrealistic. I therefore looked for effects in
the motion of fluids which do not depend on surface conditions. One is
that of rotation which affects fluid flow through the body of the fluid
. rather than at the solid surface. Here I found that classical theory0
Scould predict exactly in some cases how motions which themselveswol
%. not be described by that theory would be modified by rotation.
i.1
Encouraged by this success I looked for and found a number of other
things that could be predicted correctly by classical theory. Since
then, I have witnessed an increasing willingness on the part of mae
L" designers to use the work of theoretical hydrodynamicists. .'
th At this stage I think it is time to stop before I expose my in
Ignorance of modern aeroplanes. I am glad to have lived during the time
they were simple enough for a reasonably intelligent amateur to
appreciate them as mechanisms. They have developed in the kind of way,
but much faster than we thought possible 40 years ago. They have also
had some of the regrettable effects on our lives that I foresaw and
expressed in my Wilbur Wright lecture to this Society 44 years ago. I
then pointed out that every improvement in transport facilities makes it
less worth while to travel on a globe of limited size because the place
of arrival becomes more and more like the place of departure. Although
aeroplanes have not had so detestable an effect on our country as
automobiles, the activities of travel agents are forcing them along the
same destructive path. You may think this an old man's view, but it is
what I thought when I was young and what I still think.
By way of contrast wth the prlymtive state of aeronautics sketched
in this lecture Ima m ention that since writing it I travelled incomfort from Boston to London in a VCb - neither ground nor sea were
,i109
ha oeo h ertal fet On ou ie ht oea n
.4"
,9' 9'.o. .

4. , ,
', visible at any time during our flight. Shortly after" leaving th.e
"] American coast our Captain told us that were were under the guidance of
"2 an automatic pilot controlled from London.
.e2-4
5.,.
,..". .|
"S."
S-.4.,
I'
?-5
1 10 *,i'
4,,.. . - . o . + -. , -. ,4,".. . . . - . , , . . ,. . . ' , . .. - . . . . . . . .% . + . . . . . . . •.
4,",,.' .r;, , .,,, . , . . ,.., .. -.- ,.,., . ,,;.:. ~, , : . .,. : ,, .: +, . . + ., . . . . . ,. ,. .. ,.,
USAFA-'! R-84-5,-
I.
, "
+ : SECTION III.:
4,
Propulsion
*.1'
4,i
.'.I.
• 4.
111 I"
-p -. **,JJw, ..-.. , '4 * *

. -. • • . , .- ... °
USAFA-TR-84-5
% ."
UNCERTAINTY ANALYSIS: A NEW COMPUTER SUBROUTINE
Christopher A. Boedicker*
Editor's Note
An earlier version of this paper won third place in the under-graduate division of the 1983 American Institute of Aeronautics andAstronautics Region V student paper competition.
Abstract
At the USAF Academy, I have developed and implemented a computersubroutine (UNCERT) that greatly simplifies the immense problemsassociated with uncertainty analyses. This paper describes the theorybehind the uncertainty analysis and expl ins how this theory can beimplemented in a computer program.
I. Introduction
Uncertainty analyses are vital for the test engineer. Consider
this example. A firm wishes to purchase a turbine engine compressor,
and the only criterion of importance is polytropic efficiency. Company
A boasts an efficiency of 90 percent, and their number is guaranteed to
within + 0.1 percent. Company B has a compressor with a 91 percent
efficiency, but this number can only be guaranteed to within ± 2
percent. Which compressor should the firm buy? The importance of
uncertainty analysis may be somewhat clearer now.
Analyzing the uncertainty before a test gives the engineer an
indication of the expected accuracy of the test results. In the absence
of universally accepted standards, it is usually the engineer who
determines the uncertainty values that are acceptable for a particular
test. For example, in a test for which only mass flow and Mach number
are calculated, an engineer may specify that he needs to know mass flow
within + 0.5 percent, but a Mach number within + 3 percent is
acceptable. If pretest uncertainties are too large, corrective action
dcan often be taken. Specific methods for reducing uncertainty will be
discussed later.
* I have developed a computer subroutine called UNCERT to facilitate
*Cadet, USAF Academy
112
" ,% % ..- k A .. ....... ..
LS A tS FA - VR - 1 -7"""
uncertainty analysis. One can attach UNCERT to a computer program that
contains performance calculations in a separate subroutine. Pretest -
analyses show the test engineer where problems exist so corrective
action can be taken, if necessary. Once the test has been completed, S
UNCERT provides the user with a reportable measure of the accuracy of
the results. This paper discusses the theory behind the uncertainty
analysis, explains how to use the subroutine, and presents the results
of an actual application of the subroutine.4.'
II. Theory
Uncertainty analysis concerns the mathematical reliability of an £
experiment. A detailed discussion of the theory behind uncertainty
N analysis appears in Ref. 3; the paragraphs below summarize the main
ideas from that article.
In looking at the results of an experiment, one musL distinguish
between error and uncertainty. Error is a certain fixed value and
refers to the difference between a measurement and the true value of a
quantity. Uncertainty, on the other hand, is a measure of accuracy and _
represents a range of values within which the result is expected to
tall.
Two types of error are associated with any measurement: random
(precision) error and fixed (bias) error. Random errors occur because
small, independent influences prevent the measurement system from
delivering the same reading when supplied with the same input value.
Deviation from the mean approximates a normal distribution (Figure 1). 5
Standard deviation is used as i mas.re of the precision error, and the
statistic S, cal led tee h 'e:< :' s, 14 js I tr estimate the
standard deviation. .s .. ' , .
-- 1 .
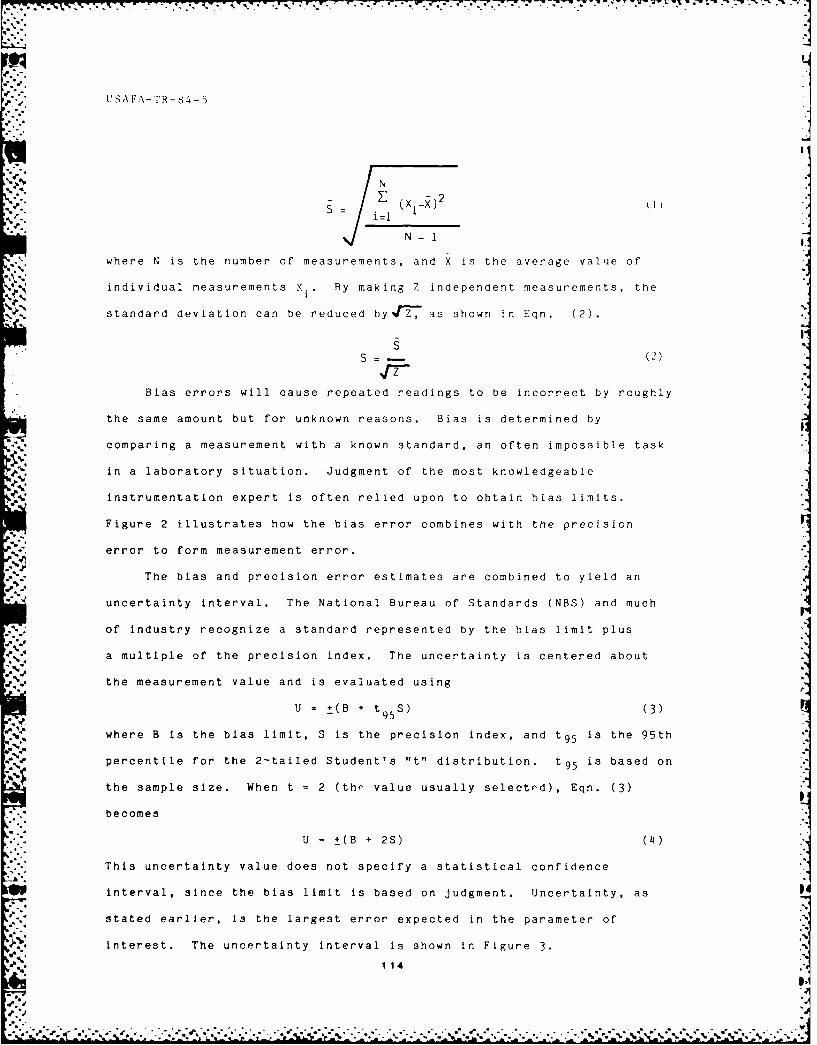
U SAF-TR- 84-
IN- (X-) 2
N-i
where N is the number of measurements, and X is the average value of
individual measurements X.. By making Z independent measurements, the
standard deviation can be reduced by 2 T, as shown in Eqn. (2).
gSS =(2).rz-
Bias errors will cause repeated readings to be incorrect by roughly
the same amount but for unknown reasons. Bias is determined by
-'. comparing a measurement with a known standard, an often impossible task
4. , in a laboratory situation. Judgment of the most knowledgeable
instrumentation expert is often relied upon to obtain bias limits.
Figure 2 illustrates how the bias error combines with the precision
error to form measurement error.
The bias and precision error estimates are combined to yield an
uncertainty interval. The National Bureau of Standards (NBS) and much
a's of industry recognize a standard represented by the bias limit plus
.'a a multiple of the precision index. The uncertainty is centered about
the measurement value and is evaluated using
U = +(B + t 5) (3)95
where B is the bias limit, S is the precision index, and t 95 is the 95th
percentile for the 2-tailed Student's "t" distribution. t 95 is based on
the sample size. When t = 2 (thp value usually selectrd), Eqn. (3)
, becomes
U +(B + 2S) (4)
This uncertainty value does not specify a statistical confidence
Interval, since the bias limit is based on judgment. Uncertainty, as
stated earlier, Is the largest error expected in the parameter of
a.% Interest. The uncertainty interval is shown in Figure 3.
1 114

'S A FA -rTR-84- 5
Average MeasurementW
E- '~ Sciatter Due to Precision Error
0
Q- Standard DeviationS Estimate oft4-
Parameter Measurement Value
Figure 1. Precision Error
True (NBS) Value
Average Measurement
BiaE
a Scatter Dueto Precision Error
SS
C
U.
loParameter Measurement Value
Figure 2. Bias and Precision Error
12
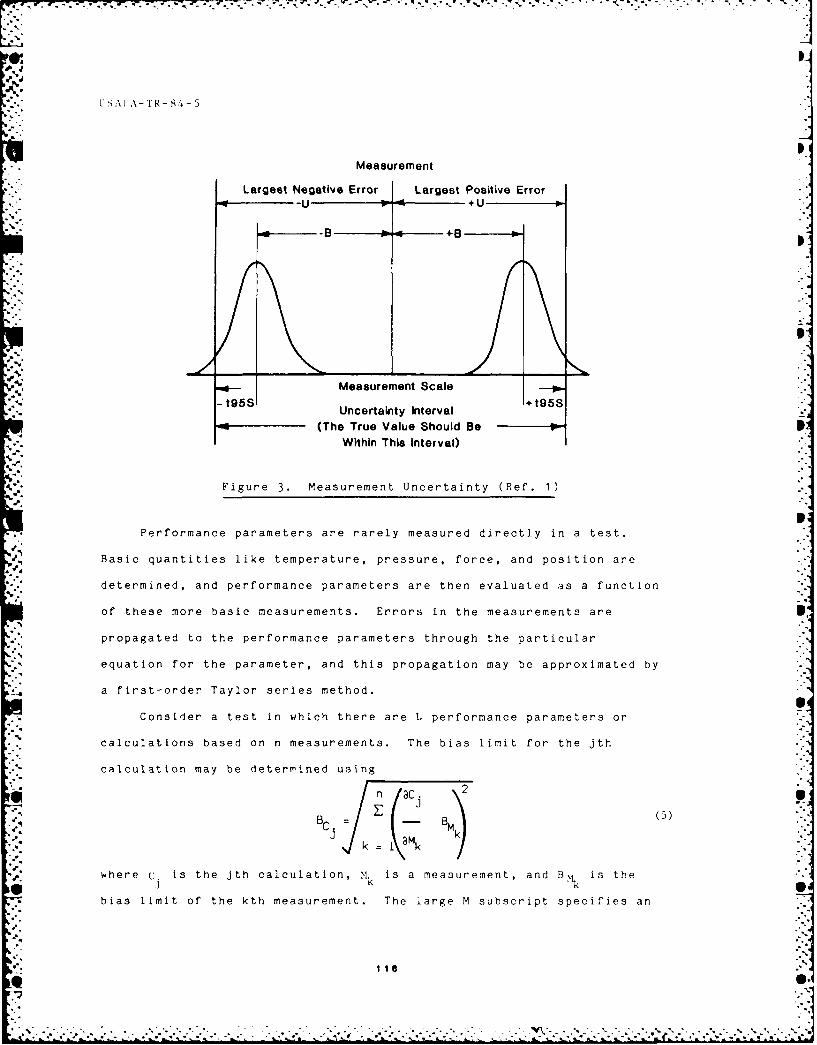
L''AFA- TR- 84- 5
Measurement
Largest Negative Error Largest Positive Error, U + U
-B +B -
Measurement ScaleUncertainty Interval +t95S
(The True Value Should BeWithin This Interval)
Figure 3. Measurement Uncertainty (Ref. 1)
Performance parameters are rarely measured directly in a test.
Basic quantities like temperature, pressure, force, and position are
determined, and performance parameters are then evaluated as a function
of these more basic measurements. Errors in the measurements are
propagated to the performance parameters through the particular
equation for the parameter, and this propagation may be approximated by
a first-order Taylor series method.
Consider a test in which there are L performance parameters or
calculations based on n measurements. The bias limit for the jth
calculation may be determined using
n aCj- -- 8(5)
c M
where c is the jth calculation, >I£k is a measurement, and Bkis the
* ~Jbias limit of the kth measurement. The iarge M subscript specifies an
118
"-..

S S A i,.\- r R - s 4 - 5
estimate of the error for a measurement; the large C subscript specifies
an estimate of the error for d calculation. A similar method is used
to determine the precision index for each of the calculations.
s c S kf( M) (6)
jC k.
i'.k7. S1( k
where S represents the precision index associated with the kth
measurement. Once these numbers have been obtained, they may be added
usingU +( B + t95 S
3 i i (7)
to obtain the uncertainty in the jth calculation.ined parameter is the
III. Reasons for Computer Application
Although methods to determine uncertainties are available, some
tests are so complex that analytic solutions to the problem
cannot be obtained easily, if at all. The propagation of errors
(through numerous measurements) may also prevent an analytic solution.
Numerical solutions must therefore be used. The partial derivatives in
Eqns. (5) and (6) must be evaluated using
ac. AC.
-__ ~ (8)
aMk AMk
- where C is a calculated value, and M is a measurement. To facilitate
calculations, a non-dimensional number should be used:
-- (9)AMk nominal
This is the sensitivity coefficient, expressed in percent per percent.
At this point, we can use a time-saving computer subroutine to
117
. - . . . ...
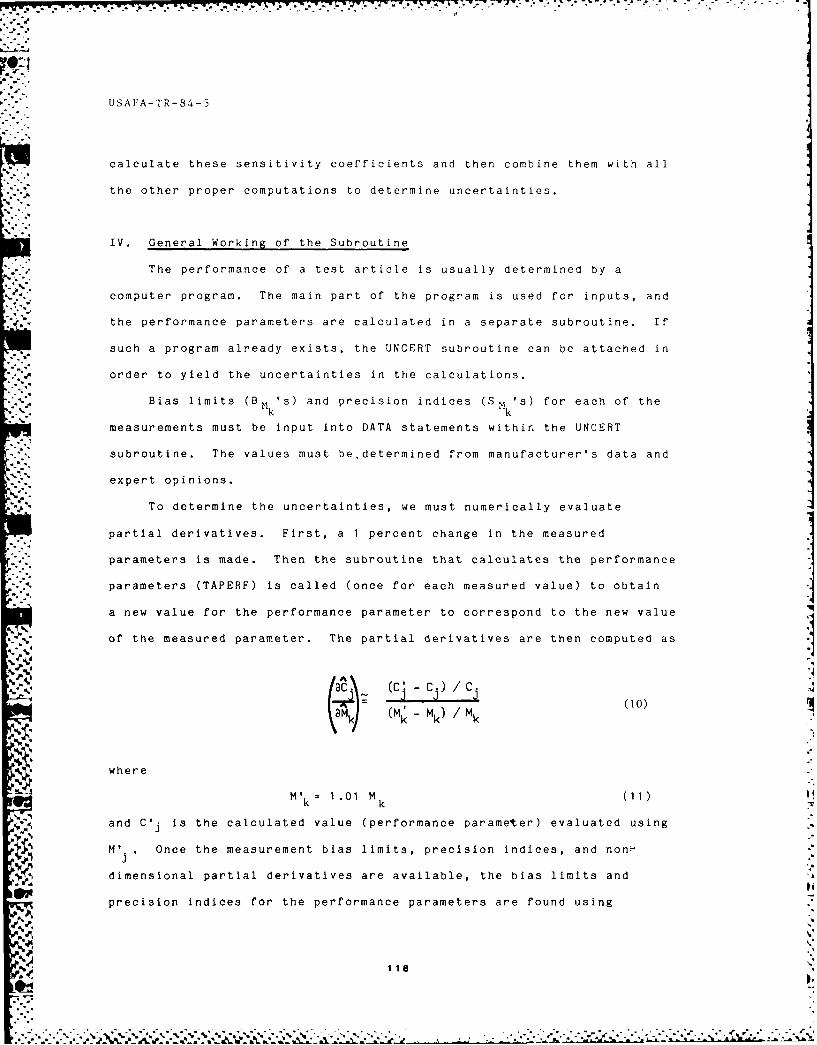
. --. . . .
USAFA-TR-84-5
calculate these sensitivity coefficients and then combine them with all
the other proper computations to determine uncertainties.
IV. General Working of the Subroutine
The performance of a test article is usually determined by a
computer program. The main part of the program is used for inputs, and
the performance parameters are calculated in a separate subroutine. If
such a program already exists, the UNCERT subroutine can be attached in
order to yield the uncertainties in the calculations.
. .IBias limits (B - ) and precision indices (S\ 's) for each of the'%k k
measurements must be input into DATA statements within the UNCERT: I
subroutine. The values must be~determined from manufacturer's data and
expert opinions.
To determine the uncertainties, we must numerically evaluate
partial derivatives. First, a 1 percent change in the measured
*.[. parameters is made. Then the subroutine that calculates the performance
parameters (TAPERF) is called (once for each measured value) to obtain
a new value for the performance parameter to correspond to the new value
of the measured parameter. The partial derivatives are then computed as
~IA%(C C(10)
(M - M k /Mk
where
M = 1.01 M (11)
k k
and C'j is the calculated value (performance parameter) evaluated using
M'.. Once the measurement bias limits, precision indices, and non
dimensional partial derivatives are available, the bias limits andPd
precision indices for the performance parameters are found using
%%
118
," " ", • ", " ", 'w' -'. -L ', '-"".''." :, ' ':,'' ' ".,'-''," - , - ",""-""-""-''. " " "" " ', ". "- "- f, "'" "'"",'- '-' ,'" ' "" '-" "" "" ", .
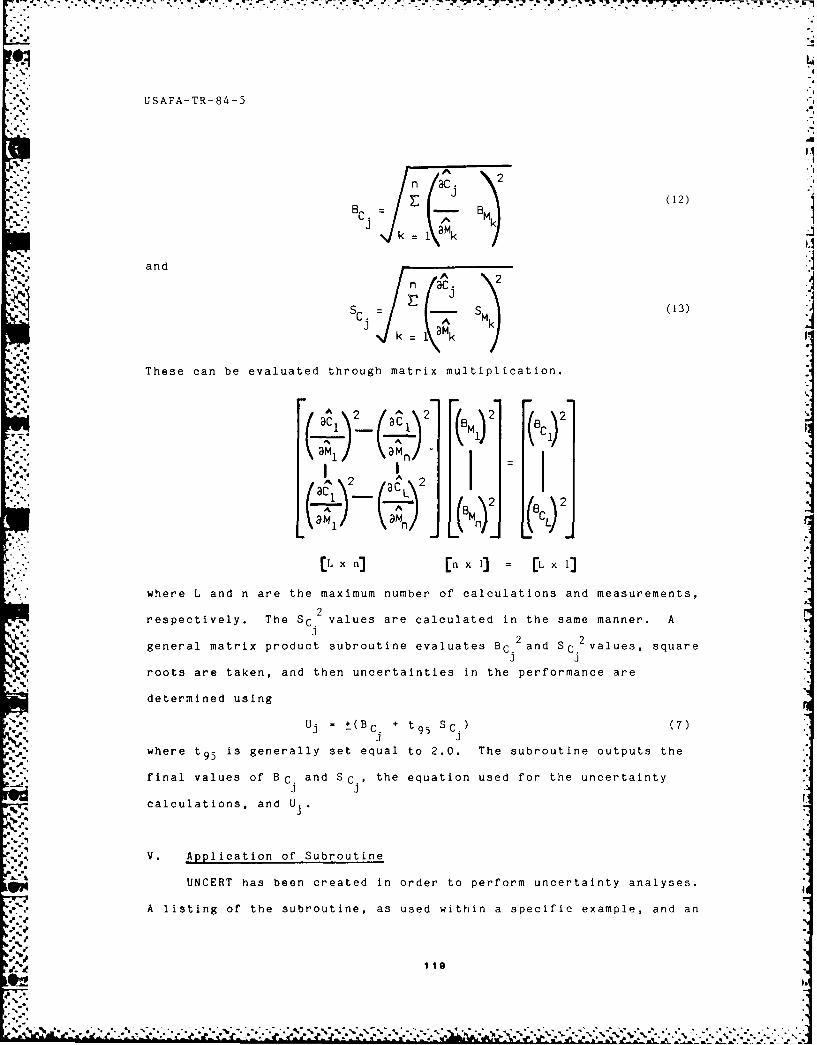
-'- .. ._,. -
USAFA-TR-84-5
B C - E( ^. i B (12)
Bj= k I am
and
EC S (13)C ~A
J I MN
These can be evaluated through matrix multiplication.
"..' ( 2 A 2 2
ac. - .o1
where L and n are the maximum number of calculations and measurements,
respectively. The SC values are calculated in the same manner. A
general matrix product subroutine evaluates BC. and SC. values, square
roots are taken, and then uncertainties in the performance are
determined usingU'. = _(B= + t S ) (7)
.4 .- C .9 C ."
'*i J .3 "
where t 9 5 is generally set equal to 2.0. The subroutine outputs the
final values of BC. and SC., the equation used for the uncertainty
calculations, and U .
. ..
V. Application of Subroutine
UNCERT has been created in order to perform uncertainty analyses.
A listing of the subroutine, as used within a specific example, and an
Sit%119
%.-. .

, ~USAFA-'rR-84-5
explanation of how the subroutine can be used appear in Appendix A.
Because of the length of the program, only those portions necessary to
understand UNCERT will be examined.
VI. Application Example
The UNCERT subroutine has been used to calculate uncertainties
for a centrifugal compressor test at the Wright-Patterson AFB Aero
Propulsion Lab. The main program, used to input the proper measare-
ments, was called RUNTA (Run Test Article), and the performance was
computed in a subroutine called TAPERF (Test Article Performance).
The relevant parts of this program are listed in Appendix A.
The compressor to be evaluated was designed and manufactured by the
Garrett Turbine Engine Company. Figure 4 shows a cross section of this
compressor, with measurement station designations. This compressor has
variable geometry with a flow rate of about 25 lbm/sec of air at design
. speed (23,000 rpm), and it develops an 8:1 pressure ratio in the single
.-: stage. RUNTA, using TAPERF, computes 64 different performance/aero-
dynamic parameters based on 20 different measurements. The continuity
equation, velocity diagrams, and the Euler Turbomachinery equation are
used with 1kdimensiorial, steady-flow assumptions to evaluate the
compressor's performance. We also employ iterative schemes in some
cases to find certain performance parameters. The final calculations
.involve the use of simple definitions, such as pressure recoveries or
Iefficiencies.The results of the RUNTA program appear in Appendix B. The
nominal performance values are listed first. Then, in accordance with
Dr. Abernethy's recommendations (Refs. 1 and 2), the equation for the
uncertainty, the bias limits, the precision indices, and the final
uncertainty values (in + percent) are given as output.
120 -
%21 4S.*1._!._-_Z*PV

L. .--. S - P
p-
P. 4
USAFA-TR-84-5 jI
2.9 3.0
~~~~DIFFUSER VANE -"[
STRU DESWIRL VANE4..,) F <.
IV7'"1.9 2.0 2.5 - 1
FLOW PATH
~IMPELLER
ARTICULATED IGV
_ ] Figure 4. Compressor Flowpath and Station Designation
5'p The results provide some interesting insights into the uncertainty
analysis. Some of the uncertainties found are in excess of +10 percent.
An examination of the data shows that several different factors may have
5, led to these high uncertainty values. First, the method we used to
%.
4%-., calculate the performance parameter may have resulted in high values for
the influence coefficients. At the test article's operating point, the
performance/aerodynamic parameter may have been highly sensitive to
-; small changes In a measured value. Second, the instruments used to
determine the value of the measurement may have had high bias limits
and/or high precision indices. Finally, the uncertainty may have S
%'5 resulted from the point of operation of the test article. For example,
transducers are most accurate when they are operating near 100 percent
of their range. At lower values, the uncertainty associated with a
... . transducer can increase significantly. ... .
~121
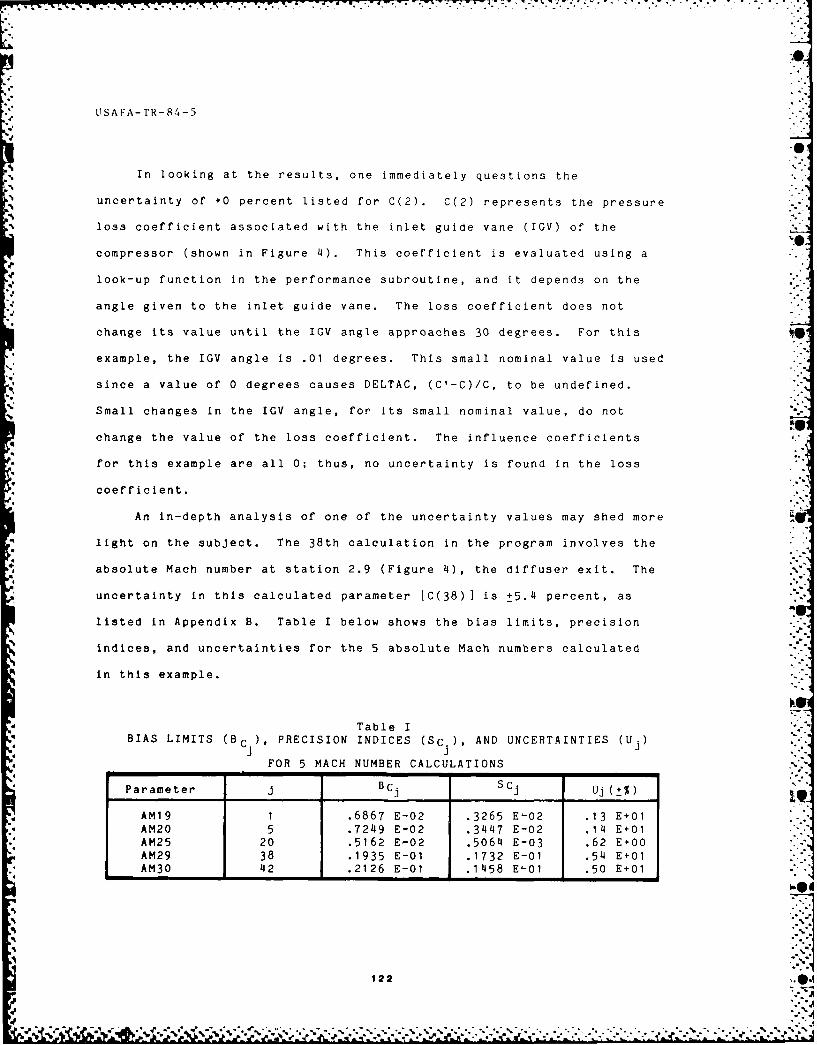
*USAFA-TR-84-5 i-[LT SA FA - R " - °
In looking at the results, one immediately questions the
uncertainty of +0 percent listed for C(2). C(2) represents the pressure
loss coefficient associated with the inlet guide vane (IGV) of the
compressor (shown in Figure 4). This coefficient is evaluated using a
look-up function in the performance subroutine, and it depends on the
angle given to the inlet guide vane. The loss coefficient does not
change its value until the IGV angle approaches 30 degrees. For this 5
example, the IGV angle is .01 degrees. This small nominal value is used
since a value of 0 degrees causes DELTAC, (C'-C)/C, to be undefined.
Small changes in the IGV angle, for its small nominal value, do not
change the value of the loss coefficient. The influence coefficients
for this example are all 0; thus, no uncertainty is found in the loss
coefficient.
An in-depth analysis of one of the uncertainty values may shed more
light on the subject. The 38th calculation in the program involves the
absolute Mach number at station 2.9 (Figure 4), the diffuser exit. The
uncertainty In this calculated parameter [C(38) ] is +5.4 percent, as
listed in Appendix B. Table I below shows the bias limits, precision
indices, and uncertainties for the 5 absolute Mach numbers calculated
in this example.
Table IBIAS LIMITS (Bc), PRECISION INDICES (SC.), AND UNCERTAINTIES (U.)
FOR 5 MACH NUMBER CALCULATIONS
Parameter j BCj SCj Uj (%) LAM19 1 .6867 E-02 .3265 E-02 .13 E 01AM20 5 .7249 E-02 .3447 E-02 .14 E+01AM25 20 .5162 E-02 .5064 E-03 .62 E+00AM29 38 .1935 E-01 .1732 E-01 .54 E+01AM30 42 .2126 E-01 .1458 E-01 .50 E+01
122 0% %
¢ i ; ; ... < : ? < ; ) 5. .:: ? , 2 .[ : > : : , : : : : ; : ': , < , .> ? -.: € , ) [ < :

S..
USAFA-TR-84-5
The uncertainties in the absolute Mach numbers at stations 2.9 and 3.0
are both over 5 percent. Looking at Table I, one can see that the bias
limits and precision indices for these calculations are significantly
higher than those for the other 3 Mach numbers. Looking back at Eqns.
(12) and (13), one can see that high values for the partial derivatives
or the measurement bias limits or precision indices would cause high
values in BC. and SC., and thus large uncertainties. If a problem
J jexists, there are several ways to correct it. Lower values for B
should not be input in order to lower the overall uncertainty. The
first estimate was based on expert opinion, and changing this value
until a desired result is achieved defeats the purpose of the
uncertainty analysis. The S1M values, however, could be lowered in
order to alleviate high uncertainties. Either more or better
transducers could be used to lower the S Mk values. More could be used
since
1 (14)
where Z is the number of transducers whose outputs are averaged together
to give the measured value. However, cost and space available for
transducers may be prohibitive. A final method to lower the uncertainty
would be to change the equation used to calculate the parameter of
interest. A different equation, if one exists, might favorably alter
the value of the partial derivative.
We can use the Mach number example to illustrate some of the
problems that might be encountered using a given calculation method.
Since the bias limit and precision index for any given calculation are
based on partial derivatives, the equation becomes very important. If
static and total pressure are known at a given point, Mach number may be
calculated using
123

-. -'- -'. - . . .- . I " - ?
|
USAFA-TR-84-5 "jj
•T" y - 1 ,
2
'/1
Solving for M yields
2 PT y-1/y".- M P- (16)
The partial derivatives are
aM 1 I
aP P 2 P y-i/y (17)
- -I) PT
am T
Lap PS PSY PS (18)
y-1
The influence coefficients would be obtained by multiplying the above 2
equations by M m and , respectively. Note thatM b nom nom
%PT am PS am
T-'..
-- - (19)% M aP M aPT
The change in the influence coefficients in the above equation with
T/P (or Mach number) is shown in Figure 5.
Figure 5 shows that a Mach number calculation using Eqn. (16) is
quite sensitive to errors in P or PS, especially for low, subsonic Mach :2numbers. Table II is a list of some of the partial derivatives of the
* Mach numbers.
124
Al%

- i USAFA-TR-84- 5
Dimensionless 25InfluenceCoefficients 2 P)i'y
20 .
• ,.". i I I PSI
P 15
or
0.6 0.7 0.8 0.9 1.0
Figure 5. Mach Number Sensitivity
A A Table IIaCj/3AMk: PARTIAL DERIVATIVES OF MACH NUMBERSWITH RESPECT TO STATIC AND TOTAL PRESSURES
(GIVEN IN %/%)
-.. (Mk)
PS25 PS29 PS30 PT29 PT30AM19 0 0 0 0 0AM20 0 0 0 0 0
(Cj) AM25 .1264 E+O0 0 0 0 0AM29 .4306 E-03 .8898 E+O 0 .8191 E+O1 0AM30 .4314 E-03 0 .9815 E-01 0 .8958 E+O1
The partial derivative values shown above actually represent the
%.. percentage change in a calculated value that can be expected for a 1
percent change in a given measured value. Thus, one can expect an 8.898
percent Increase in the absolute Mach number at station 2.9 for a 1
percent increase in the static pressure at that station. A negative
value for a sensitivity coefficient means that one can expect a decrease
Iin the calculated value when the measurement is increased. The partial
derivatives for the Mach numbers at stations 2.9 and 3.0 (AM29 and AM30)
.W%
126
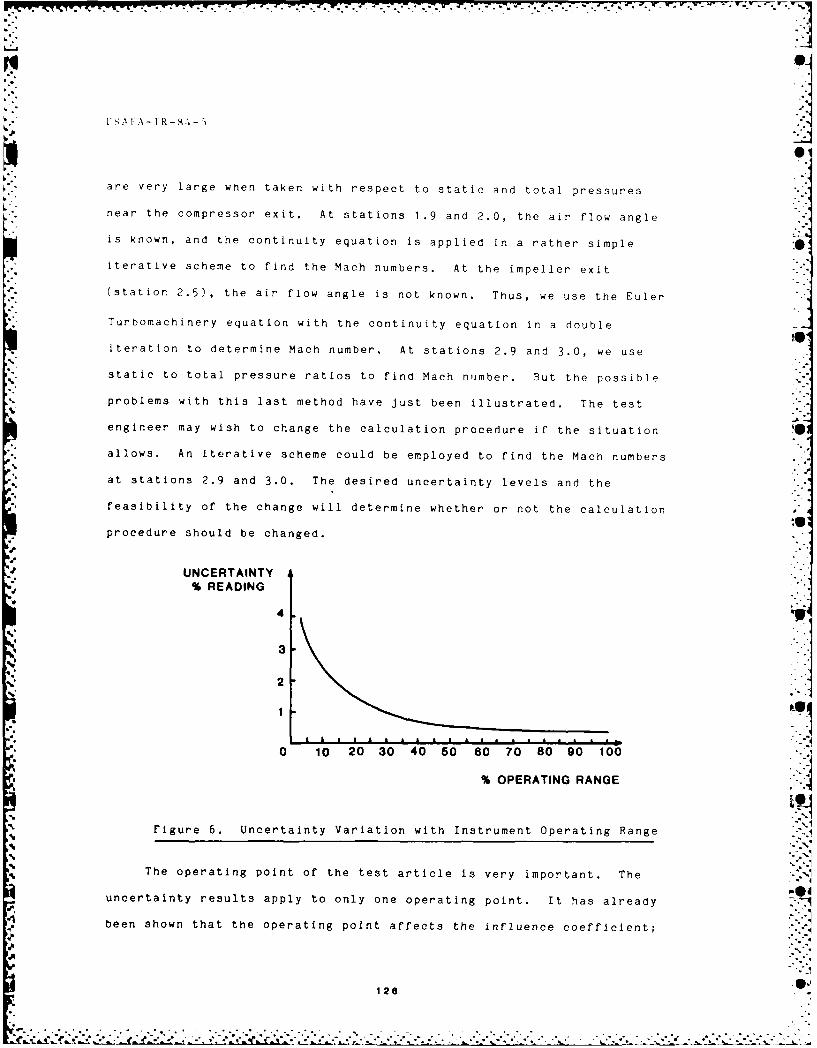
L 'SO A-IR- 84-
are very large when taken with respect to static and total pressures
near the compressor exit. At stations 1.9 and 2.0, the air flow angle
is known, and the continuity equation is applied in a rather simple
iterative scheme to find the Mach numbers. At the impeller exit
(station 2.5), the air flow angle is not known. Thus, we use the Euler
Turbomachinery equation with the continuity equation in a double
iteration to determine Mach number. At stations 2.9 and 3.0, we use
static to total pressure ratios to find Mach number. But the possible
problems with this last method have just been illustrated. The test
engineer may wish to change the calculation procedure if the situation
allows. An iterative scheme could be employed to find the Mach numbers
at stations 2.9 and 3.0. The desired uncertainty levels and the
feasibility of the change will determine whether or not the calculation
procedure should be changed.
UNCERTAINTY% READING
4 6 -
3
L -A- .-
0 10 20 30 40 50 60 70 80 90 100
% OPERATING RANGE
Figure 6. Uncertainty Variation with Instrument Operating Range
The operating point of the test article is very important. The
uncertainty results apply to only one operating point. It has already S.'
been shown that the operating point affects the influence coefficient;
126
it may also affect t he ai s iI ;It I T, p r [o 1 1 X 1: 05 n i Sit d 4 i t
oi r •'y t ii poi
given transducer. Figure 6 shoull clarify this point. If the t, st
article is not operating so that the transducers and instrumentation are
near 100 percent of their prescribed range, then uncertainties can be
higher than those obtained at a "design point." If the test must be
performed far from the design point, then better or different
transducers might be needed, meaning large expenditures of time and
money. Unfortunately, in many cases nothing can be done. Either the
uncertainties must be accepted, or the test must be cancelled. If the
uncertainty analysis is performed, however, it still enables the test
engineer to tell how accurate the answers from that test will be.
In summary, high uncertainties can result from many different
sources. Calculation methods may lead to large sensitivity
coefficients. If this is true, new calculation procedures should be
sought. Also, the bias limits and precision indices may be too large.
Better, more expensive transducers can be used to alleviate this
problem. The measurement's precision index may be reduced by measuring
the same variable with more transducers. Finally, the point of
operation of the test article may cause high uncertainties. Better
transducers could be used in this situation, or the engineer might
choose to change transducers, depending on the specific point of
operation. The feasibility of adopting many of these options depends
% on the time and money available to the test director.
VII. Summary
The UNCERT subroutine has been developed to perform uncertaintyIcalculations for various experimental test articles with existing
performance programs. The work required to attach the subroutine and
make the required additional statements is not excessive, especially if
A' 127
e, %%" ° ~~~~~~~~.. ".. .% .... . ." . . , .o. . . .. -. o..-". "..q "° ".°. ."- . .-.. ,• -o-.... .-. '."" .°

'' ---" -. . .. ..-"]7"
USAFA-TR-84-5
S. 01
one considers that at present most uncertainty analyses are either very
time-consuming or are never accomplished. Using the UNCERT subroutine
before a test is conducted can identify potential problem areas so that
the test engineer can decide whether to continue the test. If the
alterations lead to excessive costs, the engineer might cancel the test
before wasting large amounts of money. If the test is conducted,
results of the final uncertainty analysis can be compared to the pretest
analyses. The UNCERT subroutine can provide a valuable resource for any
test facility.
Symbols
English Symbols
BC. bias limit associated with a performance
parameter
B Mk bias limit of an individual measurement
bk elemental bias limit
Cj the Jth calculation
L total number of calculated parameters
Mk the kth measurement
N number of samples
n total number of measurements
SC. precision index associated with a performance
parameter
SM precision index of an individual measurement
S k elemental precision index
S,S estimate of the standard deviation, or
precision index
t9 5 95th percentile for a 2-tailed Student's
'p t-distribution
4128 0
22 OS'S
US A F AF- R-84- 5
o"
Uj uncertainty; an estimate of the error
X an observed value; an individual measurement
Xi sample average of measurements
Z number of transducers
Greek Symbols
A A(Mk) sensitivity (influence) coefficient
degrees of freedom involved in a sample
true standard deviation of repeated values of
measurement
Superscripts
represents a new measurement or calculation
value when a specified change has been made
in a measured value
denotes a non-dimensional value
Subscripts
j specifies a number from 1 to L
k specifies a number from 1 to n
Computer Variable Names
ANSWER final uncertainty value determined by U
B + 2S
BCJ Bc. values
j4 BMK BMk values
C calculated value
CPRM (C') represents the value of a calculated
parameter after it has been evaluated using a
*. ** value of M'
DC dummy array containing the performance
parameters calculated by the performance
equations
129
%I

A ~ADCODM C CM) sensitivity -oo!"i i- .t
DELTAC (C'.C )/C.
DELTAM (Mk-
M measured value
MP (M' ) represents thp vili ,'
after a 1 percent incr-l ..
measurement nas been mal-
ScJ S( valIues
SMK S values
References
1. Abernethy, R.B., "Fluid Flow Measurement Uncertainty." Draft
Revision of ISO/DIS 5168, Nov. 1981.
2. Abernethy, R.B. anid J.W. Thompson, Jr., Handbook, Uncertainty in
Gas Turbine Measurements, AEDC-TR-73-5, Feb. 1973.
3. Stiles, R.J. and C.A. Boedicker, An Example of Uncertainty Analysis
* - in Compressor Testing, USAFA-TR-83-2, March 1983.
130
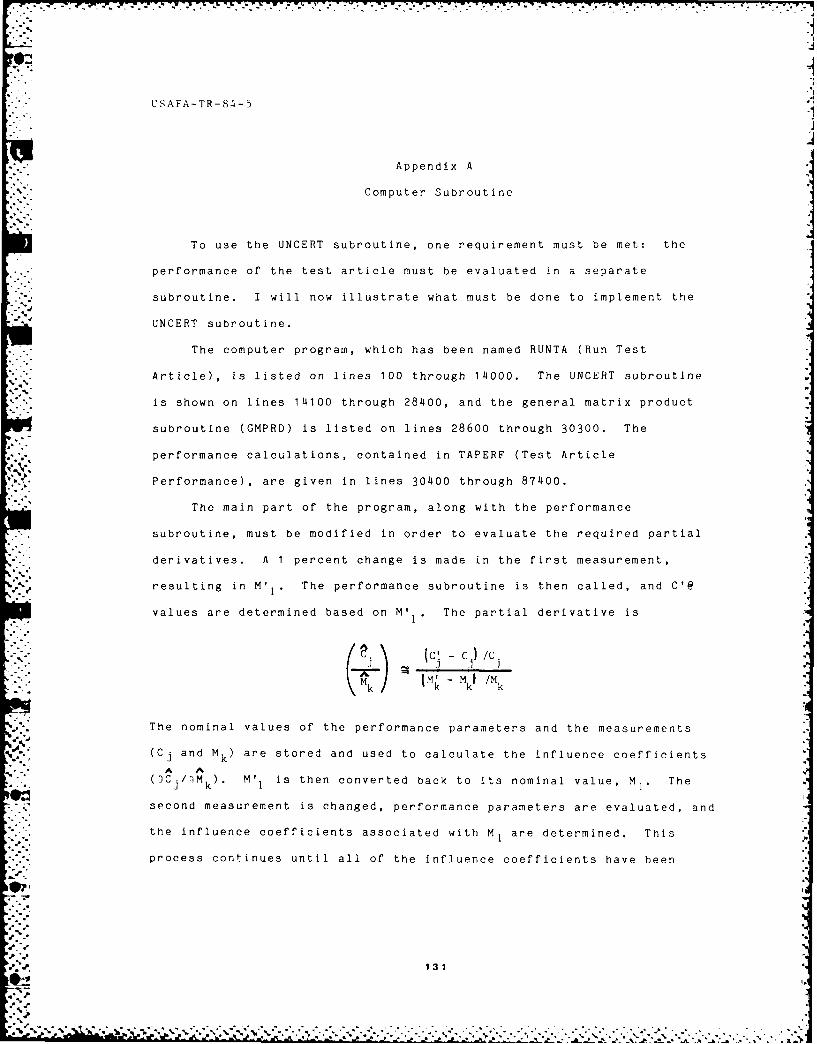
-o°. :W
USAFA-TR-84- 5
Appendix A
Computer Subroutine
To use the UNCERT subroutine, one requirement must be met: the
performance of the test article must be evaluated in a separate
subroutine. I will now illustrate what must be done to implement the%
UNCERT subroutine.
The computer program, which has been named RUNTA (Run Test
Article), is listed on lines 100 through 14000. The UNCERT subroutine
is shown on lines 14100 through 28400, and the general matrix product
subroutine (GMPRD) is listed on lines 28600 through 30300. The
performance calculations, contained in TAPERF (Test Article
Performance), are given in lines 30400 through 87400.
The main part of the program, along with the performance
subroutine, must be modified in order to evaluate the required partial
derivatives. A I percent change is made in the first measurement,
, ,. resulting in M' The performance subroutine is then called, and C'@
values are determined based on M' I . The partial derivative is
:-'-" t.; - c.),c.
(+k) (M- 'k /Mk
The nominal values of the performance parameters and the measurements
(Cj and Mk) are stored and used to calculate the influence coefficients
* A A%
()C./ Mk). M' is then converted back to its nominal value, M. The
second measurement is changed, performance parameters are evaluated, and
the influence coefficients associated with M| are determined. This
process continues until all of the influence coefficients have been
131
.'p
w ...........
USAFA-TR-84-5
computed.
For the UNCERT subroutine to evaluate sensitivity coefficients
correctly, certain assignment statements must be added to the main
program and the performance subroutine. In the main program, we must
place the various measurements into the M array. For example, if there
are five different measurements, then the required assignment statements
would resemble
100 MM = Measurement Variable Name #1.
200 M(2) = Measurement Variable Name #2300 M(3) = Measurement Variable Name #3400 M(M) = Measurement Variable Name #4500 M(5) = Measurement Variable Name #5
The variable names would correspond to the measured parameters on which
the performance calculations depend. This can be seen on lines 8800
through 10700 in this Appendix.
In the performance subroutine (TAPERF), we place all of the
performance calculations into a dummy array at the end of the
' subroutine. This is seen on lines 79800 through 86100. The values
stored in the dummy array are then placed into either a Cj or C'. array.
When we use the nominal values of the measurements to evaluate the
performance parameters, we can then place and store the values of these
calculations in the Cj array. When a 1 percent change in a measurement
(producing M'k) is made, the resulting performance calculations are-I r:placed in the C'j array. Once the C' values have been stored, we can
calculate the influence coefficients using Eqn. (Al). The user must
employ a "flag" so that the program can determine whether to place the
performance calculations in the C and C' array. The flag, IFLAG, must
be placed into COMMON blocks in both the main program and the
performance subroutine (lines 2000 and 37800, respectively). Before
calling the performance subroutine in the main program, the flag is set
to 0 (line 10900). In the performance subroutine, the code appears on
..
-132
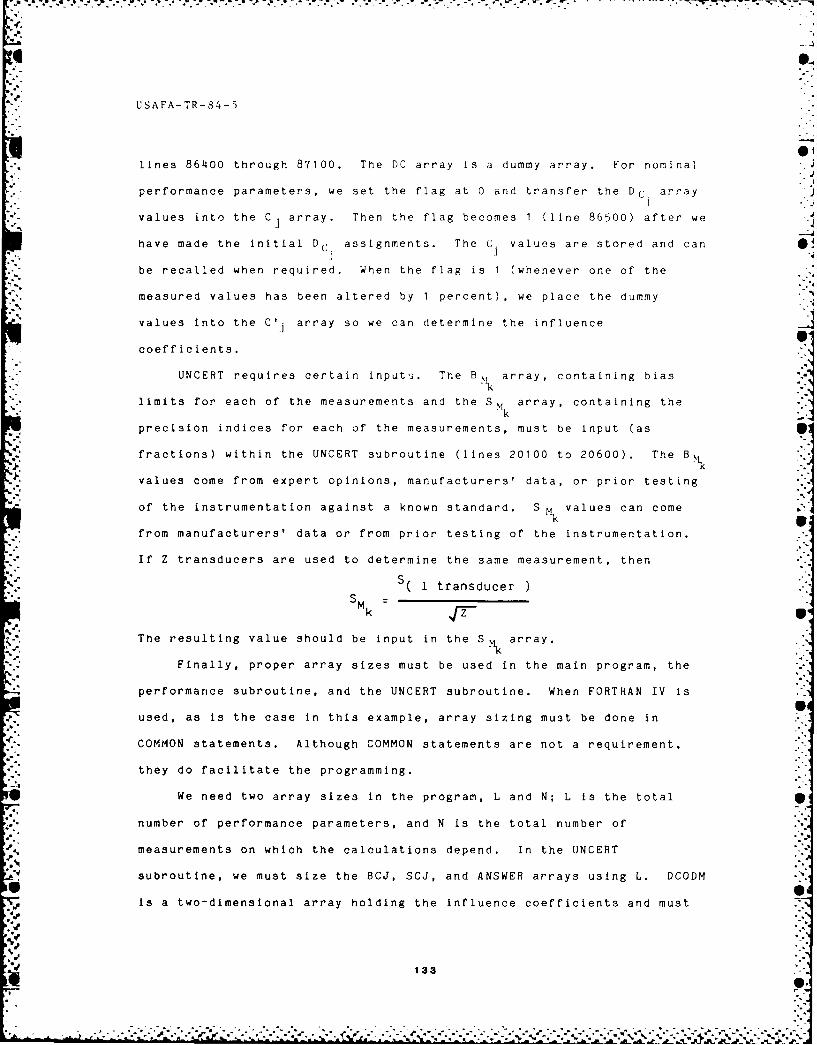
USAFA-TR-84-5
lines 86400 through 87100. The DC array is a dummy array. For nominal
performance parameters, we set the flag at 0 and transfer the DC array
values into the C1 array. Then the flag becomes 1 (line 86500) after we
have made the initial DC assignments. The C. values are stored and can.1
be recalled when required. When the flag is 1 (whenever one of the
measured values has been altered by 1 percent), we place the dummy
values into the C'j array so we can determine the influence
coefficients.
UNCERT requires certain input'3. The B, array, containing bias
limits for each of the measurements and the S\ array, containing the
precision indices for each of the measurements, must be input (as
fractions) within the UNCERT subroutine (lines 20100 to 20600). The B.
values come from expert opinions, manufacturers' data, or prior testing
of the instrumentation against a known standard. S m values can come
from manufacturers' data or from prior testing of the instrumentation.
If Z transducers are used to determine the same measurement, then
I transducerSMk
S k Z
The resulting value should be input in the S array.
Finally, proper array sizes must be used in the main program, the
performance subroutine, and the UNCERT subroutine. When FORTRAN IV is
used, as Is the case in this example, array sizing must be done in
COMMON statements. Although COMMON statements are not a requirement,
they do facilitate the programming.
We need two array sizes in the program, L and N; L is the total
number of performance parameters, and N is the total number of
measurements on which the calculations depend. In the UNCERT
subroutine, we must size the BCJ, SCJ, and ANSWER arrays using L. DCODM
Is a two-dimensional array holding the influence coefficients and must
133
S,
* * .. i
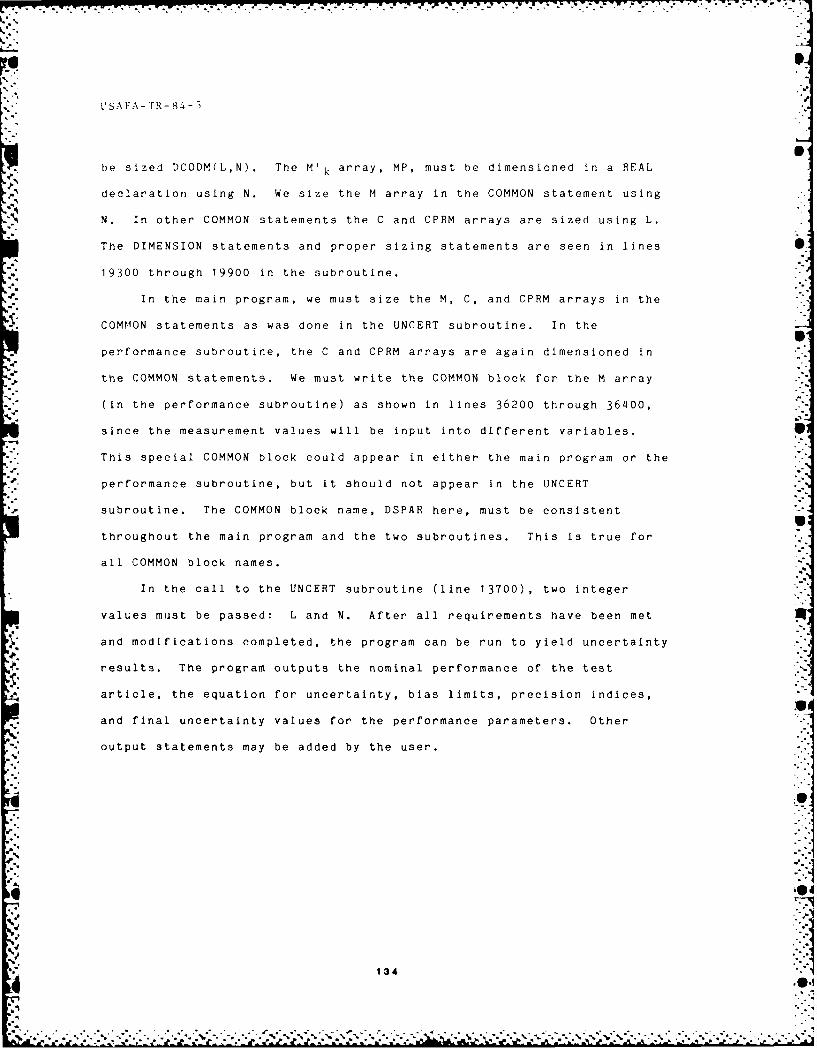
USAFA-TR--3-.
be sized DCODM(L,N). The M'k array, MP, must be dimensioned in a REAL
declaration using N. We size the M array in the COMMON statement using
N. In other COMMON statements the C and CPRM arrays are sized using L.
The DIMENSION statements and proper sizing statements are seen in lines
19300 through 19900 in the subroutine.
In the main program, we must size the M, C, and CPRM arrays in the
COMMON statements as was done in the UNCERT subroutine. In the
performance subroutine, the C and CPRM arrays are again dimensioned in
the COMMON statements. We must write the COMMON block for the M array
(in the performance subroutine) as shown in lines 36200 through 36400,
since the measurement values will be input into different variables.
This special COMMON block could appear in either the main program or the
performance subroutine, but it should not appear in the UNCERT
subroutine. The COMMON block name, DSPAR here, must be consistent
throughout the main program and the two subroutines. This is true for
all COMMON block names.
In the call to the UNCERT subroutine (line 13700), two integer
values must be passed: L and N. After all requirements have been met
and modifications completed, the program can be run to yield uncertainty
results. The program outputs the nominal performance of the test
article, the equation for uncertainty, bias limits, precision indices,
and final uncertainty values for the performance parameters. Other
output statements may be added by the user.
134
% " ' *" " '""""',* • *""*"'"- P% % * %~b % " " '%°'% " 'h " '"" ' % '*" " ', m' "p' '""""%

- .. & ~ .* . - -- -
USA FA-TR- 84- 5
In summary, the application of this subroutine depends on several
activities. First, a computer program must be used to find the
performance of the test article. Then the performance calculations must
be contained in a separate subroutine. Finally, certain assignments
must be made. These are listed below.
1. The various measurements must be assigned to the M array in the main
program.
* 2. Performance calculations must be placed in dummy array DC at the end
of the performance subroutine. Proper statements must be added so
that these values are placed into the C or CPRM array, depending on
a flag value.
3. The M, C, and CPRM arrays must be placed in COMMON statements in the
main program and the two subroutines. The COMMON block for the
measurements contained in the performance subroutine must be input
in a special manner (see previous page).
4. All required inputs must be made. The BMK and SMK arrays must be
input as fractions in the UNCERT subroutine.
5. All array sizing must be accomplished. Some of the sizing must be
accomplished in the COMMON statements.
6. The UNCERT subroutine must be called with the two integer values that
represent the number of performance parameters and the number of
measurements, respectively. ,,
After running the program, the user can program additional output as ,
desired.
4€ 135O"
* ". ..A:, : : . /, .._"., .' , .. ,"vj - ."..-. . ,".. . ."* ,% * , *,",.'" " . '" " ' :."." " ," '
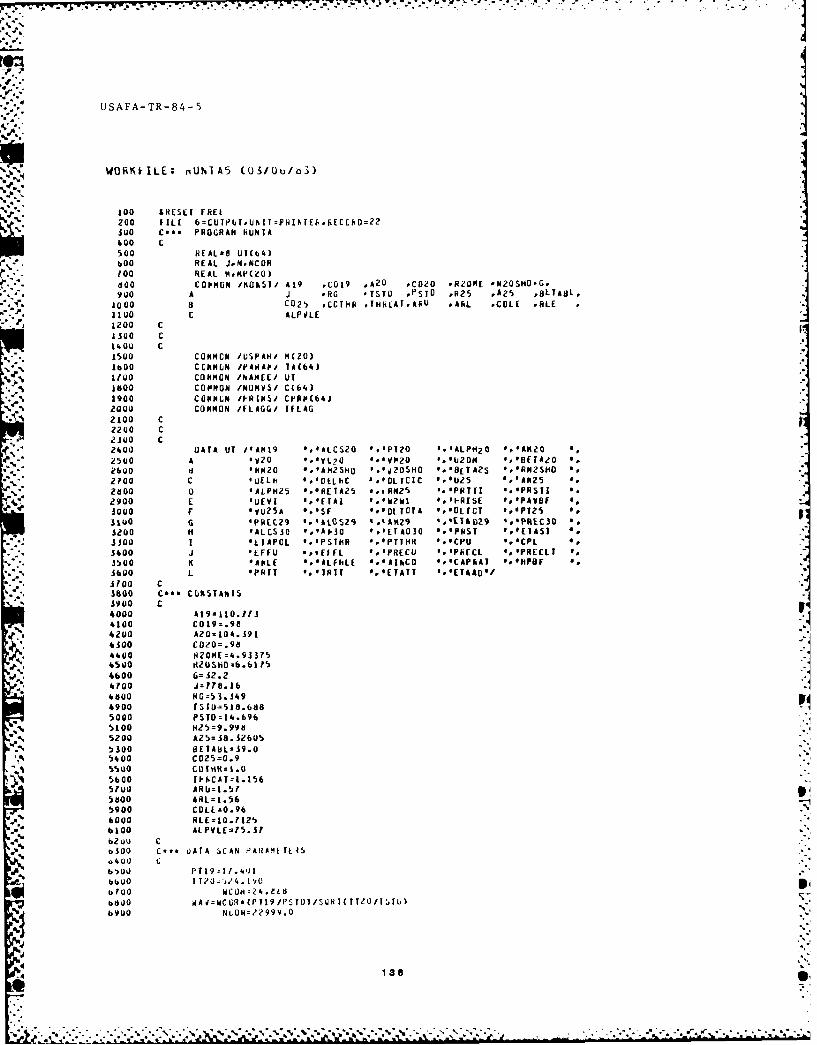
F.:.
4-. USAFA-TR-84-5
%EOfiKIILE: nUNIAS (03/Uu/o )
%~ 100 SHESET FREt.e . 200 fILE 6:CUII'LTUhITzFHIRTEI.RiECChD=22
30JU0 C.6. P ROGRAM HUNTA400 C500 HEALed UI(64)
VbOO REAL J4.N.NCOR700 REAL M.KP(?O ) .
800 COM-MON /KObSTi £19 .C019 .A20 .CD20 .RZOME .N2OSHO.G,900 A J .RC *TSTD ,PSIO .R25 A25 BOLT~aL,109 8O C025 .CCVHS THS4CAF.ANU *AfiL .COLE .RLE1100 C ALPVLE1Z00 C£300 C140U C1500 COMMON /USPAH/ M(20)1600 CMLN /PAHA~i TAC64)
% 1700 COM4MON /h£HEE/ UT51800 COMMON /NLJMYS/ C(64)
1900 COPMN /MRIMSi CfPCP64JS2000 COMMON /ILAGGi ILAC
2100 Cp2200 C2300 C2400 DATA UT i'AM19 *.*AICSZO *.'P120 *.IALP1HZO *,'AN2O %.
-. 2500 A '420 '.'VL7.O 0.'aV P2 0 ,U2OM (IOEJIA4O 0*2600 t8 INM20 %,A2SHO '.'j2O5H0 @*8(TAZS *.'RM2SIIO
2700 C 'uELH *.'OtihC *.*OLTCTC '.*U25 o'AM25 %a.2800 D *ALPH25 '.0REIA25 *..RNZS '.'PNTII '.'PRSII e.
2900 E LJEVI %41EA1 'hW .'WI .Ihflsc *.'PAVIIF S.3000 F IVL25A 0.SF '.@DLTCTA '.'OIICT '.'PI25 *.psjuG G 'PH0C29 a'.'t .itoS2$9 .414%2% '.'E1&n2s 1'6Rputci '.
1200 H 'ALLSAO I .'*MP30 *.I01A030 '.'PMST ','EIASI a.3300 'LAO . 'PSH #.'PTIH I PC..OP
$ 400 1 'EFFU ','[Ft *.'PRECU '.'PME[CU '.'PRECLI '.a .3500 K 'AMLE '.'ALFhLE 8.'AIACD '.ICAPSAJ *.0HPBF 84
a..- 360 'PR!? '.'IRIT %.'ETATT '.'[TAAD'/
a-**3900 C
4100 C0l9=.fl >4200 A20=104.391
4300 CDZO=.98
'a 4400 I4ZONE 4.93375
4600 G=52.2-4100 4:178.16
4800 RCz53.349 '4900 rsfIJ=518.6885000 PSTO:14.696
N10 Z5:9.998 -
5300 SEIA8L:39.05400 C025:0.9
5500 COINK- 1.05600 TPHOAT:1.156
-N. 600 ROLE=0.?12
40 *610 A1PVUEI15.iI
b0 C ... UATA s.CAN PARAMt TL S
bbUO IT?0.',/4.19Uboo hcumz24.ek868*30 wA4±WCtUl.CP119/PSO)/SQR ICT/0'/T ,du)6400 NLOH:22999.O
4 136

UJSAFA-TR-84-5j
11100r~=~2.'
F300 F!)25.=70.590140~0 Psz9z1.d6.1500 PS30= I 2.'jo07bC0 PT29=139.829
/too PT00=139.800J1800 Psrilwu~119.546
1900 IPSTHhLz3CF.6458000 PSLXU=128.9118100 PSLXLIL29.6998200 PSLE=80.75163GJ B301Ff=O.bl
6400 ALPHIG=.O14500 SH20.0109256600 Z25=1.
8800 M(0)=P0196900 M(e)=TTZ09000 M(3)=WAV9100 PC4)= h92 00 M(5)=TTSO9300 H(6)=PS,2SHO91.00 xC1)=PS259500 M(O)=PS?9 mi
9600 M(9)=PSS09100 I(10)=IPT299800 M(11)=?131)9,O 1(12)=PSIHRU10000 M(13)=PS0HL
p. 10100 M(14)zPSEXkU10200 MC15)=PSEXL30300 Pi(16)=IPSLE101.00 M ( If ) L0F f10500 04(18)=ALPI1G
-. 10600 M(19)=53110100 MC20)zz2510803 C10900 IFLAU=C
p 1oo0 CALL TAPLR1
11300 WRITL~b.96)11.00 98 FUNMAT(1X.'N1)MINAL VAlUES Of CALCULATED PARAMEFERSI-il)11500 WN1TE~b.100)(L1CIJ.I 3.310)
*11600 100 fOKMAT(1X.2X.1QCA6,7X)I)11100 WRITL(b.10Z)(TA(JI).J1 3,10)01800 102 FORMAT(lX.10(E11.1..?X)I/)11900 WR1T1.b.100)(UT(12).12=1 3.20)32000 WfITL(b*102)(TACJ2).J2=3 3.20)12100 WRITL(b.100 OCUTOZI). 13.21.30)12200 WRITE(6. 102 )(TAC 33).JJ=2 3,30)12300 WIITE(6. 00)CUIC1.),11.=31..0)0241)0 WH ITE~b.I102)CTAC j4)o* 4=31,410)12500 WRlTE6, 300)CUTCL5).I9=4j,50)02600 WIIIILtb.112)( IACj5),J5=41-50)I3ZI1U0 8d41L(b.j00)(UI16).IE=51,bO)32e800 WRI1TLCEt. 10)C A(J6).JES 3.00)1e9 0 0 R IL(b ,01.)(UT( 11) 17=61.b4)31)U00 104 FORPIAT(1X,lX.4(A6,fX)/)33100 hIILb16(AJ)J636.13200 106 f ORMATIIA.1.El1.4oZX)//)35300 C335400 bO FC6MAT(II)33500 63 iOHMATCI k.ZX. tOCAb. X).j)11600 c03700 CALL UPCLNIC64.20)
11900 STOP14000 EKGC
* 137
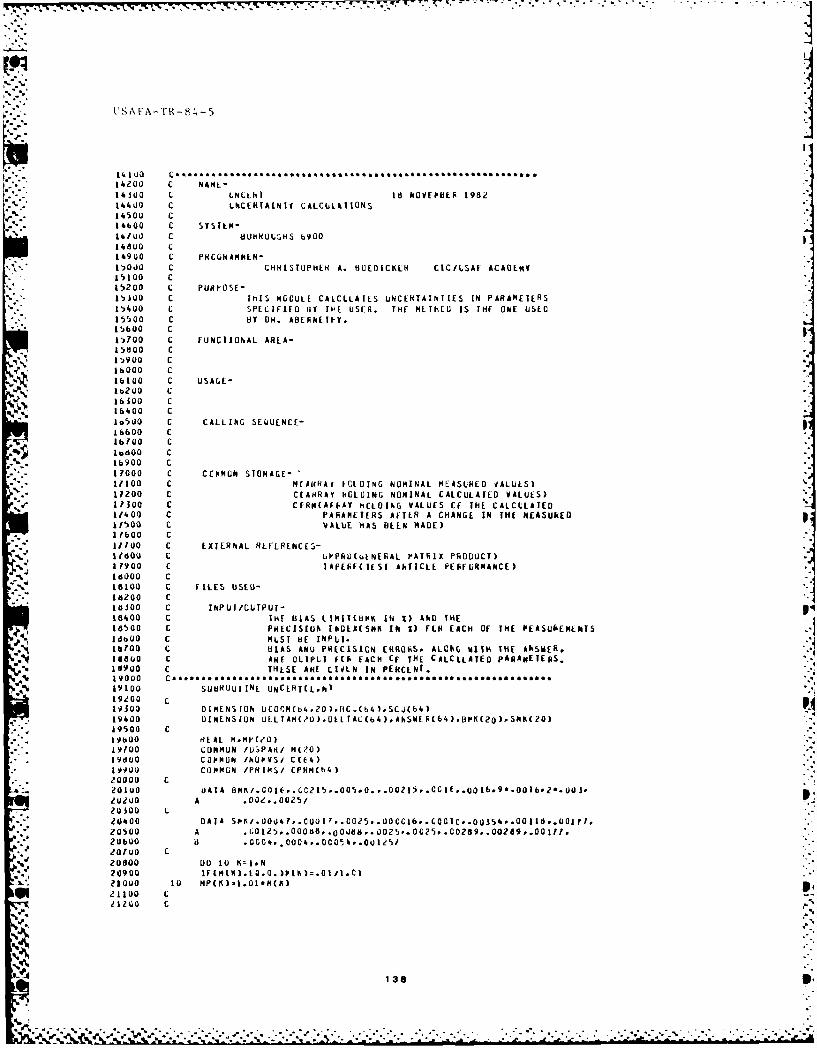
14200 C NAML-14300 c LNLEII) is kVEPOEFi 1982114400 C UkCELiTALNII CALCLLAI1ONS14s00 C14600 C SYSTEIM-14lOO C aUHNuuC.Hs b900
14900 C PH[UHAMMEH-X 5000 C CHRISTOPHER A. ICEDICKLR CIC/LSAF ACADEmf
15100 C15,200 L PUR1I-OSE-15300 C THIS MGCUL[ CALCLLAIES UNCERTAINTIES IN PARAMETERS10400 C SPECIFIED BY THE USER. THE MEIIICO IS THE ONE USED15500 C BY DH. ABEFNEIt-Y.
*15600 C1)J700 L FUNCTIONAL AREA-15800 C159001 C
.2 1600 C16100 C USAGE-
16100 C16400 C
000 C CALLING SEQUENCE-
16600 C
*16900 C
11000 C CEPIMON STORAGE-If1110 C M(AU(RAY C1DING NOMINAL MEASURED VALUESS)11200 C C( A RAY V OLD ING NOMINAL CALCULATED VALUES11?300 C CFRM(AfFAY hELD JAG VALUES CF THE CALCLLATED1/400 C PARAMETERS AFTER A CHANGE IN THE MEASURdEDW100 C VALUE HAS BEEN MADE)17600 C1/100 C EXTERNAL RLFLPENC[5S11800 C LPPU(L.ENlEAL PAIRIX PRODUCT)11900 C IAPEFECIESI AhTICLE FESFU;RMANCE)
16100 C FILES USED-Ia 200 C16300 C INPUI/OUTPUT-18400 C THE BIAS LIMIICUMI IN %) AND THE16500 C PMEC1SIUh It.DEACSHK IN Z) FLO EACH OFE THE PEASURlEMENTS15600 C MLST HE INPUI.16100 C BIAS AND PRECISIGtA ERROR~S, ALONG WI1TH THE ANSWER.16800 C ARE CLIPUI FIR EACH CF THE CALCLEATED PARAMETERS.16900 C THESE ARE CIVEN IN PERCENT.19000 C .......... *a.#& . *.*.**.*.**. .
19100 SUBRUUIINL UNCERT(L.N)
C13u DIMENS ION UCOrM(b4.2O ).HlC..b4 ).SCJ(64) I19400 DIMENSION ULLTAM(20U)JL TAC(bA),ANSWER(64).BMR(20),5M11C20)
*19500 C19600 REAL M.MV(Z0)
* . 1910 CONMUN /IJSPAti/ WO?)19600U COPMON /NOIVSi C(64.)
* 19900COMMON /PMIMSi CPHM~b'.)* Z 0000 C* 20100 UATA BMR,.GOIE..CC215..005.0. ,.00215,.OCIE..o016.90.0016.2.ouj
zUl00 A .0oz..0025/
10400 DATA SPK/.000'.?,.C001 F..C025,..0CC16..E001c..oo354..00I18..00ar1.
Z0500 A .G0125 ..000688.o00da..002S.,.0025..00289..00289..00l11,
20700 B
z0800 DO ID KRI;N20900 If At ).IQ0 MR)~0 1021000 10 MP(I )-1.01*M(t)21100 L112G0 C
'"a 138
USAFA-TFR-84-5
V%213W] 03 2U KI1.N
%21500 .I)Ih(421100 C ALIPI
21t.U0 C
21900 N ( K = 0 m22000 C 422100 IF(M(.LQ.0.)kIIIL(b.15)2,e2U0 15 FONMAT(1X.-PRCCRAN STCPPEC SINCE A MLASLRED PARAMET[ER IS ZLROI)
2Z100 IF(M(I ).EQ.0.)STOP 1111
4. 22400 C3~- '22600 IFEC(J).EQ.0.)WRITE(6,16)
22110 16 FChMATtIX,9PHEGRAP STIFFED SIhCE A CALCULATED PAhiAMEI1I. IS ZEREG)221800 IF(C(J).EQ.0.)STCP 1112
22900 11 CONTINUELI.21000 C23100 OELTAM(K)=(MP(N)-M(K))/M(K)
* * 2200 D0 18 J=1.L-. 23300 OEL TAC(J)=LCPIJ)-C(j))/CCJ)
* 23403 OCODMCJ.R)=OELIAC(4.)/!ELIAN(K)* ,23500 18 COhTINUEd ~,236u0 C
2S3100 20 CONTINUE2500 c239G0 DO TO Jzl.L24.000 00 10 34-1.424.100 OCLOMCJ,j4)=(OCCDM(J,KOJ..224.200 r0 CChT1NLE24s00 C24400 0)0 15 34=1.N24.500 8P34(KI)=t3K(K4)s*224600 5N4(34)=SPI34Lf)**224100 15 CONTINUE24.800 c24900 CALL GMPROOCOOI,8N14BC4LN.1)
- 25000 CALL GIPRODCOMSNKSCJ.L.N.1)25100 C25200 00 /1 J=1.L25300 8jCJ(j)zSQRrEHCJCJ)),25400 SCJ( J 4"iIRI( .CJ( j)23500 ANSWk.H(J)=bCJ(Jj*2.O.SCJ( i)
215b00 41 CIlILEZ51o0 C23800 LIU !b J=1.L259 U0 AN WLN( j)=AhNSWLiCJ)*ICC.
18 CONTINLE
2b2uG i.FITL(6,b0)L2b300 WHITL(t,.bl)
265Q0 h4.IIL(b~bO)ZbDU0 WRITL(tb.b5)26700 DO 85) J=3.L26810o NNITL~b.66)JIJCJ J). SCJ( .1)*NSNE6(j)Zb900 85 coNTINLE11000 C21300 C
421,100 bO fUNMATI(11)
W-d27300 61 FORMATC1X,10(E11.4,2X))21400 65 FCFMAT(IX.,X.'FA6APEfIF .I.84 LIptr*.IIX.PRECICh IAOEX1.
2f1300 A 6X.-LCLNIAITfV/)11600 6b 4ORMAI(IX.30XI?.9X,t i .4.3?X.C 3 .4.IOXE9.?)21?T00 bi FCAMAI(IX.IoXveTHI 16LATICS. USED IC OfIF[,MIKE iHi t U.C114181N111521400 A' IS--./ II X1,"U z * * S./11, - I l IT AS ThE BIAS"
MOO0 8' LIMIT, 14.0 S IS DII 14.1 AS THEi PMIC3SIL.10XkI1A2d000 CTIHE VALLE. CF 195(2) CUMES FROM THE TWO-rAILEO STUDENTS 1'28100 D" VISTRIBUI3Uh")20200 C28300 RtETURN28400 ENO0
139 I

USAFA-TR-84-5
20600 C28100 SU8HOUJIhE fPRD(A.O..,ML)2,800 OIPENSIUN ()d(JII
29000 IK=-K291i00 DO 10 A-I.E29200lzlf29300 DC 10 jz1li
29500 JilzJN296U0 1 3 I-Z9100 RCIR)=0
* -29800 DC TO 1=1.P299u0 jT=JI*N30000 IBz1E*1 -
30200 HETUI4N30300 INO30400 C . . . . . . . . . . . . . . . . . . . . .
30503 C3060t) C NAME30700 C TAPEOF 5 2 93 230800 C (jANkETI LE&AIFUGAL C(NFESSCR PLRtCkPiAhCE£0900 C11000 C SYSfIN31100 C 1314 370/155 (PAIh COPFL116)312u0 C31300 C PROGRAMNRS-31400 C lqAhI S. OlIN AFbAL/POI) FU6CUE UNIVffiS17Y CU-OP STLOhlI3 315!0 0 C CHRISTOPHNEI A. BOEOICKER USAF ACADENV#CSZO031600 C31FOO C PURIPOSE -
11800 C (HIS .4CDLLE DOES COMPSESSCI PENFORMANCE CALCULATIONS11900 C. SPLCIFIED by CURiIll32000j C32100 C FUNCTIUNAL AHtEA-12200 C MAIi CUMPUILE CCPiit S511 P~fiFINMANCE
32400 C USAUE32500 C CALLLD dl IFFII.F FLO EACH CAiJk ACCUISIICk PLINT THAT IS IC32600 C BE PROCESSED.32700o C32800 C CALLIhL SEkUEhCE-32900 C (MI LU - MEASLb[O PAHAMETENS ENGINEERING UNITS33000 C (R) PC - PERFORMANCE CONSTANTS33100 C (6) MOVE - DATA ACQUISII(N ?C0Eftl=iCN.2zSTATTC.3zTiiAN.4=AH05sI)33200 C (R) BARON4 - HRIDETRIC PRESSURE33100 C (M) ARE - HUFFER CONTAINING CONPRESSOR CONFIGURATION CODE31400 C
'I33500 C COMMON SlORAGL33600 C NONE
33600 C EXILMNAL RLFERENCES33900 C ACLS . AlAN , COS . CP18L ITRATZ ,A[CG * SIN . SORT F AN * UVAR
£4100 C FILES USED-34200 C UAIA BASt NECOhO NUMBER 20 -EN41NEERING UNITS, MS4300 C UAIA BASE. RECCIID AUPHEN 25 FERFONIIAhCE CChSTANIS. R34400 C14500 C INPUI/OU[PUT -3
14bOB C NCNE34700 C
a~~a ~ 14000 C . . . . . . .
34900 SU&IRUUIIhE IAFINFSuDo C DIMENSION ALPHCI8).C(641.CPRM(64)
3!5100 C LINE AbOvE REPLACED WITH LINE "[LOW t0 (JELL TI C (D1M AT 3310). AND35200 C CPO$P (DIM AT 3380).15300 DIMENSIUN ALPHICI).0Cb4) 735400 REAL J.N,0U25.NCOR,NC2O)
S35500 COMMON /K ONSII At 9 *C019 AZO *C02C A?2OME *N20SHD.U.35bUO A J .RG .1510 .PSIC *N25 *AZI of IABL,
3108 C1325 -CD1HI. -THlCAIAAU o ANL COLE ALE3558Ua C ALPiLL
140 3
: . . . . . . . . . .% va
USAFA-TR-84-5
313900 C36000 C36100 C160 bz COMMON /USPAI1/ P119 .1T20 IWAV 'N ,TIIO .PSZSH~D,PS2516100 A PS29 . FS 30 -P129 ,P 1 30 .pSTHRU.PST~HL.PSEXU
3ba PSEX. .PSLE RUITH ,ALPHIG.Si,2253b~iOo CS6600 C0OMON /FAFIAMi AM19 .ALLSZO,PI20 .ALPI-2!0.AM2C .4.1036100 A VL20 VMZO ,UZOM 8bEJAZOoFPO ,AMZSIID16800 6 VZCSI1O.8EA2S-6P'2SH0.OfL- COELHC *CLITCC36900 C U2) *AM?5 .ALPH25-.dIAZ5),RM25 *PRTTIWOOD00 0 PAST! DOEVI dtIAl ~.1 .HAISE *PAVBF
-31100 E VU?5A .SF UOLTLIA.DLF[T P125 *PALC29.-. 31200 F ALUS29.AM29 , E tA0?9.PREC 30 ,AL 0530OA M 30
11300 u. ETAU30,FIS *ETAST *ETAFEL.PSYHA .Plllb31400 HI CPU .CPL ~EFFU , EF fL .PAECU *PRECL.37500 1 PRECLT,AHLE .ALPHLL.AINCL) .CAPAI.HPBF,31600 J PhI TPIT .ETATr *ETAAD
J.31100 C31800 COMMON /FLAG~i/ IFLAG37900 COMMLN /hO0VSi C(E4)38000 COMMON /PRINS/ CPRMC6A)18100 C
38300 A3O.0,.U205,4C.C..026,60.C. .039/18400 500 FChNAT(5X.EI2.!)
18600 Plz3.14159
38800 .1C=O.O18900 C ..- CALCULATE HSfU 8kSEO ON FSTO39000 CALL CP~bLT~lSIO,IsSTD.TPSICoFA.IC.SHII. .C.GAMMA.CP~h&.CX)3100 C**' CALCULATE C.AM2.I4T20.ANC 1PZ0 AT 112039200 CALL CPTULCTT20oHIZ02,FP20.FA,HC,SH.I.RG,6A?2,CfP.NNoCX)19300 C39400 C5 . 9500 C ... ITERATE FCR AM1939600 G1I=.(GAM2#l.C)/(GAP2-I.0)39100 GZ=.56(GANZ-1.0)19800 11OiMldJ.01 9900 801M2'0.040000 AN19=.5,4c100 APN4=1.04U0O WOTM-WAJ.SQRT 01T20)/(P119.C0190A19)p40300 5 CONTINUEIt0 40u0 C405UO DUMI=GAM26GC/RG 1E600 DM
40?00 IF(DL01.L.1.0.0) STEP 1001-40800 C
40900 WO1M3=SQRT(GAM2.UC/RU).AM19.(( l.O.G2.(A1419.2))..(-GT ))41000 IFCA8SCdTH3-hUTm).L1..00OI) OE 741100 CALL ITRATlIhOIm 1.AMN1.hOih2,AMN2.h0TM3.AIqI9.80TN.ANh4)p41ZU0 GOTO 54 13so0 1 CONT INIE
* 4340 C. A TAFIE LOOKTUP FOR ALUS204 1500 ALLS20 zUVAMC ALfI.ALPIIIG)41600 C41100 c41800 C**o CALCULATE PSP11941900 PSPT19dIl.0,G2.CAM19..2 i)..(-(GAM2/(GAN2-1.0)))41,000 OPTIGV=P119*ALLS20&( 1.0-PSPYI9)4.e1I00 PTZ0zPl19-OPTIGV42200 DIU V=O042300 ALF WO ALPIIIG.P1/180.42400 C.*. ITERATE F OR AM 04250O0 WDIMI=0.042600 h0I142'C.C41100 AMZOz.541600 A'N4=1.0
S 42900 W0IMzhAVaSQR1C 1120)/Cl 12C.C020.A/0.COSC ALPH2C))
14 1
V 4

L'S AFA-TrR-84 - 5
4 sou0 I CONTINuUE41100 C43200 C4 j Su0 W C I HI %C bICA MZ .CR G)A?0.kCI UG2 .A m20)G1)I434.00 IF(AISWLTA3-WDTl-).Ll..CCC1J) GLILIf14 I0 J CALL li NAT2(WC1M1.AMNI~h01M2,AMN2.WOrM3.AM2O.WUTM.AN4)
43ruo if COATIhftI
*4sdU0 C
4.UUO D6M=1.0#k;2.(AI4ZC.2)*44000 1U1)UM2.1..0.0) WITE(b.50U) OUH2
44200 IF(VUf4?.LT.0.0) STOP 1002* 44100 C
44.10J 42 A120 AD2u/SQIT(1.0402. (AMZO..21)
4460.) DL4i3tuAM2.UC-lRC 1120
4400) [E(4.JIM.LI.O.O) STOP 100344900 L
4'eJ0 VUZI=VZ0(SIN(ALP42O) )45 300 VP2O0-V20.(LLS( ALPHZ0))A.4 0o UlMz?.0PIN-12OM/(bU. .12.)4 l00u HE1Al0=ATAN((U2OM-VU2O )/vM2O)413 b (10
HP20zAM2C-(CLS(ALPH20)iC[S(0(- TA 2 o4 510 U C45800 DUM4= (((PT2OIPS2SHC )..(G?.2./UAM2))1I.)/3245900 I(CLUM4.L1..0. AI4E(6,50U) UUMq446000 IF(DUK4.LT.0.0) SICP 10044o 100 L4tu2U0 C
f46400 AM42SHOzI(C(t(PT2/SSiO)*.(G2.2.GA,2 )-1.0)/G234b!)OO C46600 DUMb~z1.0*02.(AI42SHD..2)46F(;0 IF(LUI-5.LI..0.6) NgAiT(b. iOC) DU1454bo00 li(OUN5.LI.0.0) STOP 10094*900 L4,0O00 VA12SO'AP.2SHOI5~hT(l.C.G2*( AM2SEO**2)41100 i20SilO=4A!25.DAT2041200 VUZSfl0=V2OSHO.SIN( ALPH2O)41100 V0ShiflVeOSIPO.COS(ALPI2C)414UU UlSH~dUNloi20SHC/k?0M1
4...411500 UtTA2'S-=A1AN(( U2SHD-VU?SHO )iVMN'bI-I)* 41600 hM2SHO=AP2Sh0.CCS(ALP-20 )/CCS(HE 1*25)
41100 W20SHi0RN2SH0'SQT(GApq2.-GCRGTTO/(.0,G2.(ANZSHO..2)))- -4ldG0 C*** CALCULATE H12C Ar 1120J*4 419io CALL OPTULT 1T20.tiT,O.MP20.FA. HC.SH.1,RL.GMZ.CP2.N4.CX)*48000 C--- CALCULATE Hr30 AT 1130
48100 CALL CPTbLC 11 30.HT30.fiF3CFA.HC.S5H,1.RG.GA03.CP1.h'CX)p48200 C
4~4448300 C4* 440 DELH=HT3C-IiT2C
4840u DELHC=DELH.TSTC/IT/V 48600 ifT30C'FiSTD*DLLIIC
48p00 C-&& CALCUL.ATI 113CC AT H130C48dua CALL CPTtJLCTT3UC.HIdTOC.R3OC.fA.HC.SH.2,kG.GMiCCP3C-bh.CX)48900 0TTC=1TS0C-TSTU49000 0110IC=DTJC/1STD
- ~ 4,'ilO L--6 CALCULATE CP AT (TTSOC.TT20)/Z.049z00 T3CSUl=(IT~JCT2O)/l.O
4 49300 CALL CPtTL( T3CSO2.E.HP,,FA.IC.SH.1,RG.GAl4CS5CPIAV~.hCX)b49400 U25=U2O;M*R25/RZONE449500 L ... IT~bATI FLR T525
49600 TfiC 1=0 0-490100 TT3LM2 Q00
.4 ~~49803T25T3* 4'i900 TSN441TT3-10.
142
- L'SAFA-TR-84-5
* 54J100VU?5z(CPIAVDI0 1iC-CJ.L2CO.VU2C)/UZ,5UZ00 PC A zP SZ5 jCOZ)A? 5
5 50300 9:0
* 05) C
50600 z5 CONIINUE5014)0 CALL C~8(55tH. ~CS..Gp2.I...X50600 C5 ~0 5?O F( uAM 2S.LQ . 0.O S Ti~P 55
512 G3 P C0
'314 00 dHI C-(GM2)-I.() ) -oil I5 15t)0 auIblo 1) L44bz i4G/CLAM?5.-G C),j I 00 1f(lUM6u.LI.C.U) Whi[If(b,4,U0) UUM,51800 1 C L U 0f.. L I.c C T(E1SI ~C 0
I ) U J Ce 0)4) C C d-ojI-( 2'j WA V uCH1kThJ )/PCA).SCH(A,(A4M?5uCf).,2
532100 c
52300 IHC[UM!.A.C.U) WFIIE(b,500) UUM?524.00 MFCUP?T...) STLF 100?51elb4) QLMdz(-dHeSCkTcCLM, ))/(?..AA)52600 IF(CUNd.LI.X.0) hbIfE(6.90o) OU01052104) If(OdKS.LI.U.4)) 5 lOP I04)6
5 SOU0 TT3CM3.-TSl'.C1(.O*G3.( A P25 --2)5314)0 C
14 JO IF(4). I. 4J))Gf 10 2?1100 99S FUMTIX 1CMzI5.1.1X.ITT30C= -.l1I.
9.'5X.@LOGP EX1110
* * 5600 C31 5uO lf(AdS(I3CHA-1130C).LT..cUU) GOTO 2?
151800 L)53900 III1.GL.4O. )T l3CMA I 3C0 3+.25
5410U0 CALL liIRAI2( lIlCMI.TSIHIT3CM?.rSN2.TI3CNI.TS25, rT3oC.TSN4,)
54 Jul) codluj 295.44ua it CLNI I~uL
54100
VIOU4 IIUUPn.LI.u'.1) S4IElF 09 ULM
5 u 0 1~) LM11)-I 11
5 P OO 1i(LUI-lL.LT.0.0O NF[IT bSOO 1010
'Ij d jUI L) 594,0 AL PH2u7A IAh( 50H!(11)(LIA25? .P'-").C C?5A2 2S of *A V IS C66 I56 000 C
blUO4) I I ( U MII 5. LI. 0 .0) f, If ( t.'UJI DUMi II"to 5U I I (LUM I I) LF.C.0) liILP I u II
* b4 J C
b I o l(.)UMI2.LT.O.4)) SlUP 10 1.
569U0~~~W2 z 9AM)-5#411 A'9.CC.0I IC)f,61I'JC.(125.)51/)00 4M.?.25C0C AL P H",) I
513014 P lc', -PS W.( I 1u*u 6. AMZ9.. - . r AM,",(C AMi,-I .u))1
143 .
%A
','S;\ F R- 84 -
W 1500 pq.T .l CP I V
* 519., HIlw-iT205000U H IL X-H 13 j,11100 L--- CALCULAIL HISI.N(HP1SEN) WIfl RISEN=HPC*PhrII511200 RP1SLhztP20FRTITj5a su0 L
511500 1F(LU023H.LL.U.G) D1T~.0)UU~i.51b600 1f(DUMI 3R.LL.U.0) STOP 1021
5 08 u 0 CALL CPTZL(11SUh.,llSE1,.FENFA.HC.St.3.l L(AMIjSE.CPISE.kA.CX)5 C1900 LTAT'(IISfN-HT)/(HX-HIN )
59100 rA ISL zMLX- I h59200 P A 4B =P Se 5*1 . -(U2 .2)i1Tfi. -GC -R L-T T i U59100 MU2Sz(2.257E-8).CIT 30**( 1.5))I(TT30C+198.6)
5J94U0 HHC='AVBF .144./(Z25*FjG.T 00)
%?59,100 C59600 Cs'iY'oo R E N R-V,-U2.H 2'j/ C 1 .M L 2 5 GC)591100 CM8F=0.03194/(REN..0.2)
59900 C60000 C60100 CMzIiH0.(U25..2).CLsL.-(H2b..SJI( 1728..2..GC)60200 HF8F=CMi'N'2.'- /33000.60 10 0I1fEL='550..HP8i/(J'WAV604UO HlAtRU1I=Hfi SE-fDOL60500 HAL FU2 =HLX-ODLlLbb tU0 JU2f5A-(GC.J.HAERCI +U2OI4*VU2O) /025
bUdu0 C
60900 SfzVU25A/(u?5)-V~e5.TANeT.LTA1L.P1/180. ))b 100 * C ALCULA IL T:EAL t(sAfNIC2)
61100 CALL C T1L TAEH0.IiAENC-HPAER.FA.H.h2~.AAI.P~4h.61o0 0LI(JtA=( TAERO-IT20)/TT206 11%0 ULICf (TISO-T7M0/TT20
61400 C-.- CALCULATE GAMCC(TT0+TT2C)/".)61500 T312AV=(TT3011T2C)/?.C61600 CALL CPTSILtT3T2A,.12AV.hP2AO,FA.HC.SH.1.FG. GANC.CP32A4.hh.CX)61100 PT25=PFt9*((UL[r-ETA1..).(GAMC(.ANC-1.0)))6 1100 PREC29z(I'S29-FS25)/(FIZ5-PS25)
-' 6l 900 ALJS29=(P1'25-P1Z9)/(PCPT'?si)
62000 C'*. CALCULAWL 6APH3((Tl30.TS25)/2.0)
62200 CALL CFVTflL( TJ725A.H325AVH15,AICS.IIGOH.IIAh.A62300 C621,05 DUM13=(Z./(UAID-I.)((S9P2).-(AOl)LM)1
6 1500 it (OUP13.LT.0.0) NIiTL (6 500) DUP13buo0 IF(DUM I .LT.0.01 STOP 10;3
62100u C
629100 C
65000 AM2,9=SQi5T((?./(GAMO-1.0)).(((PS?9/PT29).(-(GAqD-1. )/CAMO))-T. ))
6eb31s0 0 PHLC 3=(PSIC-PS25)/(PT25-FS25)* 63400 ALUS30=(P0215-PT10)/(PT2'5-P525 I
63600 C
asuoO TUOLJMT1,.LT.0.0) hRFIE(b, 500) DUM4bidOO [F(LUPI1.LF.0.0) STLP 1014,bl9UJ C
* 61,10 P44IT-PTTC/PT1
9
6455, LC... CALCULATE AISLN1(14PISF1) kLHL HPTSLT=RP?3*P4T1
* 144
" .%---%~-.~*-<--......~
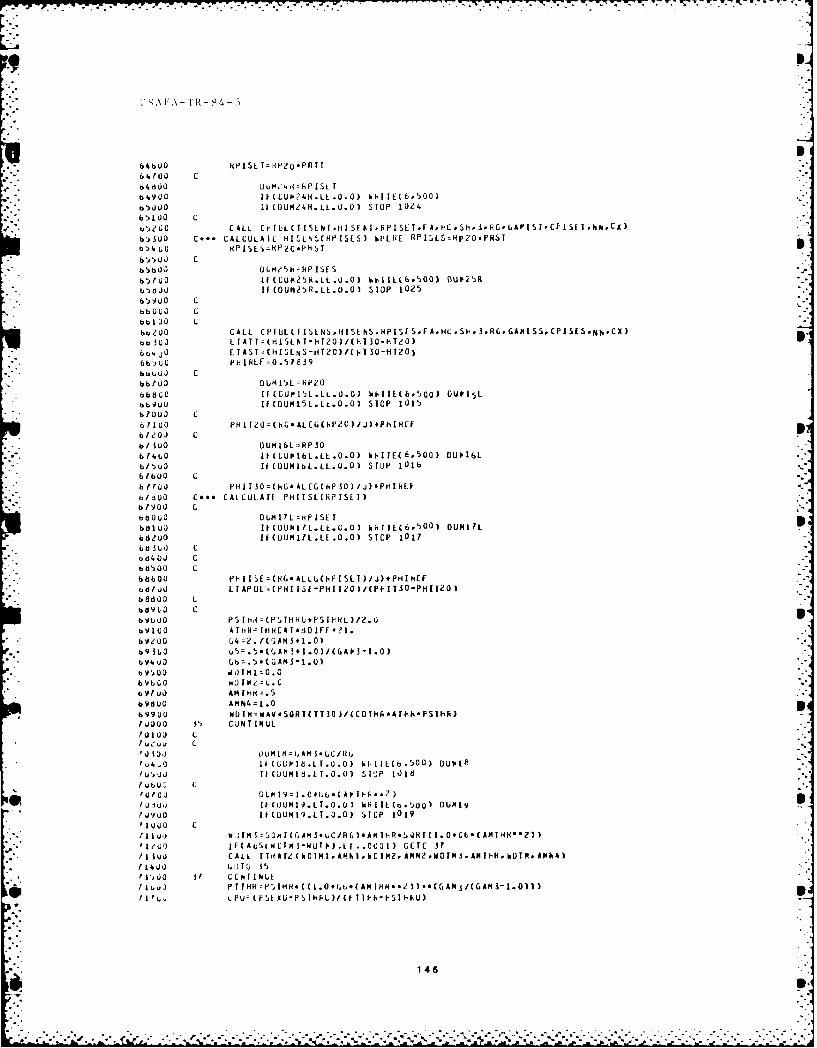
t',A FA -TFR-8 84-
64600 HPISL T=RP2Q.-PTTI6 4f?00 C04600 dUM.4r-hp I St.I
- 6~~4900 It1(LUI24 LL.0.0)hII(650b*Uj * ii
0f(OUM24R.LL.0.O) STOP j024
- *65100 CI. o5210,iC CALLCrLCIIIIIETFPSTF*H.H3RLAIICI[,NC)
6100U C'..' CALCULAIL HU LL(HPISLS) hHLRE RPTSLS=Np2O.PNSI
65400j xPssHPCP
6)60o 0LM25iIzHPISES
61FO If(CUIk2SN.LL.0.GI FTL6SO OUP2S)Rb5ts)0 IF(OUM25R.LL.0C STOP 1025
bIOO L
6o200U CALL Cf-TOLLIISLNS.,HISENS.HPIS[S.FA.HC.SH.3.AG,GANISSCPISESDNN.CX)300 U LrAfT =(HISLIT-H120)/(HTSO-hiT/0)
604UO ETAST =CHILNS-HTO)/(p7T30-HTZO)6650 PH IRLV=0.5?639
bbbUiJ C66/00 UUMI5)L=HPZO66800 II(1UP151.LL.0.0) hhIL(6.S0o) OUPISL
bb,)UuIE(0UI15L.Lt.0.0) STOP 1015
6100 PHlI Q0(hG*ALCG(hPe0)/J)+PhHXfFbido.) C
b/300 OUMI6L=HPAO614L0 1F(CU1bL.LL.0.0) kIIIE(6-500) OUP16L
W~uu If(OUN1bL.LL.0.0) STOP 1016
61ff00 PHITSO'tHG' AL(G(hP 30) j)tHEkb/000 C .. CALCULATL PHITSIARPISLI)61900 C68000 OLNITLntPIS[ I68100 IICLUNI1L.1E.U.0) 6611E(6,500) DUIlLS68200 IF(UUMlL.tt1.O.O) STOP 1017
od4OJ C
* 6860 PHI I$Ez(HG*ALLG(hFISE1)/J)+PHTHEF .
bS/Jo LTAPUL'(PNI IS1-PHIIZO )i(PHIII0-PHTTZO)
68800 Lb69 LO C6901)0 PS lH,=tPSTHRbtPSlf-NL)/2.069o100 ATIHA-' IHXHCA I'-tD0IFi -21 .
* 69200 4z2.f(S A$3f1.O)
694000'.5CAS- 0
b9/1)0 AMIFHrfl.5
69800 AMN4=1.0
69900 MOTMSWAV'SQRT(TI30 )/CCOIHII.AIHI4PSTHH)lfjOUO $5 CONTIIN UE
lwu oo C%'0 TO) OUM I d= ,AMS5.LC /FG
U 4. ')If(CUrIC.LL.0) k1IIit(b.500) 001.1/051)0 TI(JUUNI.LT.0.0) SlOJP 1016
u F 0 GLMI9:j .C*I.6*(APIlF-**)f U I U TECOUNT.LT..0) WRTL(.5,00) 0UN191f4900 II(GUM9.LT.0.0) STOP 1019
I I I o W 9AM TSQOICGAMI.C/G)AMIhR.QRTI.0$6'CAMHN''2))
/1100 CALL IIRAAIY(WOTMI.AMI,hCTM2.AMN2,WOTM.AMT-.hDlN.*M64)114)1 (.010 il5'is1)0 3r CCftIINLL
S/ It.J) PTTHH:-PSTHH.I((I.0*Gb(AMTHN..d))**(GANS/(GAM3-1.0)))SI2 I L PL F fSt XUP5 $)C-1t1 IU
145
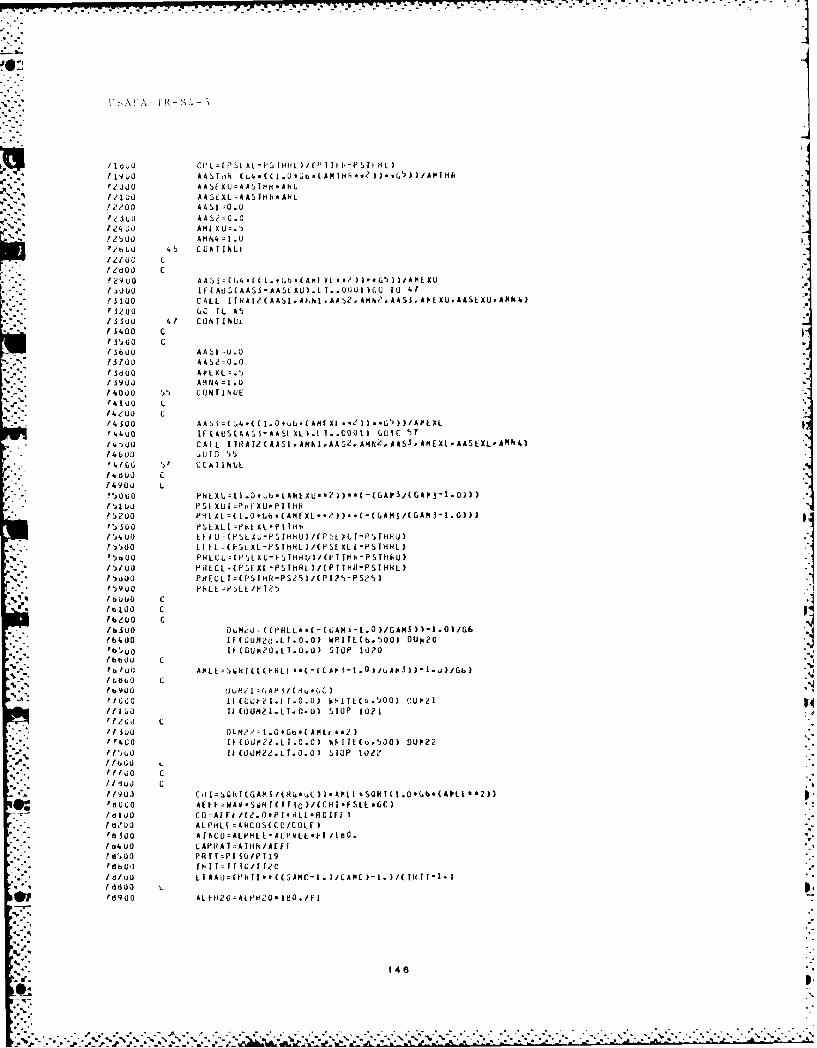
I .. -. -. -. r r-~- . . - .... .-.- ,rr w- 7. e -. C
0 ~ ~ ~ " A F),A-YRSf-
I19qu0 AATiR1N( u4-((i.0,Ub.-(AM1MHHt2 ))n.GS)ATi
PlloO AASIXL4ASJIHNtAHL12200 AASVO.0A5HHAk
!/3OO AASI O.0
f24 U0 AML XU'./1500 AMN4' 1 .0F'2bQ0 4) L~ ICMTILt
1100 C
'2900 A A S3s(~( I.U ALL* 3 b~u ))AMIjOuO If I A B&(AASS-AAStXU).LI..000I)CU 10 41A73100 CALL ITIR A12(A AS,1A EIA .15 2, A MNh2DA A SI AIEXU,AASLXU.AMNA)
/3 300 41 CON ILINUL/3400 C Iisjo CtsboO AA S1=0 .013100 AAS2=0.0fF300o A#LXL'.5/ 3900 A 411=1I. U
- /4000 5 CONTINUE?4100 L14200 Cf4.100 AA S S u4' 1.Oi*6.CAM[EXL..Z)..S)/AEXLF 44b0 IF(AUS(AASS5AASLXL ).tI..CO)I) (MEUIC T14 s00U CALL I fRATZ ( AASI . AMM .AAS
2. 1111421AA53. AMEXL. AASEXL- *
Mh4)
14600 uUTO 5
1460014900 L
/100 U PSLXUIzPr EXU*PITHN* 152o0 PktuL=( I.0.CLb-(AME XL'.?) ).(-0A3/(GAM 3-1.0)))
1540JU0 etI 4PI (P L - F li 3/1's t -' RU
15500 ELFFL=(I-SL-XL-PSIIIHL)/(PSE XLI-PS.TIIL)- 'Sn,5uG PHLCU '(i' E XC-F $T114U )I (If'I 111P S fRU)
/s/oou PAECLz('SE L-PSIHRL) /1P1 I?-PSIIIRL)fldoPAECLIz(PS iRtmPSl 3/( PJ?SPSZS3)
* .' )9uo FALE 'PsLE/PM25IbnoD C
- /4.10 CCb~ [)UMIJ= C(PHLL..C-(U(AMi-1.0 )/GAMA )l-1.O)/G6
?6400 IF(LUUNo.L1..0) WRITE(b.500) 0UM
2 0
IEfCDLUM120.EtI .0.O0) STOP 1020
/.9U0 !)UMc VG-AMIS/(ttu'UC'/Gi0 Lf(CL21.T0.0) k lIL~b.5)00) C;UP2I
I/ I O ItUOUM1..LI1.0.0U) STOP 1021
1Iso 0C12 .O4C6.( AMLt.--I4 c 0II(OUP22.L.O.) W~IE(u.500) OUIP22
% /51, It 000M122.T.J.0 )slop 1022//000u L
I''uC C
Moo0 CHdL- 4tlI( GAMII(Ht, tC ))AtLEL.-SQH I( 1.0 Gb'(&40L L233'nOOG AEFF=WAV'SGNTC T3C)/(CII.SLL..C)/6100 CD0=AEFA/(20.-P I.-AELLE.AO IE
/11/00 ALPtIL[=ACUS(CU/COLF)'5300 AIACU:AIPRLE-AI.PVLE 'fl 110.1o4 00 CAPHAI-ATIIh/AEF F
/6600 C RIIS/Pli
P11900 AED120'AEPR12O.Id./FI
1 46
OnI,
9s4
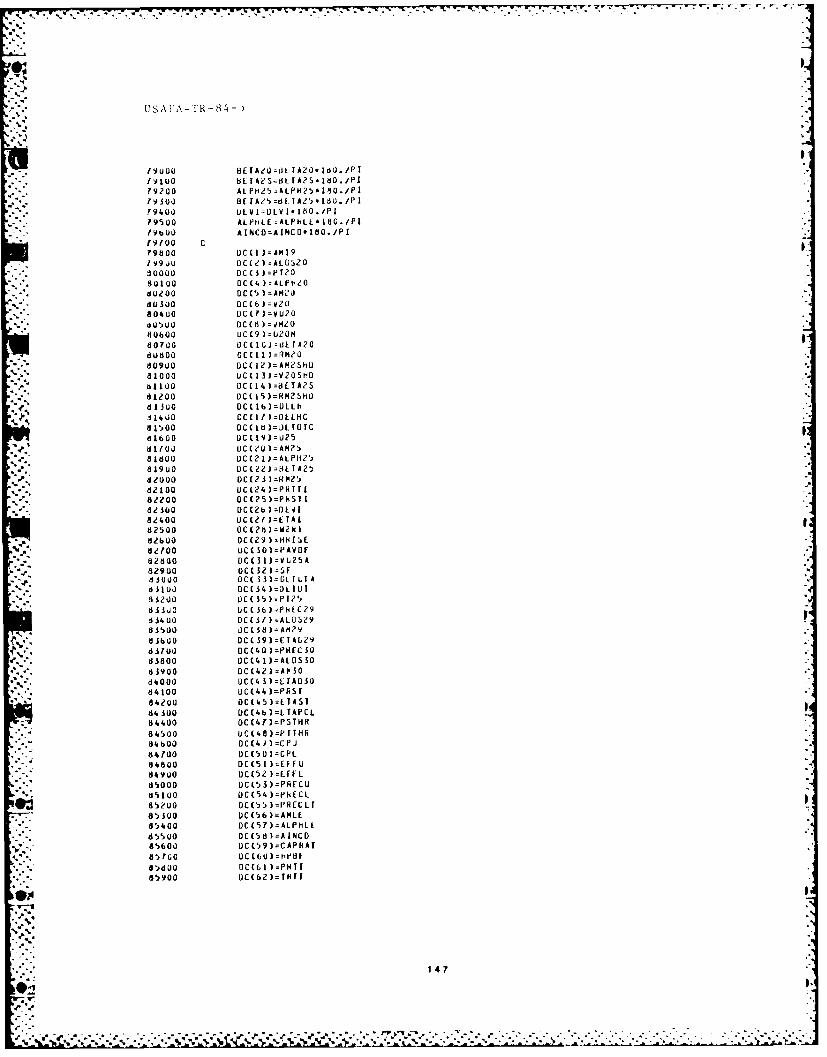
UJS A IA- TR- 84-5
190uu 8fTA,0'0z TAZ0. 18./Pt
r9200 ALPH' !5zALPH2?5018O./Pt19A0) E AZ81fTA?5'1dU./Pl
79500 ALPHIL(zALPI1LL 18G./PL19bUo AINCO=AINCD* 180./Pl19700 c19800 UC(I)=AM19
*199o0 DC(,/)zALGSZO3 0000 C3)F?
*.80100 DC(4 )=ALPt1e0* 800 0CO )=AMZ'0* 8010 DC(b)=VZU
*80400 Dc ( F) VU?06 0500 D()iZ80600 UC(9)=U20m80100 OCCIC)=dLr820dBdoo OC (I1)RI80900 DC(12)zAM2?SHU81000 UC(13)=Y20sI1081100 OC(14)=aETAZS
* 81200 0C(15)=fRM2SHO% 1300 DC(lb)=ULL1
J 1400 OC(11l=OELHC81500 OC(18)=0LGUTC81600 DC(19)=U25
81800 UC(21)-ALP112 )81980 DC(22J)i1LTA2!de20 oc(23)-NM25
-:**82100 UC(24)=PH~t18Z20 DC(25)=PIhSTI
* . 8300 DC(Zb)D4)1I82e400 UC(21)=EIA182500 OC(28VzM2wi82600 OC(29VzHHISE82700 UC(30)=PAVBF82800 OC (31 )=VL25 A82900 0C(32)=Sfd3000 0CC 53)zDLTITAd1100 OC(34V=!01I0T
83300 DC(36 )zPHfC?963400 DC(31)zALflS?983500 0C(38)=AM2983600 OC( 39)=CIAb2983100 DC(40)zPHEC3083800 DC(41)=ALOSSO83900 OC(42)=APHO84000 UC(43)=LTA0A064100 OC(44)=PAS84200 0C('.5)=EIAS184300 OC(4b)=LTAPOL84400 0CC41)=PSTHR84500 UC(4a)zP ITHR8'.boo 0C(4)1=CPU84100 OC(50)=CPL84800 DC(51)=fFFU84900 0C(52)=EfFL813000 DC(53)=PRELU85100 UC(54)=VhIECL8!5L00 DC(55)=PR[CLT85100o UC(5b)=AMLE85400 DC(51)zALPHLL85500 DCC58)=AINCD
N,1.85600 DC (5 9 )=CAP A T
05800 0C(b1)ZpHTi85900 0C(62)=THTr
147
V.%

U SA FA - '1R -84 -5
8600of)0 DC(63)z11AIT -
MOO0 0C(b4)4EIAAO
*db400 1F(IILAG.NL.0)CU 10 dOD
86500 IFLAG=IFLAU*186600 liE ?GO Izt.6486800 RETUNN=D(IS800 C EUR
ai0o0 800 DO 900 l'1.64
81100 900 CPNN(l )'OC(Ii
81400 END
41
414
-b-%
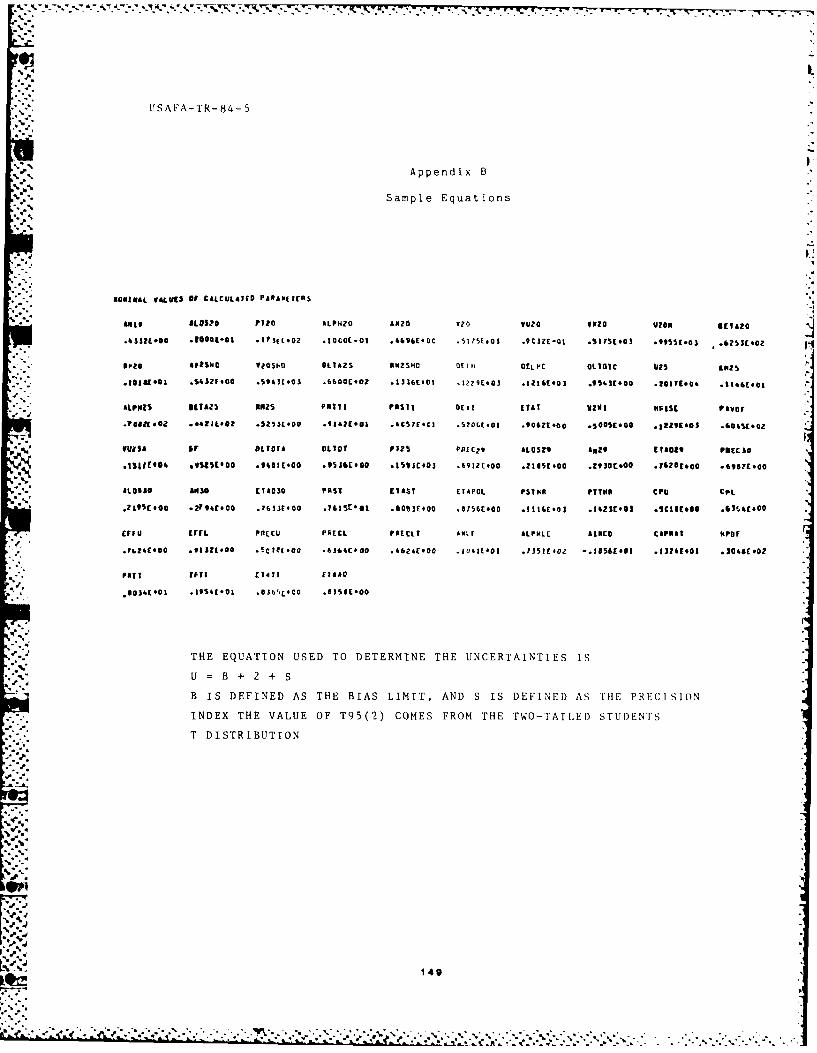
USAFA-TR-84-5
Appendix B
Sample Equations
44.
NONlgAL 941LUES 91 C4LCULWI( PAB*1j 1,-eS 1&mat9 A1.052 P120 ALP1120 0120 VOVUZO vVZO U204 mug j2.. IZE-00 .1S@01-01 1.? se t.02 1 OCOE-01 .&b~bE#0C .5 t?51.03 .9 C321E-01 .5 1 31.03 *9955(.o01 .6251EGOz
pra aftswE v~osln 61.1*21 NN2SHO DE I t, EL IC oLlOic 425
.103hz66a S4)?F#CO s3945E40S .6600E*OZ .1336E-01 .62?9E.03 I.z I 6t #0 .954SC400 fall[* 04 .1 '.1C.0i
ALP"?$s OtI*21 WS* PATTI PAST DEVI ETAI V201 RAISE PAVOr
.7049[ .02 .&.21L*02 .52531009 .98&?[*01 .6csyt.CJ .5206E.01 .906ZE400 .500SE600 .122VC'0S .606SE.02
VUXSA sr OLIVIA* 01.10 PIZ% PillC29 *1.0521 £329 (1*029 PREC 10
*nsiIC0A1 eV1111900 .9481000 .935c'o@ .1591.03 .69121.ooo .2145E#00 .2930tocc .1 121.oco .£98?E*CO
SLOS. All13 £130 E1*030 Past EIAS E*31O (1S0. 149 PTT*3 CPU1 CP.
.z 9 5 1 a . 2? 9 4 #0 a .76330*00 .7615r,01 . a0 3 14 00 .0I11#00 .1111#1. .1623E#43 s1(1e1ofo *S1E&(.oc
£1161 (171. P561. PRECL 76111? AN£ LPMLE *13CO' CA73*? .678
/.?16t1400 .9112L-00 .!Ct1(.00 .6SA*1*0O .46z4(*OO .2"1401 .71S2(SOZ -. 1656E#01 .132410O1 .30461.02
*90i1E01 .19s'.1 .036 L4C0 .835@E-00
THE EQUATION USED TO DETERMINE THE UNCERTAINTIES IS
U = B + 2 + S
B IS DEFINED AS THE BIAS LIMIT, AND S IS DEFINED AS THE PRECISION
INDEX THE VALUE OF T95(2) COMES FROM THE TWO-TAILED STUDENTS
T DISTRIBUTION
414
%%

USAIA,-T'R-S4- 5
PARAMETLR A SIAS5 LIMIT PRECISION INDEX UJNCERTAINTY
I .6867E-02 .3Z65E-02 .13E*01p2 0. 0. 0.
I .1609E-02 .4129E-03 f#04.300E02 .400D0103 .IaE*00
5 *IZ19E-02 .34.41E-02 .1'.C.jl6 .?232E-02 .3303E-02 .14.10011
7 .7829E-02 . 3326E-02 .14.1401
d1 .7i32E-02 .33051-02 .1'.E#0190. .1600E-04 .32E-C2
10 .2706E-02 .1236E-02 .52E*COit .181FE-02 .8521-03 .35E*0012.5795E-02. .922CE-02 .24E*01
&I .5574E-02 a8726E-02 .23E*0111. 179aE-C2 .2a26E102 .74E4COIs .1514E-02 .1934E1-02 .54E*0016 .5030E-02 .27371-03 .56(4CC17 .625ZE(02 .4014E-03 F71(#0018 .610aE(02 .3922E-03 .69140019 0. .1600E-04 .3ZE-0220 .5162E-02 .5064E1-03 .62E.0021 .20S2E102 .7265E-03 .35E.0022 .1257E-01 .19911-02 .17E*012S .9?7GEC2 .1670E-02 .13(40124 .7779E-02 .12781-02 .10E#0125 .2252E-C2 . 226SE02 .1.8E*0026 .lOo7E#00 .1696E-01 .14E#02Za ? .223FE-Ci .?29?E-03 .3?E*CC28 .9160E-02 2~137E:02 .12E*0129 :50301 -02 .2 7371-05 .56E4CC30 .1639E-02 .1180E-02 .4.0E*0031 .50bE-02 .2766E-03 .S6E*CG32 .5391E-02 .8309E-03 .Y1E#0033 .623]E-02 .1.033E-03 .70(#0034 .619S1-02 .. 01LE-03 .I0E*0035 .?636E1-02 .1189E-02 .I0E#0136 .1416E-01 .4544.-02 .2.14013? .15032E-Cl .1052E-01 .?114CI
a?30 .103SE-01 .1132E-01 .1.4E*0139 .911I9ECZ .2382E-02 .1'(4#C1.3 .1415E-01 * 3639E-02 .2210014.1 .50C31-Cl .104.?E-01 .71(401l1.2 .2126E-01 .145CE01 .50E*0143 .9066E-C2 .232b1-02 .14E#02
45 2252E:02 3383(Z49L00
4? .1132E-02 .1769E-02 .1.7E*CC.a,48 .2b96E-02 .24981-02 .5?E*00
4 9 .22eeE-oa .3228E-01 .87(402l50 .15101-01 .1929E-01 .54#0
St .23S3E-01 .314.5E-01 .81(4(1 p52 .1522E-01 .1903E-01 5(L
*.53 .22eeE-C .3225E-0154 :1510E:1.12(01 .5,4.101
5b *bSOOE-02 .1116E-02~.5? latOE-C2 S53GFE-01 jlcaa55 .144bE-01 .212bE-01 .17(4.12
60c .16436-02 .1170-02 . 54 a # go61 .11529-02 .9959f-02 .421#0062 .3026E-02 .1958(403 .34E#00
63 .63eYE-02 .'1.'2(403 .79100061. .64001-02 .7.831-03 I.OE #00
415

-4,"S
-. 4..
DI
2 SECTION IV
Engineering Education
4.,,
-15
,.'A .. .. . . .. . .- . . . . .. . . . ... . . . . . . . _ .

%' %
F-."USAFA-TR-84-5
ONE-DIMENSIONAL UNSTEADY ISENTROPIC GAS FLOW (Part II)
Daniel H. Daley*
Editor's Note
This article is the second it a two-par' tutorial series presentingnew insights into familiar topics. Part I .. the last issue of theDigest) examined the wave equation and its solutions. Part II appliesthe wave equation to unsteady isentropic flow of a perfect gas.
I. Nonlinear. One-Dimensional, Unsteady Flow
The following equations govern nonlinear, one-dimensional, unsteady
flow:
Cont inui t y,
ap ap au
at ax ax
Euler's equation,
au au 1 ap- + U - + - - = 0
at ax O ax
and the Isentropic relations,
-. It
*P 1 Pk
-I-p
-k-1
T1 k-1
T =I
k-i-C = (5)
V.-..'
*Colonel, USAF, Permanent Professor and Head, DFAN
.152

r0.. OT
rl h P. prol00ir', IA velocity in the x direct ion ,
!ens ity. temp.-riturp, the speed o,' s-ound , and k< = ratio of
3 ')e cI h -n~ts. Th urnuhYipt 1 designates some known reference state.
*This set of Five equations relates the five dependent variables (.', u,
°.
S-p, T, and c) to the two independent variables of position and time
"*' (x,t). Since p is a function of only as given by Eqn. (3) we can
write Dp/',x in Eqn. (2) as
ap dp 2 ap
ax d ax ax
where c dp/d ). When we substitute the above expression for 3p/3x in
Eqn. (2), the result is three equations in the three unknowns (p, u,
and c) - Eqns. (1), (6) [modified from Eqn. (2)], and (5) - as
.'-,; follows:
ap a P au-- + U - + p(at ax ax
+cU -- (6)
Pl
These equations are exact as long as the motion under consideration is
isentropic. Under that condition, a solution of the equations would
completely describe o, u, and c in terms of x and t for a system of gas
contained in a constant area tube (Figure 1).
163
-77
%i 1%

LUSA FA-TR-84- 5
II I II I I I I IlI/l I I I Ii II I I I I / I / I I
Figure 1. Unsteady One-Dimensional Gas Flow Model Piston Is the Sourceof Disturbances in Gas Properties
We can then find the pressure and temperature through Eqns. (3) and (4).
Since terms such as u ()u/lx) make the equations nonlinear, however,
they are not easily solved. There are two methods for arriving at a
solution. One is based on small perturbations in p and u and leads to
the classical wave equation. The other, the method of characteristics,
originated by Riemann and Earnshaw in the nineteenth century, leads to
a stepwise solution of the nonlinear equations, a procedure that is more
exact than the linear solution. In the next section, we will linearize
the equations to obtain the so-called acoustic equations.
II. Linearized One-Dimensional Unsteady Flow
Consider small perturbations in density and velocity from an
initial uniform condition with property values of n p , T , and c] and
zero stream velocity. The small perturbation in density is - ol
and the small perturbation in speed is u = u - 0 = u. Here we
introduce a non-dimensional perturbation density, ,, defined by
p-p 1 6p
so that
I ""° : l ( + p
154
[',-.. .. ... ............ . . . .,,... .,
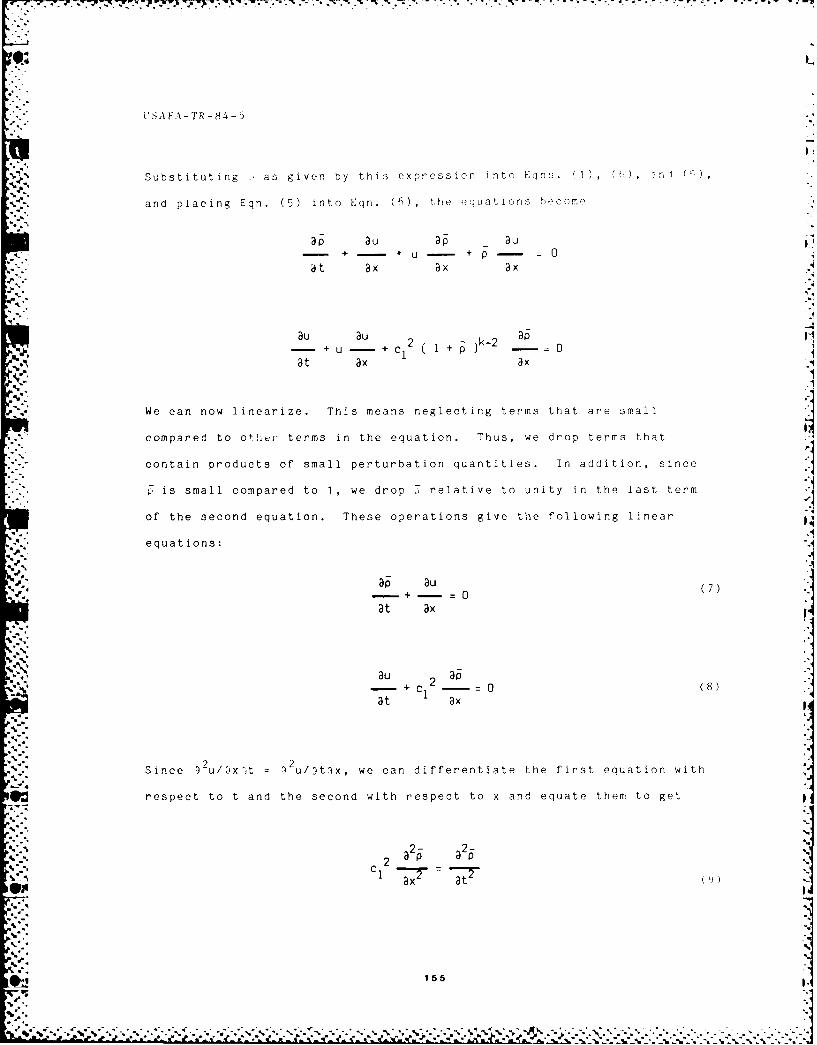
U SA FA -T R - 84- 5
Substituting , as given by this expression into Eqns. ( ), ( ), -rt 'I
%.. and placing Eqn. (5) into Eqn. (6), the equations hecoCe
a au ap 3u -I
- + - + U - +P - z-
at ax 3x Sx
au au a+ u + el2 (1+ p )k-2 0
at ax ax
We can now linearize. This means neglecting terms that are small
compared to other terms in the equation. Thus, we drop terms that
contain products of small perturbation quantities. In addition, since
p is small compared to 1, we drop relative to unity in the last term
of the second equation. These operations give the following linear
equations:S."
S.',at au
4 -+ - =07
at ax
<-N<
> +au 2 I(8
at ax
2 2Since 32u/Dx-t = 2u/3tqx, we can differentiate the first equation with
,t respect to t and the second with respect to x and equate them to get
2- 2-' "'.C 12 r
%4
_155
% %-% ,
W ,", -.'-"."' "-", "-<-.f -"-;-.m'-.-',..,-o ',."j":.-- °",.,4--"f,--" .,,-\-.-. ,"- --.. ' ,"."."-.."-. .,-.-- . "-. -""

USAFA-TR-84-5
Similarly, because i-7/Jx't 5 -,t"x, we obtain
2 2(()q- .. '- . a u ? 2u0
%, which was discussed in Part I of this series. Eqns. (9) and (10),
which are in the form of the wave equation, show that any disturbances
in density and speed propagate through the gas without change at the
speed of sound in the undisturbed gas, cI '
If we write the general solution to Eqn. (10) as
U = 6u = f (x -C 1 t ) + g [x + C1 t ) 11)
then, since is related to u through Eqns. (7) and (8), the solution to
Eqn. (9) must be
. .. .f ( x -C t =-g (x +ct) (12)
One can verify that Eqns. (7) through (10) are all satisfied by Eqns.
(11) and (12). If we consider only simple rightward- and leftward-
propagating waves (for which g 0 and f = 0, respectively) we can write
Eqns. (11) and (12),, 8 : 6u
S- (13)
where the + and - signs refer to rightward- and leftward-propagating
simple waves.
Here is the interpretation of Eqn. (13). If the piston (Figure 1)
% imparts a positive incremental change in velocity, 'u, to the gas
particles adjacent to the piston face, this disturbance will propagate
to the right through the gas at the speed c1 . This disturbance in
particle velocity is accompanied by a positive increment in gas density
given by Eqn. (13). If we move the piston to the left, imparting ao..
negative increment in u, then this rightward-propagating disturbano
15
-.. ?A .A ~ ~ -.. 2? ~ ~ A .. AJ. .* ~ . .- .~

o .*. . _. . - - = ' - . - L I . . - .. ' .i
USAFA-TR-94- ]in particle speed is accompanied by a decrease in gas lensity. Similar
remarks apply to the density effect produced by leftward- [negative sign
in Eqn. (13)1 propagating disturbances in particle speed generated by
a piston placed at the right-hand end of the tube (Figure 1).
For example, suppose the piston of Figure I imparts a sinusoidal
velocity disturbance to the air particles adjacent to the piston face,
so that at t = 0 the gas velocity distribution in the tube is
ft x6u : 10 - sin 2 7 -
sec 4 ftI '
0 < x < 2 ft.
The perturbation density distribution in the gas is then given by Eqn.
(13) with the plus sign. Thus, if c 1000 ft/sec and = 0.076
lbm/it3, corresponding to standard air conditions, then
6u
6p p1 ICl
sc1
1bmxIbm lsec sin
=0.076
ft 1000 ft/sec
ibm 2 1 x= 0.00076 sin 4 f. 0ft" 4 ft.
These disturbances in ."u and 50 propagate through the gas along the
rightward characteristics (Figure 2).
%
157. . ..
:-" ;v - v , ..- v - - ","--.- - , - -4-. .. , -- , .,---. .- - " -" . - "" . " ". - - - - - . . .-•- - . • - ," _ -" " " _" .. ," 't . ' ,, ,: ;, - , '. ,. , • , . . .. . ' ,, ,. - : - - .. . - . - .. - - .. - . " ' - - .-.-

L' SA FA - I' R - 8 4
CHAR ACTERIS TIC St x= cons t c t
(MIL SEC.)
3
2-
0. 012 3 4 5 ~t.
0
ibmftt3 tz2 milsec.f t/
20 I .00152
8U 10- .00076
01= _X ~00 2 4 a (ft.) 0 2 4 a (ft.)
Figure 2. Particle Velocity and Accompanying Density DisturbancesAdvancing Through a Gas
III. Pressure and Temperature Disturbances Accompanying a Particle
Velocity Perturbation
The final result of the preceding section shows that a disturbance
(,Su, in gas-particle velocity imparted by, for example, a piston)
propagates through the gas at the speed of sound, cl. Accompanying this
disturbance in gas particle speed is a density disturbance given by
6P 6U
* 1568

A->
- .. we must also find the perturbations in reo;r, -d tfm',- -rntur,
a cooI'r a yin - he density and part ole-spe C' 10tar nca. Tho a , r
g ven Ly the isentropi a r ations, Eq. , ( 3) and ( a) , hioh t a k the
l", owing form when written in terms of the perturbation denity,
("2) k 4 I( + ] [P + + .
, ' cnpir:g terms of higher order than s in the above binrroial
p p1 + k P
" A. far write the equation, using Sp p - P , as
6P 6PPl(Pl
..' < l in y, Eqn. (4) gives
6T 6~= ( k -i - s
* [ir , thee results, a,- can determine the pressure and temperature
S" t> rban e s aasociated with the velocity and density disturbances
illustrated h~y Figure 2. According to Eqn. (14), when p 1680
ltf/ft = at time t 0,
6p= kp =kp, -
6p [1.4(1680 psfa) 10-2 sin 21T -,,-,..-4 FT.
lbf x6p 23.5 -sin 2T -
ft 4 ft.
..' Aqd (I Fording to Eqn. I , i I T 15 degrees R, then at t 0 the
* om'~rature i turbane
6T (k-I) T : (k-I) T1,.5.
(.P- ",* ,
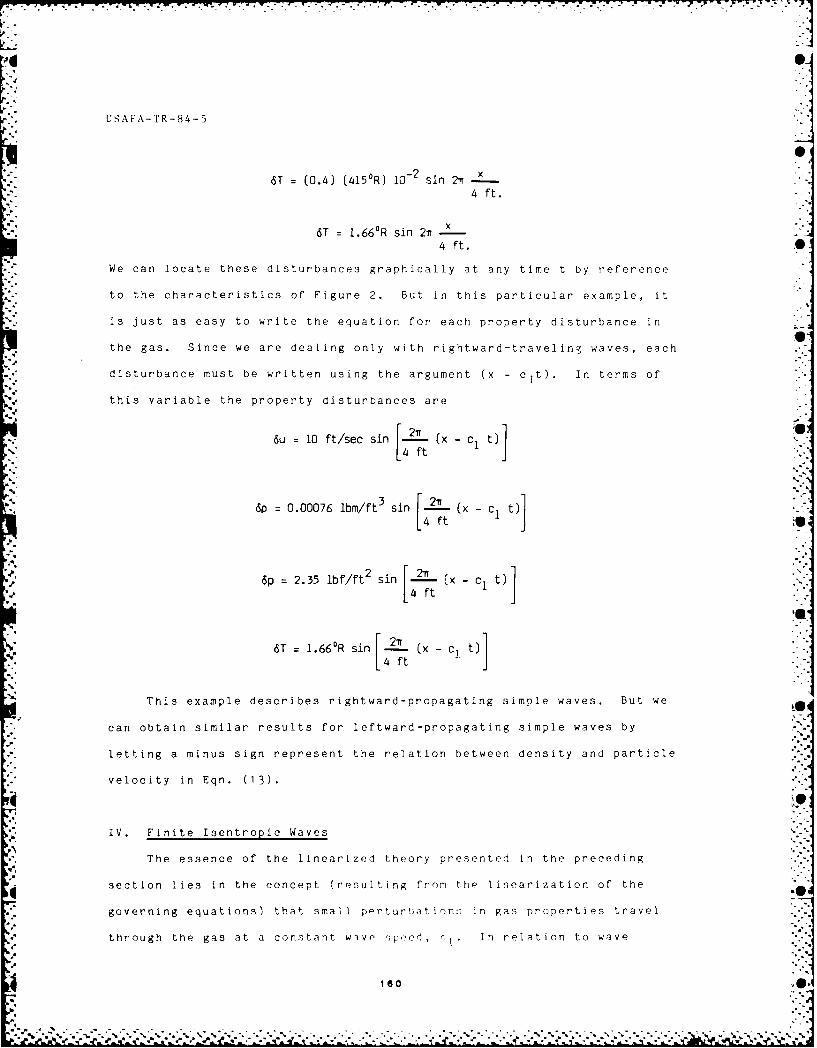
ULSAFA-TR- 84-5
6T = (0.4) (415'R) 10- 2 sin 27t x4 ft.
6T = 1.66 0 R sin 2n x4 ft.
We can locate these disturbances graphically at any time t by reference
to the characteristics of Figure 2. But in this particular example, it
is just as easy to write the equation for each property disturbance in
the gas. Since we are dealing only with rightward-traveling waves, each
disturbance must be written using the argument (x - c t). In terms of
this variable the property disturbances are
6u = 10 ft/sec sin 2 x C1 t)]
4 f
%6p 0.00076 ibm/ft3 sin (XCx-c t)1[4ftJ
6p =2.35 lbf/ft2 sin t)1
6T =1.660R sin c t
This example describes rightward-propagating simple waves. But we
can obtain similar results for leftward-propagating simple waves by
letting a minus sign represent the relation between density and particle
velocity in Eqn. (13).
IV. Finite Isentropic Waves
The essence of the linearized theory presented in the preceding
section lies in the concept (resulting from the linearization of the "
governing equations) that small pertur!hationo in gas properties travel
e through the gas at a constant wivo sped, cl. In relation to wave
IS~16o0
, .. , ..- - .- -. .. . . - . . - . .,. . . . , ..~ * a ,,L
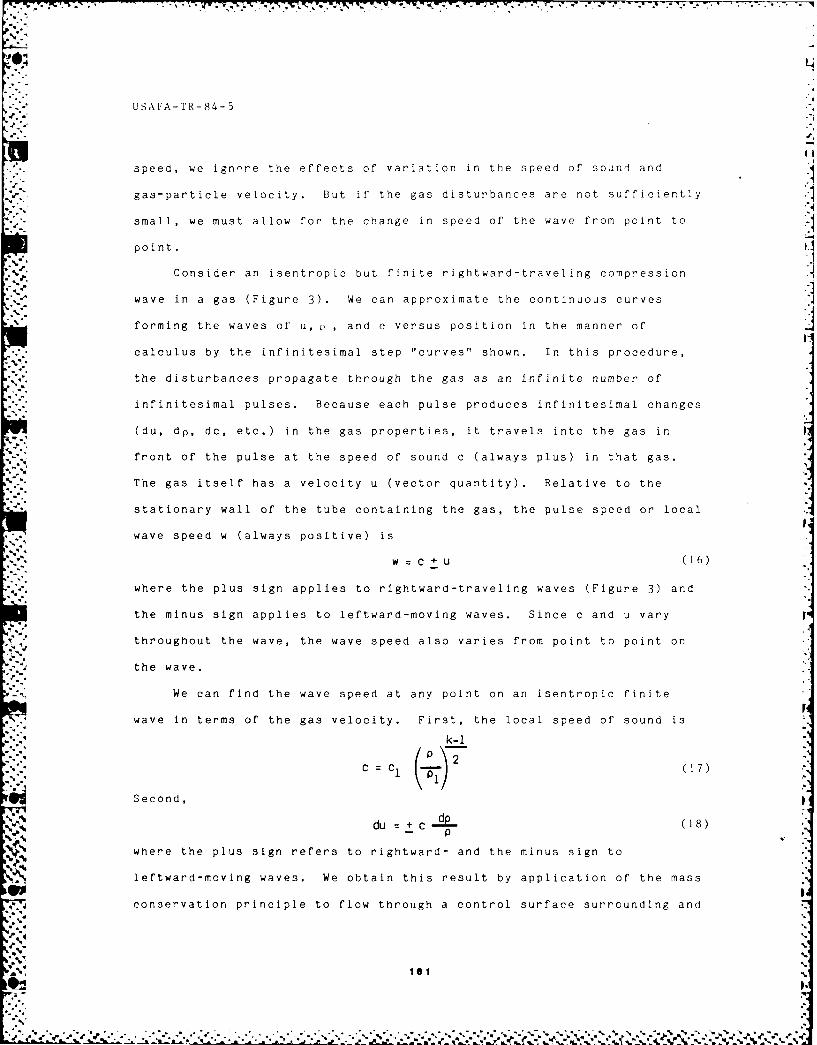
.%'..
;:... U SA FA-TR- 84- 5
speed, we ignnre the effects of variation in the speed of sound and
gas-particle velocity. But if the gas disturbances are not sufficiently
small, we must allow for the change in speed of the wave from point to
Consider an isentropic but finite rightward-traveling compression
wave in a gas (Figure 3). We can approximate the continuous curves
forming the waves of u, , and c versus position in the manner of
calculus by the infinitesimal step "curves" shown. In this procedure,
the disturbances propagate through the gas as an infinite number of
infinitesimal pulses. Because each pulse produces infinitesimal changes
(du, dp, dc, etc.) in the gas properties, it travels into the gas in
front of the pulse at the speed of sound c (always plus) in that gas.
The gas itself has a velocity u (vector quantity). Relative to the
stationary wall of the tube containing the gas, the pulse speed or local
. wave speed w (always positive) is
-. . WC + U (16)
where the plus sign applies to rightward-traveling waves (Figure 3) and
the minus sign applies to leftward-moving waves. Since c and u vary
throughout the wave, the wave speed also varies from point to point on
z j the wave.
We can find the wave speed at any point on an isentropic finite
wave in terms of the gas velocity. First, the local speed of sound is
k-i
. .C (17)
Second,
du + d -p (18)
where the plus sign refers to rightward- and the minus sign to
N leftward-moving waves. We obtain this result by application of the mass
conservation principle to flow through a control surface surrounding and
,%'
161 %44
7.

U S AFA -TR - 8 4- 5
* riding with a Pulse traveling at speed W (Figure 4)
0m XnX x m0 nx
PULSE
-4. W=C+L Win01 IlFigure 3. Compression Wave Considered as a Series of Infinitesimal
Pulses Moving Through a Gas in a Tube
W: u4C STEADY FLOW S
u+ du u (p[dpu(uc)- (u]4.. ~dc (p~p)[u~c)Cui~u)] 1-amass flux in
p~~dp amass flux out j-r-7-7C.S. MOVING WITH PULSEPULSE AT SPEED wzuoc,
4 OBSERVES STEADY FLOW .-
*Figure 4. Mass Conservation Principle Applied to Control SurfaceMoving with Pulse
-44
162 .-. *
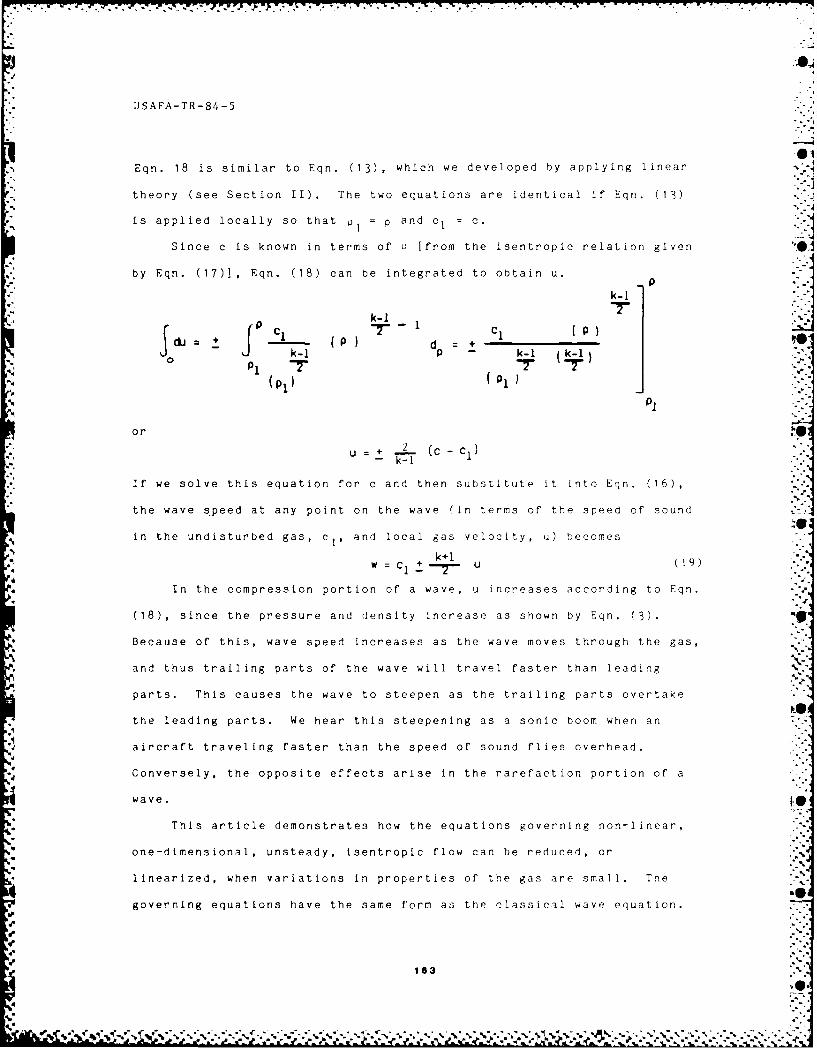
USAFA-TR-84-5
Eqn. 18 is similar to Eqn. (13), which we developed by applying linear
theory (see Section II). The two equations are identical if Eqn. (13)
is applied locally so that 0 = p and c, = c.
Since c is known in terms of 0 [from the isentropic relation given 0
by Eqn. (17)], Eqn. (18) can be integrated to obtain u.P
k-Ik-I- P I T Cl , .
C(= P ) dp
k-I P - k-I (k-1)
01 -T.'0*_0_
or 5
U + _ (c-c.)-- k-1 '.
If we solve this equation for c and then substitute it into Eqn. (16),
the wave s.peed at any point on the wave (in terms of the speed of sound
in the undisturbed gas, cl, and local gas velocity, u) becomes
* ks -1Sw =C 1 +- u (19)4,
4 In the compression portion of a wave, u increases according to Eqn.
(18), since the pressure and density increase as shown by Eqn. (3).
Because of this, wave speed increases as the wave moves through the gas,
and thus trailing parts of the wave will travel faster than leading %
parts. This causes the wave to steepen as the trailing parts overtake
the leading parts. We hear this steepening as a sonic boom when an
aircraft traveling faster than the speed of sound flies overhead.
Conversely, the opposite effects arise in the rarefaction portion of a
wave. 6
This article demonstrates how the equations governing non-linear,
one-dimensional, unsteady, isentropic flow can be reduced, or
linearized, when variations in properties of the gas are small. The
Solgoverning equations have the same form as the classical wave equation.
4.
163
-v "4."'].'
I - USAFA-TR-84-5
Thus, disturbances in velocity, density, pressure, and temperature will
propagate through a gas as waves with the properties described in Part
I of' this series.
-- '4
'4144
:7 ' " "USAFA-TR-84-5
.'a.°
.-Engner' Boksel
,p l
,.h-SE TIN
'.4"
Eniee'-B o sh l
4. 1 ."4l.,
:.-.4
.4. ".4
S%
.4-g*%l~ -°,
4'. 165. . .-. ;.. .. %¢ . . .- ,-,.. . , , , ., . , ... .-. -...... .-.- . . .,-.. .-.-.- -,.,-,-,-, , ,-... .'
"" i
USAFA-TR-84-5
THE ENGINEER'S BOOKSHELF:THE MYTH OF OBJECTIVITY IN THE WRITING OF ENGINEERS
Robert M. Hogge*
Picture in your mind a wind tunnel in an aeronautics laboratory. A
scientist, dressed in a white lab jacket and wearing horn-rimmed
glasses, enters the observation area. With a professional air, he scans
the equipment, makes sure everything is ready for the test, jots down a Jfew notes on a clipboard checklist, then flips a switch to begin the
experiment. During the test, he looks at gauges and dials, observing
exactly how his model (a forward-swept-wing aircraft) beha'ves in 0.8
Mach coinditions. Then when the test is over, he reviews his findings
and writes up his report. He'd like to write his report completely in
the language of math, but he knows he'll also have to use the English
language to communicate his findings to some members of his target
audience. So he picks his words carefully, striving for absolute
objectivity, avoiding personal pronouns, using passive verbs, and
writing in what he appropriately feels is the "scientific style." He
then reads the paper to himself. It's based on empirical evidence; his
reasoning is sound; and other scientists will be able to replicate his
experiment. So his writing must be objective. Or is it?
Of course it is, you say. Scientists don't write about their
feelings, opinions, and emotions. These "seekers after truth" focus on
objective reality (the empirical evidence) and record simply and
uniquely what they detect through the five senses. That's perfect
objectivity, isn't it? But how well does the English language serve as
a vehicle for that objectivity? Two scientists, Cox and Roland, have
some grave concerns about the written language and what kinds of words
scientists use to present their findings: "Since scientists agree that
their observations and conclusions should be presented as objectively as I
*Major, USAF, Associate Professor of English, USAF Academy
le1
% % %5N

V...
V2.,
USAFA-TR-84-5
possible, rhetoric should be avoided assiduously in scientific writing."
(Ref. 1, page 140) Here Cox and Roland imply that subjectivity ,:it
in scientific writing, and one of the great culprits is "rhetoric,"
language designed to persuade or impress an audience. So, like
Puritans, scientists attempt to strip rhetoric from their specialized
use of language, usually ending up with a cold, lifeless, dreary, and
boring set of verbal alternatives.
But where did we get this scientific penchant for objectivity in
writing? Probably it originated in the Greek society with Plato who had
no room in his Republic for men of literature (those who used words
imaginatively and emotionally). Or maybe it came as a reaction against
the Sophists who, by clever and intricate arguing, could make any set of
facts seem true. Or perhaps it was from Aristotle, the patron saint of
scientists, who argued that the mind is simply a passive receptor and
recorder of external stimuli. Or maybe it originated later in France
with Descartes (the Cartesian method of analysis) or Ramus (who
separated rhetoric from dialectic and argued for an objective language
free from emotion). Whatever its origins, "objective" writing became
thoroughly entrenched in the minds of scientists, almost a sacred ritual
they passed on from generation to generation. Today many scientists and
%" engineers still firmly hold to this "objective" theory of writing.
But there is another (and more expansive) way to look at writing.
To show you what I mean, let's look at a major philosophical debate
between David Hume (1711-1766) and Immanuel Kant (1724-1804). Hume, an
empiricist, argued that all thought comes to us through the five
senses--that the mind is a passive observer and receptor. This is the
philosophical position many engineers adhere to when they write. Kanttoo believes that all knowledge begins with sensory experience but that
a separate phenomenon (what he calls a priori knowledge) exists already
167
NpU,- 21 -D'A!
USAFA-TR-84-5
in the mature mind and does not come from the senses. As examples of a
priori knowledge, Kant specifies space and time, two aspects of reality
the mind understands intuitively. Because of our awareness of space and
time, the mind is able to interpret and arrange sensory data into
meaningful patterns.
If Kant is correct in his theorizing, what does it mean for
scientists and engineers today? Robert Pirsig provides an interesting
explanation:
If you presume that a priori concepts in our heads are independent
of what we see and actually screen what we see, this means that you are
taking the old Aristotelian concept of scientific man as a passive
observer, a 'blank tablet,' and truly turning this concept inside out
(Ref. 2, page 119).
Does this mean that the whole tradition of "objective" writing
might be in error? Throughout the years, have scientists and engineers
limited themselves unnecessarily by clinging to a seemingly passive,
Impartial, disinterested, or purely objective mode of writing? Can the
human mind do more than passively record external stimuli? Yes! The
mind not only receives, but it also creates.
To show how the mind creates, Robert Pirsig describes an analytical
process you're already familiar with-The Scientific Method. First he
lists the six steps:.4.
1. statement of the problem,
2. hypotheses as to the cause of the problem,
3. experiments designed to test each hypothesis,
4. predicted results of the experiments,
5. observed results of the experiments,
6. conclusions from the results of the experiments.
(Ref. 2, page 93)
Using the Scientific Method is a logical and empirical way to arrive at
truth. Or is it? How does the scientist formulate hypotheses? Where
do they originate? Albert Einstein developed a law to answer these
questions: "The number of rational hypotheses that can explain any
given phenomenon is infinite." (Ref. 2, page 100) If Einstein's theory
I .%,
J.-'. .. 77_7 .7 71" -7 T- 714 F 17 IT" T.. -07 :n
USA A- IR -8- 8
is true, then do we ever arrive at one trath or one rei ity2 Does the
human mind have the awesome responsibility to respond to these infinite
hypotheses, selecting those that are the most credible and prioritizing
them? Yes, the mind is so much more than a passive receptor. Thomas S.
Kuhn describes the almost mystical and often erratic workings of the
mind as it develops hypotheses to solve scientific puzzles:
Scientists then oftan speak of the 'scales falling from the eyes'or of the 'lightning flash' that 'inundates' a previously obscurepuzzle, enabling its components to be seen in a new way that for thefirst time permits its solution (Ref. 3, page 122).
So science does not always move forward "objectively," by induction or
deduction. Occasionally (and in the best of situations) the mind
provides insights intuitively.
The mind, in other words, creates or shapes reality. To explain
how the mind works, Kuhn discusses his concept of "paradigms." For him,
a paradigm is a perception or a model for what's out there-reality.
For example, he shows how astronomy first of all matured within a
Ptolemaic paradigm, the philosophy that the universe is geocentric
(earth centered). Ptolemy not only perceived it that way, but he also
developed an extensive mathematical construct to support that
Verception. Throughout the years, different scientists suggested
alternative world views. But it wasn't until scientists (with advanced
mathematics and instrumentation) revealed a major flaw in Ptolemy's
paradigm that the scientific world looked for another way to interpret
reality. Thus, the Copernican Revolution. Then, Kepler, Newton, and
Einstein -each with a different perception of what's out there.
How the mind perceives reality makes all the difference. And we
don't always perceive stimuli in the same way. According to Kuhn,
researchers in modern psychology have shown that "two men with the same
retinal impressions can see different things." (Ref. 3, 126-127) Also,
in 1938 Albert Einstein said: "Physical concept are free creations of
169
* " " - . .- - .. - -* - -- -. *. . . . . . . . ."",
I ' A FA - 1 -R - 5
the human mind, and are not, however it may seem, uniqiioly determinod by
the external world." (Ref. 4, page 8) In other words, Isaac Newton's
mind created the Law of Gravity as it relates to interpla etary motion;
that specific law or concept didn't exist before Newton. And it's the
same with all other laws, hierarchies, and concepts in science-all are
inventions of the human mind.
How "objective" is the human mind? When we move especially from
the macromolecular (Newtonian) universe to the micromolecular (quantum
o" .. .mechanics), objectivity does not exist. John Wheeler, a physicist at
Princeton, explains
'Participator' is the incontrovertible new concept given by quantummechanics. It strikes down the term 'observer' of classical theory, the
*. -. man who stands safely behind the thick glass wall and watches what goeson without taking part (Ref. 4, page 29).
But I submit to you that the "participator" mode is not just
reserved for those studying quantum mechanics. It also applies to
engineers working in aeronautics labs, with computers, on construction
projects. As engineers, we are much more than passive observers and
recorders of objective data. Our minds shape, mold, organize, and even
create what's out there.
It's time now for a Copernican Revolution in scientific writing.
Let's leave behind once and for all the Ptolemaic notion of "objective"
writing. Instead let's use the English language fully, uniting rhetoric
and dialectic, to create even more effective "paradigms" in
engineering -new discoveries, new ways to see the world.
References
1. Cox, Barbara G. and Charles G. Roland. "How Rhetoric Confuses
Scientific Issues," IEEE Transactions on Professional Communication,
Vol. PC-16, No. 3, September 1973, pp. 140-142.
170 '
.........................
U, SA FA- I-4- ]recorders of objective data. Our minds shape, mold, or .
create what's out there.
- It's time now for a Copernican Revolution in scientific wr '
Let's leave behind once and for all the Ptolemaic notion of "c e'tive"
writing. Instead let's use the English language fully, unitingV tcni
and dialectic, to create even more effective 'paradigms" in
engineering- new discoveries, new ways to see the world.
References
1. Cox, Barbara G. and Charles G. Roland. "How Rhetoric Confuses
Scientific Issues," IEEE Transactions on Professional Communication
Vol. PC-16, No. 3, September 1973, pp. 140-142.
2. Pirsig, Robert M. Zen and the Art of Motorcycle Maintenance: An
Inquiry into Values, Bantam Books, New York, 1975.
3. Kuhn, Thomas S. The Structure of Scientific Revolutions, University
of Chicago Press, Chicago, 1970.
4. Zukav, Gary. The Dancing Wu Li Masters: An Overview of the New
Physics, Bantam Books, New York, 1980.
1M %.-
.1
.5
*-,SF 1 > '{t.i " "; , { '.',. ' ';. '.L .Q "-'-'-. -. , '..-. . . .' ' -- '.- .,".-",'.
r'~~ A?.
4V4
41.
it~
V . 2 -7E..1,
q6.r
Jo1a.
05'4 1
Top Related