


Languages
Pages
Legal


10/9/19
1
Justice Reinvestment Initiative Data and Systems Presentation
October10,2019
2
Overview
• Introduction• TN:TheCasefortheJusticeReinvestmentInitiative• Admissions• TimeServed• CustodyPopulation• FemalePopulation• CommunitySupervision• KeyTakeaways

10/9/19
2
3
CriminalJusticeInvestmentTaskForce(CJITF)SteeringCommitteeObjective
Lettersignedby:• GovernorBillLee• LieutenantGovernorRandyMcNally• ChiefJusticeJeffreyBivins• Speaker-DesigneeCameronSexton
“useourstate’sdatatomove
towardsacriminaljusticesystemthatfocusesresourcesonevidence-basedrecidivism
reductionandcrimepreventionstrategiesthatincreasepublicsafetyandimprove
outcomesforallTennesseans.”
StateleadershiphasinstructedtheCJITFto:
4
JusticeReinvestmentInitiative(JRI)
• JRIisaprojectfundedbytheDepartmentofJusticethatworkswithstateleaderscommittedtousingtheircriminaljusticedatatodevelopproven,innovative,andcomprehensiveapproachestoreducerecidivismrates,promotepublicsafetyandshiftresourcestowardmorecost-effectivestrategies

10/9/19
3
5
DataSources
• Primarydatasources• TNDepartmentofCorrection• TNBoardofParole• TNAdministrativeOfficeoftheCourts• Unlessstatedotherwise,alldatapresentedwasanalyzedbyCJIinconsultationwithaboveagencies
• Additionaldatafrom• U.S.DepartmentofJustice,BureauofJusticeStatistics• U.S.CensusBureau
Note:Datapresentedheremaynotmatchstatereportsduetodifferentmethodologiesforanalysis
6
IronLawofPrisonPopulationGrowth
Admissions+TimeServed=TDOCPopulation

10/9/19
4
7
FactorsInfluencingAdmissions&TimeServed
Law Enforcement Options & Crime Rates
Sentencing Practices
Release Mechanisms
Recidivism
8
QualitativeSourcesInterviews/Meetings DocumentsReviewed• Judges• DistrictAttorneys• PublicDefenders• TennesseeDepartmentofCorrection• TennesseeDepartmentofSafety• TennesseeDepartmentofMental
HealthandSubstanceAbuseServices• TennesseeBoardofParole• LawEnforcement• Sheriffs• MentalHealthPractitioners• VictimAdvocates• ReentryGroups• WorkforceDevelopmentCenters• DrugCourtAlumni
• TennesseeStateStatutes• TennesseeDepartmentofCorrections
PoliciesandProcedures• TennesseeBoardofParolePoliciesand
Procedures• TennesseeCourtRules,Rulesof
CriminalProcedure

10/9/19
5
9
MultipleObjectivesofIncarceration
• Incapacitation:Reducingcurrentcriminalinvolvementbyholdingoffendersinprisonwheretheycannotcommitcrimesagainstthepublic• Deterrence:Reducingthelikelihoodoffuturecriminalinvolvementbyincreasingthepunishmentforthecurrentoffense• Rehabilitation:Reducingthelikelihoodoffuturecriminalinvolvementbyofferingeffectiveprogrammingandtreatmentduringtheperiodofincarceration• Retribution:Paymentorpunishment,intheformofimprisonment,forviolatingcommunitynormsandorder
TN:TheCasefortheJusticeReinvestmentInitiative

10/9/19
6
11
PrisonPopulationGrewNearly400%
5,835
28,980
0
5,000
10,000
15,000
20,000
25,000
30,000
35,000
1978
1979
1980
1981
1982
1983
1984
1985
1986
1987
1988
1989
1990
1991
1992
1993
1994
1995
1996
1997
1998
1999
2000
2001
2002
2003
2004
2005
2006
2007
2008
2009
2010
2011
2012
2013
2014
2015
2016
2017
Popu
latio
nTennesseePrisonPopulation,1978-2017
Source:U.S.DepartmentofJustice,BureauofJusticeStatistics,NationalPrisonerStatisticsProgram
12
CommunitySupervisionPopulationAddedNearly30,000Since1994
45,987
74,701
-
10,000
20,000
30,000
40,000
50,000
60,000
70,000
80,000
90,000
1994
1995
1996
1997
1998
1999
2000
2001
2002
2003
2004
2005
2006
2007
2008
2009
2010
2011
2012
2013
2014
2015
2016
Popu
latio
n
TennesseeCommunitySupervisionPopulation,1994-2016
Source:U.S.DepartmentofJustice,BureauofJusticeStatistics,AnnualProbationSurvey,AnnualParoleSurvey
10/9/19
7
13
Tennessee’sIncarcerationRateis10%HigherthanNationalAverage
Source:U.S.DepartmentofJustice,BureauofJusticeStatistics,NationalPrisonerStatisticsProgram
390
429
0
50
100
150
200
250
300
350
400
450
5001978
1979
1980
1981
1982
1983
1984
1985
1986
1987
1988
1989
1990
1991
1992
1993
1994
1995
1996
1997
1998
1999
2000
2001
2002
2003
2004
2005
2006
2007
2008
2009
2010
2011
2012
2013
2014
2015
2016
2017
Impriso
nmen
tRate
U.S.andTennesseeStateImprisonmentRateper100,000Residents,1978-2017
UnitedStates Tennessee
14
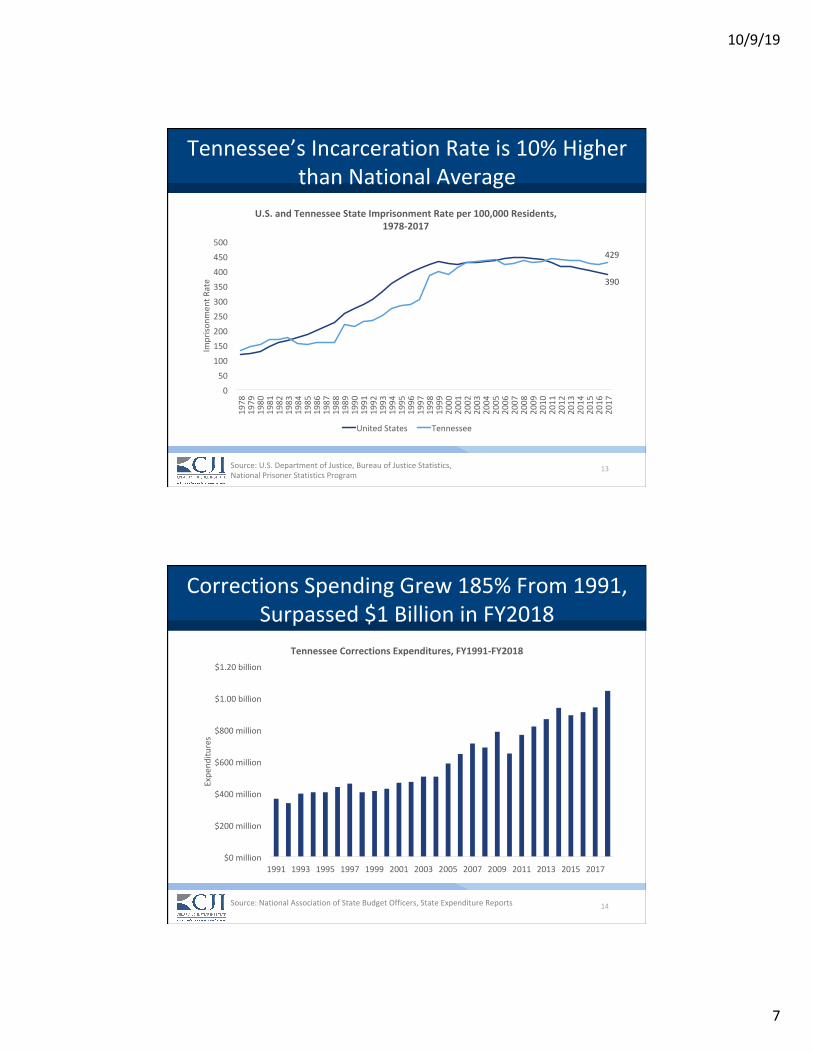
CorrectionsSpendingGrew185%From1991,Surpassed$1BillioninFY2018
$0million
$200million
$400million
$600million
$800million
$1.00billion
$1.20billion
1991 1993 1995 1997 1999 2001 2003 2005 2007 2009 2011 2013 2015 2017
Expe
nditu
res
TennesseeCorrectionsExpenditures,FY1991-FY2018
Source:NationalAssociationofStateBudgetOfficers,StateExpenditureReports
10/9/19
8
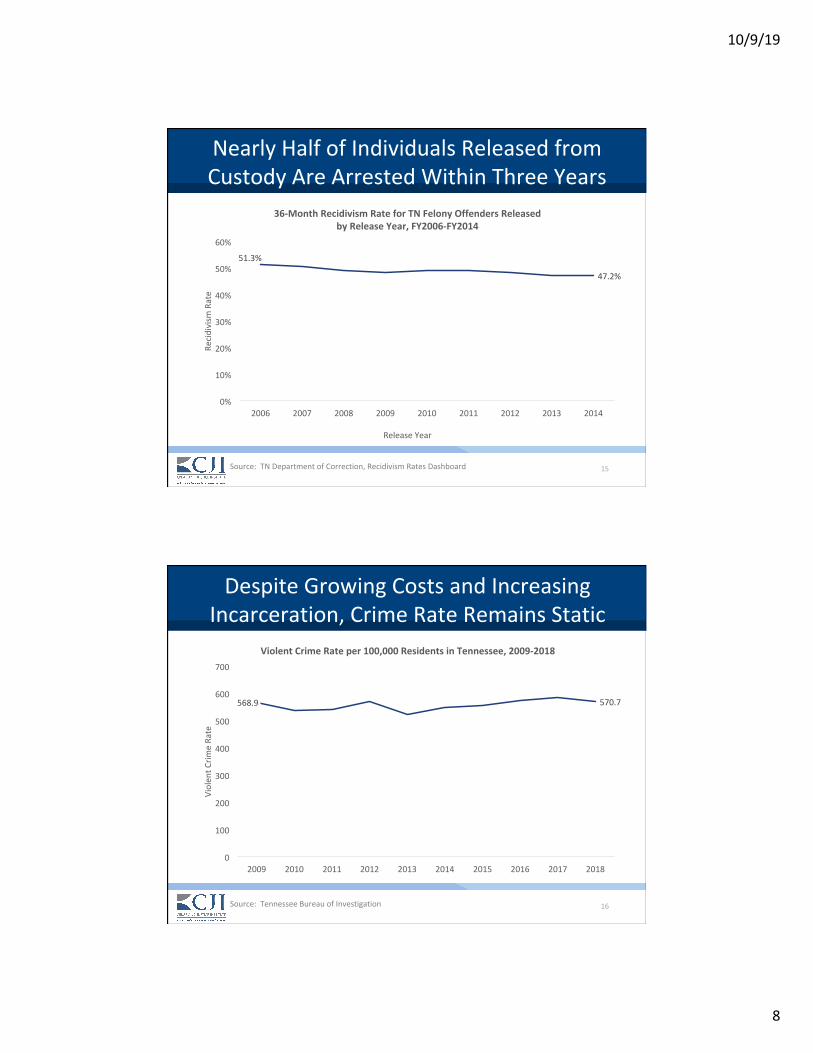
15
NearlyHalfofIndividualsReleasedfromCustodyAreArrestedWithinThreeYears
Source:TNDepartmentofCorrection,RecidivismRatesDashboard
51.3%
47.2%
0%
10%
20%
30%
40%
50%
60%
2006 2007 2008 2009 2010 2011 2012 2013 2014
Recidivism
Rate
ReleaseYear
36-MonthRecidivismRateforTNFelonyOffendersReleasedbyReleaseYear,FY2006-FY2014
16
DespiteGrowingCostsandIncreasingIncarceration,CrimeRateRemainsStatic
568.9 570.7
0
100
200
300
400
500
600
700
2009 2010 2011 2012 2013 2014 2015 2016 2017 2018
Violen
tCrim
eRa
te
ViolentCrimeRateper100,000ResidentsinTennessee,2009-2018
Source:TennesseeBureauofInvestigation

10/9/19
9
Admissions
18
IronLawofPrisonPopulationGrowth
Admissions+TimeServed=TDOCPopulation
10/9/19
10
19
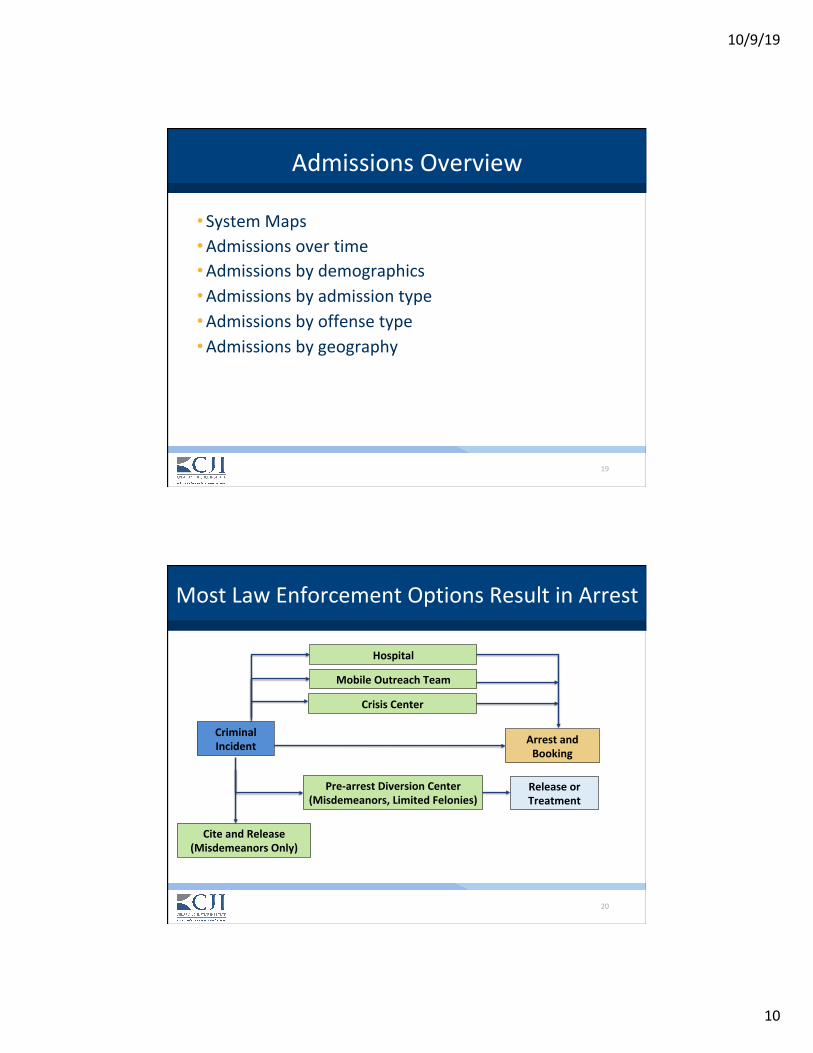
AdmissionsOverview
• SystemMaps• Admissionsovertime• Admissionsbydemographics• Admissionsbyadmissiontype• Admissionsbyoffensetype• Admissionsbygeography
20
MostLawEnforcementOptionsResultinArrest
CriminalIncident
CiteandRelease(MisdemeanorsOnly)
Hospital
ArrestandBooking
CrisisCenter
Pre-arrestDiversionCenter(Misdemeanors,LimitedFelonies)
MobileOutreachTeam
ReleaseorTreatment

10/9/19
11
21
LimitedDiversionOpportunitiesOnceArrested
Arrestand
BookingGrandJury
IndictmentorPresentment
Trial
RecoveryCourts
GuiltyPleaInitialAppearance
andPreliminaryHearing
Sentencing
Legend:Decision-MakingOptionNextStepintheProcess
CommunitySupervision
PrisonandJail
PretrialDiversion
(Misdemeanors)
22
TypesofAdmissiontoPrisonandJail
• NewCommitments:IndividualsenteringprisonorjailasaresultofanewfelonyconvictionwheretheyweresentencedtoserveatleastoneyearinTDOCcustody
• CommunitySupervisionViolators:Individualsenteringprisonorjailasaresultofviolatingaconditionofparoleorprobation,includingtechnicalviolationsaswellasreoffendingwithanewmisdemeanororfelony

10/9/19
12
23
FelonyAdmissionsDeclined14%inLast10Years
14,892 15,657
12,789
0
2,000
4,000
6,000
8,000
10,000
12,000
14,000
16,000
18,000
2009 2010 2011 2012 2013 2014 2015 2016 2017 2018
Admissions
FelonyAdmissions,FY2009-FY2018
Source:TNDepartmentofCorrection
24
AdmissionsDeclinedfromBothCommunitySupervisionViolatorsandNewCommitments
0
1,000
2,000
3,000
4,000
5,000
6,000
7,000
8,000
9,000
10,000
CommunitySupervision NewCommitments
Admissions
FelonyAdmissionsbyAdmissionType,FY2009vs.FY2018
2009 2018
Source:TNDepartmentofCorrection
10/9/19
13
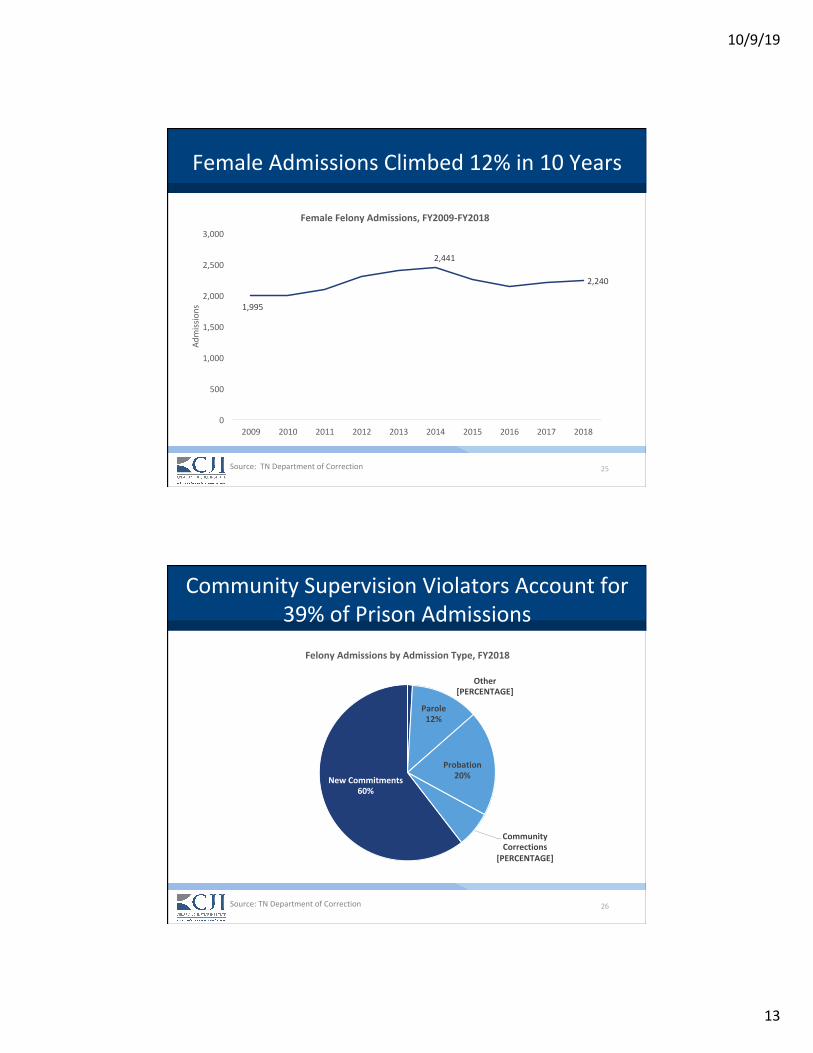
25
FemaleAdmissionsClimbed12%in10Years
1,995
2,441
2,240
0
500
1,000
1,500
2,000
2,500
3,000
2009 2010 2011 2012 2013 2014 2015 2016 2017 2018
Admissions
FemaleFelonyAdmissions,FY2009-FY2018
Source:TNDepartmentofCorrection
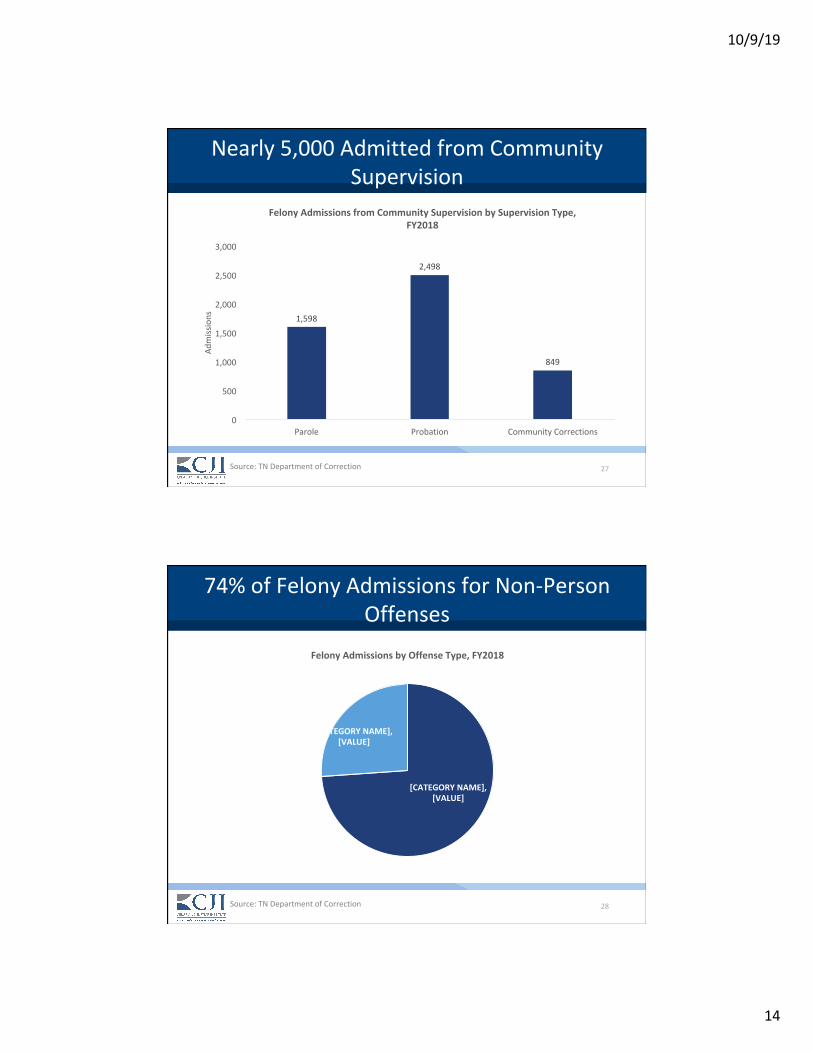
26
CommunitySupervisionViolatorsAccountfor39%ofPrisonAdmissions
Other[PERCENTAGE]
Parole12%
Probation20%
CommunityCorrections
[PERCENTAGE]
NewCommitments60%
FelonyAdmissionsbyAdmissionType,FY2018
Source:TNDepartmentofCorrection
10/9/19
14
27
Nearly5,000AdmittedfromCommunitySupervision
1,598
2,498
849
0
500
1,000
1,500
2,000
2,500
3,000
Parole Probation CommunityCorrections
Admissions
FelonyAdmissionsfromCommunitySupervisionbySupervisionType,FY2018
Source:TNDepartmentofCorrection
28
74%ofFelonyAdmissionsforNon-PersonOffenses
[CATEGORYNAME],[VALUE]
[CATEGORYNAME],[VALUE]
FelonyAdmissionsbyOffenseType,FY2018
Source:TNDepartmentofCorrection

10/9/19
15
29
PropertyOffensesareMostCommonReasonforAdmission
Person26%
Property33%
Drugs27%
Other14%
FelonyAdmissionsbyOffenseType,FY2018
Source:TNDepartmentofCorrection
30
EasternRegionCountersStatewideTrendbySendingMoretoPrison
0
1,000
2,000
3,000
4,000
5,000
6,000
West Middle East
Admissions
FelonyAdmissionsbyRegion,FY2009vs.FY2018
2009 2018
Source:TNDepartmentofCorrection

10/9/19
16
31
FelonyAdmissionRatesHighestOutsideMajorMetropolitanAreas
FelonyAdmissionsbyCountyofConvictionPer10,000Residents,FY2018
Source:TNDepartmentofCorrection
32
ResearchonIncarcerationandRecidivism
Researchershavestudiedwhetherincarcerationreducesfuturecriminalbehaviormorethanotherformsofsanctions
Findings:• Bales&Piquero(2012):Foundthat“overall,imprisonmentleadstohigherrecidivismwhencomparedtoanon-incarcerativealternative,i.e.,acriminogeniceffectofimprisonment”• SpohnandHolleran(2002):Found“noevidencethatimprisonmentreducedordelayedrecidivism,eitherforfelonyoffendersgenerallyorfordrugoffendersspecifically”• DrakeandAos(2012):Foundthattechnicalviolatorsofprobationservingaperiodofconfinement(jailorprison)hadsignificantlyhigherrecidivismthanoffenderssanctionedinthecommunity
Source:Bales&Piquero(2012);Spohn&Holleran(2002);Drake&Aos(2012).
10/9/19
17
33
KeyTakeaways
• Despiteoveralladmissionsdeclines,themajorityofadmissionsarefornon-personoffensesandmanyaretheresultofcommunitysupervisionfailures• 74%ofadmissionsarefornon-personoffenses,andpropertyoffensesarethemostcommon• Nearly5,000admittedlastyearfromcommunitysupervision
• Admissionshaveincreasedincertainareasandforcertaintypesofoffenders• Admissionsoffemaleoffendersgrew12%• AdmissionsfromEasternTennesseegrew11%
TimeServed
10/9/19
18
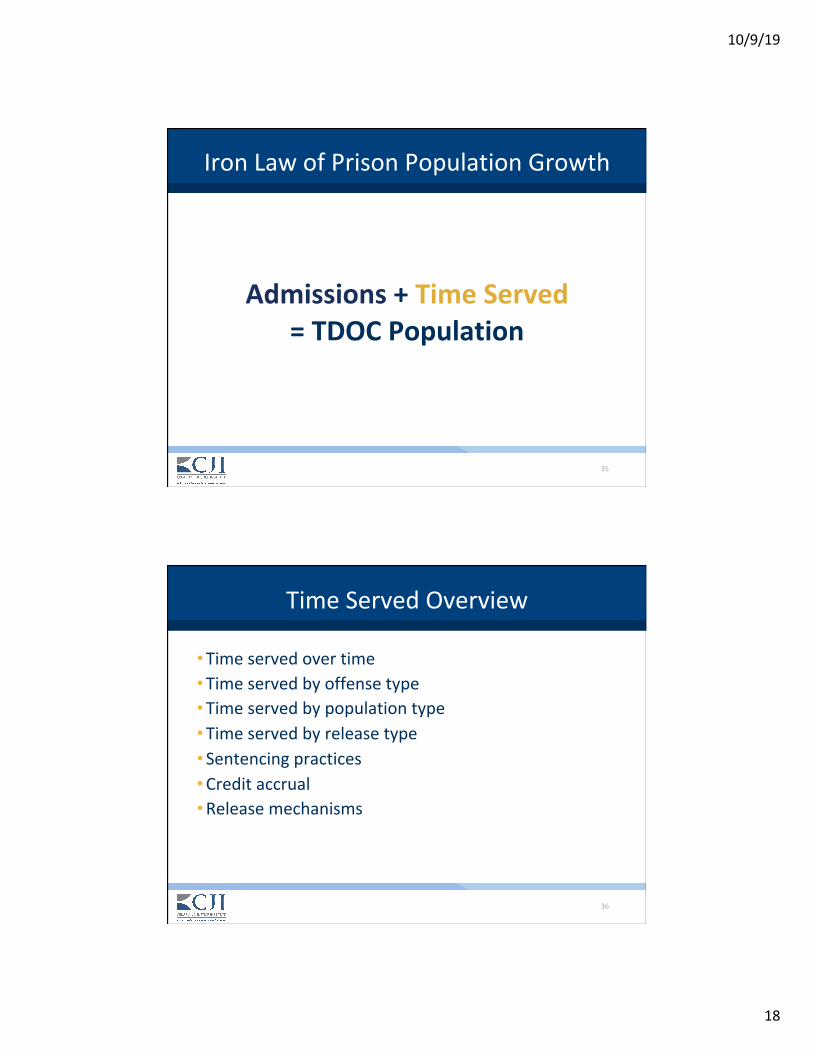
35
IronLawofPrisonPopulationGrowth
Admissions+TimeServed=TDOCPopulation
36
TimeServedOverview
• Timeservedovertime• Timeservedbyoffensetype• Timeservedbypopulationtype• Timeservedbyreleasetype• Sentencingpractices• Creditaccrual• Releasemechanisms

10/9/19
19
37
AverageTimeServedGrew11Months
0
10
20
30
40
50
60
70
80
90
Sentences TimeServed
Mon
ths
AverageSentenceandTimeServed,FY2009vs.FY2018
2009 2018
11Months
Averagesentencelengthexcludessentencestolifeimprisonmentordeath.Source:TNDepartmentofCorrection
38
TimeServedIncreasedforAllOffenseTypes
Source:TNDepartmentofCorrection
0
10
20
30
40
50
60
70
80
90
Non-Person Person
Mon
ths
AverageTimeServedbyOffenseType,FY2009vs.FY2018
2009 2018
15Months
9Months

10/9/19
20
39
TimeServedonDrugOffensesUp32%
Source:TNDepartmentofCorrection
0
10
20
30
40
50
60
70
80
90
100
Person Property Drugs Other
Mon
ths
AverageTimeServedbyOffenseType,FY2009vs.FY2018
2009 2018
14Months
40
TimeServedforCocaineOffensesGrewby63%
Source:TNDepartmentofCorrection
0
10
20
30
40
50
60
70
80
90
100
CocaineDrugOffense Non-CocaineDrugOffense
Mon
ths
AverageTimeServedonDrugOffenses,FY2009vs.FY2018
2009 2018
63%Increase

10/9/19
21
41
0
10
20
30
40
50
60
70
80
90
100
TDOC Backup LocallySentenced
Mon
ths
AverageTimeServedbyPopulationType,FY2009vs.FY2018
2009 2018
TimeServedinStatePrisonsUp14Months,LocallySentencedPopulationUp10Months
14MonthsLonger18%Increase
10MonthsLonger39%Increase
6MonthsLonger16%Increase
Source:TNDepartmentofCorrection
42
TimeServedPriortoReleaseonParoleUpby20Months
0
10
20
30
40
50
60
70
80
90
100
ExpirationofSentence ReleasetoParole
Mon
ths
AverageTimeServedbyReleaseType,FY2009vs.FY2018
2009 2018
7Months 20Months
Source:TNDepartmentofCorrection
10/9/19
22
43
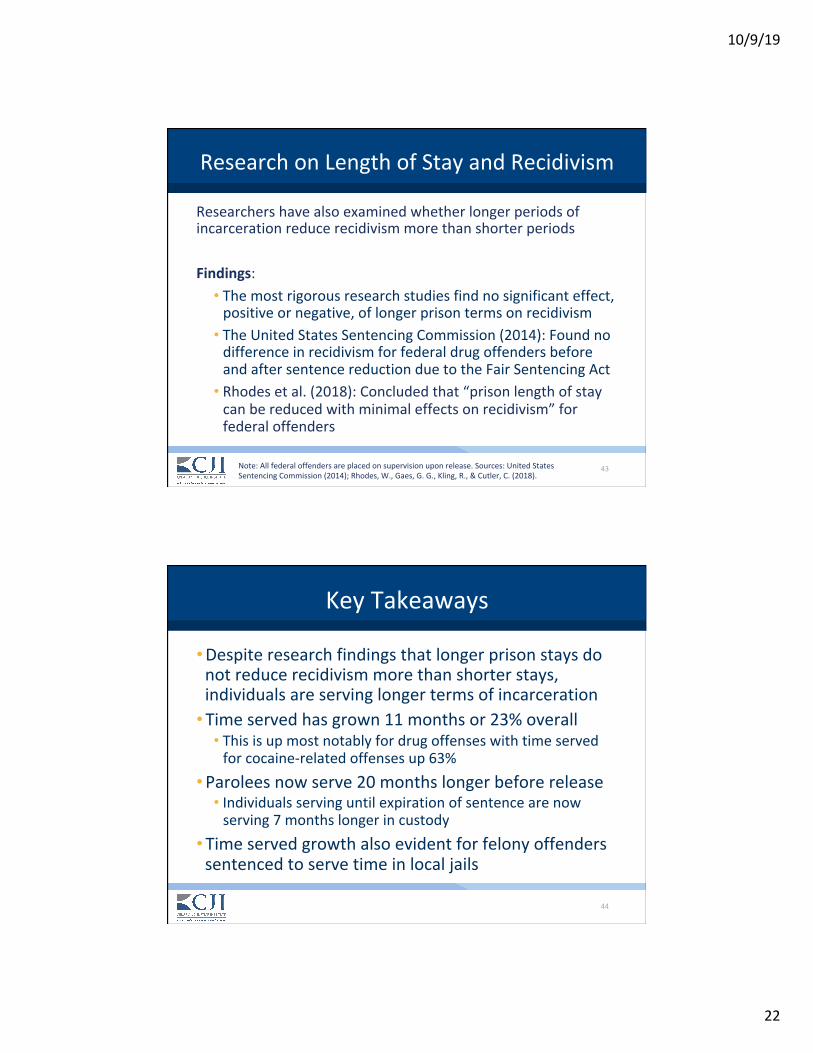
ResearchonLengthofStayandRecidivism
Researchershavealsoexaminedwhetherlongerperiodsofincarcerationreducerecidivismmorethanshorterperiods
Findings:• Themostrigorousresearchstudiesfindnosignificanteffect,positiveornegative,oflongerprisontermsonrecidivism• TheUnitedStatesSentencingCommission(2014):FoundnodifferenceinrecidivismforfederaldrugoffendersbeforeandaftersentencereductionduetotheFairSentencingAct• Rhodesetal.(2018):Concludedthat“prisonlengthofstaycanbereducedwithminimaleffectsonrecidivism”forfederaloffenders
Note:Allfederaloffendersareplacedonsupervisionuponrelease.Sources:UnitedStatesSentencingCommission(2014);Rhodes,W.,Gaes,G.G.,Kling,R.,&Cutler,C.(2018).
44
KeyTakeaways
• Despiteresearchfindingsthatlongerprisonstaysdonotreducerecidivismmorethanshorterstays,individualsareservinglongertermsofincarceration• Timeservedhasgrown11monthsor23%overall• Thisisupmostnotablyfordrugoffenseswithtimeservedforcocaine-relatedoffensesup63%
• Paroleesnowserve20monthslongerbeforerelease• Individualsservinguntilexpirationofsentencearenowserving7monthslongerincustody
• Timeservedgrowthalsoevidentforfelonyoffenderssentencedtoservetimeinlocaljails

10/9/19
23
45
UnderstandingTimeServed
Sentence
CreditAccrual
ParoleRelease
46
Sentencing:FelonySentencingClass
FelonyClass SentenceRange
Capital Lifesentence,Death
ClassA 15to60yearsinprison
ClassB 8to30yearsinprison
ClassC 3to15yearsinprisonorjail
ClassD 2to12yearsinprisonorjail
ClassE 1to6yearsinprisonorjail

10/9/19
24
47
Sentencing:FelonySentencingGrid
CriminalHistoryFelonyClass
FelonyA FelonyB FelonyC FelonyD FelonyE
MitigatedOffenders:Nopriors,no
enhancements,andcourtfindsmitigatingfactors
Thecourtshallreducethedefendant'sstatutoryRangeIminimumsentenceby(10%)orreducethereleaseeligibilitydateto(20%)ofthesentence,orbothreductions.
StandardRangeI(0-1prior) 15–25years 8–12years 3–6years 2–4years 1–2years
MultipleRangeII(2-4priors)
(1priorClassAifcurrentoffenseisClassAorB)
25–40years 12–20years 6–10years 4–8years 2–4years
PersistentRangeIII(5+priors)(2or3priorAorB’sif
currentoffenseisaClassAorB)
40–60years 20–30years 10–15years 8–12years 4–6years
CareerOffender(6+priors)
(3or4priorClassAorB’sifthecurrentoffenseisa
ClassAorB)
60years 30years 15years 12years 6years
48
Sentencing:FelonySentencingOptions
Trial
Probation
RecoveryCourts
Incarceration
CommunityCorrections
JudicialDiversion
SplitSentence
SentencingHearing
CommunitySupervision
Jails
Prison
10/9/19
25
49
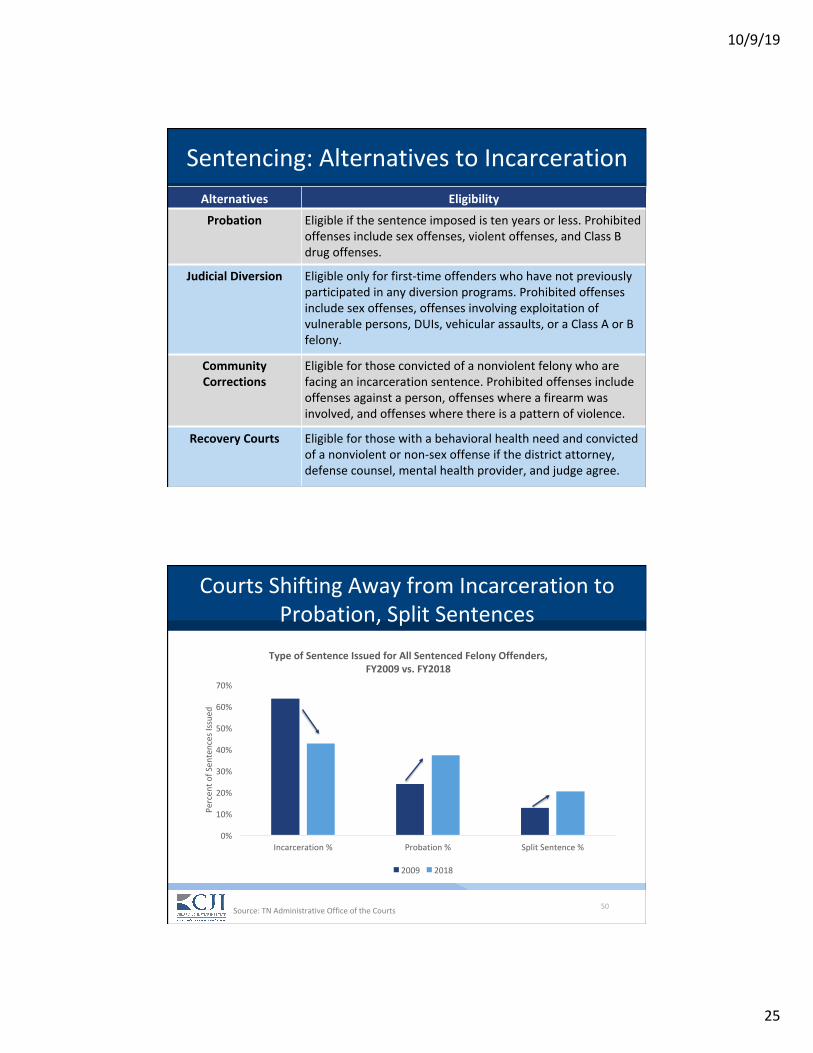
Sentencing:AlternativestoIncarcerationAlternatives Eligibility
Probation Eligibleifthesentenceimposedistenyearsorless.Prohibitedoffensesincludesexoffenses,violentoffenses,andClassBdrugoffenses.
JudicialDiversion Eligibleonlyforfirst-timeoffenderswhohavenotpreviouslyparticipatedinanydiversionprograms.Prohibitedoffensesincludesexoffenses,offensesinvolvingexploitationofvulnerablepersons,DUIs,vehicularassaults,oraClassAorBfelony.
CommunityCorrections
Eligibleforthoseconvictedofanonviolentfelonywhoarefacinganincarcerationsentence.Prohibitedoffensesincludeoffensesagainstaperson,offenseswhereafirearmwasinvolved,andoffenseswherethereisapatternofviolence.
RecoveryCourts Eligibleforthosewithabehavioralhealthneedandconvictedofanonviolentornon-sexoffenseifthedistrictattorney,defensecounsel,mentalhealthprovider,andjudgeagree.
50
CourtsShiftingAwayfromIncarcerationtoProbation,SplitSentences
0%
10%
20%
30%
40%
50%
60%
70%
Incarceration% Probation% SplitSentence%
Percen
tofSen
tencesIssued
TypeofSentenceIssuedforAllSentencedFelonyOffenders,FY2009vs.FY2018
2009 2018
Source:TNAdministrativeOfficeoftheCourts
10/9/19
26
51
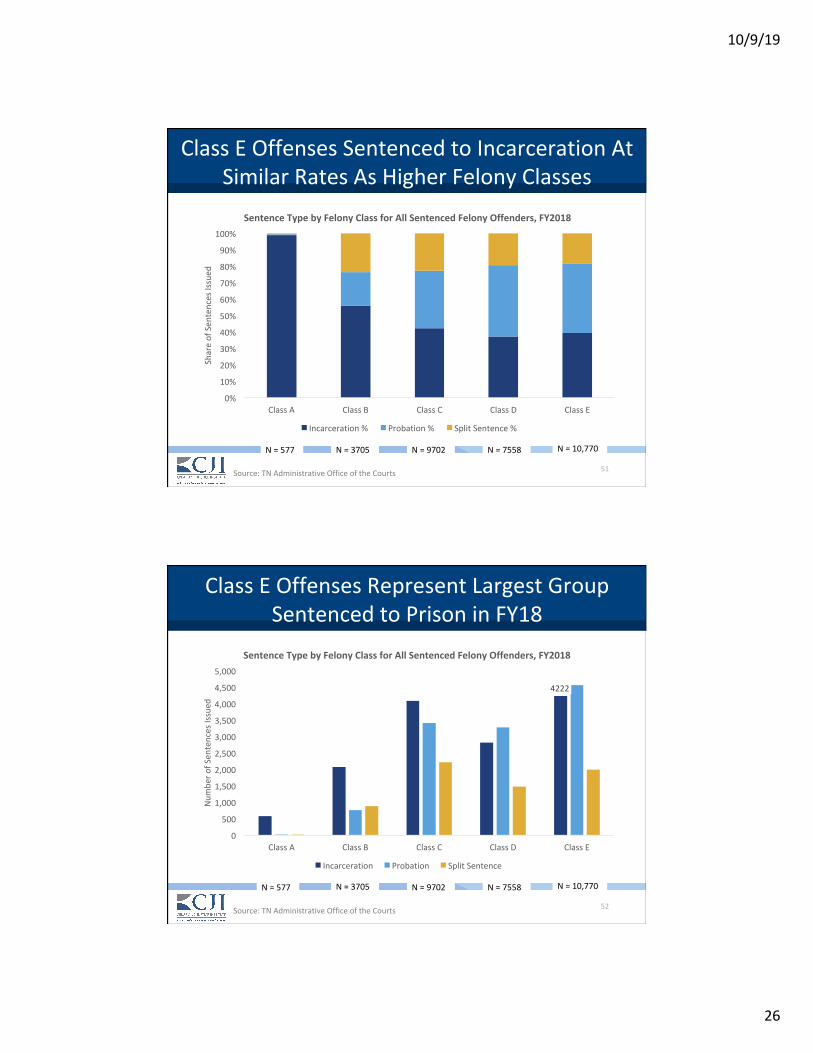
ClassEOffensesSentencedtoIncarcerationAtSimilarRatesAsHigherFelonyClasses
0%
10%
20%
30%
40%
50%
60%
70%
80%
90%
100%
ClassA ClassB ClassC ClassD ClassE
ShareofSen
tencesIssued
SentenceTypebyFelonyClassforAllSentencedFelonyOffenders,FY2018
Incarceration% Probation% SplitSentence%
N=577 N=3705 N=9702 N=7558 N=10,770
Source:TNAdministrativeOfficeoftheCourts
52
ClassEOffensesRepresentLargestGroupSentencedtoPrisoninFY18
N=577 N=3705 N=9702 N=7558 N=10,770
4222
0
500
1,000
1,500
2,000
2,500
3,000
3,500
4,000
4,500
5,000
ClassA ClassB ClassC ClassD ClassE
Num
bero
fSen
tencesIssued
SentenceTypebyFelonyClassforAllSentencedFelonyOffenders,FY2018
Incarceration Probation SplitSentence
Source:TNAdministrativeOfficeoftheCourts
10/9/19
27
53
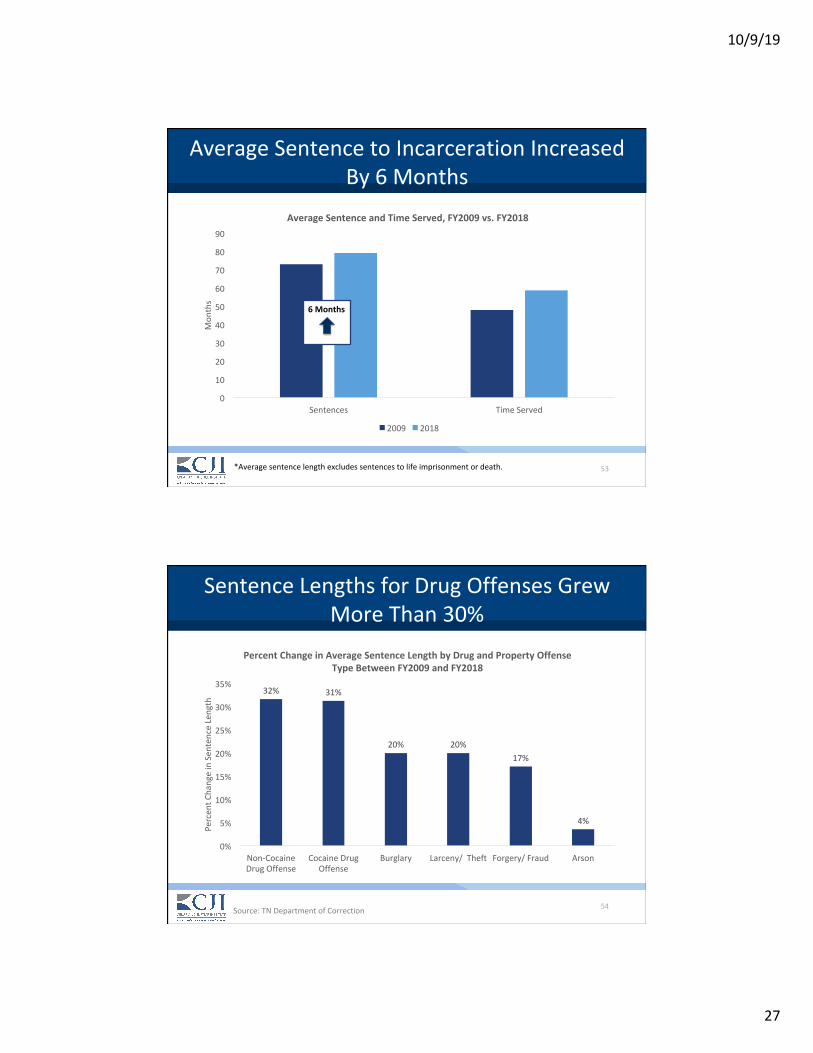
AverageSentencetoIncarcerationIncreasedBy6Months
0
10
20
30
40
50
60
70
80
90
Sentences TimeServed
Mon
ths
AverageSentenceandTimeServed,FY2009vs.FY2018
2009 2018
6Months
*Averagesentencelengthexcludessentencestolifeimprisonmentordeath.
54
SentenceLengthsforDrugOffensesGrewMoreThan30%
32% 31%
20% 20%17%
4%
0%
5%
10%
15%
20%
25%
30%
35%
Non-CocaineDrugOffense
CocaineDrugOffense
Burglary Larceny/Theft Forgery/Fraud Arson
Percen
tChangeinSen
tenceLength
PercentChangeinAverageSentenceLengthbyDrugandPropertyOffenseTypeBetweenFY2009andFY2018
Source:TNDepartmentofCorrection
10/9/19
28
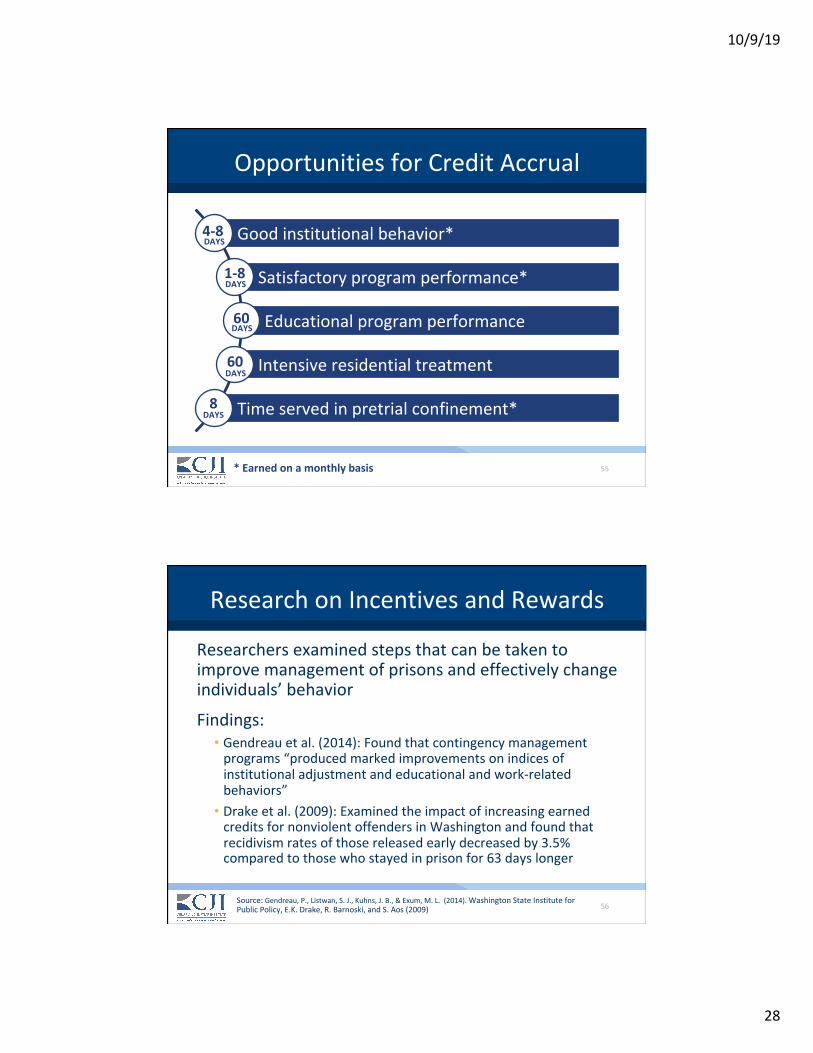
55
OpportunitiesforCreditAccrual
Goodinstitutionalbehavior*
Satisfactoryprogramperformance*
Educationalprogramperformance
Intensiveresidentialtreatment
Timeservedinpretrialconfinement*DAYS
4-8
1-8
60
60
8
DAYS
DAYS
DAYS
DAYS
*Earnedonamonthlybasis
56
ResearchonIncentivesandRewards
Researchersexaminedstepsthatcanbetakentoimprovemanagementofprisonsandeffectivelychangeindividuals’behavior
Findings:• Gendreauetal.(2014):Foundthatcontingencymanagementprograms“producedmarkedimprovementsonindicesofinstitutionaladjustmentandeducationalandwork-relatedbehaviors”• Drakeetal.(2009):ExaminedtheimpactofincreasingearnedcreditsfornonviolentoffendersinWashingtonandfoundthatrecidivismratesofthosereleasedearlydecreasedby3.5%comparedtothosewhostayedinprisonfor63dayslonger
Source:Gendreau,P.,Listwan,S.J.,Kuhns,J.B.,&Exum,M.L.(2014).WashingtonStateInstituteforPublicPolicy,E.K.Drake,R.Barnoski,andS.Aos(2009)
10/9/19
29
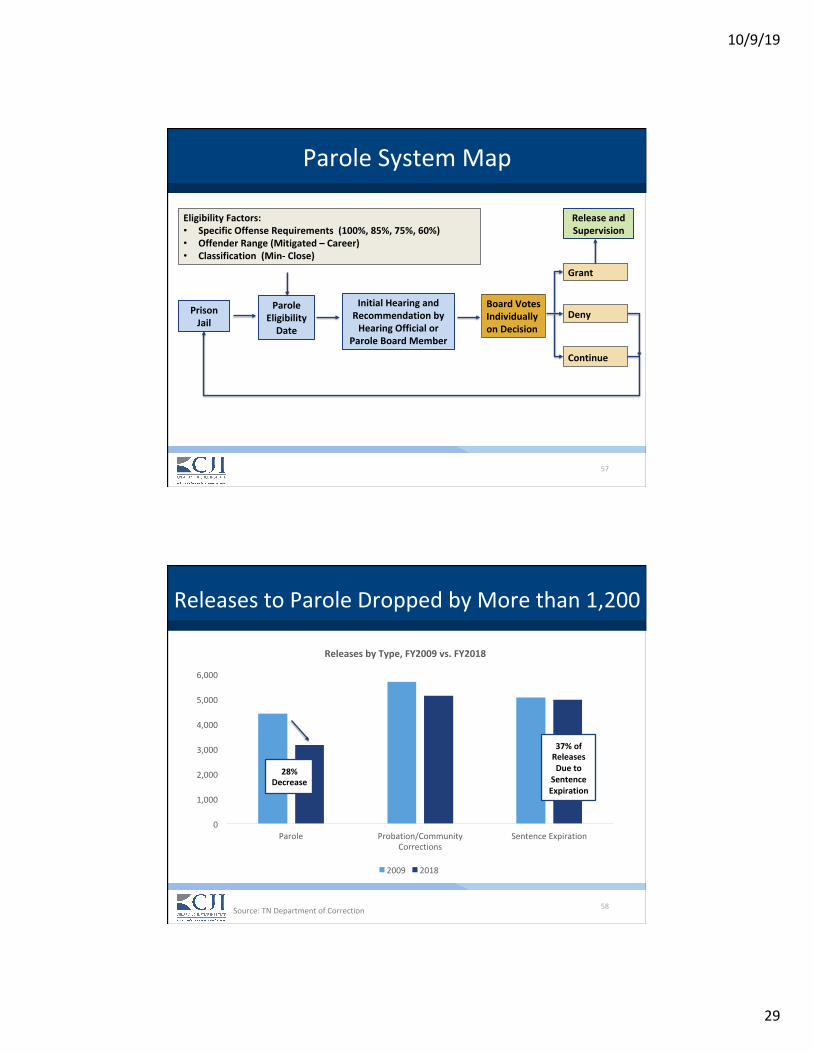
57
ParoleSystemMap
PrisonJail
InitialHearingandRecommendationbyHearingOfficialor
ParoleBoardMember
ReleaseandSupervision
BoardVotesIndividuallyonDecision
ParoleEligibilityDate
EligibilityFactors:• SpecificOffenseRequirements(100%,85%,75%,60%)• OffenderRange(Mitigated–Career)• Classification(Min-Close)
Grant
Deny
Continue
58
ReleasestoParoleDroppedbyMorethan1,200
0
1,000
2,000
3,000
4,000
5,000
6,000
Parole Probation/CommunityCorrections
SentenceExpiration
ReleasesbyType,FY2009vs.FY2018
2009 2018
28%Decrease
Source:TNDepartmentofCorrection
37%ofReleasesDueto
SentenceExpiration

10/9/19
30
59
24%ofParoleHearingsGrantedParole
33%
29%
23% 24% 24%
0%
5%
10%
15%
20%
25%
30%
35%
0
500
1,000
1,500
2,000
2,500
3,000
3,500
4,000
4,500
5,000
2015 2016 2017 2018 2019
CasesGrantedParoleandGrantRate,FY2015-FY2019
CasesGrantedParole GrantRate
Source:TNBoardofParole
60
ParoleGrantsatInitialHearingDeclinedBy59%inFiveYears
25%
16%
10%9% 10%
0%
5%
10%
15%
20%
25%
30%
2015 2016 2017 2018 2019
GrantRatesatInitialParoleHearings,FY2015-FY2019
Source:TNBoardofParole

10/9/19
31
61
KeyTakeaways
• Longersentencesanddecliningparolegrantsaredrivingtheincreasesintimeserved• Averagesentencesincreasedby6monthsin10yearsandsentencesfordrugoffensesgrewbyover30%• Releasestoparoledeclinedbymorethan1,200in10years,andgrantratesatinitialparolehearingsdroppedto10%inFY2019
• Thelowestlevelfelonyclassisthelargestgroupsentencedtoincarcerationcomparedtomoreseriousclassesofoffenders
CustodyPopulation
10/9/19
32
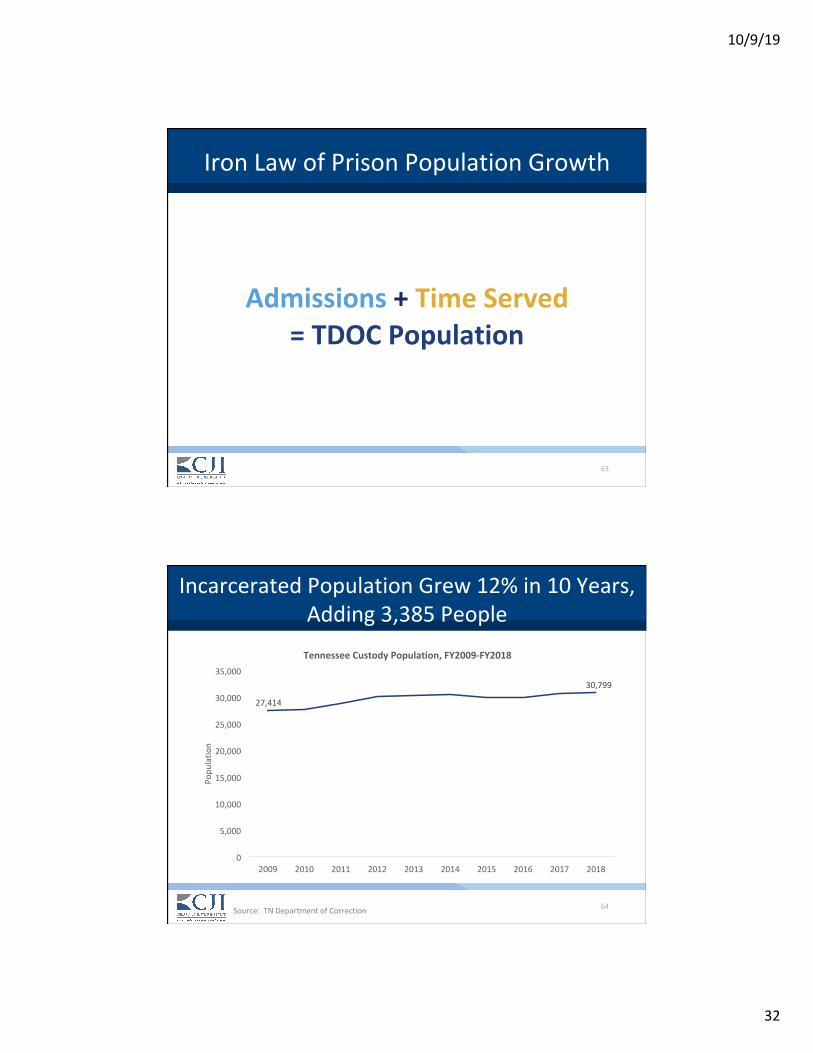
63
IronLawofPrisonPopulationGrowth
Admissions+TimeServed=TDOCPopulation
64
IncarceratedPopulationGrew12%in10Years,Adding3,385People
27,414
30,799
0
5,000
10,000
15,000
20,000
25,000
30,000
35,000
2009 2010 2011 2012 2013 2014 2015 2016 2017 2018
Popu
latio
n
TennesseeCustodyPopulation,FY2009-FY2018
Source:TNDepartmentofCorrection
10/9/19
33
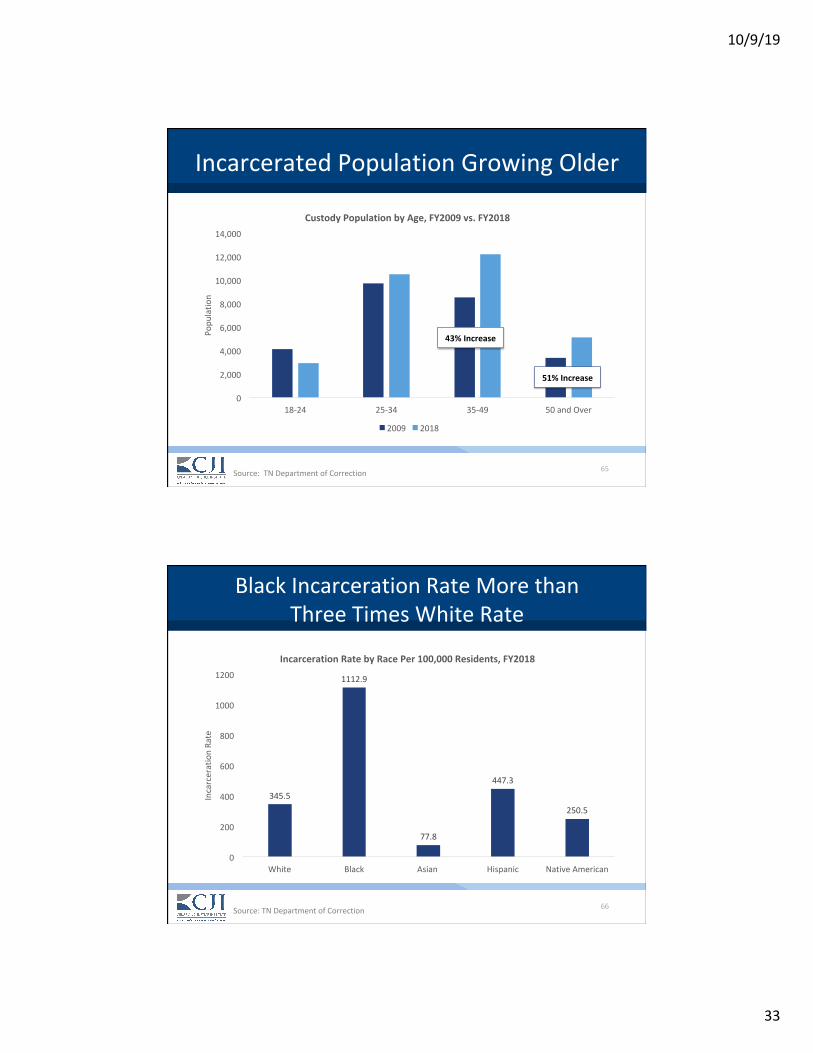
65
IncarceratedPopulationGrowingOlder
0
2,000
4,000
6,000
8,000
10,000
12,000
14,000
18-24 25-34 35-49 50andOver
Popu
latio
nCustodyPopulationbyAge,FY2009vs.FY2018
2009 2018
43%Increase
51%Increase
Source:TNDepartmentofCorrection
66
BlackIncarcerationRateMorethanThreeTimesWhiteRate
Source:TNDepartmentofCorrection
345.5
1112.9
77.8
447.3
250.5
0
200
400
600
800
1000
1200
White Black Asian Hispanic NativeAmerican
IncarcerationRa
te
IncarcerationRatebyRacePer100,000Residents,FY2018
10/9/19
34
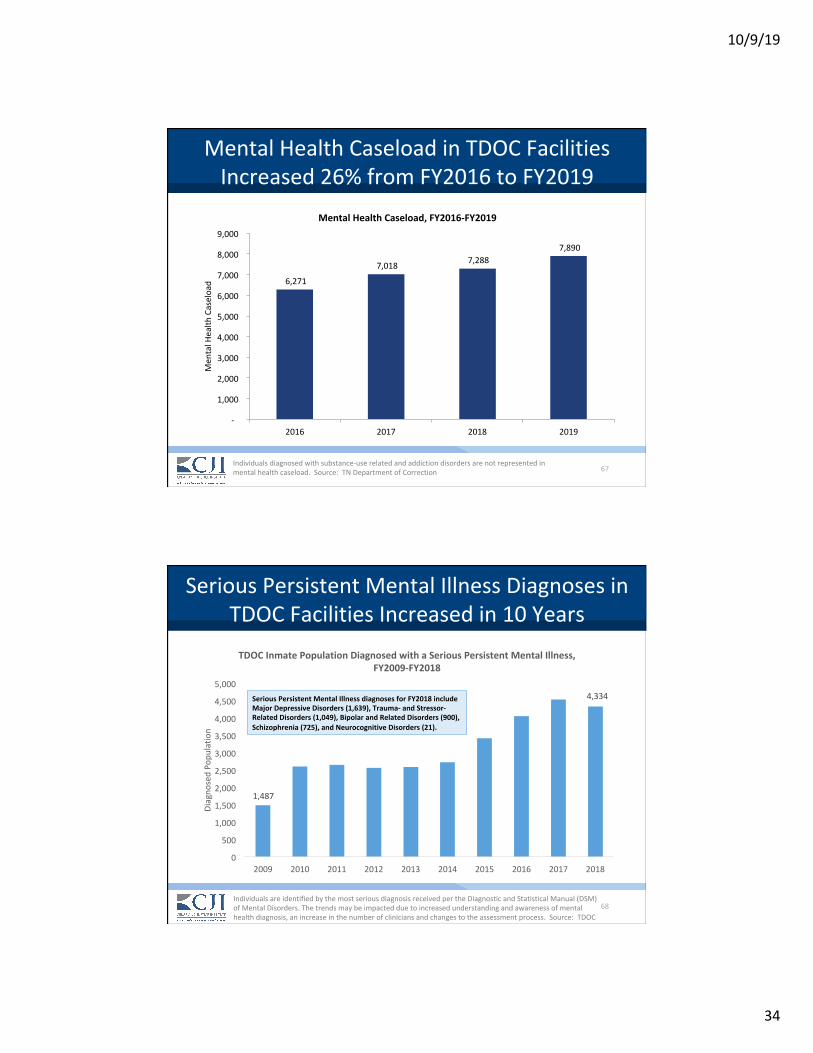
67
MentalHealthCaseloadinTDOCFacilitiesIncreased26%fromFY2016toFY2019
Individualsdiagnosedwithsubstance-userelatedandaddictiondisordersarenotrepresentedinmentalhealthcaseload.Source:TNDepartmentofCorrection
6,271
7,018 7,2887,890
-
1,000
2,000
3,000
4,000
5,000
6,000
7,000
8,000
9,000
2016 2017 2018 2019
Men
talH
ealth
Caseload
MentalHealthCaseload,FY2016-FY2019
68
SeriousPersistentMentalIllnessDiagnosesinTDOCFacilitiesIncreasedin10Years
1,487
4,334
0
500
1,000
1,500
2,000
2,500
3,000
3,500
4,000
4,500
5,000
2009 2010 2011 2012 2013 2014 2015 2016 2017 2018
Diagno
sedPo
pulatio
n
TDOCInmatePopulationDiagnosedwithaSeriousPersistentMentalIllness,FY2009-FY2018
IndividualsareidentifiedbythemostseriousdiagnosisreceivedpertheDiagnosticandStatisticalManual(DSM)ofMentalDisorders.Thetrendsmaybeimpactedduetoincreasedunderstandingandawarenessofmentalhealthdiagnosis,anincreaseinthenumberofcliniciansandchangestotheassessmentprocess.Source:TDOC
SeriousPersistentMentalIllnessdiagnosesforFY2018includeMajorDepressiveDisorders(1,639),Trauma-andStressor-RelatedDisorders(1,049),BipolarandRelatedDisorders(900),Schizophrenia(725),andNeurocognitiveDisorders(21).
10/9/19
35
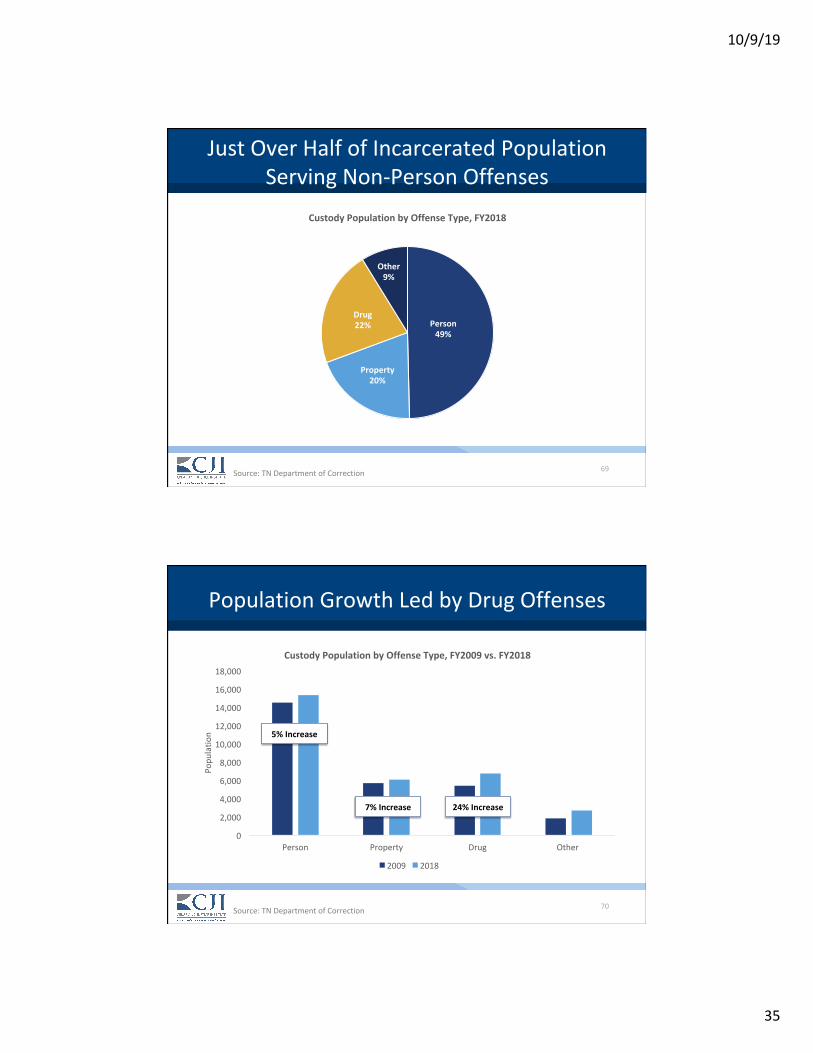
69
JustOverHalfofIncarceratedPopulationServingNon-PersonOffenses
Source:TNDepartmentofCorrection
Person49%
Property20%
Drug22%
Other9%
CustodyPopulationbyOffenseType,FY2018
70
PopulationGrowthLedbyDrugOffenses
Source:TNDepartmentofCorrection
0
2,000
4,000
6,000
8,000
10,000
12,000
14,000
16,000
18,000
Person Property Drug Other
Popu
latio
n
CustodyPopulationbyOffenseType,FY2009vs.FY2018
2009 2018
24%Increase7%Increase
5%Increase
10/9/19
36
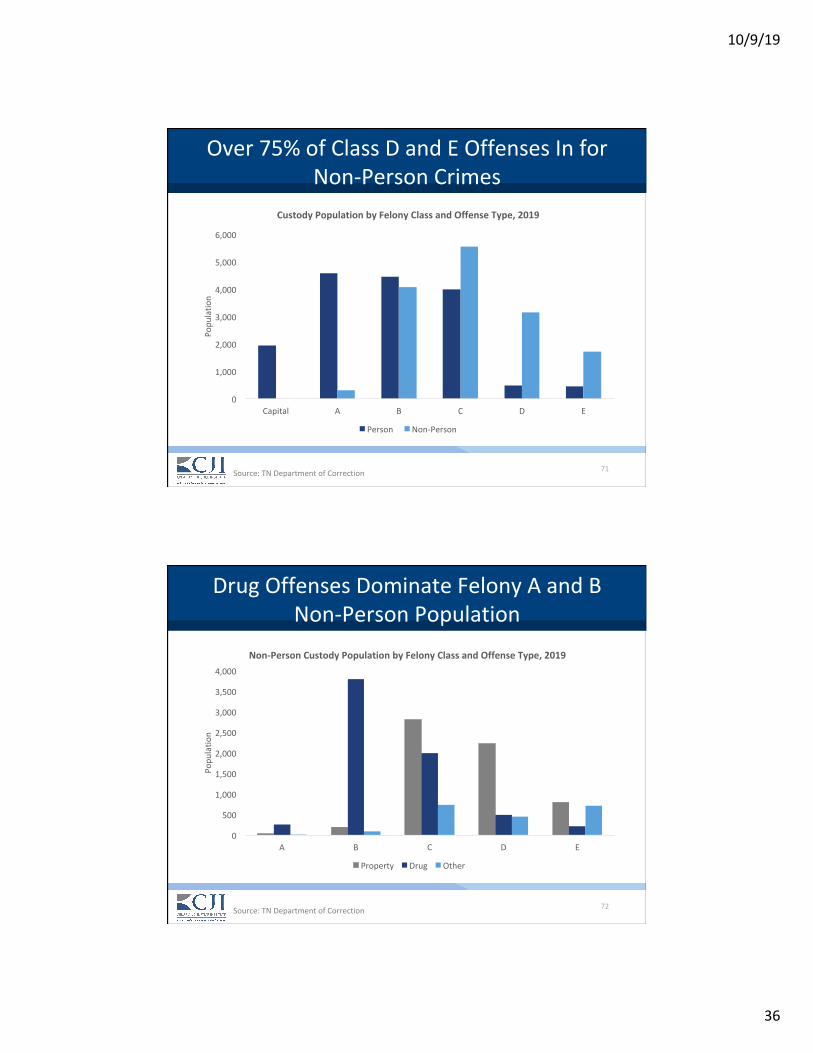
71
Over75%ofClassDandEOffensesInforNon-PersonCrimes
0
1,000
2,000
3,000
4,000
5,000
6,000
Capital A B C D E
Popu
latio
nCustodyPopulationbyFelonyClassandOffenseType,2019
Person Non-Person
Source:TNDepartmentofCorrection
72
DrugOffensesDominateFelonyAandBNon-PersonPopulation
0
500
1,000
1,500
2,000
2,500
3,000
3,500
4,000
A B C D E
Popu
latio
n
Non-PersonCustodyPopulationbyFelonyClassandOffenseType,2019
Property Drug Other
Source:TNDepartmentofCorrection

10/9/19
37
73
MajorityofCustodyPopulationfromEastareNon-PersonOffenses
0
1,000
2,000
3,000
4,000
5,000
6,000
7,000
West Middle East
Popu
latio
nCustodyPopulationbyRegionandOffenseType,2019
Person Non-Person
Source:TNDepartmentofCorrection
74
EastLeadsStateinIncarceratingPropertyOffenders,WestinPersonOffenders
0
1,000
2,000
3,000
4,000
5,000
6,000
Person Property Drug Other
Popu
latio
n
CustodyPopulationbyRegionandOffenseType,2019
West Middle East
WEST
MIDDL
E
EAST
Source:TNDepartmentofCorrection
10/9/19
38
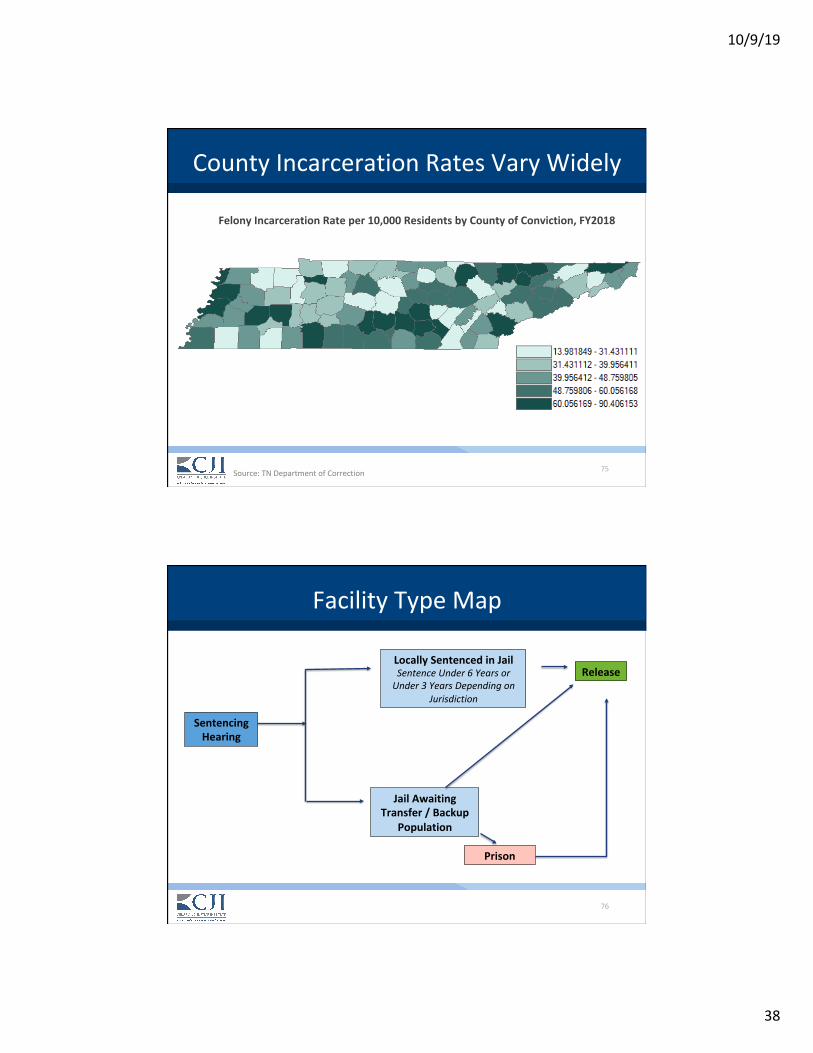
75
CountyIncarcerationRatesVaryWidely
FelonyIncarcerationRateper10,000ResidentsbyCountyofConviction,FY2018
Source:TNDepartmentofCorrection
76
FacilityTypeMap
SentencingHearing
LocallySentencedinJailSentenceUnder6YearsorUnder3YearsDependingon
Jurisdiction
JailAwaitingTransfer/Backup
Population
Prison
Release

10/9/19
39
77
1in4FelonyOffendersareHeldinJails
Source:TNDepartmentofCorrection
TDOC72%
Backup19%
LocallySentenced
[PERCENTAGE]
CustodyPopulationbyFacility,FY2018
78
FelonyInmatePopulationHasGrowninBothStatePrisonsandLocalJails
0
5,000
10,000
15,000
20,000
25,000
30,000
35,000
2009 2018
Popu
latio
n
CustodyPopulationbyFacilityHeld,FY2009-FY2018
Jail
Prison
6%Increase
15%Increase
Source:TNDepartmentofCorrection

10/9/19
40
79
Back-upJailPopulationRisesWhileLocallySentencedPopulationDeclines
Source:NDepartmentofCorrection
5958
2603
0
1,000
2,000
3,000
4,000
5,000
6,000
7,000
2009 2010 2011 2012 2013 2014 2015 2016 2017 2018
Popu
latio
nCustodyPopulationinLocalFacilities,FY2009-FY2018
Backup LocallySentenced
80
JailCapacityIssuesMorePrevalentinMiddleandEastTennessee
Note:Availablebedsandpopulationcountsforcountieswithmultiplefacilitieshavebeencombinedforanalysis.
JailPopulationasPercentofCountyJailCapacity,FY2018
Source:TNDepartmentofCorrection

10/9/19
41
81
ResearchonFacilityTypeandRecidivism
Researchershaveevaluatedhowtheplaceofincarcerationrelatestorecidivisminthecontextofprogrammingopportunities
Findings:• Christensen(2008)noted,“Giventherealityofshorter,uncertainincarcerationperiods,theopportunityforimmersionwithincomprehensiveprogrammaticinitiativeswithinjailsisrelativelyshort”• Duwe(2017)concludedthat“whatistrulyimportantforrecidivismoutcomesisprovidingprisonerswithaccesstoeffectiveprogramming”
Source:Christensen(2008);Duwe(2017)
82
RecidivismRatesHigherforThoseReleasedfromJail
50.9%
40.6%
0%
10%
20%
30%
40%
50%
60%
Jail Prison
Recidivism
Rate
36-MonthRecidivismRateforFelonyOffendersReleasedinFY2014
Source:TNDepartmentofCorrection

10/9/19
42
83
KeyTakeaways
• Increasinglengthsofstayhavedriventhecustodypopulationtogrow12%• Growingnumberofnon-personoffenders,ledbydrugoffenders,responsibleforcustodypopulationgrowth• Morethan75%oflow-levelfelonyoffensesarenon-person
• Nearlyhalfofthepopulationheldinstateprisonshasamentalhealthdiagnosis• Substance-relatedandaddictiondisordersmorethandoubled,andseriouspersistentmentalillnesscasestripled
• Asignificantnumberofstateinmatesareinlocaljails,manyofwhichareovercapacity
FemalePopulation
10/9/19
43
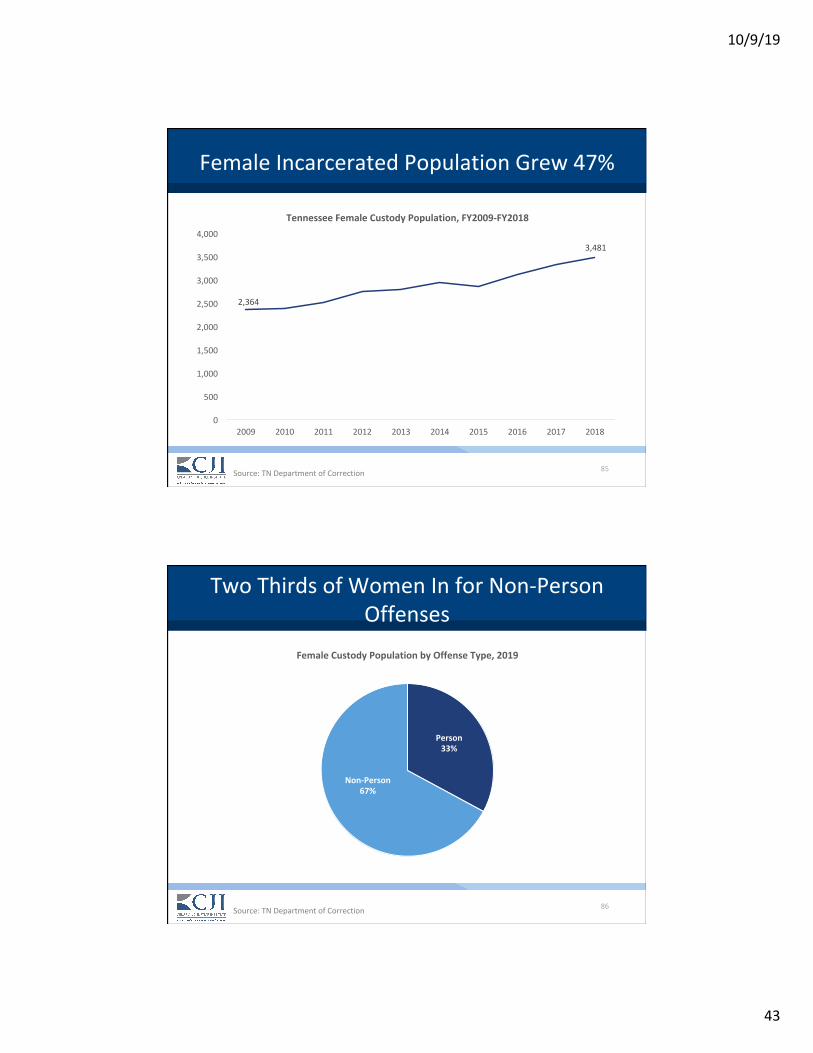
85
FemaleIncarceratedPopulationGrew47%
2,364
3,481
0
500
1,000
1,500
2,000
2,500
3,000
3,500
4,000
2009 2010 2011 2012 2013 2014 2015 2016 2017 2018
TennesseeFemaleCustodyPopulation,FY2009-FY2018
Source:TNDepartmentofCorrection
86
TwoThirdsofWomenInforNon-PersonOffenses
Person33%
Non-Person67%
FemaleCustodyPopulationbyOffenseType,2019
Source:TNDepartmentofCorrection

10/9/19
44
87
Over75%ofFemaleC,D,andEPopulationInforNon-PersonOffenses
0
100
200
300
400
500
600
700
800
900
1000
Capital A B C D E
Popu
latio
nFemaleCustodyPopulationbyFelonyClassandOffenseType,2019
Person Non-Person
Source:TNDepartmentofCorrection
88
DrugOffensesDominateFemaleNon-PersonOffensePopulation
0
100
200
300
400
500
600
A B C D E
Popu
latio
n
FemaleFelonyPopulationbyFelonyClassandOffenseType,2019
Property Drug Other
Source:TNDepartmentofCorrection
10/9/19
45
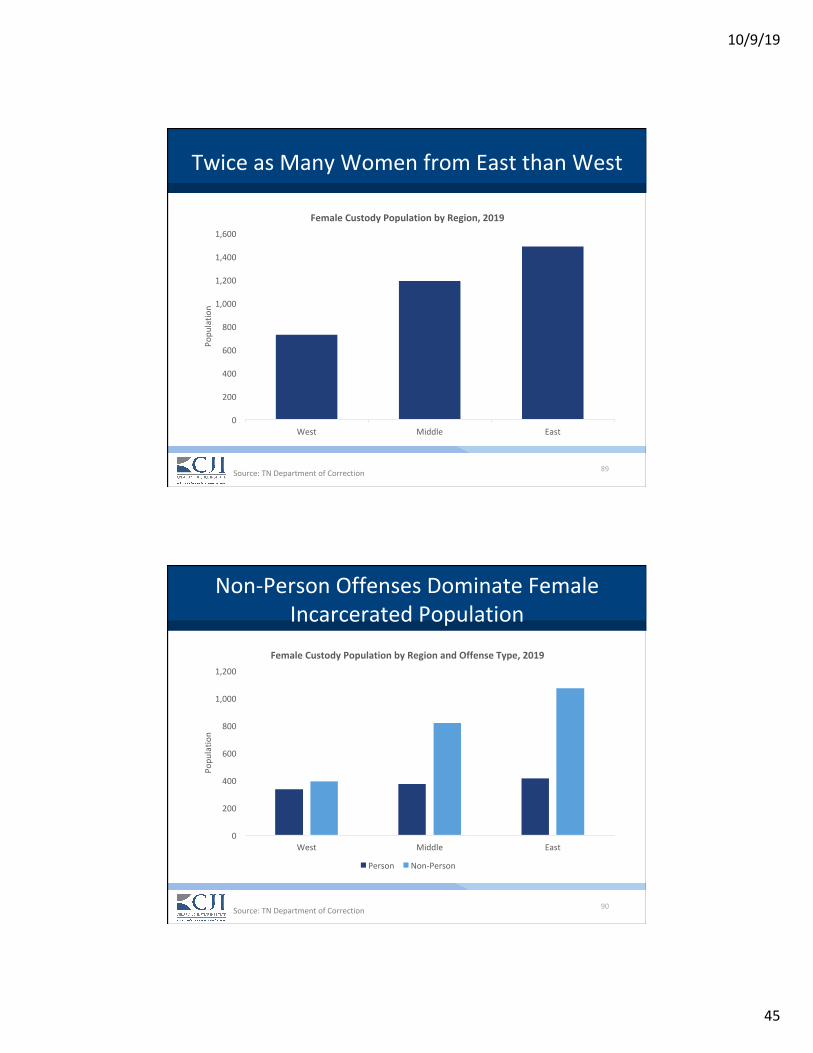
89
TwiceasManyWomenfromEastthanWest
0
200
400
600
800
1,000
1,200
1,400
1,600
West Middle East
Popu
latio
nFemaleCustodyPopulationbyRegion,2019
Source:TNDepartmentofCorrection
90
Non-PersonOffensesDominateFemaleIncarceratedPopulation
0
200
400
600
800
1,000
1,200
West Middle East
Popu
latio
n
FemaleCustodyPopulationbyRegionandOffenseType,2019
Person Non-Person
Source:TNDepartmentofCorrection
10/9/19
46
91
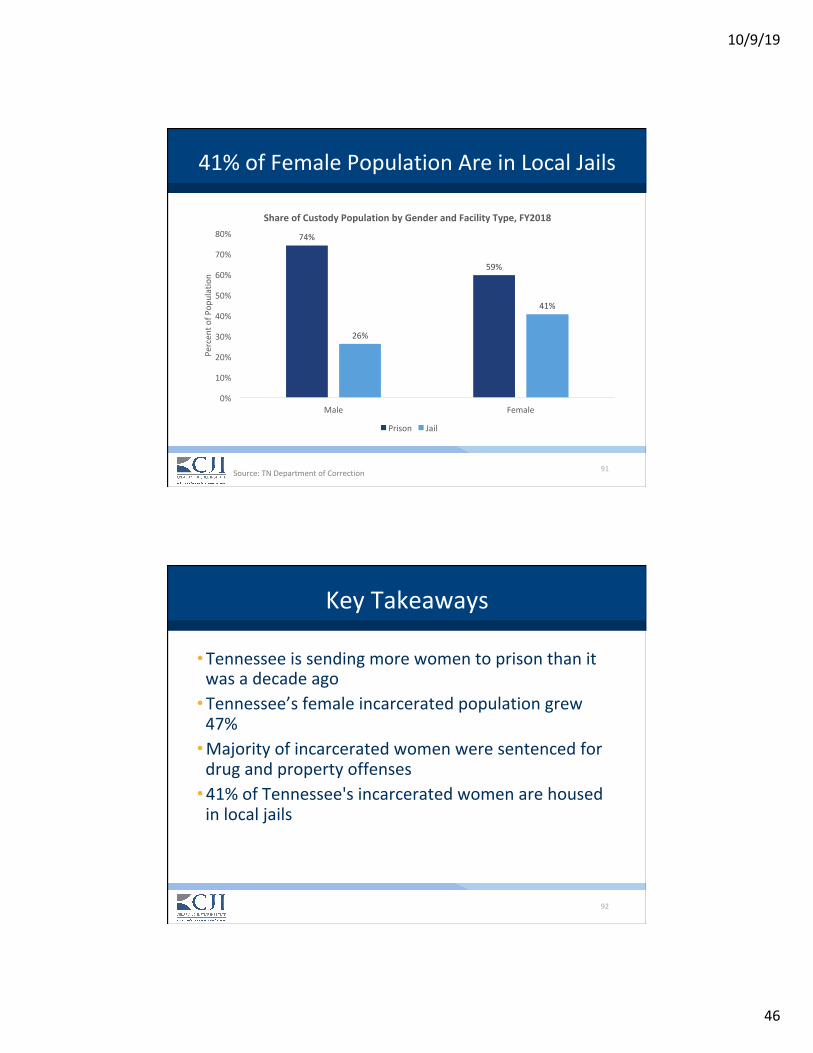
41%ofFemalePopulationAreinLocalJails
74%
59%
26%
41%
0%
10%
20%
30%
40%
50%
60%
70%
80%
Male Female
Percen
tofP
opulation
ShareofCustodyPopulationbyGenderandFacilityType,FY2018
Prison Jail
Source:TNDepartmentofCorrection
92
KeyTakeaways
• Tennesseeissendingmorewomentoprisonthanitwasadecadeago• Tennessee’sfemaleincarceratedpopulationgrew47%• Majorityofincarceratedwomenweresentencedfordrugandpropertyoffenses• 41%ofTennessee'sincarceratedwomenarehousedinlocaljails

10/9/19
47
CommunitySupervision
94
SupervisionRevocationMap
Felony,ClassAMisdemeanororZeroToleranceViolation
SanctionsEligibleViolation
GraduatedSanctionsMatrix
RevocationHearing
RevocationandIncarceration
RevocationandReinstatement
RevocationandSentencingAlternative
NoRevocationReinstatement
TDOCTechnicalViolatorProgram
ContinueSupervision
CommunitySupervision
PrisonorJail
Continuance
10/9/19
48
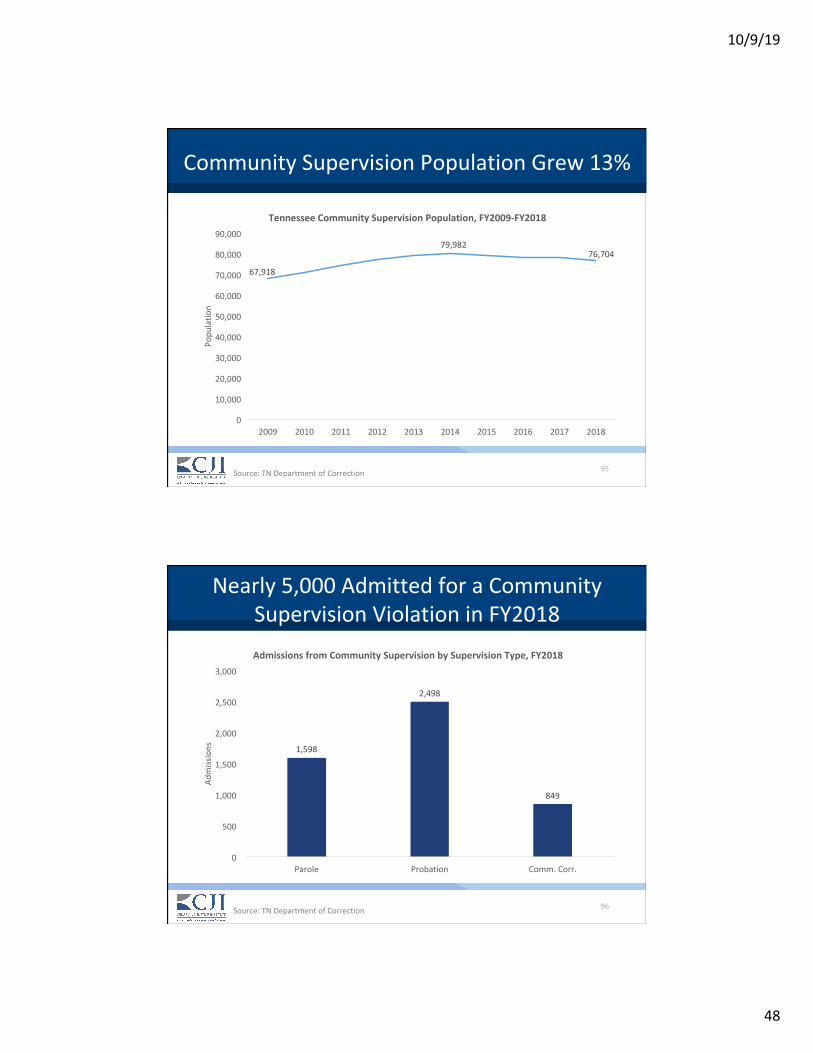
95
CommunitySupervisionPopulationGrew13%
67,918
79,98276,704
0
10,000
20,000
30,000
40,000
50,000
60,000
70,000
80,000
90,000
2009 2010 2011 2012 2013 2014 2015 2016 2017 2018
Popu
latio
nTennesseeCommunitySupervisionPopulation,FY2009-FY2018
Source:TNDepartmentofCorrection
96
Nearly5,000AdmittedforaCommunitySupervisionViolationinFY2018
1,598
2,498
849
0
500
1,000
1,500
2,000
2,500
3,000
Parole Probation Comm.Corr.
Admissions
AdmissionsfromCommunitySupervisionbySupervisionType,FY2018
Source:TNDepartmentofCorrection

10/9/19
49
97
Morethan50%ofRevocationsforTechnicalViolations
0
500
1,000
1,500
2,000
2,500
3,000
Parole Probation CommunityCorrections
Revocatio
ns
RevocationsbyCauseandSupervisionType,FY2018
TechnicalRevocations NewCharges
Source:TNDepartmentofCorrection
98
TechnicalViolationsMakeUpGrowingShareofRevocations
40%
51%
24%
33%
66%71%
0%
10%
20%
30%
40%
50%
60%
70%
80%
2014 2015 2016 2017 2018
Percen
tofR
evocations
TechnicalRevocationsasPercentofAllRevocations,FY2014-FY2018
CommunityCorrections
Probation
Parole
Source:TNDepartmentofCorrection

10/9/19
50
99
RecidivismReductionPrinciplesforCommunitySupervision
Source:Sperber,Kimberly&Latessa,Edward&Makarios,Matthew.(2013);Kennedy(2006);Nagin&Pogarsky(2001).
Researchershaveexaminedwhatpracticesaremostsuccessfulatchangingindividuals’behaviorandreducingrecidivismoncommunitysupervision
Findings:• Risk,Need,Responsivity:Focusonhighriskoffenders,targetcriminogenicneeds,addressprogrammingbarriers• Usesanctionsandincentivestorespondtobehavior• Frontloadresourcesforoffenderscomingoutofcustody• Balancesupervisionwithtreatment• Monitorquality,fidelity,andoutcomes
100
Tennessee’sCurrentSupervisionPractices
ResponsivityFactors:Therearenoformalsystemsinplacetoaddressresponsivitybarrierstoprogrammingandtreatmentsuccesses.
Sanctions:Theuseofswift,certain,andproportionatesanctionsisinconsistentthroughoutthestateandopportunitiesremaintoensurethisbestpracticeisappliedmorebroadlyanduniformlyacrossTennessee.Rewards:Thereisalsonoformalstructureinplaceforrewardingpositivebehavioronprobationorparole,includingnowaytoearntimeoffofthesentenceforgoodbehaviororprogramparticipation.
10/9/19
51
101
Tennessee’sCurrentSupervisionPractices
Treatment:Whileprobationandparoleutilizeassessmentstodeterminewhattypesofprogrammingandtreatmentneedsarerequiredforoffenders,accesstotreatmentremainsachallenge,particularlyintheruralareas.
FrontloadResources:Withagrowingpopulationoncommunitysupervision,resourceswithinthefirstdaysandweeksafterreleasearelimited,especiallyforthosereleasedfromjails.
QualityControl:Whilecriminaljusticeagenciescollectawidevarietyofdata,inconsistentdefinitionsacrossagenciesandtimelimitthestate'sabilitytoconductcomprehensiveanalysis.
102
KeyTakeaways
• Communitysupervisionpopulationhasgrown13%inthelastdecadetoover76,700individuals• Communitysupervisionviolatorsmakeup39%offelonyadmissions• Justoverhalfofrevocationslastyearwerefortechnicalviolations• WhileTennesseehasmadegreatstridesinadoptingevidence-basedpracticestoreducerecidivism,accessislimitedacrossthestate

10/9/19
52
Review
104
SummaryofTrends
AdmissionsDown14%
TimeServedUp23%
CustodyPopulationUp12%

10/9/19
53
105
SummaryTakeaways
• Overalladmissionsaredown14%,butadmissionsofwomenandadmissionsfromtheEastaregrowing• 74%ofadmissionsarefornon-personoffenses• Nearly5,000admittedlastyearfromcommunitysupervision
• Timeservedhasgrown11monthsor23%overall• Sentencesincreasedby6monthsin10years• Individualsareserving20monthslongerbeforeparolerelease,and7monthslongerbeforeexpirationofsentence
• Releasestoparoledeclinedbymorethan1,200• Grantrateatinitialparolehearingdeclinedby59%• Just24%ofallparolehearingsresultindecisiontogrant
106
SummaryTakeaways
• Custodypopulationgrew12%in10years,andfemalepopulationincreased47% • Increasingnumbersofnon-personoffenders,especiallydrugoffenders,areresponsibleforgrowth• Twothirdsofwomenareincustodyfornon-personoffenses• Mentalhealthcasesinstateprisonsdoubled
• Regionalvariationintypeofcasesleadingtocustody• TwiceasmanywomenincustodyfromEastthanWest
• Technicalrevocationsplayasignificantrole• Over4,000revocationslastyearfortechnicalviolations

10/9/19
54
107
Questions/Contact
• Contactinformation:MauraMcNamaraPhone:617-529-3654Email:[email protected]:617-733-1437Email:[email protected]
108
Disclaimer
ThisprojectwassupportedbyGrantNo.2015-ZB-BX-K002awardedbytheBureauofJusticeAssistance.TheBureauofJusticeAssistanceisacomponentoftheDepartmentofJustice’sOfficeofJusticePrograms,
whichalsoincludestheBureauofJusticeStatistics,theNationalInstituteofJustice,theOfficeofJuvenileJusticeandDelinquencyPrevention,theOfficeforVictimsofCrime,andtheSMARTOffice.
Pointsofvieworopinionsinthispresentationarethoseoftheauthoranddonotnecessarilyrepresenttheofficialpositionorpoliciesofthe
U.S.DepartmentofJustice.
Top Related