


Languages
Pages
Legal


SWISS POWER IMAGE OF SWISS BRANDS 2018 June 2018
HOW CONSUMERS IN GLOBAL KEY MARKETS PERCEIVE SWISS BRANDS

Agenda
June 13, 2018 Slide 2
Management summary
Research question and survey design
Survey findings
Background of the survey

Management summary (I/II)
June 13, 2018 Slide 3
BRANDS FROM THE FOOD AND WATCH INDUSTRY AS SWISS FLAGSHIPS
Nestlé, Nescafé and Rolex are the top three most recognized Swiss brands, followed with some distance by Lindt and Omega. In general, Swiss brands tend to have a much higher average awareness in their neighbor country Germany (62%) than in China (41%) or the USA (42%).
DESPITE LOWER AWARENESS LEVELS: HIGHER APPRECIATION OF SWISS BRANDS IN CHINA AND THE USA
Rolex, Lindt and Victorinox enjoy the highest reputation among Swiss brands worldwide. Despite their overall higher awareness inGermany, Swiss brands have a lower reputation (average: 38%), compared to China (avg.: 59%) and the USA (avg.: 60%), where they are in fact less known.
FINANCIAL HUB SWITZERLAND
Only brands from the financial sector managed to improve their image slightly in the past two years. The majority of brands dropped in reputation, while Swiss watch makers are particularly affected by this loss in positive image (Rolex: -13%, Omega: -15%, Swatch: -14%).
-OF-ORIGIN IMAGE IS SLOWLY ERODING
-of-origin (COO) image decreased along relevant dimensions, such as quality (-11%), prestige (-9%) and reliability (-8%). It is also perceived as less eco-friendly and innovative now (both -5%) and managed to stay constant only in consumer proximity (-1%).
Management summary (II/II)
June 13, 2018 Slide 4
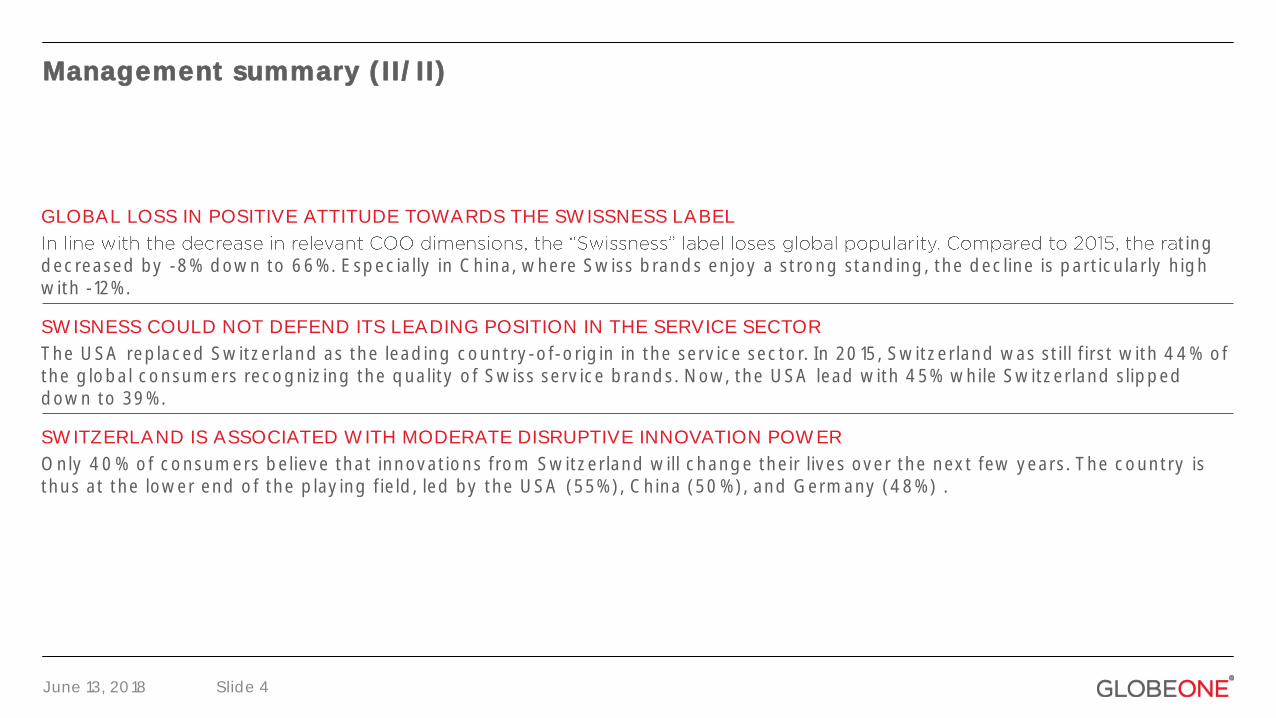
GLOBAL LOSS IN POSITIVE ATTITUDE TOWARDS THE SWISSNESS LABEL
ting decreased by -8% down to 66%. Especially in China, where Swiss brands enjoy a strong standing, the decline is particularly high with -12%.
SWISNESS COULD NOT DEFEND ITS LEADING POSITION IN THE SERVICE SECTOR
The USA replaced Switzerland as the leading country-of-origin in the service sector. In 2015, Switzerland was still first with 44% of the global consumers recognizing the quality of Swiss service brands. Now, the USA lead with 45% while Switzerland slipped down to 39%.
SWITZERLAND IS ASSOCIATED WITH MODERATE DISRUPTIVE INNOVATION POWER
Only 40% of consumers believe that innovations from Switzerland will change their lives over the next few years. The country is thus at the lower end of the playing field, led by the USA (55%), China (50%), and Germany (48%) .

Agenda
June 13, 2018 Slide 5
Management summary
Research question and survey design
Survey findings
Background of the survey

Research question and survey design
June 13, 2018 Slide 6
Method and timing:
• Representative survey of German (n = 500), Chinese (n = 513) and US consumers (n = 506) aged between 18 and 69 years
• Inclusion of the top 19 Swiss brands
• Survey period: end of 2017
Objectives:
• Analysis of the perception of Swiss brands in Germany, China and the USA
• Identification of strengths and weaknesses of Swiss brands
• Monitoring Switzerland -of-origin
Germany China USA
• Berlin
• Dusseldorf
• Frankfurtam Main
• Hamburg
• Cologne
• Leipzig
• Munich
• Stuttgart
• Beijing
• Chengdu
• Chongqing
• Dongguan
• Guangzhou
• Hangzhou
• Shanghai
• Shenzhen
• Tianjin
• Wuhan
• Chicago
• Dallas
• Houston
• Los Angeles
• New York
• Philadelphia
• Phoenix
• San Antonio
• San Diego
• San Jose

Agenda
June 13, 2018 Slide 7
Management summary
Research question and survey design
Survey findings
Background of the survey

Food & watches as flagship: Nestlé, Nescafé & Rolex best known
June 13, 2018 Slide 8
Awareness of top Swiss brands among German, Chinese and US respondents1
88% 88% 87%
65% 62% 60% 58%51% 51%
45%42% 42% 39% 36%
27% 25% 22% 19%
9%
1 Base: 19 pre-selected Swiss brands.Question: Which of the following brands do you know? Please choose all brands that you know. Multiple answers permitted (n = 1519).

Country split: Significantly lower awareness in China and the USA
June 13, 20181 Base: 19 pre-selected Swiss brands.Question: Which of the following brands do you know? Please choose all brands that you know. Multiple answers permitted (n German sample = 500, n Chinese sample = 513, n US sample = 506).
Slide 9
Awareness of top Swiss brands among German, Chinese and US respondents1
97% 96% 96% 97%
62%
80%90%
68%
89%
60%
85% 88% 86%
51%
72%
45%31%
45%
17%
39%
84% 78% 80%
49% 53% 54% 53%42% 48%
38%
Nestlé Nescafé Rolex Lindt Omega Logitech Swatch Roche Ricola Credit Suisse
Germany China USA
48% 48% 52%46%
39%34%
46%
20%
6%
42% 42%
25%38%
20%12% 10%
24%
10%
35% 34% 39%
25% 23%31%
9% 13% 12%
ZurichInsurance
UBS Novartis Swiss Life Schindler Victorinox Emmi Swiss Re Glencore
Average: 61.74% Average: 41.20% Average: 42.09%

Rolex, Lindt and Victorinox enjoy the highest reputation
June 13, 2018 Slide 10
Positive image of top Swiss brands among German, Chinese and US respondents1
1 Base: 19 pre-selected Swiss brands. 2 Base: absolute brand awareness.Question: Which of the brands that you know have a positive image? Multiple answers permitted. Filter: only brands you know (n total sample = 1519).
71% 70%66%
61% 60% 59%56% 55% 55%
51%48% 47% 46% 44% 42% 41% 41% 40%
35%
Base2 1322 992 948 1344 782 549 411293 3271333 585774387 880 631 688905 142635

Only brands from the financial sector improved their image
June 13, 2018 Slide 11
Positive image of top Swiss brands 2015 vs. 2017 among German, Chinese and US respondents1
1 Base: 19 pre-selected Swiss brands.Question: Which of the brands that you know have a positive image? Multiple answers permitted. Filter: only brands you know (n total sample 2015 = 1500, n total sample 2017 = 1519).
71% 70%66%
61% 60% 59%56% 55% 55%
51%48% 47% 46% 44% 42% 41% 41% 40%
35%
-13% -9%
-15%-9%
-5%+4% +4%
-16%
n.a.
n.a.
-18%
+/- 0%
-7%
-14% +3%-5%
n.a.
n.a.n.a.

The positive image of Swiss brands is much stronger in the USA & China
June 13, 20181 Base: 19 pre-selected Swiss brands. 2 Base: Absolute brand awareness.Question: Which of the brands that you know have a positive image? Multiple answers permitted. Filter: only brands you know (n German total sample = 500, n Chinese total sample = 513, n US total sample = 506).
Slide 12
Positive image of top Swiss brands among German, Chinese and US respondents1
21%33%
26%20% 21%
33%23%
40%
7%
69%58%
65% 65%57%
50% 48%37% 40%
60% 59%52%
58%48% 46%
58%
44% 43%
UBS Roche Swiss Life Credit Suisse Swiss Re Schindler Novartis Emmi Glencore
59%74%
67%
48%40%
34%43%
54% 50%
33%
79%
59%
43%
75% 72% 68% 72%
44%
60% 65%77% 76% 75%
58%70%
78%
62% 61% 60% 60%
Rolex Lindt Victorinox Omega Nescafé Nestlé Logitech Ricola Swatch ZurichInsurance
Germany China USA
Average: 38.15% Average: 59.18% Average: 60.29%
480 439 403 483 260 249 169 61 157 312 370 266 482 454 397 484 435 425 402 232 271 443 89 242 451 159 270 240 218 177
239 218 174 339 231 212 228 193 128 298 200 190 196 101 114 259 128 198 228 51 48 52 60102 125 66
Base2
Base 30
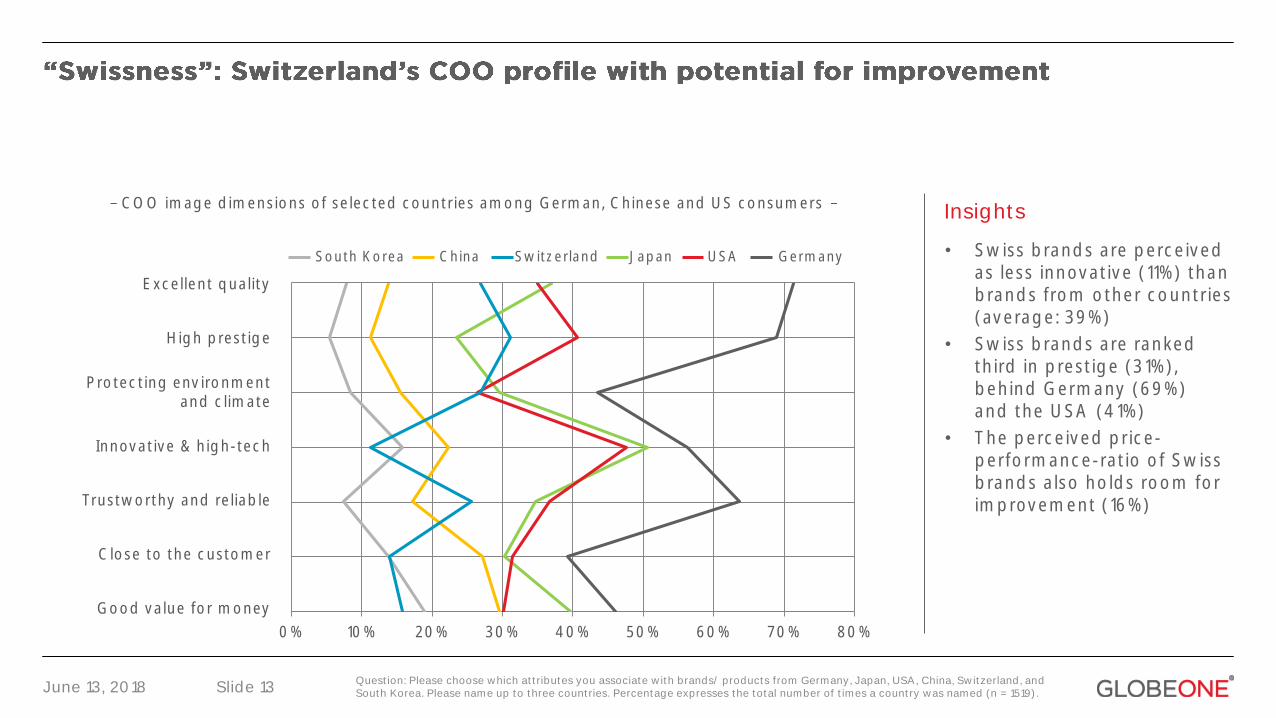
June 13, 2018Question: Please choose which attributes you associate with brands/ products from Germany, Japan, USA, China, Switzerland, and South Korea. Please name up to three countries. Percentage expresses the total number of times a country was named (n = 1519).Slide 13
COO image dimensions of selected countries among German, Chinese and US consumers
• Swiss brands are perceived as less innovative (11%) than brands from other countries (average: 39%)
• Swiss brands are ranked third in prestige (31%), behind Germany (69%) and the USA (41%)
• The perceived price-performance-ratio of Swiss brands also holds room for improvement (16%)
Insights
0% 10% 20% 30% 40% 50% 60% 70% 80%
Germany Japan USA China South Korea Switzerland
Excellent quality
High prestige
Protecting environmentand climate
Innovative & high-tech
Trustworthy and reliable
Close to the customer
Good value for money
South Korea China Switzerland Japan USA Germany

June 13, 2018Question: Please choose which attributes you associate with brands/ products from Germany, Japan, USA, China, Switzerland, and South Korea. Please name up to three countries. Percentage expresses the total number of times a country was named. (n 2015 = 1500, n 2017 = 1519). Filter: Switzerland, USA and Germany.
Slide 14
COO image dimensions of selected countries among German, Chinese and US consumers Insights
0% 10% 20% 30% 40% 50% 60% 70% 80%
Switzerland 2015 Switzerland 2017 USA 2015
USA 2017 Germany 2017 Germany 2015
Switzerland 2017 USA 2017 Germany 2017Switzerland 2015 USA 2015 Germany 2015
•
quality (-11%), prestige (-9%) and reliability (-8%)
• It also dropped by 5% both in eco-friendliness and innovativeness
• The USA improved along most of the dimensions, except eco-friendliness and customer proximity
• No major changes in the COO perception of Germany
Excellent quality
High prestige
Protecting environmentand climate
Innovative & high-tech
Trustworthy and reliable
Close to the customer
Good value for money
-11%
-9%
+3%
+6%
+1%
+3%
-5%
-5%
-8%
-1%
-2%
-2%
+4%
+5%
0%
+2%
+3%
0%
-1%
+2%
+4%

June 13, 2018 Slide 15
Attitude towards Swiss brands 2015 vs. 2017 among US, German and Chinese respondents
Question: In general, do you like Swiss brands? Note: top-two and low-two answers are summarized (n US sample: n 2015 = 500,n 2017 = 506; n German sample: n 2015 = 500, n 2017 = 500; n Chinese sample: n 2015 = 500, n 2017 = 513).
74%
49%
75%
66%
23%
50%
24%
32%
3% 1% 1% 2%
USA Germany China Total
I like Swiss brands/ a lot I do not care I do not like Swiss brands/ at all
-4% +2% +2%
+8% -1%-7%
+12%-12%+/- 0%
-8% +7% +1%

June 13, 2018Question: Which countries are famous for brands/ products in the following categories? Please name up to three countries. Percentage expresses the total number of times a country was named (n = 1519).Slide 16
Leading COOs within selected industries among German, Chinese and US respondents Insights
•
first to second rank in the service sector (44% in 2015 vs. 39% in 2017)
• High recognition of the USA as famous COO across diverse industries
• France continues to lead in the beauty, fashion and food industries
44% 43%46% 43%
41% 39%45%
68%
Switzerland USA
74%68% 66% 65% 65%
58% 55% 54%49% 45% 43% 43% 40%
Co
smeti
cs/
Perf
um
e
Clo
thin
g/
Fash
ion
Inte
rnet
& E
-C
om
merc
e
Au
tom
ob
ile/
Mo
torc
ycle
Mach
inery
Ele
ctr
on
ics
&S
oft
ware
Au
ton
om
ou
s D
rivin
g
Ph
arm
aceu
ticals
Ro
bo
tic/
Ind
ust
ry 4
.0
Serv
ices
Ho
me A
pp
lian
ces
Fo
od
s
Ele
ctr
o M
ob
ilit
y
45%39%
24%
43%40% 38%
70%
36%
USA Switzerland
Total Germany China USA
1st
2nd
2017
2015

Switzerland is associated with a moderate disruptive innovation power
June 13, 2018 Slide 17
Perception of disruptive innovation power of selected countries among German, Chinese and US respondents
he next -two and low-two answers are summarized (n = 1519).
54%
50% 48%46%
44% 44% 43%
34%
24% 25%28%
18%20% 20%
30% 31%
(Strongly) agree (Strongly) disagree
!
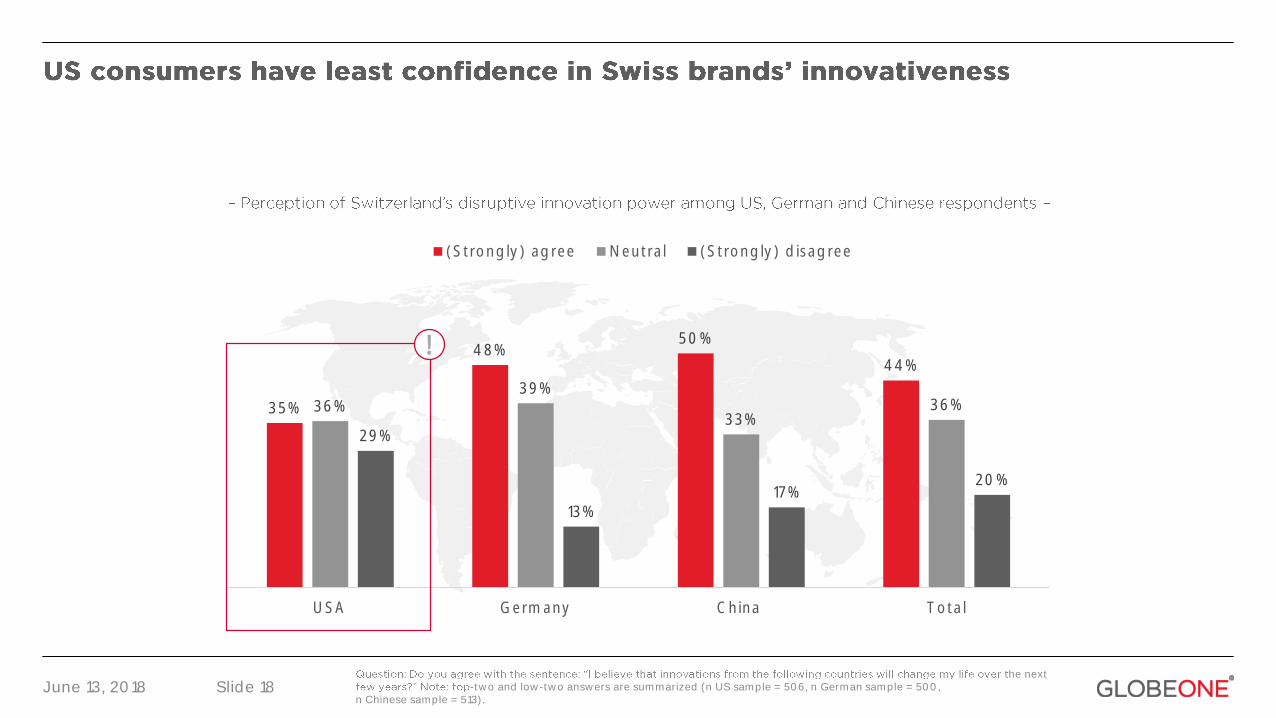
June 13, 2018 Slide 18he next
-two and low-two answers are summarized (n US sample = 506, n German sample = 500, n Chinese sample = 513).
35%
48%50%
44%
36%39%
33%36%
29%
13%17%
20%
USA Germany China Total
(Strongly) agree Neutral (Strongly) disagree
!

Agenda
June 13, 2018 Slide 19
Management summary
Research question and survey design
Survey findings
Background of the survey

Country-of-Origin (COO) as key factor in purchase processes
June 13, 2018Sources: 1 Amine et al. (2005): Executive Insights: Exploring the Practical Effects of Country of Origin; 2 Daniels, J.D./ Radebaugh, L.H. (2002): International Business; 3 White, P.D./ Cundiff, E.W. (1978): Assessing the quality of industrial products; 4 Schaffmeister, N. (2015): Brand Building and Marketing in Key Emerging Markets
Slide 20
-of-Origin effect is one of the most analyzed phenomena in consumer behavior in international 1
COO High interest
-of-Origin is defined as the country where corporate headquarters of the company marketing the product or brand are located. This does not require local
2
customers associate positive or negative attributes with a company, product or brand if they know it originates from a certain 3
"The COO can be divided into Country of Manufacture (COM) and Country of Design (COD). The COM identifies the place where the product is made or
4
Country-of-Origin Definitions

COO influences the way consumer perceive a company, product or brand
June 13, 2018 Slide 21
Perceived COO examplesGeneral relevance of a positive COO image
country and relates to its past and present economic, political, technological, and socio- cultural situation
COO image is usually stable in nature, but can change due to, i.e.: public policy in - campaigns that especially appeal to politically
conservative and patriotic buyers
Factors forming COO image
A positive COO image can:
• Increase perceived quality and prestige of a brand
•
• Has potential for increasing brand performance dependent on industry and product category

About Globeone
June 13, 2018
Globeone is a management consultancy specialized in strategy, brand, and communications. We are
-pilots. We empower people and businesses. Day by day.
Slide 22

About Globeone
June 13, 2018
Co-pilots for our clients
We work in long-term, productive relationships. We listen and
learn, give direction and create individual solutions and services
that fit to their global and local needs.
Informed Decisions
We turn complexity into clarity through an analytic and data-
driven approach. This enables top-executives to take smarter
network agency and focus only on what needs to be done.
Actionable Strategies
We work with you. We are strategic thinkers with an
implementation mindset and skills. We boost efficiency,
accelerate processes, drive progress and connect the dots across
global markets. Together, we get things done.
Slide 23

Contact
June 13, 2018 Slide 24
GLOBEONE AG
Zurich Office
Löwenstrasse 3
8001 Zurich
Switzerland
T +41 (0) 44 552 44 77
Kamala Schmidt-Holzmann HettichStrategy Director
Carina HauswaldManaging Partner
Bert GorenStrategy Director

Copyright & disclaimer
© Copyright & disclaimer
This document of globeone GmbH or its network office remains exclusive property of Globeone GmbH or its network office until the rights of use are expressly transferred. Any revision, duplication or commercial distribution of this work is permitted only with the written consent of Globeone GmbH or its network office. This document is a discussion paper. It makes use of market & consumer research, secondary information and hypotheses and is therefore for discussion only. It does not include any recommendations or binding statements.
June 13, 2018 Slide 25

Top Related