


Languages
Pages
Legal

Abstract
The objective of this thesis is to contribute to the understanding of drivers of customer
loyalty by exploring the dynamics of customer‐brand relationships and the role they play for
the creation and management of customer loyalty in the airline industry.
The particular relevance of the research objective arises from the intensification of
competition in the airline industry and the extensive consolidation that is expected to
accompany it. These market challenges make the retention of valuable customers an
essential prerequisite for the achievement of a sustainable competitive advantage and,
hence, the airline’s overall success.
Relevant literature from related fields, such as relationship and service marketing, form the
foundation for the development of the conceptual airline customer loyalty (ACL) model.
Centered on the concept of relational benefits, this model depicts important antecedents to
customer loyalty in the airline industry. Relational benefits are thereby defined as benefits
customers receive as a result of their engagement in customer‐brand relationships. In the
course of this study, three types of relational benefits are identified as bearing relevance for
the airline industry: social, psychological, and functional benefits.
The ACL model is empirically tested employing structural equation modeling on primary data
collected from an online survey with 276 participants. The results reveal that three distinct
paths to airline customer loyalty can be distinguished with each being characterized by one
of the observed relational benefits. Accordingly, they are defined as the social, the
psychological, and the functional path to airline customer loyalty. Each path originates from
distinct brand performance characteristics, moves along the respective type of relational
benefits, and results in customer loyalty either directly and/or mediated by the dimensions
of relationship quality – customer satisfaction and relationship commitment. Managerial
implications on how to manage airline customer loyalty are inferred along these three paths,
accentuating the particular relevance of social‐psychological aspects of customer‐brand
relationships for the management of airline customer loyalty. By combining important
brand‐ and relationship‐related concepts, this thesis provides a holistic perspective on the
management of customer loyalty in the airline industry that has to date been missing.

Table of contents
I
Table of contents
List of figures ................................................................................................. IV
List of tables ................................................................................................... V
List of appendices......................................................................................... VII
List of abbreviations .................................................................................... VIII
1 Introduction ............................................................................................. 1
1.1 Research question ....................................................................................................... 3
1.2 Sub‐questions .............................................................................................................. 4
1.3 Definitions .................................................................................................................... 4
2 Methodology ............................................................................................ 5
2.1 Methodological orientation and research approach .................................................. 5
2.2 Overall research design ............................................................................................... 7
2.3 Thesis outline and demarcation .................................................................................. 7
3 The airline industry .................................................................................. 9
3.1 Airline industry specificities ......................................................................................... 9
3.2 Key business models in the airline industry .............................................................. 11
3.3 Customer segmentation ............................................................................................ 13
3.4 Loyalty programs ....................................................................................................... 15
3.5 Industry outlook ........................................................................................................ 16
3.6 Chapter summary ...................................................................................................... 17
4 Conceptual and theoretical foundation for the development of the airline customer loyalty model ................................................................ 17
4.1 The concept of customer loyalty ............................................................................... 18
4.1.1 The influence of customer loyalty on a firm’s profitability ................................ 18
4.1.2 Defining customer loyalty ................................................................................... 19
4.1.3 Customer loyalty through relationship marketing ............................................. 22
4.2 Customer loyalty through relationships between customers and airline brands ..... 23
4.2.1 The service‐dominant logic of marketing in the airline industry ........................ 23

Table of contents
II
4.2.2 The service brand as a relationship partner ....................................................... 26
4.2.3 Relational benefits as a basis of airline customer loyalty ................................... 27
4.2.4 Relationship quality as mediator between relational benefits and customer loyalty.................................................................................................. 31
4.3 Chapter summary – identification of concepts to be included in the ACL model .... 33
5 The airline customer loyalty model ......................................................... 35
5.1 The influence of airline brand performance characteristics on relational benefits . 35
5.1.1 The influence of social brand performance on relational benefits .................... 36
5.1.2 The influence of airline image on relational benefits ......................................... 37
5.1.3 The influence of brand‐self congruence on relational benefits ......................... 39
5.1.4 The influence of trustworthiness on relational benefits .................................... 40
5.1.5 The influence of service quality on relational benefits ...................................... 42
5.1.6 The influence of perceived value on relational benefits .................................... 43
5.1.7 The influence of co‐creation of value on relational benefits.............................. 44
5.1.8 The influence of the airline’s country of origin on relational benefits ............... 45
5.1.9 The influence of FFP attractiveness on relational benefits ................................ 46
5.2 Consequences of relational benefits ......................................................................... 47
5.2.1 Consequences of social benefits ......................................................................... 47
5.2.2 Consequences of psychological benefits ............................................................ 49
5.2.3 Consequences of functional benefits.................................................................. 51
5.3 The influence of relationship quality on customer loyalty ........................................ 52
5.3.1 The influence of customer satisfaction on commitment and customer loyalty 52
5.3.2 The influence of relationship commitment on customer loyalty ....................... 53
5.4 Graphical illustration of the proposed ACL model .................................................... 54
6 Empirical testing of the proposed airline customer loyalty model ........... 54
6.1 PLS as research method ............................................................................................. 54
6.1.1 Selection of PLS as research method .................................................................. 54
6.1.2 Application of PLS ............................................................................................... 55
6.2 Data collection ........................................................................................................... 56
6.2.1 Internet survey as data collection method ......................................................... 57
6.2.2 Questionnaire design .......................................................................................... 57
6.2.3 Course of data collection and descriptive data of sample.................................. 58
6.3 Operationalization of constructs and validation of measurement model ................ 59

Table of contents
III
6.3.1 Exploratory factor analysis .................................................................................. 59
6.3.2 Operationalizing brand performance characteristics ......................................... 60
6.3.3 Operationalizing relational benefits ................................................................... 64
6.3.4 Operationalizing relationship quality .................................................................. 66
6.3.5 Operationalizing customer loyalty ...................................................................... 66
6.3.6 Validation of measurement model ..................................................................... 67
6.4 Validation of structural model and sub‐group comparison ...................................... 68
6.5 Discussion of empirical findings ................................................................................ 70
7 Managerial implications .......................................................................... 78
7.1 The social path to airline customer loyalty ............................................................... 79
7.2 The psychological path to airline customer loyalty ................................................... 82
7.3 The functional path to airline customer loyalty ........................................................ 85
8 Conclusion ............................................................................................... 86
References .................................................................................................... 90
Appendices ................................................................................................. 100

List of figures
IV
List of figures Figure 1: Most‐travelled seating class by UK business travelers in 2007 ................................ 14
Figure 2: Loyalty matrix ............................................................................................................ 21
Figure 3: The exchange versus the relationship perspective in the marketing process .......... 24
Figure 4: Connections between the identified concepts to be included in the ACL model .... 34
Figure 5: The ACL model ........................................................................................................... 54
Figure 6: The three paths to airline customer loyalty .............................................................. 78
Figure 7: The social path to airline customer loyalty ............................................................... 79
Figure 8: The psychological path to airline customer loyalty .................................................. 82
Figure 9: The functional path to airline customer loyalty ........................................................ 85
Figure 10: The structural ACL model ...................................................................................... 133
Figure 11: Differences in the ACL model between business and leisure travelers ................ 137

List of tables
V
List of tables Table 1: Comparison of low‐cost carriers vs. network carriers ............................................... 12
Table 2: Overview of definitions of customer loyalty .............................................................. 19
Table 3: Operationalization of airline reputation .................................................................... 60
Table 4: Operationalization of brand‐self congruence ............................................................ 61
Table 5: Operationalization of trustworthiness ....................................................................... 61
Table 6: Operationalization of service quality ......................................................................... 62
Table 7: Operationalization of perceived value ....................................................................... 62
Table 8: Operationalization of co‐creation of value ................................................................ 63
Table 9: Operationalization of airline country of origin ........................................................... 63
Table 10: Operationalization of FFP attractiveness ................................................................. 64
Table 11: Operationalization of social benefits ....................................................................... 64
Table 12: Operationalization of psychological benefits ........................................................... 65
Table 13: Operationalization of functional benefits ................................................................ 65
Table 14: Operationalization of customer satisfaction ............................................................ 66
Table 15: Operationalization of relationship commitment ..................................................... 66
Table 16: Operationalization of customer loyalty .................................................................... 67
Table 17: Hypothesis testing for the ACL model ...................................................................... 68
Table 18: Quality criteria for the measurement model ......................................................... 100
Table 19: Quality criteria for the structural model ................................................................ 102
Table 20: Summary of survey participants’ socio‐demographic characteristics ................... 117
Table 21: Summary of survey participants’ situational characteristics ................................. 117
Table 22: Overview of consulted studies ............................................................................... 118
Table 23: Studies consulted with respect to ‘social brand performance’ ............................. 119
Table 24: Studies consulted with respect to ‘airline image’ .................................................. 119
Table 25: Studies consulted with respect to ‘brand‐self congruence’ ................................... 120
Table 26: Studies consulted with respect to ‘trustworthiness’ ............................................. 121
Table 27: Studies consulted with respect to ‘service quality’ ................................................ 122
Table 28: Studies consulted with respect to ‘perceived value’ ............................................. 122
Table 29: Study consulted with respect to ‘co‐creation of value’ ......................................... 122
Table 30: Study consulted with respect to ‘FFP attractiveness’ ............................................ 122
Table 31: Studies consulted with respect to ‘social benefits’ ................................................ 123
List of tables
VI
Table 32: Studies consulted with respect to ‘psychological benefits’ ................................... 123
Table 33: Studies consulted with respect to ‘functional benefits’ ......................................... 124
Table 34: Studies consulted with respect to ‘customer satisfaction’ .................................... 124
Table 35: Studies consulted with respect to ‘relationship commitment’ .............................. 125
Table 36: Studies consulted with respect to ‘customer loyalty’ ............................................ 125
Table 37: Measurement items included in questionnaire ..................................................... 127
Table 38: KMO‐ and Bartlett‐test for constructs of brand performance characteristics ...... 128
Table 39: Rotated component matrix for constructs of brand performance characteristics 128
Table 40: KMO‐ and Bartlett‐test for constructs of relational benefits ................................. 129
Table 41: Rotated component matrix for constructs of relational benefits .......................... 129
Table 42: KMO‐ and Bartlett‐test for constructs of relationship quality ............................... 129
Table 43: Rotated component matrix for constructs of relationship quality ........................ 129
Table 44: KMO‐ and Bartlett‐test for customer loyalty construct ......................................... 130
Table 45: Component matrix for customer loyalty construct ................................................ 130
Table 46: Latent variable correlations.................................................................................... 130
Table 47: Correlation matrix for formative variable ‘service quality‘ .................................... 130
Table 48: Calculation of variance inflation factor (VIF) for ‘service quality’ .......................... 131
Table 49: Coefficients of determination (R²) for endogenous constructs ............................. 131
Table 50: Calculation of variance inflation factors (VIF) for structural model ....................... 132
Table 51: Stone‐Geisser Q² for endogenous constructs ........................................................ 132
Table 52: Criteria for the evaluation of significant differences between sub‐groups ........... 134
Table 53: Calculation of t‐values for sub‐group comparison ................................................. 134
Table 54: Hypothesis testing; sub‐group comparison of business and leisure travelers ...... 135
Table 55: Comparison of R² for business and leisure travelers ............................................. 136
List of appendices
VII
List of appendices Appendix 1: Quality criteria for the validation of the ACL model in PLS ............................... 100
Appendix 2: Questionnaire .................................................................................................... 104
Appendix 3: Descriptive data of sample ................................................................................ 117
Appendix 4: Measurement scales reviewed for operationalization of constructs ................ 118
Appendix 5: Measurement items included in questionnaire................................................. 126
Appendix 6: Results of exploratory factor analysis ................................................................ 128
Appendix 7: Calculations for validation of measurement model .......................................... 130
Appendix 8: Calculations for validation of structural model ................................................. 131
Appendix 9: Sub‐group comparison ....................................................................................... 134

List of abbreviations
VIII
List of abbreviations
ACL Airline customer loyalty
AirRep Airline reputation
AMOS Analysis of Moment Structures
AVE Average variance explained
Bsc Brand‐self congruence
cf. Confer (compare)
Comm Commitment
CoO Country of origin
CoV Co‐creation of value
e.g. Exempli gratia (for example)
et al. Et alli (and others)
FFP Frequent flyer program
FunBen Functional benefits
i.e. Id est (that is)
IATA International Air Transport Association
LISREL Linear Structural Relationship
LMU Ludwig‐Maximilians‐Universität, Munich
Loy Loyalty
p. Page
Perv Perceived value
PLS Partial least square
pp. Pages
PsyBen Psychological benefits
Sat Satisfaction
Sbp Social brand performance
SEM Structural equation modeling
Servq Service quality
SocBen Social benefits
SPSS Statistical Package for the Social Sciences
SQ Sub‐question
Trustw Trustworthiness
VIF Variance inflation factor

1
1 Introduction Running airlines profitable has always been a great challenge (cf. Doganis, 2006). In addition
to intense competition diminishing airlines’ profits, airlines are exposed to market volatility,
legal regulations restricting operations, and a disadvantageous cost structure with high fixed
costs (Delfmann, 2005, p. 12; Shaw, 2007, p. 54). The ongoing deregulation and liberalization
of the industry over the past years, which has, inter alia, resulted in the removal of fare
restrictions, have further altered the competitive landscape by encouraging the entry of new
competitors in the market. In particular, low‐cost carriers have become a driving force in this
competitive landscape. In contrast to traditional network carriers1, which typically pursue a
service differentiation strategy, low‐cost carriers focus primarily on keeping their operating
costs low, thus taking over cost leadership. These developments have had extensive
repercussions on the European airline industry’s market structure, resulting in increased
price competition. In an industry that has always been marked by marginal profitability
(Doganis, 2006), this competition on price has led to further profit decline. Today, numerous
airlines in Europe are struggling to make profits or are facing bankruptcy, implying that
extensive consolidation activities are forecast for the European market. At the same time,
the relentless price competition, especially in the short‐haul segment, puts airlines’ service
at risk to be perceived by customers as a rather generic offering.
In such a highly competitive environment, customer loyalty has become an increasingly
effective means for securing a firm’s profitability (e.g. Reichheld & Sasser, 1990; Reinartz &
Kumar, 2002). Customer loyalty refers to a customer’s repeated same‐brand purchase within
a given category, based on a favorable attitude toward and preference for the particular
brand. Empirical findings have revealed that increased market share and decreasing price
sensitivity among customers are particular contributions of customer loyalty to a firm’s
profitability (Chaudhuri & Holbrook, 2001). The establishment and maintenance of a loyal
customer base should, therefore, be (and in many cases already is) a key objective for
airlines, since it promotes a sustainable competitive position in the market place.
Consequently, the retention of valuable customers is an important objective and requires
airline management to understand the underlying factors that reinforce airline customers’
loyalty toward a given airline brand.
1 These carriers are often also referred to as legacy or flag carriers as they were formerly state‐owned. For a detailed description, please refer to Chapter 3.2.

2
Customer loyalty rests in particular on the brand, which plays an important role in customer
retention. A brand can be described as a “cluster of functional and emotional values that
promises a unique and welcome experience” (de Chernatony et al., 2006, p. 819) for its
customers. By creating unique associations and feelings among customers that are directly
and exclusively connected to the given airline, the brand helps airlines differentiate
themselves from their competitors. In addition to its differentiation function, the brand
serves as a potential relationship partner for the customer. The customer‐brand relationship
can evolve and develop through continuous positive interactions between the customer and
the brand (e.g. Grönroos, 2007, p. 331) and provides airlines with the opportunity to offer
their customers benefits that go beyond the core air transport service (cf. Hennig‐Thurau et
al., 2002, p. 234). In such relationships, customers perceive the airline brand as a legitimate
partner in the relationship dyad (Sweeney & Chew, 2000; cf. Fournier, 1998). Customers
construct relationships with brands so that they provide and add meaning and value to their
lives (Sweeney & Chew, 2000; Fournier & Yao, 1997). This value is generated by the
relational benefits resulting from the relationship with the brand as perceived by the
customer (cf. Aaker, 2002, p. 95; Hennig‐Thurau et al., 2002, p. 234). Ultimately, the
customer decides whether the relationship with a given brand generates value or not.
Hence, it is fundamental for the establishment of customer loyalty to understand what
potential and existing customers expect from their relationship with an airline brand.
However, since customers’ personalities and lifestyles differ, as does their evaluation of the
relationship with the brand, customer characteristics must also be taken into account.
With the objective of fostering customer loyalty, airlines introduced loyalty schemes in the
1980s and 1990s. These so‐called frequent flyer programs award customers for flights taken
with the given airline. While these programs attract a great number of airline customers,
skepticism has been expressed whether such programs in fact lead to true customer loyalty
based on a positive attitude toward and preference for the brand. Critics assert that the
reason why customers repurchase a ticket to travel with the given airline rests alone on the
rational and economic benefits the airline’s frequent flyer program offers (cf. Plimmer, 2006;
Dowling & Uncles, 1997). Given frequent flyer programs’ questionable effect with reference
to the creation of customer loyalty, other drivers of customer loyalty in the commercial
airline industry must be considered. Several studies on the antecedents of customer loyalty
in the airline industry have been carried out (e.g. Ostrowski et al., 1993; Park et al., 2006;

3
Zins, 2001). This thesis, however, takes a different approach and argues that the
consideration of the dynamics that result from customer‐brand relationships can generate
new knowledge about how customer loyalty can be created and maintained in the airline
industry.
1.1 Research question
Based on the previous discussion, this thesis’ research objective is to gain insights into the
dynamics of customer‐brand relationships in the airline industry and the effect these can
have on customer loyalty. To achieve the stated objective, the research focuses on the
identification of important drivers of airline customer loyalty. This further establishes a more
profound understanding of customers’ appraisal of specific airline brand characteristics.
Further consideration of customers’ influential role in relational exchanges elicits the need
to pay special attention to those characteristics that differentiate airline customers from one
another. The knowledge gained from this research study provides a foundation on which
recommendations directed at airline managers can be built. Consequently, this thesis
approaches the research question from a managerial perspective.
In consideration of the previously formulated research objective, the overarching research
question of this thesis is:
What kind of benefits do customers seek when they engage in relationships with airline
brands, and how can these relationships strengthen airline customer loyalty?

4
1.2 Sub‐questions
Based on this overall research question, the following sub‐questions (SQ) to be answered
are:
1.3 Definitions
The most important concepts mentioned in the research question and the sub‐questions are
briefly defined below. More detailed definitions are provided in the following chapters.
First, the interchangeable use of the terms airline, airline brand, and airline/brand image in
this thesis must be addressed. The term airline in general relates to the company that
provides the actual air transport service. However, this thesis concentrates on the
relationship between a given airline and its customers. Customers primarily perceive airlines
as brands, i.e., in terms of the benefits the airline provides them. The brand, on the other
hand, cannot be created by the airline per se, but is built by the customer (Grönroos, 2007,
p. 331). Brand image thus relates to the associations a customer links to a particular airline.
In this context, customer loyalty is defined as a customer’s repeated same‐brand purchase
within a given category, based on a favorable attitude toward and preference for the specific
brand. A more elaborate definition of customer loyalty is presented in Chapter 4.1.2. It is
worth mentioning that several different descriptions of loyalty are discussed in the
literature, e.g., customer loyalty, brand loyalty, or service loyalty. Here, the term customer
loyalty was explicitly chosen to emphasize that this research study focuses on the loyalty
customers exhibit toward a specific airline brand.
SQ1: How do relational benefits affect customer loyalty toward a specific airline brand?
SQ2: How do fundamental airline brand performance characteristics influence the
relational benefits perceived by airline customers?
SQ3: How do differences in airline customer characteristics moderate the airline customer
loyalty model?
SQ4: What managerial implications can be inferred from the results of this study?

5
The relational benefit approach assumes that both the customer and the service provider
must benefit from the relationship if it is to persist in the long run. From the customer’s
perspective, the maintenance of this relationship depends primarily on the existence of
relational benefits. These refer to benefits that go beyond the basic services offered by the
service provider. This thesis distinguishes between three different types of relational
benefits: social, psychological, and functional benefits.
It should further be noted that, whenever it is referred to the customer, female and male
customers are considered. However, for simplicity and easiness to read, only ‘he’ and ‘him’
will be used.
2 Methodology This chapter discusses the methodological orientation applied in this thesis to answer the
research question. Furthermore, the role of theory within this context is assessed. Finally,
the outline and demarcation of the thesis are presented.
2.1 Methodological orientation and research approach
With regard to the overall research question and the proposed sub‐questions, this thesis’
objectives are (1) to gain new insights into the effect customer‐brand relationships can have
on airline customer loyalty. These findings are arrived at by reviewing and exploring relevant
literature on customer loyalty, relationship and service marketing, and brand management.
By synthesizing the most important concepts identified in the different fields of research, (2)
a conceptual model is developed which depicts the causal relationships between the
identified concepts and their influence on airline customer loyalty. (3) This model is then
empirically tested.
To meet the objectives described above, this thesis adopts a positivist research philosophy;
relevant literature is reviewed to establish a suitable conceptual framework, including the
construction of hypotheses (cf. Saunders et al., 2007, p. 103). Hypotheses refer to ideas or
propositions about the relationship between two or more concepts that can be tested using
statistical analysis (cf. Saunders et al., 2007, p. 117; Collis & Hussey, 2003, p. 55). The
hypotheses formulated and subsequently tested here concern the proposition of causal
relationships between different concepts that lead to airline customer loyalty. Consequently,

6
the first part of the study, which aims to understand the relevant concepts and constructs of
customer loyalty, relationship marketing, and service marketing in literature, is exploratory
(cf. Malhotra & Birks, 2007, p. 70). The purpose is to deduce hypotheses from the existing
literature and from previous studies (cf. Ghauri & Grønhaug, 2005, p. 15; Gill & Johnson,
2002, p. 34). The second part of the study is explanatory, with its focus on testing the
postulated hypotheses and examining the causal relationships between the concepts (cf.
Malhotra & Birks, 2007, p. 70; Saunders et al., 2007, p. 134), to be able to infer managerial
implications from the empirical results obtained.
Since the main objective of this study is to explore the underlying causal relationships
between variables that result in airline customer loyalty, a deductive research approach is
employed. That is, hypotheses on the causal relationships are deduced from existing
knowledge (literature), subjected to empirical scrutiny (testing), and, based on the findings
are either accepted or rejected (Ghauri & Grønhaug, 2005, p. 15). Saunders et al. (2007,
pp. 117‐118) draw attention to several important characteristics of the deductive approach.
First, resulting from the formulation of hypotheses that need to be tested, deduction is
usually associated with the collection of quantitative data which lend themselves to
statistical analysis (Saunders et al., 2007, p. 104). Because measurement is an essential
element of the analysis of quantitative data, it must be conducted with precision to ensure
the measurement’s accuracy (Collis & Hussey, 2005, p. 7). In order to ensure objective data
collection, the researcher should be impartial to the subject matter being measured
(Saunders et al., 2007, p. 118). Furthermore, to make the measuring of the concepts
possible, they have to be presented in operational terms (Ghauri & Grønhaug, 2005, p. 15;
Saunders et al., 2007, p. 118).
Finally, this research study takes a managerial perspective. The objective is to understand
the underlying reasons for why customers remain loyal to a specific airline brand. The
insights gained can be transformed into distinctive initiatives by airline managers, which
contribute to the strengthening of airline customers’ loyalty. Hence, this thesis’ goal is to
propose recommendations for airline managers on how to intensify the bonds between the
customers and the airline brand.

7
2.2 Overall research design
While deduction describes the general approach applied here to answer the research
question, the research design details the necessary procedures to obtain the information to
answer it. It further specifies the role of theory and the unit of analysis.
The employment of a deductive research approach requires the collection of a considerable
amount of representative quantitative data. Consequently, a survey is the most suitable
research strategy for this study, since the collection of a large amount of standardized and
structured data is thereby possible, which, in turn, allows for a quantitative analysis
(Saunders et al., 2007, p. 138; Malhotra & Birks, 2007, p. 266). A detailed discussion of the
type of survey conducted and the data analysis process is presented in Chapter 6.
This thesis’ main research question necessitates profound knowledge on what kinds of
benefits customers seek in a relationship with a select airline brand. In the conceptual part
of this thesis, theory, i.e., a system for organizing concepts in a way that produces
understanding and insights (Zaltman et al., 1977 in: Ghauri & Grønhaug, 2005, p. 39) is
applied to identify the framework’s key dependent and independent variables. In addition,
theory provides guidance on the operationalization of the key variables identified. In the
analytical part of this thesis, the theory on which the airline customer loyalty model is built
guides the data analysis strategy and the interpretation of results. Furthermore, the findings
arrived at are interpreted on the basis of the literature reviewed and previous research and
are integrated in the existing body of knowledge (cf. Malhotra & Birks, 2007, p. 51).
Concentrating on customers’ particular attitudes and behavior toward airline brands, the
research question clearly identifies airline customers as the designated unit of analysis. For
reasons of generalization, this study aims to cover a heterogeneous consumer base. Airline
customers in general, therefore, constitute the unit of analysis.
2.3 Thesis outline and demarcation
This section briefly introduces the contents of each of the individual chapters. It also depicts
this thesis’ limitations.
Chapter Three provides a brief introduction to the airline industry, its current challenges,
and its two most prominent business models: network carriers and low‐cost carriers. In

8
addition, dimensions for customer segmentation are discussed. Furthermore, frequent flyer
programs (FFPs), a loyalty scheme specific to the airline industry, are introduced, and their
advantages and disadvantages highlighted. It must be noted here that the chapter focuses
on airline industry specificities and forecasts that were made prior to the outbreak of the
financial and economic crisis. What effect the current developments will have on the
industry in the long‐term is difficult to assess and beyond the scope of this thesis.
Chapter Four concentrates on the review of existing literature in the fields of customer
loyalty, relationship and service marketing. With reference to customer loyalty, various
definitions discussed in academic literature are presented, and the different components for
defining true loyalty are assessed. As the focus of this study is on the identification of factors
that influence customer loyalty rather than on the analysis of customer loyalty as such, an in‐
depth analysis of different levels of loyalty or a comprehensive discussion of loyalty’s
influence on a company’s profitability is beyond the scope of this thesis. By considering
relationship marketing’s primary objective, namely building and strengthening relationships
with customers, this study intends to contribute to the current understanding of the drivers
of customer loyalty. To further contemplate the nature of services and the specificities of
service marketing, analyzing customer‐brand relationships is a feasible approach. Here,
special attention is given to the relevance of relational benefits and relationship quality in
the long‐term maintenance and enhancement of such relationships. By processing and
evaluating existing knowledge and synthesizing it, the focus of the research is refined and
concepts for inclusion in the conceptual model are determined.
Based on the insights gained from the literature review and the results from studies
previously conducted in the fields of relationship marketing and customer loyalty, the airline
customer loyalty (ACL) model is conceptualized in Chapter Five. Hypotheses on causal
relationships that exist between the different constructs of the model are postulated for
subsequent empirical testing.
Chapter Six focuses on the empirical testing of the airline customer loyalty model. The
analytical approach is introduced, and details on the data collection procedure are provided.
Furthermore, the operationalization of the constructs is described. Following the validation
of the model, the results of the empirical study are presented. The chapter concludes with a

9
discussion on the empirical findings based on the inferences arrived at by answering sub‐
questions one, two, and three.
Chapter Seven combines the theoretical insights gained from the literature review with the
empirical findings based on the conclusions to sub‐questions one, two, and three to
deliberate managerial implications. Thus, sub‐question four is addressed.
Chapter Eight presents final conclusions and suggests directions for future research.
3 The airline industry This chapter provides a brief overview on the specificities of the passenger airline industry.
First, an outline of historical, legal, and economic factors is presented before the industry’s
two dominant business models, network carriers and low‐cost carriers, are introduced. The
chapter further addresses marketing‐related aspects that characterize the airline industry
such as dimensions for customer segmentation and frequent flyer programs. The chapter
concludes with a concise future outlook of the industry.
3.1 Airline industry specificities
Until the mid‐1980s, the highly‐regulated airline industry was dominated by international
airlines which were fully‐, or at least majority‐owned by their national governments. This
was primarily because governments realized that air transport would be of major
significance for economic and social development, as well as for trade (Doganis, 2006,
p. 223). To promote their country’s power, status, and prestige (Hanlon, 2007, p. 7), each
state designated one airline, the country’s ‘flag carrier’, to operate flights on bilateral routes
between those countries with which air traffic rights had been exchanged (Doganis, 2006,
p. 223). Since the mid‐1980s, the successive liberalization of traffic rights and regulations has
facilitated the privatization of state‐owned airlines. Today, most are either fully or partially
privatized, or are in the process of being privatized (Doganis, 2006, p. 225; Hanlon, 2007,
p. 15). However, a large number of formerly state‐owned carriers continue to commemorate
their historical heritage in their names and in the colors of their corporate design (e.g.,
British Airways, Air France). While liberalization initially spurred the privatization of airlines,
it also triggered the entry of new carriers in the market. Faced with increasing competition
and, simultaneously, decreasing government subsidies traditional carriers were forced to

10
abandon old market practices and become more competitive and customer‐oriented
(Doganis, 2006, p. 224). At the end of the 1990s, traditional flag carriers faced new
challenges from the emergence of low‐cost, low‐fare carriers2 entering the market and
altering the competitive landscape. Again, traditional carriers had to rethink their strategies
and increase their flexibility in order to adapt to the changes in the marketplace.
The airline industry has been characterized by heavy regulations which limit airlines’ room
for maneuver. While other industries have paved the way for companies to transform into
global players, the principle that airlines should be ‘substantially owned and effectively
controlled’ by nationals from the given state in which the airline is registered, has prevented
airlines from becoming truly global businesses by obstructing cross‐border merger and
acquisition activities (Hanlon, 2007, p. 9; Doganis, 2006, p. 54; Shaw, 2007, p. 53). To
overcome the restrictions imposed by this nationality rule, airlines formed global alliances as
a means to secure some of the benefits a larger size and scope offer (e.g. greater purchasing
power, better distribution of maintenance costs, etc). While the 1990s witnessed an outright
alliance‐building frenzy, three major alliances, namely Star Alliance, oneworld, and
SkyTeam3, now dominate the competitive landscape (cf. Doganis, 2006, p. 85, 99). Shaw
(2007, p. 110) asserts that the formation of alliances was not a means in itself; rather, it was
an indispensable ‘detour’, since cross‐border consolidation activities continue to be
restricted by regulations. Moreover, Hanlon (2007, p. 10) argues that the existing airline
alliances may prove to be precursors to actual cross‐border mergers, considering that
government‐imposed constraints and regulations on foreign ownership are progressively
being relaxed.
The cyclical nature of the airline industry, with its growth cycles closely linked to changes in
the world economy, is one of its major economic idiosyncrasies (Doganis, 2006, p. 4; Mason,
2005, p. 19; Shaw, 2007, p. 64). However, this direct relationship between economic growth
and air travel demand seems to have weakened, mainly as a result of low‐cost airlines that
offer lower fares and thus stimulate demand irrespective of the economic situation
2 Low‐cost carriers are primarily characterized by their low operational costs, enabling them to offer low‐fare tickets.
3 Star Alliance has 19 member airlines. Among them are Air Canada, Air China, Lufthansa, Scandinavian Airlines, Singapore Airlines, Thai, and United (Star Alliance, 2009). oneworld has 10 member airlines, including American Airlines, British Airways, Cathay Pacific, JAL, and Quantas (oneworld, 2009). SkyTeam has 11 member airlines, including Air France, Alitalia, Southern China Airlines, Delta Air Lines, KLM, and Northwest Airlines (SkyTeam, 2009).

11
(Doganis, 2006, p. 18). Airlines furthermore have to cope with marginal profitability
(Doganis, 2006, p. 4; Hanlon, 2007, p. 5). The airline industry’s cost structure with high fixed
costs relative to variable costs makes volume a crucial factor for securing profits (Taneja,
2003 in: Tiernan et al., 2008, p. 213). While the constant emergence of new competitors and
the simultaneous pullout or failure of others intensify the industry’s dynamics, additional
pressure is exerted by the customer, who is gaining power in an increasingly transparent
market made possible by the easily accessible information on the Internet on prices,
conditions, and consumer rights (Mason & Alamdari, 2007, p. 303; Delfmann et al., 2005,
p. 12).
3.2 Key business models in the airline industry
In general, four fairly generic business models can be identified in the airline industry: (1)
network airlines, (2) low‐cost airlines, (3) charter airlines, and (4) regional airlines
(Bieger & Agosti, 2005, p. 50). Since network airlines and low‐cost carriers represent the
dominant business models in the international airline industry, only these two models will be
further elaborated on.
Network carriers are ‐ first and foremost ‐ characterized by an extensive international route
network with a complex hub‐and‐spoke system that includes short‐ and long‐haul
connections (e.g. Doganis, 2006, p. 149; Franke, 2004, p. 15; Tiernan et al., 2008, p. 214). In
most cases, network carriers evolved from formerly state‐owned flag carriers. Traditionally,
they have pursued a full service differentiation strategy. Different seating classes and
corresponding pre‐flight, in‐flight, and post‐flight services function as a means for
differentiation and further facilitate the targeting of multiple customer segments
(Pompl et al., 2003, p. 6; Tiernan et al., 2008, p. 214). Offering loyalty schemes such as
frequent flyer programs and belonging to one of the three major airline alliances (Star
Alliance, oneworld, and SkyTeam) complement network carriers’ differentiation strategy (cf.
Tiernan et al., 2008, p. 214). Yet network carriers’ profitability on short‐haul operations has
been heavily undermined by the expansion of low‐cost carriers and their impact on pricing.
Airline business experts (e.g. Mason & Alamdari, 2007, p. 306;4 Doganis, 2006, p. 266) argue
that the future business model of major network carriers will be based on an extensive long‐
4 Mason and Alamdari (2007) conducted a Delphi study with 26 air transport experts in order to detect future trends considering EU network carriers, low‐cost carriers, and consumer behavior.

12
haul network backed by alliances to provide a global spread, and supported by a short‐haul
and domestic network reduced significantly in size and importance.
In contrast to network carriers’ business model, which is based on service differentiation,
low‐cost carriers pursue a strategy of cost leadership. The traditional low cost model
concentrates on maximum aircraft utilization, the operation of a single aircraft type only,
and keeping to short turnaround times at secondary or less congested airports with lower
fees (e.g. Bieger & Agosti, 2005, p. 53; Doganis, 2006, pp. 147; Hanlon, 2007, pp. 58). An
overview of the most important operation and product features distinguishing low‐cost
carriers from network carriers is provided in Table 1.
Operation/ product feature Low-cost carriers Network carriers Airports Secondary, less congested (by and
large) 15-20 minute turnarounds
Primary (hubs) Higher turnaround times due to congestion and labor regulations
Aircraft Single aircraft type (e.g. Boeing 737, Airbus A320) High utilization (over 11 hours/day)
Multiple aircraft types Moderate utilization
Connection Point-to-point No interlining No baggage transfer
Hub-and-spoke Interlining Code share, global alliance
Distribution Mostly direct via Internet booking Travel agents Internet Call center
Fares Low Simple structure
Complex structure
In-flight Single class No seat assignment Pay for amenities, onboard selling
Multiple class Seat assignment Complimentary amenities In-flight entertainment
FFP No (by and large) Yes Target group Leisure, price sensitive business
travelers Leisure and business
Table 1: Comparison of low‐cost carriers vs. network carriers5
Owing to their significantly lower cost base, low‐cost carriers are able to offer point‐to‐point
services at substantially lower fares than network carriers. This introduction of low‐fare
services on European routes has brought about an increase in leisure travel, a higher traffic
volume, and a loss of market shares for both network carriers and charter airlines (Mason,
2005; Lufthansa Consulting, 2008, p. 22). Initially targeting leisure travelers, recent studies
indicate that low‐cost carriers have been successful in increasing their number of business
5 Own illustration based on: Wensveen and Leick (2009, p. 6); Doganis (2006, p. 157); Hanlon (2007, pp. 58).

13
travelers in Europe as well (Mason & Alamdari, 2007, p. 302). Though Europe experienced a
virtual low‐cost boom in 2002/2003 with over a dozen new airlines entering the market
(Doganis, 2006, p. 161), several of them had to pull out of the market soon thereafter, since
they could not operate profitably or were taken over by competitors (Anonymous, 2006,
p. 19). Thus far, it seems that the low‐cost carrier business model is only successful on short‐
haul routes. Though several carriers have tried to adopt the low‐cost business model to long‐
haul international routes, such attempts have to date been unsuccessful (cf. Simon, 2008).
3.3 Customer segmentation
In order to define distinct target groups, customers are typically segmented along
demographic, psychographic, and/or behavioral dimensions (cf. Peter & Olson, 2008,
pp. 370; Solomon et al., 2006, p. 9). Shaw (2007, p. 24) specifies three variables along which
passengers in the airline market are traditionally segmented: (1) passengers’ journey
purpose (reason for travel), (2) the length of their journey, and (3) their country or culture of
origin. Oyewole & Choudhury (2006), on the other hand, contend that purchase situation
factors also represent useful segmentation dimensions. Accordingly, they differentiate
between reason for travel, frequency of travel, class of travel, and type of airline used.6 Since
the reason for travel constitutes the most traditional dimension along which customers are
segmented in the airline industry (cf. Teichert et al., 2008, p. 229), it is described in more
detail in the following section.
Airline customers can essentially be divided into business and leisure travelers. While there
may be some exceptions to these two dimensions (e.g. pilgrimage, medical transport) most
of the trips taken by airline passengers fit into one of these two categories (Shaw, 2007,
p. 24). Business travelers have long been the most important customer segment for airlines
due to their relative price inelasticity (Hanlon, 2007, p. 35). While business travelers in the
past gave emphasis to flexibility and service over price and, therefore, generally purchased
first and business class tickets, a large proportion of this customer segment seems to now be
giving preference to price over service, and seems willing to sacrifice flexibility and frills in
return for lower fares (Mason & Alamdari, 2007, p. 302). This development is corroborated
by recent studies which reveal that – in parallel to the decrease of business travelers who fly
6 In their study, Oyewole & Choudhury (2006) analyze the influence the four different purchase situations can have on the importance consumers attach to services in the airline industry.
14
business class on short‐haul routes – the proportion of passengers who choose low‐cost
carriers for business travel rose to 71% in 2004/2005 from only 28% in 1998/1999 (Company
Barclaycard in: Mason & Alamdari, 2007, p. 302). Indicators used in these studies show that
business travel continues to expand, but that the expenditures for business travel are under
increasing scrutiny (Barclaycard Business, 2008, p. 3). In 2007/2008, 55% percent of UK
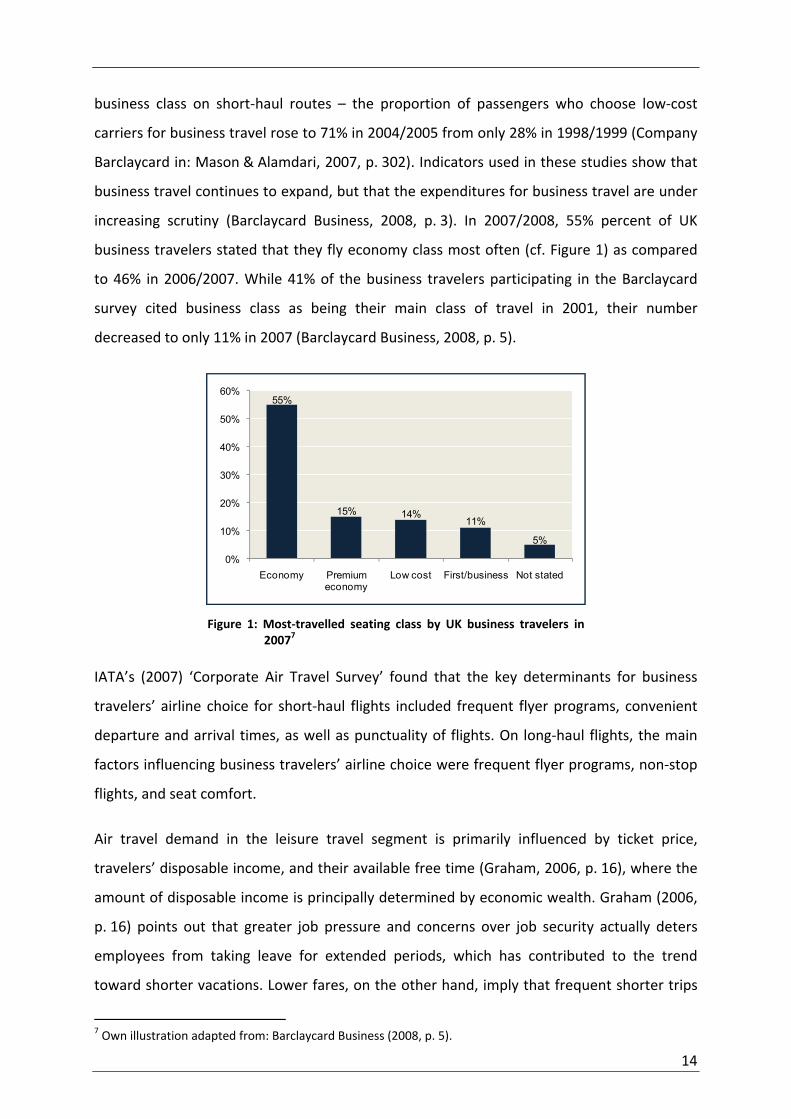
business travelers stated that they fly economy class most often (cf. Figure 1) as compared
to 46% in 2006/2007. While 41% of the business travelers participating in the Barclaycard
survey cited business class as being their main class of travel in 2001, their number
decreased to only 11% in 2007 (Barclaycard Business, 2008, p. 5).
Figure 1: Most‐travelled seating class by UK business travelers in
20077
IATA’s (2007) ‘Corporate Air Travel Survey’ found that the key determinants for business
travelers’ airline choice for short‐haul flights included frequent flyer programs, convenient
departure and arrival times, as well as punctuality of flights. On long‐haul flights, the main
factors influencing business travelers’ airline choice were frequent flyer programs, non‐stop
flights, and seat comfort.
Air travel demand in the leisure travel segment is primarily influenced by ticket price,
travelers’ disposable income, and their available free time (Graham, 2006, p. 16), where the
amount of disposable income is principally determined by economic wealth. Graham (2006,
p. 16) points out that greater job pressure and concerns over job security actually deters
employees from taking leave for extended periods, which has contributed to the trend
toward shorter vacations. Lower fares, on the other hand, imply that frequent shorter trips
7 Own illustration adapted from: Barclaycard Business (2008, p. 5).
55%
15% 14%11%
5%
0%
10%
20%
30%
40%
50%
60%
Economy Premium economy
Low cost First/business Not stated

15
are not necessarily more expensive than the traditional annual leave (Mason, 2005, p. 303),
which has led to an increase in the frequency of shorter trips taken by leisure travelers
(Graham, 2006, p. 16). In recent years, the leisure travel market has grown more rapidly than
the business travel market (Hanlon, 2007, p. 35; Dresner, 2006, p. 30). Hanlon (2007, p. 35)
estimates that the current breakdown of the worldwide demand for air travel between
leisure and business lies at approximately 80/20.
3.4 Loyalty programs
Considering this highly competitive landscape, airlines need to undertake great efforts to
retain their profitable customers. Shaw (2007, p. 241) suggests that relationship marketing,
i.e., putting equal or greater emphasis on the maintenance and strengthening of
relationships with existing customers than on the acquisition of new customers, is an
effective concept to be pursued in order to retain customers. Loyalty programs that center
on passengers whose air travel demands are generally less price elastic (e.g. business
travelers) (Hanlon, 2007, p. 85) and expected to be so in the long‐term, constitute an
important customer relationship management tool (Liu & Yang, 2009, p. 104).
Liu and Yang (2009, p. 94) define loyalty programs as “long‐term‐oriented programs that
allow consumers to accumulate some form of program currency, which can be redeemed
later for free rewards.” Frequent flyer programs (FFPs) represent loyalty programs typical of
the airline industry. Consumers accumulate frequent flyer points for each purchased flight,
with the number of points awarded usually equaling the distance of the flight (Lederman,
2007, p. 1137). These accumulated points can eventually be redeemed for rewards, the most
common of which is a free flight or a free upgrade with the given airline or one of its alliance
partners (IATA, 2007, p. 73; Lederman, 2007, p. 1137; Carlsson & Löfgren, 2006, p. 1470).
Due to the award scheme’s nonlinear design, customers have even more incentives to stick
to one particular airline (Carlsson & Löfgren, 2006, p. 1470). Furthermore, airlines seek to
make their competitors appear more expensive by emphasizing the opportunity costs of
forgone loyalty rewards (Palmer, 2005, p. 161). Hence, frequent flyer programs constitute an
important economic switching barrier (Hanlon, 2007, p. 85; Dowling & Uncles, 1997).
Serious doubts, however, have been raised about the success of frequent flyer programs and
their contribution to true customer loyalty. Dowling and Uncles (1997), for example, claim

16
that customers end up associating their loyalty to a particular rewards program rather than
to the actual airline brand. Furthermore, Doganis (2006, p. 277) argues that frequent flyers,
who often are high‐yield passengers, tend to be members of several airlines’ FFPs.
Accordingly, FFPs’ relevance in terms of securing customer loyalty for a particular airline is
diminishing. A recent study conducted by Liu and Yang (2009) analyzed the success of
competing loyalty programs in the airline industry and found that loyalty programs did not
always lead to beneficial outcomes, and that only airlines with high market shares enjoyed
sales increases on account of their loyalty programs.
3.5 Industry outlook
Considering the downward trend in airline yields, primarily owing to airline deregulation and
liberalization, increased competition, excess capacity, downgrading activity, and the advance
of low‐cost carriers (cf. Mason, 2005, p. 19; A.T. Kearney, 2003, p. 8), industry experts
predict that consolidation activities in the airline business will increase (Doganis, 2006, p. 20;
A.T. Kearney, 2003, p. 8). Such activities may include mergers and acquisitions and will most
likely translate into strong airlines acquiring their weak or failing competitors (Doganis, 2006,
p. 21). Such a scenario will result in a market that is characterized by a small number of very
large network carriers (Mason & Alamdari, 2007, p. 310). Consolidation, however, is not
predicted to remain limited to network carriers alone. Rather, the trend toward
consolidation will affect all sectors of the industry, including low‐cost airlines (Doganis, 2006,
p. 21; Mason & Alamdari, 2007, p. 310). The challenges network carriers face in the
competition with low‐cost airlines on short‐haul routes have already been mentioned in
Chapter 3.1. Since the network carriers’ business model precludes the achievement of cost
structures similar to those of low‐cost carriers (e.g. complex hub‐and‐spoke system, labor
issues, unions), network carriers are expected to increasingly shift their focus to long‐haul
routes which will deliver sustainable profit streams (Mason & Alamdari, 2007). The current
trend among business travelers, who are increasingly becoming price‐sensitive, is further
forecast to lead to the termination of business class service on short‐haul routes, while more
leisure travelers will take advantage of low fares to travel more frequently both within the
EU and abroad (Mason & Alamdari, 2007, p. 310).
17
3.6 Chapter summary
The airline industry, which historically was state‐subsidized to demonstrate and sustain a
country’s status and power, has undergone extensive transitions since the mid‐1980s. These
changes were initiated in particular by gradual liberalization and deregulation. The
emergence of low‐cost carriers, the increasing power of customers, as well as a general
economic downturn applied pressure on airline managers to rethink their business strategies
yet again. Forecasts predict that the network carrier model will only remain sustainable on
international routes, while continental and short‐haul routes will increasingly be dominated
by a small number of large low‐cost carriers and a few niche carriers. With regard to airline‐
specific customer segments, a key differentiator between business and leisure travelers has
long been the higher price elasticity for leisure travelers (cf. Hanlon, 2007, p. 35; Dresner,
2006, p. 29). However, the introduction of low fare tickets by low‐cost carriers has weakened
the direct relationship between economic growth and air travel demand. Especially with
respect to network carriers, experts advise airline managers to focus on individual
customer’s needs, brand distinction, and the differentiation of services (Lufthansa
Consulting, 2008, p. 9). Only those airlines that find ways to attract and retain customers by
offering a differentiated service concept vis‐à‐vis competitors will succeed to operate
profitable on the grounds of a valuable customer base. The strengthening of customer
loyalty, therefore, is an important objective for achieving profitability through the retention
of valuable customers.
4 Conceptual and theoretical foundation for the development of
the airline customer loyalty model The previous chapter focused on current challenges in the airline industry and emphasized
the importance of a loyal customer base. This chapter sets the theoretical framework for the
development of the airline customer loyalty (ACL) model. Introducing customer loyalty as an
effective means for the achievement of a company’s overall objectives of profitability and
differentiation, this chapter first discusses different notions of customer loyalty to establish
a general understanding of the concept. Second, it is argued that the building of customer
loyalty is closely linked to the establishment and maintenance of relationships between the
customer and the firm, i.e., to relationship marketing. Furthermore, considering the
specificities of the service industry, special attention is given to the management of

18
customer‐brand relationships and the meaning of relational benefits and relationship
quality. The chapter concludes with a synthesis of the theories reviewed and the
identification of concepts to be ACL model.
4.1 The concept of customer loyalty
This chapter explains how customer loyalty can influence a firm’s profitability, introduces
definitions of customer loyalty as depicted in the literature, and discusses the prerequisites
for the establishment of true loyalty. It furthermore advocates the consideration of
relationship marketing to better understand the drivers of customer loyalty.
4.1.1 The influence of customer loyalty on a firm’s profitability
Several authors contend that a direct relationship exists between a firm’s loyal customer
base and its profitability (Reichheld & Sasser, 1990; Heskett et al., 2008; Reinartz & Kumar,
2002; Aaker, 2002; Knox, 1998; Andreassen & Lindestad, 1998; Berry, 1995). More precisely,
a loyal customer base implies increased revenues for the firm (Reichheld, 1993, 1996; Berry,
1995; Schlesinger & Heskett, 1991). On the one hand, customer loyalty leads to higher
repurchase rates, on the other hand loyal customers display a greater tendency to purchase
additional goods, for example through cross‐selling opportunities. Moreover, customer
loyalty results in a higher predictability of sales and profit streams (Aaker, 2002; Clark &
Payne, 1994; Reichheld, 1996). Typically, loyal customers generate low customer turnover
(Reichheld & Sasser, 1990), and often introduce new customers to the firm through word‐of‐
mouth recommendations (Reichheld, 1996; Reichheld & Sasser, 1990; Schlesinger & Heskett,
1991; Zeithaml et al., 1996). In addition, a loyal customer base can lead to decreased costs
(Reichheld, 1993; Berry, 1995), since it costs less to provide services to loyal and satisfied
customers (Reichheld, 1996) and because sales, marketing, and set‐up costs can be
amortized over an extended period, i.e., throughout the customer lifetime (Clark & Payne,
1994). Customer loyalty is furthermore essential, as it represents an important basis for
developing a sustainable competitive advantage (Dick & Basu, 1994, p. 99) over competing
brands in inter‐ and intra‐market competition.

19
4.1.2 Defining customer loyalty
Customer loyalty and its advantages for the firm have been extensively discussed in
marketing literature. The result is a plethora of definitions. Table 2 provides an overview of
definitions that are frequently cited in the literature.
Author(s) Definition Cunningham (1956) Single-brand loyalty is the proportion of total purchases represented
by the largest single brand used. Dual-brand loyalty is the proportion of total purchases represented by the two largest single brands used.
Day (1969) “There is more to brand loyalty than just consistent buying of the same brand – attitudes, for instance” (p. 29)
Jacoby & Kyner (1973) Brand loyalty is “(1) the biased (i.e., nonrandom), (2) behavioral response (i.e., purchase), (3) expressed over time, (4) by some decision-making unit, (5) with respect to one or more alternative brands out of a set of such brands, and (6) is a function of psychological (decision-making, evaluative) processes.” (p. 2)
Dick & Basu (1994) Customer loyalty is the strength of the relationship between an individual’s relative attitude and repeat patronage, mediated by social norms and situational factors.
Oliver (1999) “a deeply held commitment to rebuy or repatronize a preferred product/service consistently in the future, thereby causing repetitive same-brand or same brand-set purchasing, despite situational influences and marketing efforts having the potential to cause switching behavior” (p. 34)
Table 2: Overview of definitions of customer loyalty
As the comparison of the different definitions of customer loyalty illustrates, two key
dimensions exist: a behavioral (cf. Cunningham, 1956) and an attitudinal (cf. Day, 1969)
dimension. Both are described below in more detail and an equal consideration of both
dimensions is advocated, if true loyalty is to be achieved.
Behavioral loyalty refers to the customer’s actual behavior of repurchasing a specific brand
within a given category over time (e.g., Day, 1969; Chaudhuri & Holbrook, 2002). Kumar and
Shah (2004, p. 318) describe behavioral loyalty as “loyalty of a customer as observed from
the customer’s purchase behavior.” This explicitly means that the customer repeatedly
chooses the same brand when he needs a specific product or service. This behavior may be a
result of a true preference for the brand. However, repeat purchases of the same brand may
also be attributable to mere convenience, habit, or because the barriers to change (i.e. the
switching barriers) are too high. While proponents of the one‐dimensional construct of
customer loyalty argue that attitude is irrelevant in determining loyalty toward a brand and
consider the debate on the notion of ‘true’ loyalty a “waste of time” (Sharp et al., 2002)
opponents claim that behavioral definitions of customer loyalty are inadequate for

20
explaining how and why customers are loyal to a specific brand, and call for an analysis of
the “individual’s dispositional basis for repeated purchase” (Dick & Basu, 1994, p. 100). Zins
(2001, p. 270) further criticizes that the observation of behavioral loyalty alone does not
leave room to draw any substantiated conclusions about customers’ future actions. Only
measuring behavioral loyalty actually overestimates the share of true loyalty, since it does
not account for those customers who buy a brand simply because no other alternative is
available or because a particular brand is offering a special promotion (Day, 1969).
Considering the deficiency of behavioral loyalty to provide insights into the underlying
motives and processes that lead to customer loyalty, researchers promote the inclusion of
attitude, in addition to behavior, to adequately define customer loyalty. Day (1969, cf. Table
2) was perhaps the first to recognize and articulate this necessity (Bandyopadhyay & Martell,
2007, p. 37). A customer’s attitude basically performs an object appraisal function. Keller
(2003, p. 392) refers to brand attitude as the overall evaluation of the brand in terms of its
quality and the satisfaction it generates. Dick and Basu (1994) assert that the attitude
toward a brand has to be measured in relation to other brands that are perceived by
consumers as being relevant in a specific consumption context. Only when a particular brand
is associated with a strong attitude and is clearly differentiated from other brands in the
customer’s mind does the given brand exhibit a high relative attitude vis‐à‐vis other brands
in the consumption context. Jacoby and Chestnut (1978) refer to attitudinal loyalty as the
consumer’s predisposition toward a brand as a function of decision‐making and evaluative
processes. Based on a strong preference for the given brand relative to other brands in the
category, attitudinal loyalty helps companies build an invisible exit barrier for their
customers, especially in non‐contractual situations where switching costs and barriers are
low (Shapiro & Vivian, 2000 in: Kumar & Shah, 2004, p. 322).
In consideration of the attitude‐behavior relationship, four specific conditions related to
loyalty, as illustrated in Figure 2, are identifiable. Low attitudinal loyalty combined with low
behavioral loyalty indicates an absence of loyalty (cf. Dick & Basu, 1994, p. 101). Day (1969,
p. 30) categorizes those customers as spuriously loyal who exhibit high repeat purchase
behavior, but lack any attachment to the brand and can easily be captured by another brand
offering a better deal. Latent loyalty, in contrast, is reflected by high attitudinal loyalty
combined with low repeat purchase. True loyalty, firms’ preferred condition, can be

21
conceptualized as an attitude‐based behavioral loyalty toward the given brand (see Kim et
al., 2008, pp. 99‐100).
Figure 2: Loyalty matrix8
As has been argued above, the two‐dimensional understanding of customer loyalty allows a
more precise measurement and analysis of customer loyalty. This view is supported by a
wide spectrum of marketing researchers (e.g. Day, 1969; Jacoby & Kyner, 1973; Dick & Basu,
1994; Oliver, 1999; Jones & Taylor, 2007) and has come to be accepted as the basic
understanding of customer loyalty in marketing research. Accordingly, customer loyalty is
defined in its two‐dimensional understanding as:
repeated attitude‐based behavior (Kim et al., 2008, pp. 99‐100) toward a brand,
driven by a preference for this specific brand (cf. Jacoby & Chestnut, 1978) vis‐à‐
vis competing brands relevant in the given consumption context (Dick & Basu,
1994).
A direct relationship between customer loyalty and relationship marketing has been
proposed by a number of authors. Webster (1994, p. 26) claims that “Customer loyalty has
meaning only within the context of relationship marketing”. Similarly, Aaker (2002, p. 23)
proposes that one approach for enhancing customer loyalty is the development or
strengthening of customers’ relationship with the brand, which constitutes the basic
objective of relationship marketing. Relationship marketing thus serves as a concept that
contributes to the understanding of the factors that drive customer loyalty. The concept is
further elaborated in the next chapter.
8 Adapted from Day (1969); Dick and Basu (1994).
True loyalty
Spurious loyalty No loyalty
Latent loyalty
High Low
Low
High
Behavioral loyalty
Attit
udin
al lo
yalty

22
4.1.3 Customer loyalty through relationship marketing
The term ‘relationship marketing’ was initially mentioned by Berry in 1983 in the service
marketing literature (Bitner, 1995, p. 246; Hennig‐Thurau et al., 2002, p. 230). It can be
defined as:
the attraction, maintenance, and enhancement of customer relationships (Berry
1983 in: Berry, 1995, p. 236) that should generate profit and fulfill the objectives
of all parties involved (Grönroos 1994, p. 9).
Relationship marketing is, therefore, a strategic orientation that focuses on retaining existing
customers (Sheth & Parvatiyar, 2002, p. 4; Zeithaml & Bitner, 2003, p. 157; Grönroos, 2007,
p. 43) and enhancing their loyalty (Berry, 2002, p. 71). While the emphasis is on customer
retention, new customer acquisition is also critical for a company’s long‐term economic
success and cannot be achieved by exclusively focusing on existing customers (Hennig‐
Thurau et al., 2002, p. 232). However, attracting new customers is considered an
intermediate step in the marketing process (Berry, 1995, p. 237) rather than a goal in itself.
The underlying objective is to attract those customers who demonstrate the potential and
likelihood of establishing a loyal relationship with the company in the long run (Zeithaml &
Bitner, 2003, p. 158). A company’s primary objective in terms of relationship marketing is,
consequently, to create customer loyalty and to establish a profitable long‐term relationship
(Ravald & Grönroos, 1996, p 19).9 For customers, the main reasons for becoming involved
and staying in a relationship with a company are risk reduction and simplification of choice
(Dall’Olmo Riley & de Chernatony, p. 138). Relationship customers know what to expect
from their brand and, therefore, do not have to spend time deciding which brand to choose.
A relationship develops through a series of encounters between a customer and a company
(Bitner, 1995, p. 248; Coulter & Ligas, 2004, p. 483; Grönroos, 2007, p. 8). Such encounters
are characterized by interactive behaviors at a specific point in time involving both parties
(Bitner, 1992; Lovelock, 1983 in: Coulter & Ligas, 2004, p. 483; Czepiel, 1990). Fournier
(1998, p. 346) summarizes these aspects of relationships in her definition:
9 Hennig‐Thurau et al. (2002, p. 230) describe customer loyalty as an important relationship marketing outcome.
23
“Relationships are constituted of a series of repeated exchanges between two
parties known to each other: they evolve in response to these interactions and to
fluctuations in the contextual environment.”
During each encounter (moment of truth [Bitner, 1995, p. 248]; moment of interaction
[Coulter & Ligas, 2004, p. 483]), customers have the possibility of testing the firm’s ability to
fulfill its promises. For the firm, each encounter provides an opportunity to increase the
customer’s overall satisfaction and willingness to continue doing business with the firm in
the future (i.e. to build a relationship and thereby strengthen customer loyalty).
Several authors (e.g. Grönroos, 2007; Berry, 2000; Czepiel, 1990) argue that the
establishment and maintenance of customer relationships and the achievement of customer
loyalty (e.g. Gremler & Brown, 1999; Bloemer et al., 1999) are especially important and
applicable in service industries. In the following chapter, this aspect, as well as the specific
role of the service brand in the formation of relationships with customers, is explained.
4.2 Customer loyalty through relationships between customers and airline brands
The previous chapter touched upon the relevance of customer loyalty and relationship
marketing in the service context. Now, a closer look is taken at the nature of services and the
specificities that need to be considered in terms of marketing services, especially in the
airline market. In addition, the service brand is introduced as an important relational asset
that can further foster customer loyalty by acting as a legitimate partner in the relationship
with the customer.
4.2.1 The service‐dominant logic of marketing in the airline industry
According to Grönroos (2006, p. 323), services can be defined as:
“processes that consist of a set of activities which take place in interactions
between a customer and […] the service provider […], which aim at solving
customers’ problems.”
Services exhibit two distinctive characteristics. First, services have a processual nature
(Grönroos, 2007, p. 330; 2006, p. 319; Vargo & Lusch, 2008a, p. 258), that is, services emerge
in processes and are directly influenced by the further evolvement of these processes.

24
Second, customers are involved in the production of the given service through their
interaction with the service provider. Consequently, they participate as co‐producers in the
production process and influence the nature of the service that is produced and consumed.
Likewise, they determine the actual value of the service experience (Grönroos, 2006,
pp. 326‐327), i.e., whether their expectations were met.
According to the above‐stated definition of services, airlines can clearly be defined as service
providers: (1) passenger airline travel can be understood as a process that is directly
influenced by the further evolvement of this process (e.g. rebooking after flight‐delays) (2)
passengers ‘consume’ their travel experience while it is being produced. Furthermore, the
notion of airlines offering a service is widely accepted in the marketing and airline literature
(e.g. Anderson et al., 2008; Oyewole & Choudhury, 2006). Hence, the following theoretical
discussion on relationships between customers and airlines needs to take the specificities
that apply to the concept of service marketing into consideration.
Traditionally, the marketing process has focused on the exchange of goods in which value is
embedded and distributed through transactions (Grönroos, 2006, p. 323). The service‐
centered approach, in contrast, places the provision of services rather than the
manufactured good at the center of attention (cf. Vargo & Lusch, 2004, p. 1; 2008a, p. 254).
This shift in perspective is illustrated in Figure 3.
Figure 3: The exchange versus the relationship
perspective in the marketing process10
10 Own illustration adapted from: Sheth and Parvatiyar (1995a, p. 412); Grönroos (2007, p. 27).
Process(intangible resources)
Value creation
Outcome(tangible resources)
Value distribution
Relationship perspective
Exchange perspective

25
The service‐centered perspective on marketing, therefore, focuses on value co‐creation
through the interaction between the customer and the service provider (cf. Prahalad &
Ramaswamy, 2004, p. 6; Wikström, 1996), with the role of the customer transforming from
one in which he represents a recipient of a service to one in which he co‐produces that
service (Vargo & Lusch, 2004, p. 7). The customer thus becomes an even more significant
driving force in the co‐creation process (Rajah et al., 2008, p. 367; Anderson et al., 2008,
p. 366). The service provider, in contrast, increasingly adopts a support function by creating
and developing the resources, means, or competence that the customer requires (Vargo &
Lusch, 2004; Grönroos, 2006, p. 324; Rajah et al., 2008, p. 367). Value is created when
services are used or consumed by the customer. That is, value is the outcome of the
subjective, personalized consumption experience characterized by the customer’s active
involvement in its design, delivery, and creation (Sheth et al., 2000 in: Rajah et al., 2008,
p. 367).
As Anderson et al. (2008; see also: Gummesson, 2008, p. 16) point out, differences in
customer characteristics inevitably lead to differences in what customers value. Resulting
from their research about the moderating effects of airline passenger characteristics on the
relationship between service components and overall service satisfaction, the authors
conclude that, in line with Vargo and Lusch’s (2008b, p. 9) premise that value is “uniquely
and phenomenologically” determined by the customer, it is important to consider
customers’ varying demographic and situational characteristics.
The circumstance that individual customer’s appreciation of different service factors
diverges considerably constitutes a major challenge for airlines, considering that they
interact with customers from very diverse national and cultural backgrounds. The nature of
airlines’ service chain, in which processes can broadly be divided into pre‐flight, in‐flight, and
post‐flight activities, further complicates the building of personal relationships between
service employees and the customer. This is due to the changing contact persons from one
activity to the next. In such an environment, the service brand should be considered an
essential relationship partner. This argument is brought forward in the following chapter.

26
4.2.2 The service brand as a relationship partner
While branding has long been a central issue in the marketing of physical products,
awareness of the importance of creating service brands has only evolved in the last 20 years
(Grönroos, 2007, p. 329). Today, however, it is widely recognized that branding plays a
fundamental role and signifies a principal success driver for service organizations and
represents a cornerstone for service marketing (Berry, 2000, p. 128).
Ambler and Styles (1997, pp. 222‐223) define a brand as “the promise of the bundles of
attributes that someone buys and that provides satisfaction”. Accordingly, Berry (2000, p.
129) describes a service brand as a promise of future satisfaction, “a blend of what the
company says the brand is, what others say, and how the company performs the service – all
from the customer’s point of view”. The service brand’s inherent significance is derived from
services’ specific nature. As services are produced only once the interaction between the
customer and the service provider is initiated, services are difficult to appraise prior to
consumption. Here, the service brand, i.e., the image resulting from accumulated
experiences as perceived by the customer, can reduce customers’ perceived monetary,
social, and safety risks. The service brand subsumes a wide spectrum of dimensions to create
a comprehensive image in the customers’ minds.11
In the brand’s conceptualization as a risk reducer, simplifier of choice, and guarantor of
quality, Dall’Olmo Riley and de Chernatony (2000, p. 138) identify similarities with the
conceptualization of relationship marketing. Consequently, the authors claim that the brand
is a ‘relationship builder’ in that “the service brand is a holistic process beginning with the
relationship between the firm and its staff and coming alive during the interaction between
the staff and customers” (p. 138). Brodie et al. (2006, p. 375) support this proposition by
identifying the service brand as a ‘relational asset’.
A theoretical foundation of customer‐brand relationships has been laid by Fournier’s
relationship theory. Fournier (1998, p. 344) contends that a brand is legitimized as a
relationship partner when it is animated, humanized, or to some degree personalized.
Anthropomorphization refers to the process of projecting human qualities and personalities
onto brands (Patterson & O’Malley, 2006), which facilitates their interaction with the
11 For the creation of the ACL model, these different dimensions are referred to as brand performance characteristics.
27
immaterial world (Fournier, 1998, p. 345). The legitimization of the brand as a relationship
partner can further be achieved through interactive and direct marketing communication
activities, which can be construed as “behaviors performed by the brand acting in its
relationship role” (Fournier, 1998, p. 345). Similar studies conducted in the service domain
by Sweeney and Chew (2000), have verified Fournier’s assertion of the brand as a
relationship partner that is especially relevant for service brands.
The consideration of the brand as a relationship partner and the contribution of this
relationship to customer loyalty are of great relevance for the airline industry. Changing
travel environments and changing personal contacts prevent the development of personal
relationships with the airline. Here, the brand depicts a constant and familiar relationship
partner for the customer. Each encounter, or moment of interaction with the airline, adds to
how the customer perceives the airline brand’s image and reinforces the brand and the
relationship the customer has with it. While a single contact between the customer and the
airline may not constitute a relationship per se, each contact contributes to the overall
relationship between the customer and the airline brand. This notion further emphasizes the
decisive relevance of each customer‐airline interaction.
Whether the relationship between customers and brands is strong and leads to customer
loyalty in the long run depends on the attractiveness of the relationship from the customer’s
point of view. This, in turn, is influenced by the benefits the customer enjoys from the
relationship with the given brand. These so‐called relational benefits are explained in the
next chapter.
4.2.3 Relational benefits as a basis of airline customer loyalty
According to the relationship approach, long‐term relationships only exist if both the service
provider and the customer benefit from the relationship (Hennig‐Thurau et al., 2002, p. 231;
Gwinner et al., 1998, p. 101; Marzo‐Navarro et al., 2004). While the primary advantage of
customer‐brand relationships for the firm is customer loyalty and the consequences
resulting from it (cf. Chapter 4.1.1), relational benefits refer to those that customers are
likely to receive as a result of having cultivated a long‐term relationship with a service brand
(Gutek et al., 1999; Gwinner et al., 1998; Reynolds & Beatty, 1999; Hennig‐Thurau, 2002;
Zeithaml & Bitner, 2003). Relational benefits refer to benefits that go beyond the inherent
advantages provided by the actual service. Those perceived by the customer have been
28
identified as a driving force for consumers to engage in long‐term relationships with service
providers and are positively associated with satisfaction, word‐of‐mouth communication,
and repeated purchases (Reynolds & Beatty, 1999).
Empirical research conducted on the types of relational benefits customers gain from long‐
term relationships with a specific service provider put forth different perspectives on how to
categorize relational benefits. First, based on a study analyzing different service industries,
Gwinner et al. (1998) classified relational benefits into three different categories. According
to the authors, confidence benefits refer to the perception of comfort or feelings of security,
reduced anxiety, and trust in the service provider. Social benefits include feelings of
understanding, familiarity, and even friendship between the customer and service
employees. Special treatment benefits include economic and customization benefits that
only relationship customers enjoy (in contrast to non‐relational customers), such as special
treatment (Gwinner et al., 1998; Hennig‐Thurau et al., 2002; Chang & Chen, 2007). Along all
service industries studied, Gwinner et al. (1998) concluded that confidence benefits
represent the most important benefits, if customers are to remain in long‐term relationships
with a specific service provider, followed by social benefits and special treatment benefits,
respectively. In an exploratory study of the retail industry, Beatty et al. (1996; see also:
Reynolds & Beatty, 1999) identified two categories of relational benefits: social and
functional benefits. While functional benefits, according to Reynolds and Beatty (1999,
p. 13), comprise Gwinner et al.’s (1998) confidence and special treatment benefits, social
benefits refer to the specific benefits that result from the interaction with the salesperson.
These two categories of relational benefits have also been proposed by other authors (cf.
Adelman et al., 1994; Berry, 1995; Bitner, 1995; Dwyer et al., 1987; Gwinner et al., 1998 in:
Reynolds & Beatty, 1999, p. 13). In a study investigating the effect of relationship benefits
for companies in business‐to‐business settings, Sweeney and Webb (2007) differentiated
between social, psychological, and functional benefits.
Here, in accordance with the findings presented above, three types of relational benefits are
proposed to be relevant: social, psychological, and functional benefits. They will be
described in the following section.

29
4.2.3.1 Social benefits
Social benefits focus on the customer‐brand relationship itself rather than on the outcome
(or result) of service encounters (Hennig‐Thurau et al., 2002, p. 235). They include feelings of
familiarity, personal recognition, friendship, rapport, and social support (Berry, 1995, Barnes,
1994 in: Gwinner et al., 1998, p. 102) and are positively related to customers’ commitment
to the relationship (Berry, 1995; Goodwin, 1997; Goodwin & Gremler, 1996 in: Hennig‐
Thurau et al., 2002, p. 235). They further are expected to have a positive impact on customer
satisfaction (Reynolds & Beatty, 1999).
Reynolds and Beatty (1999, see also: Price & Arnould, 1999) refer to social benefits as
feelings of friendship a customer has for the salesperson, i.e., the salesperson is perceived as
a good friend. Comparing this relationship with a private friendship is criticized by Hennig‐
Thurau et al. (2002), who emphasize the difficulty and risk accompanying the commercial
instrumentalization of social relationships. The authors call for a more straightforward
understanding of social benefits and propose a rapport as being a much more achievable
level of interaction between both parties (cf. Gremler & Gwinner, 2000). According to
LaBahn (1996, p. 30), social rapport refers to “the client’s perception that the personal
relationships have the right chemistry and are enjoyable“.
In their study of benefits resulting from relational exchanges with service firms, Gwinner et
al. (1998) empirically substantiated that many customers do indeed receive social benefits as
a result of a relationship with a specific service provider. The authors further argue that
social benefits appear to be particularly prevalent in those service settings with a high
degree of interpersonal contact between customers and employees (p. 104).
As has been argued in Chapter 4.2.1, it seems more promising to analyze customer‐brand
relationships rather than interpersonal ones in the airline setting. Therefore, social benefits
have to be conceptualized at a broader level. Besides the feeling of familiarity and
enjoyment resulting from the relationship with the airline brand, social benefits in this
context include social support the brand may provide for the customer in his social
environment. This relates to customers’ social status in society, the roles they play, the
lifestyle they lead, and how the relationship with the airline brand enhances these aspects.

30
4.2.3.2 Psychological benefits
While social benefits relate to the emotional reactions that arise directly from the
interaction with the brand, psychological benefits are more introversive and refer to the
feelings and emotions experienced by customers. The understanding of psychological
benefits here resemble the confidence benefits as suggested by Gwinner et al. (1998; see
also: Hennig‐Thurau et al., 2002; Yen & Gwinner, 2003; Chang & Chen, 2007), and the
psychological benefits described by Sweeney and Webb (2007, p. 476).
Psychological benefits from the customer’s perspective refer to feelings of trust and
confidence in the brand. The result is a sense of reduced risk and anxiety which leads to
feelings of security and comfort in customers. As customers engage in relational behavior
with the service provider and accumulate experiences through these encounters, their level
of uncertainty decreases as brand knowledge increases (cf. Martín Ruiz et al., 2007, p. 1091).
4.2.3.3 Functional benefits
Functional benefits involve the rational aspects of a relationship (Beatty et al., 1996, p. 225).
According to Beatty et al. (1996, p. 225) and Reynolds and Beatty (1999, p. 28), functional
benefits include time savings and convenience resulting from the relationship with the
brand. Furthermore, they include customers’ perceptions of making better purchase
decisions and feeling confident about the purchase decisions made. Correspondingly,
functional benefits refer to the economic benefits customers gain from the relationship with
the brand (cf. Sweeney & Webb, 2007, p. 475).
In the conceptualization used here, functional benefits are partly related to special
treatment benefits as proposed by Gwinner et al. (1998). Berry (1995) contends that special
treatment benefits are those that can most easily be duplicated and, therefore, do not
provide a sustainable source of competitive advantage. However, it can be argued that a
service provider has to offer at least a minimum level of functional benefits in order to meet
the customer’s needs.
This chapter introduced relational benefits as a basis for the development of long‐term
customer‐brand relationships. The following chapter presents the concept of relationship
quality as a mediating construct between relational benefits and customer loyalty.

31
4.2.4 Relationship quality as mediator between relational benefits and customer loyalty
Relationship quality can be regarded as a metaconstruct that includes several components
and focuses on the overall nature of the customer‐brand relationship (Hennig‐Thurau et al.,
2002, p. 230). It is conceptualized as a diagnostic tool to evaluate the relationship’s strength
and durability (Fournier, 1998). Roberts et al. (2003, p. 191 in: Beatson et al., 2008, p. 212)
define relationship quality as “a measure of the extent to which consumers want to maintain
relationships with their service providers”. While the relational benefits approach is based
on the assumption that the perception of benefits is a prerequisite for the relationship to
persist in the long run, the relationship quality approach addresses the customer’s
evaluation of the relationship and his resulting decision to continue or abandon it (Hennig‐
Thurau et al., 2002, p. 234). Relationship quality can, therefore, be seen as mediating the
influence of relational benefits on customer loyalty.
While there is no clear consensus on what represents the most appropriate
conceptualization of relationship quality, there is general agreement that customer
satisfaction with a brand’s performance, trust in the service brand, and commitment to the
relationship are key components of relationship quality (e.g. Kim et al., 2005, p. 118;
Garbarino & Johnson, 1999; Crosby et al., 1990; Dorsch et al., 1998 in: Hennig‐Thurau et al.,
2002, p. 234). As discussed in the previous chapter, trust is an important factor in the
construct of psychological benefits. Therefore, this thesis considers customer satisfaction
and commitment to be key dimensions of relationship quality (cf. Hennig‐Thurau et al.,
2002).
4.2.4.1 Customer satisfaction
The relevance of customer satisfaction in winning loyal customers has been empirically
verified by a number of studies which found that satisfaction is a leading factor in
determining loyalty (e.g. Garbarino & Johnson, 1999; Anderson & Fornell, 1994).
Several definitions of customer satisfaction exist. However, the most widely accepted
definition describes customer satisfaction as an affective and emotional response (e.g. Dick
& Basu, 1994, p. 104; Hennig‐Thurau et al., 2002, p. 232; Zins, 2001, p. 276) to an
expectancy‐disconfirmation experience that involves a cognitive process (Oliver, 1980).
Customers evaluate the service performance and compare the results with their
expectations prior to purchase or consumption. Any discrepancy between expectations and

32
actual experience leads to disconfirmation. Positive disconfirmation, i.e., when the
performance is higher than expected, increases or upholds satisfaction. Negative
disconfirmation, i.e., when the performance is lower than expected, decreases satisfaction
and creates dissatisfaction. In general terms, satisfaction relates to whether the service or
brand meets the customer’s needs and expectations.
Because loyal customers stick to one brand over an extended period of time and are
assumed to build and maintain a relationship with this brand over a number of interaction
episodes, it is important to distinguish between transactional (e.g. Cronin & Taylor, 1992,
p. 56) and cumulative satisfaction (e.g. Anderson et al., 1994, p. 54). While transactional
satisfaction refers to the post‐choice evaluation of one specific service encounter,
cumulative satisfaction comprises all encounters in the customer‐brand relationship and
thus relates to the overall evaluation of this relationship based on long‐term experiences (cf.
Brunner et al., 2008, p. 1097; Anderson et al., 1994, p. 54). However, it is important to note
that the two constructs are not independent of each other. Previous experiences, which
constitute cumulative satisfaction, affect expectations and, therefore, influence transaction‐
specific satisfaction. On the other hand, each new experience with the brand enhances and
modifies cumulative satisfaction. As the focus of this thesis lies on the long‐term relationship
between customers and airline brands, approaching satisfaction from a cumulative
perspective is more practical.
4.2.4.2 Relationship commitment
Commitment has been analyzed in a variety of marketing contexts and is viewed as being
central to the establishment of relationships and successful relationship marketing (Berry &
Parasuraman, 1991; Morgan & Hunt, 1994).
Morgan and Hunt (1994, p. 23), who concentrated specifically on buyer‐seller relationships
in business‐to‐business markets, define relationship commitment as “an exchange partner
believing that an ongoing relationship with another is so important as to warrant maximum
efforts at maintaining it; that is, the committed party believes the relationship is worth
working on to ensure that it endures indefinitely”. Their definition corresponds to Moorman
et al.’s (1992, p. 316) description of commitment as “an enduring desire to maintain a valued
relationship”. In the service context, Berry and Parasuraman (1991, p. 139) contend that
relationships are built on mutual commitments.
33
In the customer‐brand context, relationship commitment can be understood as the
customer’s motivation and dedication to continue the interaction with the brand in the
future. The brand’s trustworthiness and its ability to successfully support the customer’s
value‐generation and value‐formation processes are important prerequisites for relationship
commitment (cf. Grönroos, 2007, p. 41).
Bloemer and Kasper (1995, p. 326) claim that relationship commitment is an important
determinant for the degree of true brand loyalty and creates a substantial switching barrier
for customers; this is because committed customers are bound to their brand choices.
Therefore, loyal customers are less vulnerable to competitors’ marketing actions and more
willing to stick to their brand.
4.3 Chapter summary – identification of concepts to be included in the ACL model
Customer loyalty has been conceptualized as repeated attitude‐based behavior toward a
brand, driven by a preference for this particular brand vis‐à‐vis competing brands that are
relevant in the specific consumption context. Directly influencing a firm’s profitability, it
provides a basis for developing a sustainable competitive advantage in the marketplace.
Building and strengthening relationships between the customer and the company ‐ the main
objective of relationship marketing ‐ is considered an important approach to the creation
and improvement of customer loyalty. Relationships emerge from a number of encounters
between the customer and the company.
The relationship perspective has special relevance in the service context. Since the airline
industry is a service industry, the particularities that characterize service marketing also
apply to this research study. Services are considered processes in which activities are
performed during the interaction between the customer and the service provider. Through
these processes the customer becomes a co‐producer of the value created.
The interaction between the customer and the airline is particularly affected by changing
environments and changing contact persons. As a result, the brand comes to represent
familiarity, consistency and, therefore, can be considered an effective relationship partner.

34
The service brand is a unique image of a company and its offerings, as perceived by the
customer. Considering the nature of services, the most significant impressions and
associations that evolve throughout the service process come to reflect the company’s
image and are, therefore, primarily based on the customer’s own experience. Customers
have the opportunity to evaluate the brand’s performance during these processes and
decide whether their needs have been satisfied based on a number of characteristics or
attributes that can be ascribed to the brand. The customer’s image of the brand, therefore,
constitutes the subsumed assessment of these characteristics.
In customer‐brand relationships the brand is accepted as a legitimate partner in the
relationship dyad. However, these relationships can only persist in the long term when both
parties benefit from them. While customer loyalty constitutes the ultimate benefit of the
customer‐brand relationship for the firm, relational benefits, i.e., benefits resulting from the
relationship with the brand as perceived by the customer, have been identified as an
important prerequisite for the relationship to continue on the part of the customer.
Relational benefits can be categorized into social, psychological, and functional benefits and
are considered to positively influence customer loyalty. They also have a positive influence
on customers’ commitment and satisfaction, which both have been identified as key
dimensions of relationship quality. Relationship quality, in turn, describes the overall nature
of the customer‐brand relationship and functions as a mediator between relational benefits
and customer loyalty.
Figure 4: Connections between the identified concepts to be included in the ACL model
Figure 4 illustrates the concepts that have been identified as influencing customer loyalty in
the airline industry, namely brand performance characteristics, relational benefits, and
relationship quality. Brand performance characteristics are considered assessable attributes
of the airline brand, whose positive evaluation leads to the perception of relational benefits
by the customer as a result of the relationship with the brand. Based on the previous
discussion, relational benefits are a prerequisite if the customer‐brand relationship is to
Brand performance
characteristics
Relational benefits
Customer loyalty
Relationship quality
… inf luence the perception of …
… which directly, and mediated by relationship quality, inf luence the creation and improvement of customer loyalty towards the airline brand.

35
continue in the future. While relational benefits are considered to have a direct influence on
customer loyalty, the inclusion of relationship quality in the ACL model provides further
information about the overall strength and durability of the customer’s relationship with the
airline brand and the resulting impact on customer loyalty.
5 The airline customer loyalty model The previous chapter laid the conceptual and theoretical foundation for the development of
the ACL model. Brand performance characteristics, relational benefits, and relationship
quality have been identified as important concepts to be included in the airline customer
loyalty model. Taking a closer look at these concepts, this chapter develops hypotheses
about the causal relationships that exist between the concepts and concludes with the
construction of a comprehensive ACL model.
5.1 The influence of airline brand performance characteristics on relational benefits
This chapter postulates hypotheses on the influence of key airline brand performance
characteristics on relational benefits as perceived by the customer. To the best of
knowledge, no previous study has analyzed these relationships. For the purpose of this study
and to support the hypothesis development, findings from studies analyzing the direct
influence of brand performance characteristics on customer loyalty are consulted.
Some of the brand performance variables tested here have been examined in previous
studies as antecedents of customer loyalty (e.g. service quality, airline image, perceived
value). Within the context of this research study, the selection of these variables was made
in accordance with their potential influence on relational benefits. Furthermore, additional
variables (e.g. airline country of origin and FFP attractiveness) have been added, in the
assumption that they bear a special importance in the airline industry. Where applicable,
empirical findings derived from research studies conducted within the airline industry have
been taken into consideration. Otherwise, studies researching the different constructs in
other industries and product categories are used.

36
5.1.1 The influence of social brand performance on relational benefits
Brand performance, according to Keller (2003, p. 82), refers to the “ways in which the
product or service attempts to meet customers’ more functional needs.” To define social
brand performance, this understanding is adapted to the social context and describes social
brand performance as the brand’s attempt to meet customers’ social needs. Hence, it
relates to the brand’s capability to support airline customers in expressing their values and
lifestyle in their social environment.
The social environment includes all social interactions between and among people. While
the macro social environment refers to both indirect and vicarious social interactions that
influence customers’ general values and beliefs, the micro social environment includes face‐
to‐face social interactions among smaller groups of people such as families and reference
groups. Compared to the macro social environment in particular, the more intense micro
social interactions affect and nurture airline customers’ knowledge and feelings about
specific airline brands (cf. Peter & Olson, 2008, p. 258‐259). Therefore, the micro social
environment has considerable impact on what customers think and how they feel about
airline brands, and it is considered a key influence on customers’ motivation to maintain the
relationship (Sheth & Parvatiyar, 1995b, p. 259). It further influences airline customers’
consumption behavior (cf. Childers & Rao, 1992 in: Bendapudi & Berry, 1997, p. 25) and the
lifestyle they choose to live. Lifestyle refers to the specific manner in which consumers
conduct their lives (Peter & Olson, 2008, p. 535). The consumption pattern reflects
consumers’ choices of how they spend their time and money. According to Solomon et al.
(2006, p. 558), lifestyle is “a statement about who one is in society and who one is not.”
With regard to the social environment and its influence on consumers’ purchasing behavior,
Fishbein and Ajzen developed the theory of reasoned action, which assumes that
“consumers consciously consider the consequences of alternative behaviors and choose the
one that leads to the most desirable outcomes” (Peter & Olson, 2008, p. 539). According to
their theory, consumers’ behaviors are strongly influenced by their perceptions of what
other people want them to do (i.e., social norm; cf. Peter & Olson, 2008, p. 151; Solomon et
al., 2006, p. 362) and whether these behaviors are evaluated favorably by and are popular
with other people (Peter & Olson, 2008, p. 149). Social approval, an emotional response that
emerges from the interaction with the brand, refers to the positive feelings that customers

37
develop in response to the reactions of others (Keller, 2003, p. 90). Airline customers are,
therefore, presumed to choose a brand that complies with what other people expect from
them. Choosing a specific airline further helps customers signal to others who they are and
what they represent (cf. Martensen & Grønholdt, 2004, p. 44). Wallin & Coote (2007, p. 90)
further argue that consumers may purchase particular brands and show a sustained
preference for these brands, because the brands reinforce their social status and signal
membership in desired social groups. A brand’s social performance, therefore, influences the
social benefits that airline customers perceive as resulting from the relationship with a given
airline brand.
In a broader sense, it is also possible to hypothesize about the influence of social brand
performance on psychological benefits. As defined within the context of this thesis,
psychological benefits of the relationship with the airline brand relate to the feeling of
confidence in and comfort with the airline brand. If airline customers perceive the brand to
reflect their standing in society, the relationship with the airline brand provides them with a
sense of security and contentment.
Empirical studies analyzing the influence of social approval/social norm on customers’
willingness to remain in a relationship with a brand have underlined its significance for
customer loyalty. Martensen and Grønholdt (2004), for example, analyzed social approval as
part of the emotional evaluation of a brand and its influence on customer‐brand
relationships and collected data that validated this assumption.
Correspondingly, the following hypotheses are formulated:
H1a: Social brand performance positively influences social benefits.
H1b: Social brand performance positively influences psychological benefits.
5.1.2 The influence of airline image on relational benefits
Airline image can be described as the perceptions of an airline reflected in the associations
held in consumers’ memory (Keller, 2003, p. 66), resulting from accumulated experiences
made through a number of brand contacts and interactions (Grönroos, 2007, p. 330).
Zeithaml and Bitner (1996) and Andreassen and Lindestad (1998, p. 11) suggest that image
has an important effect on customers’ company choice when the service’s attributes are
difficult to assess. Lovelock (1984, p. 134 in: Andreassen & Lindestad, 1998, p. 7) has claimed

38
that: (images) “… are likely to play only a secondary role in customer choice decisions unless
competing services are perceived as virtually identical on performance, price, and
availability.”
As has been argued in Chapter 3.1, air transport, especially on short‐haul flights, is likely to
transform into a rather generic service. Furthermore, the airline’s service attributes are
difficult to evaluate prior to the actual consumption experience. Taking Lovelocks argument
into account, it can be argued that an airline’s image is an important factor that influences
passengers’ airline choice. This argument is further supported by Park et al. (2006) who state
that the purpose of airline image is to reflect a distinctive competence in comparison to
competitors, implying that the brand represents distinctiveness and appeals to airline
customers. A favorable image may contribute to an airline becoming a customer’s preferred
choice (see also: Andreassen & Lindestad, 1998, p. 11).
The accumulated image perceived by multiple constituencies is often referred to as brand
reputation (cf. de Chernatony, 1999, p. 170; Argenti & Druckenmiller, 2004, p. 369). By
definition, brand reputation signifies the perceptions of a brand as reflected in the
impressions and associations held by a number of consumers in a given social environment.
Paul et al. (2009) suggest that one aspect of social benefits as perceived by customers is
affiliation, i.e., a feeling of attachment to the airline and to other customers of the same
airline. Perceiving one’s own image of the brand as being shared by others strengthens
customers’ identification with the brand. Therefore, favorable airline image is suggested to
positively influence social benefits.
Defined as the customer’s overall perception of the brand, airline image is also related to
psychological benefits resulting from the relationship customers have with the brand. This is
because a favorable image is related to positive associations with the brand. Positive
associations, in turn, translate into feelings of confidence in the brand, reduced anxiety, and
a feeling of security and comfort.
Park et al. (2006) found that airline image has a significant direct effect on airline customers’
future behavioral intentions. Investigating antecedents of customer loyalty in the
commercial airline industry, Zins (2001) identified corporate image to have the strongest
influence on customer loyalty. Andreassen and Lindestad (1998) investigated the influence

39
of corporate image on perceived quality, customer satisfaction, and loyalty in the Norwegian
package tour industry and found corporate image to have an impact on all three constructs.
Correspondingly, the following hypotheses are formulated:
H2a: A favorable airline image positively influences social benefits.
H2b: A favorable airline image positively influences psychological benefits.
5.1.3 The influence of brand‐self congruence on relational benefits
Brand‐self congruence refers to the extent to which airline customers perceive the airline
brand image to match their own self‐concept (cf. Sirgy et al., 2008, p. 1091; Keller, 2003,
p. 474; Morschett et al., 2008, p. 417). In consumer behavior literature ‘self‐image
congruence’, ‘self‐congruence’, ‘self‐congruity’, and ‘image congruence’ are used
interchangeably to describe this notion (Kressmann et al., 2006, p. 954).
Kim et al. (2005, p. 111) refer to self‐congruity as the parallel between consumer self‐
concept and brand personality that consumers feel or experience in the course of customer‐
brand relationship formation. The authors argue that consumers tend to like, prefer, and
ultimately, maintain a long‐term relationship with a brand that has an image consistent with
their own self‐image (Aaker, 1999; Fournier, 1998; Keller, 2003 in: Kim et al., 2005, p. 111).
The motivation to choose a brand perceived to be similar to one’s self‐concept arises from
the need for self‐consistency, i.e., the need to behave in ways consistent with how
consumers view themselves (Sirgy et al., 2008, p. 1092). Brands are, therefore, not only
bought or consumed for their utilitarian benefits, but are purchased by consumers because
the given brand(s) help them express and communicate their identities (e.g. Park et al., 1986
in: Sirgy et al., 2008, p. 1091; Aaker, 2002, p. 99, p. 153).
Taking this argument and transferring it to airlines, it can be deduced that the long‐term
persistence of customer‐brand relationships in the airline industry depends on airline
customers’ perceived match between the airline’s brand image (i.e., the sum of all the
associations with the brand) and their individual self‐image. Helping customers express and
communicate their identities adds to the customers’ perception of being ‘endorsed’ by the
given brand in their social environment. The perceived congruence can further create a
feeling of connectedness and familiarity (Keller, 2003, p. 474; Aaker, 2002, p. 154).
Therefore, brand‐self congruence is proposed to have a positive influence on social benefits.

40
Furthermore, positive feelings and emotions about the brand and a positive evaluation of
the relationship with the brand are direct results of perceived brand‐self congruence. Paul et
al. (2009) describe psychological benefits as benefits which satisfy important intrinsic, self‐
oriented goals customers have. The perception of brand‐self congruence is, therefore,
hypothesized to influence psychological benefits that emerge from the customer’s
relationship with the brand.
Brand‐self congruence has been argued to play an important role in purchase motivation
and brand loyalty (Malhotra, 1988; Sirgy, 1985; Sirgy & Samli, 1985 in: Kressmann et al.,
2006, p. 956). Its relevance in predicting brand loyalty and other consumer behavior
constructs, such as brand preference or satisfaction, has been corroborated by several
research studies on consumer behavior (Kressmann et al., 2006; Bauer et al., 2006; Claiborne
and Sirgy, 1990; Sirgy, 1982, 1985; Sirgy et al., 2000; Sirgy and Su, 2000 in: Sirgy et al., 2008,
p. 109212).
Correspondingly, the following hypotheses are formulated:
H3a: Brand‐self congruence positively influences social benefits.
H3b: Brand‐self congruence positively influences psychological benefits.
5.1.4 The influence of trustworthiness on relational benefits
An airline brand’s trustworthiness refers to airline customers’ appraisal of whether the
brand can be trusted. To be perceived as trustworthy, the brand must be reliable, credible,
and demonstrate a high degree of integrity (cf. Moorman et al., 1992; Morgan & Hunt, 1994;
Bitner, 1995). Berry (1995, p. 242) further argues that for trust in a brand to develop, it has
to communicate openly, honestly, and frequently with its customers.
Several research studies have emphasized trust as an important foundation for relationship
marketing (e.g., Crosby et al., 1990; Parasuraman et al., 1991 in: Berry, 1995, p. 242; Morgan
& Hunt, 1994). While Chaudhuri and Holbrook (2001, p. 91) have demonstrated that brand
trust is directly related to both purchase and attitudinal loyalty, Hennig‐Thurau et al. (2002,
p. 232) suggest that more recent empirical findings (e.g. Grayson & Ambler, 1999) question
the direct influence of trust on loyalty. Even if there is no clear understanding of the
relationship between trust and customer loyalty, Hess and Story (1995, p. 315) propose that
12 Sirgy et al. (2008) refer to several studies in relation to different goods, services, and stores.

41
any personal relationship, whether interpersonal or between a person and a brand, is built
on trust. Trust is especially critical for the establishment of service‐based relationships
because of the intangibility of services. Customers’ appraisal of a brand’s trustworthiness is
an important prerequisite for trust to develop.
Here, the focus is on trustworthiness as a brand performance characteristic, while trust is
the resulting willingness to rely on the brand in which the customer has confidence. Trust is
the belief, sentiment, or expectation of a brand’s trustworthiness (cf. Moorman et al., 1992,
p. 215). A brand is perceived as trustworthy if customers believe in the brand’s good
intentions in the relationship (cf. Berry, 1995, p. 242).
As described above, trustworthiness develops when the customer has confidence in the
brand’s actions and its capability to keep its promises. These positive attitudes and
expectations lead to a decrease in uncertainty and a feeling of safety and comfort in the
relationship with the brand. Therefore, it is proposed that a brand’s trustworthiness has a
positive influence on psychological benefits.
In addition, the trustworthiness of a brand as perceived by the customer reduces concerns
of opportunistic behavior in the case of unforeseen events (Bendapudi & Berry, 1997, p. 20).
If airline customers consider their preferred airline brand to be reliable and to demonstrate
integrity in every situation, they can take quicker decisions on which airline to choose and
thereby save time while feeling confident about their decision. Promises made by the brand
are used in the decision‐making process rather than basing the decision on further
information. Consequently, it can be postulated that trustworthiness has a positive influence
on functional benefits.
Correspondingly, the following hypotheses are formulated:
H4a: Trustworthiness positively influences psychological benefits.
H4b: Trustworthiness positively influences functional benefits.
42
5.1.5 The influence of service quality on relational benefits
Perceived quality refers to the customer’s judgment of service excellence across a number of
dimensions (Parasuraman et al., 1988). Arguing that an objective measurement of service
quality was lacking, Parasuraman et al. (1998, p. 13) proposed measuring consumers’
perceptions of quality as a suitable approach to assess the quality of a firm’s services. The
measurement model introduced by Parasuraman et al. (1988), SERVQUAL, comprises a set of
multi‐dimensional measures of customer evaluations. The conceptualization of service
quality, however, continues to be a highly‐discussed issue in academic literature. While
some authors (e.g. Cronin & Taylor, 1992) argue for a performance‐based conceptualization
of the service quality construct, this thesis promotes a perception‐based understanding in
accordance with Parasuraman et al.’s (1988) definition. This understanding is further
supported by Ostrowski et al.’s (1993, p. 17) reasoning that “It is essential that service
quality measures are customer‐driven, as there could be disparity between managerial
thoughts and customer expectations”. Furthermore, service quality here is treated as a
brand performance characteristic and is thereby part of the customers’ image of the brand.
Therefore, the conceptualization of service quality as perceived by the customer is suitable.
Airline service quality has been identified as a significant driver of customer satisfaction,
customer loyalty, and customer’s airline choice (Ritchie et al., 1980; Alotaibi, 1992;
Ostrowski et al., 1993; Taylor & Barker, 1994; Young et al., 1994; Wells & Richey, 1996 in:
Park et al., 363). Several different dimensions have been proposed to measure service
quality in the airline setting (e.g. Cunningham et al., 2002; Nadiri et al., 2008). Here, in
accordance with the results of an exploratory study conducted by Park et al. (2006) to
identify dimensions of airline service quality, airline service quality includes three general
dimensions: reliability and customer service, in‐flight service, and convenience and
accessibility. Understanding perceived service quality as the positive and favorable
evaluation of the airline service by the customer, it influences social, psychological, and
functional benefits. First, if the airline brand is perceived as providing excellent service to the
customer, such a service quality appraisal fosters the positive evaluation of the relationship
with the brand, thereby intensifying the perceived social benefits. Second, it further
positively influences the confidence and trust the customer has in the relationship with the
brand (cf. Han et al., 2008, p. 26), hence, psychological benefits are positively reinforced. A
43
positive assessment of the airline’s services facilitates airline choice, which implies
convenience and time savings, thus influencing functional benefits.
Correspondingly, the following hypotheses are formulated:
H5a: Service quality positively influences social benefits.
H5b: Service quality positively influences psychological benefits.
H5c: Service quality positively influences functional benefits.
5.1.6 The influence of perceived value on relational benefits
The relevance of delivering value as perceived by the customer has been widely accepted.
While various approaches for defining and measuring customer value can be found in the
literature, no single conceptualization and means of operationalization is generally accepted
(cf. Martín Ruiz et al., 2007, p. 1088; Ravald & Grönroos, 1996, p. 21).
Monroe (1991, p. 46 in: Martín Ruiz et al., 2007, p. 1088) suggests that “buyers’ perceptions
of value represent a tradeoff between the quality or benefits they perceive in the product
relative to the sacrifice they perceive by paying the price”. Here, this quality/price ratio as a
‘value‐for‐money’ approach (cf. Huber et al., 2007, p. 556) to understand customers’
perceived value is preferred over a multidimensional approach (cf. Martín Ruiz et al., 2007,
p. 1090). The significance of the factor price for the evaluation of a service’s value is further
emphasized by Anderson et al. (1994, p. 54). Besides the actual monetary price, sacrifice
components of perceived value also include non‐monetary costs such as time or risk.
Perceived value is further highly subjective and individual, and therefore varies among
consumers (Zeithaml, 1988, p. 13).
Zeithaml and Bitner (1996, p. 32) describe value in services as the key competitive factor
defining the way services are bought and sold. Perceived value has further been proposed to
be a major antecedent to future intentions (Bolton & Drew, 1991). Blackwell et al. (1999)
empirically substantiated a decisive link between value and repeat purchase behavior in
pharmaceutical services. Park et al. (2006) identified a positive effect of perceived value on
customer satisfaction and behavioral intentions in the airline industry.
Customers deem that the price paid for a service determines the level of quality that they
can expect (Teboul, 1991 in: Park et al., 2006, p. 364). Based on Zeithaml’s proposition that
perceived value is personal and idiosyncratic, the level of quality expected will vary among

44
customers. In general, this quality/price ratio is reflected by the different airline business
models. Low‐cost/no‐frills airlines typically offer cheap fares, concentrating on their key
service of air transportation, while network carriers offer additional services at a higher
price.
Perceived value is hypothesized to have a positive influence on social benefits, because
customers who believe that the service they are enjoying is worth the costs will have a
positive attitude about the relationship with the given brand. The notion of getting a good
value‐for‐money deal will further intensify customers’ perception of the brand as being a
fair‐minded relationship partner who is not taking advantage of them, which influences
psychological benefits. Perceived value is further hypothesized to influence functional
benefits by facilitating the purchase decision, since less time is needed to come to a decision
and a higher degree of convenience is experienced. Furthermore, a favorable value‐for‐
money ratio as perceived by the customer results in the estimation that money was saved
or, at least, that a reasonable amount was paid for the service.
Correspondingly, the following hypotheses are formulated:
H6a: Perceived value positively influences social benefits.
H6b: Perceived value positively influences psychological benefits.
H6c: Perceived value positively influences functional benefits.
5.1.7 The influence of co‐creation of value on relational benefits
Co‐creation of value refers to the creation of value for the customer through the interaction
between him and the service provider. The customer, therefore, becomes a co‐producer of
the value created for him (see Chapter 4.2.1). While the argument concerning perceived
value in the previous chapter very specifically focused on the service provided in relation to
the price paid, here the focus is on whether the customer feels he is included and involved in
the airline’s process of value creation.
Rajah et al. (2008) were most likely the first to empirically test the concept of value co‐
creation. Their study revealed that co‐creation generates both satisfaction and trust.
Customers who contribute to the design and delivery of their service experience feel that
they are being taken seriously by the brand as partners in the service production process.
Therefore, it is hypothesized that customers will positively perceive their interaction with
45
the airline brand if they are directly involved in the service production process. Further, the
impression that the service is tailored to their needs will gives customers the feeling that the
brand contributes to the expression of their lifestyle. Both these factors ‐ the positive
interaction experience and the support in expressing one’s lifestyle ‐ can be classified as
social benefits. Moreover, the power to actively influence the value creation process
through the interaction with the brand reduces the customer’s perceptions of risk and
uncertainty (cf. Rajah et al., 2008, p. 365), thereby positively influencing psychological
benefits.
Correspondingly, the following hypotheses are formulated:
H7a: Co‐creation of value positively influences social benefits.
H7b: Co‐creation of value positively influences psychological benefits.
5.1.8 The influence of the airline’s country of origin on relational benefits
The country‐of‐origin (CoO) effect is considered an important phenomenon in international
marketing. As has been argued above (see Chapter 4.2.1), due to their international
operations, airlines have to deal with customers with very diverse national and cultural
backgrounds. Therefore, it seems reasonable to include CoO as a brand performance
characteristic specific to the airline industry.
According to Zhang and Zarb (1996 in: Berentzen et al., 2009, p. 393), CoO is defined as
“information pertaining to where a product is made”. For the airline industry, CoO refers to
the country from which the airline originates. Often, especially for former state‐owned
carriers, the airline’s brand name still refers to its CoO (e.g. British Airways, Air India, etc.;
see Chapter 3.1). CoO can serve as an important cue from which consumers make inferences
about services; it triggers a global evaluation of quality, performance, or specific service
attributes (Bruning, 1997, p. 60). A tremendous amount of literature has been published
which provides evidence that CoO has a significant effect on consumer attitude, purchase
intention, and behavior (cf. Papadopoulos, 1993; Gürhan‐Canli & Maheswaran, 2000 in:
Hennebichler, 2007, p. 60).
Within the context of banking and airline services, Pecotich et al. (1996) have argued that
service quality perceptions fluctuate depending on the services’ CoO. In a customer
evaluation study researching factors that influence airline choice, Bruning (1997) found CoO
46
to be ranked second after price. Respondents preferred national airlines unless switching
carriers yielded price or service advantages. Berentzen et al. (2009) found that the CoO of
low‐cost carriers exerted a noticeable influence on purchase intention, following price and
distance to the airport.
CoO is hypothesized to influence both psychological and functional benefits. A favorable
image of the country from which the airline originates may make customers feel more
comfortable in the relationship with the airline brand. CoO can be seen as a means for risk
reduction (Cordell, 1992 in: Berentzen et al., 2009, p. 394). A positive evaluation of the
airline’s CoO conveys a positive perception of the brand as a relationship partner.
Furthermore, CoO has been argued to represent an important extrinsic cue in the decision‐
making process. Therefore, a favorable CoO further facilitates the purchase‐decision process
and customers perceive functional benefits as resulting from the relationship with the airline
brand.
Correspondingly, the following hypotheses are formulated:
H8a: A favorable country‐of‐origin image positively influences psychological benefits.
H8b: A favorable country‐of‐origin image positively influences functional benefits.
5.1.9 The influence of FFP attractiveness on relational benefits
In Chapter 3.4, FFPs are described as loyalty schemes specific to the airline industry. FFPs can
motivate customers to assume a more long‐term decision‐making approach toward their
choice of airline brand, with customers’ response to the program, in turn, depending on its
attractiveness, the prospect and the extent of rewards granted (cf. Rust & Chung, 2006,
p. 571).
Studying the effect of loyalty programs linked to credit cards, Bolton et al. (2000) found that
these programs strengthened customers’ perception of the credit card’s value and made
them more likely to reject competitors’ offers. These results are consistent with “the
traditional notion that loyalty reward programs provide an opportunity to build longer,
stronger, and deeper relationships with customers” (Bolton et al. 2000, p. 106). Research on
the attitudes and behaviors of business flyers by Toh et al. (1996 in: Long et al., 2006, p. 4)
revealed that membership in a frequent flyer program did in fact influence airline choice.

47
Danaher et al. (2008, p. 46 referring to Gwinner et al., 1998) claim that the reasons for
joining a loyalty program range from purely economic to social benefits. Based on this
argument, it is proposed that FFPs’ attractiveness influences both social and functional
benefits as perceived by the customer. The attractiveness of a FFP motivates customers to
become members, thereby reinforcing the customer‐brand interaction and thus intensifying
the relationship (cf. Bolton et al., 2000). Furthermore, FFPs can also contribute to customers’
standing within their social environment. FFPs usually allocate different statuses to their
members based on the frequent flyer points/miles collected. Holding a preferred status,
customers feel especially valued by the given airline while, on the other hand, their
preferred status may support them in expressing their lifestyle. Typical FFP rewards usually
comprise free flights, seating class upgrades, or other incentives. These incentives directly
translate into perceived economic and functional benefits as a result from the relationship
with the airline brand.
Correspondingly, the following hypotheses are formulated:
H9a: FFP attractiveness positively influences social benefits.
H9b: FFP attractiveness positively influences functional benefits.
5.2 Consequences of relational benefits
In this section, hypotheses about the causal relationships between relational benefits and
customer loyalty are formulated. As has been argued in Chapter 4.2.4, relationship quality
mediates the relationship between relational benefits and customer loyalty. Accordingly, the
influence of relational benefits on the two relationship dimensions, customer satisfaction
and relationship commitment, are proposed here as well.
5.2.1 Consequences of social benefits
Social benefits refer to the feeling of belonging and familiarity perceived by the customer as
a result of the long‐term relationship with the given airline brand. In a broader sense, social
benefits also relate to customers’ perceptions of how the brand can enhance their standing
in their social environments (see Chapter 4.2.3.1).
Several researchers have suggested that social benefits are positively related to the
customer’s commitment to the relationship (Goodwin, 1996; Goodwin & Gremler, 1996 in:
Hennig‐Thurau et al., 2002, p. 235). Berry (1995) claims that social bonds between

48
customers and service employees lead to higher levels of customer commitment to the given
company. Moreover, as argued in Chapter 4.2.2, relationships do not only exist between two
persons, they can also evolve between a person and a brand. On the premise that customers
only maintain a relationship with a brand if they benefit from it, positive experiences as
social benefits over time will lead to commitment on the customer’s part to maintain the
relationship in the future.
Differing results have been obtained on the effect of social benefits on satisfaction. While
Gwinner et al. (1998, p. 111) found a strong link between social benefits and customer
satisfaction, Hennig‐Thurau et al.’s study (2002) revealed that the relation between social
benefits and customer satisfaction was insignificant.
Reynolds and Beatty (1999, p. 14 referring to Crosby et al., 1990) argue that the interaction
between the customer and the service provider within a relationship is crucial for
satisfaction. Further support for this proposition is provided by Gremler and Gwinner (2000)
whose analysis on customer‐employee rapport13 suggests that such interaction plays a
significant role in the degree of satisfaction with the service provider. Social benefits,
however, do not only comprise the direct social interaction with the brand but also the
extent to which the brand reinforces its customers’ status within their social environments.
Since customer satisfaction is related to the degree to which customer expectations are met,
it can be said that the customer’s level of satisfaction in the interaction with the brand
increases in response to rising social benefits associated with the relationship.
Next to these indirect influences, a direct influence of social benefits on customer loyalty can
be proposed. Empirical evidence for this hypothesis has been established by several studies
on customer loyalty (Chang & Chen, 2007; Hennig‐Thurau et al., 2002; Price & Arnould,
1999, Reynolds & Beatty, 1999). Researchers contend that a strong link exists between the
social aspects of the customer‐provider relationship and customer loyalty. For example,
Berry (1995) suggests that social bonds between customers and employees can be used to
foster customer loyalty. Similarly, Oliver (1999) suggests that customers who are part of a
social organization (which may include both other customers and employees) are more
13 The concept of rapport is closely related to the concept of social benefits as defined here. Gremler and Gwinner (2000, p. 91) denominate positive interactions and personal connections as two common and important facets of rapport.

49
motivated to remain loyal to the given company. Social relationship concepts such as
fondness, tolerance, respect, and rapport (Gremler & Gwinner, 2000) have been found to be
influential in the development of service loyalty (Goodwin & Gremler, 1996). The effect of
social benefits on customer loyalty in the airline industry, moreover, has been substantiated
in a study among Taiwanese airline passengers (Chang & Chen, 2007). In their study
analyzing the relationship between relational benefits and customer loyalty in three classes
of service firms, Hennig‐Thurau et al. (2002) found that social benefits have a significant
influence on commitment and customer loyalty.
Correspondingly, the following hypotheses are formulated:
H10a: Social benefits positively influence customer satisfaction.
H10b: Social benefits positively influence relationship commitment.
H10c: Social benefits positively influence customer loyalty.
5.2.2 Consequences of psychological benefits
Psychological benefits refer to the positive feelings and emotions customers develop from
their relationship with the brand. Confidence in the positive outcomes of the relationship
results in less anxiety and a feeling of safety and comfort when interacting with the brand.
Customers further develop a feeling of trust, that is, a “willingness to rely on an exchange
partner in whom one has confidence” (Moorman et al., 1992, p. 315).
As Berry (1995, p. 242) suggests, “customers who develop trust in service suppliers based on
their experience with them […] have good reasons to remain in these relationships”. Trust is
seen to reduce consumer uncertainty and vulnerability in service relationships (cf. Beatson
et al., 2008, p. 215; Berry, 1995, p. 242). These benefits can create relationship efficiency for
the customer (e.g. through decreased transaction costs) which, in turn, fosters commitment
to the relationship (Garbarino and Johnson, 1999; Hennig‐Thurau et al., 2002; Morgan and
Hunt, 1994; Beatson et al., 2008, p. 215). If customers feel comfortable with the service
brand, they are more likely to develop a positive attachment to the brand. Through the
ongoing relationship, customers know what to expect from the brand and perceived risk and
anxiety decrease. All of these factors affect a customer’s willingness to remain in and refine
the relationship with the brand in the future, that is, psychological benefits are also
proposed to positively influence relationship commitment.

50
Less anxiety about the relationship can also have a positive impact on satisfaction (cf.
Hennig‐Thurau et al., 2002; Beatson et al., 2008, p. 215; Anderson & Narus, 1990). Beatson
et al. (2008, p. 215) propose that customers’ confidence in the honesty and integrity of a
brand are likely to result in increased customer satisfaction with the brand and its
performance. Psychological benefits relate to customers’ knowledge about what to expect
from the airline brand. Based on the confirmation/disconfirmation paradigm, it can be
argued that when the brand meets the customer’s expectation, perceived psychological
benefits lead to customer satisfaction.
Turning again to Berry’s (1995, p. 242) proposition that customers who trust the service
provider will remain in the relationship, it can further be proposed that psychological
benefits have a positive influence on customer loyalty. Accordingly, Chang and Chen (2007)
found that confidence benefits have a positive and significant influence on customer loyalty.
As described in Chapter 4.1.3, a relationship between the customer and the brand develops
through several encounters and interactions over time. The customer’s experience of the
brand as a relationship partner that can be trusted motivates him to continue the interaction
with the brand and, hence, remain in the relationship.
Hennig‐Thurau et al. (2002) emphasize the significance of the link between confidence
benefits and customer satisfaction, as well as between confidence benefits and customer
loyalty. However, in their study, confidence benefits only have an insignificant influence on
commitment. In the business‐to‐business context, on the other hand, Sweeney and Webb
(2007) found the link between psychological benefits and relationship commitment to be
crucial. Beatson et al. (2008), in a study on relationship quality in cross‐sea passenger
transportation, determined that relationship trust affects satisfaction, commitment, and
behavioral intentions.
Correspondingly, the following hypotheses are formulated:
H11a: Psychological benefits positively influence customer satisfaction.
H11b: Psychological benefits positively influence relationship commitment.
H11c: Psychological benefits positively influence customer loyalty.
51
5.2.3 Consequences of functional benefits
Functional benefits relate mainly to rational and economic benefits that customers perceive
to result from their relationship with the airline brand. These include time and cost savings,
convenience, and confidence in the purchase decision.
Hennig‐Thurau et al. (2002, p. 236 referring to Fornell, 1992; Guiltinan, 1989) propose that
cognitive and emotional switching barriers are increased when a company provides
economic incentives to its customers. This, again, can result in increased customer loyalty
and relationship commitment (Selnes, 1993 in: Hennig‐Thurau et al., 2002, p. 236). In the
business‐to‐business context, Sweeney and Webb (2007) identified a strong correlation
between functional benefits and relationship commitment.
With reference to the argument made by Reynolds and Beatty (1999), functional benefits
offered by the brand are perceived as part of the service performance itself.
Correspondingly, the perceived functional benefits, such as cost savings, can be expected to
positively influence customer satisfaction.
Hennig‐Thurau et al. (2002) found that special treatment benefits and commitment are
interlinked.14 The relationship between special treatment benefits and customer satisfaction
and special treatment benefits and customer loyalty could, however, not be verified.
Gwinner et al. (1998) found special treatment benefits to have a positive influence on
relationship marketing outcomes such as loyalty, positive word‐of‐mouth, relationship
continuance, and satisfaction with the service. Analyzing customer‐salesperson relationships
in retail, Reynolds and Beatty (1999) identified a positive relationship between functional
benefits and satisfaction with the sales person.
Correspondingly, the following hypotheses are formulated:
H12a: Functional benefits positively influence customer satisfaction.
H12b: Functional benefits positively influence relationship commitment.
H12c: Functional benefits positively influence customer loyalty.
14 As argued in Chapter 4.2.3.3, the conceptualization of functional benefits in this thesis partly relate to the conceptualization of special treatment benefits as conceptualized by Gwinner et al., 1998 and Hennig‐Thurau et al., 2002.
52
5.3 The influence of relationship quality on customer loyalty
Relationship quality has been described as a concept that mediates the influence of
relational benefits on customer loyalty (see Chapter 4.2.4). In the following section, the
interrelationship between customer satisfaction and relationship commitment, and the
effects of both concepts on customer loyalty are hypothesized.
5.3.1 The influence of customer satisfaction on commitment and customer loyalty
Customer satisfaction here refers to the affective state determined by the evaluation of the
brand’s performance (cf. Zins, 2001, p. 276). It is a judgment of the service brand’s capability
to provide “a pleasurable level of consumption‐related fulfillment, including levels of under
or overfulfillment” (Oliver, 1997, p. 13). Customers are satisfied if the performance meets or
exceeds their expectations prior to consumption. Likewise, they are dissatisfied if the brand
does not meet their expectations.
Customer satisfaction is theoretically and empirically considered to be one of the most
important factors influencing customer loyalty (Garbarino & Johnson, 1999; Heskett et al.,
2008). Customers choose brands that they think can satisfy their needs. If customers
evaluate an airline brand as being capable of meeting the expectations they have raised
prior to consumption, it is presumed that customers are satisfied with the brand. Once
satisfied, customers will choose the same airline for subsequent travels. In line with this
argumentation, Beatson et al. (2008) found that customer satisfaction positively influences
behavioral intentions such as willingness to recommend the brand, positive word‐of‐mouth,
and repurchase intention, i.e. customer loyalty. Park et al. (2006) determined that customer
satisfaction directly influences behavioral intentions, which were measured as the
customer’s willingness to recommend the airline to others and their repurchase intention.
Gwinner et al. (1998) showed that satisfaction with the service provider positively impacts
customer retention. Reynolds and Beatty (1999) demonstrated that satisfaction with a
company was positively linked to loyalty to the company. Hennig‐Thurau et al. (2002) found
that of all constructs hypothesized to influence customer loyalty, satisfaction had the
strongest impact.
Customer satisfaction is further assumed to positively influence customers’ commitment to
their relationship with the airline brand. A high level of satisfaction resulting from the

53
interaction with the airline brand provides repeated positive reinforcement, thereby
creating positive emotional commitment bonds with the brand (cf. Beatson et al., 2008, p.
215; Hennig‐Thurau et al., 2002, p. 237; Hennig‐Thurau & Klee, 1997, p. 753).
Correspondingly, the following hypotheses are formulated:
H13a: Customer satisfaction positively influences relationship commitment.
H13b: Customer satisfaction positively influences customer loyalty.
5.3.2 The influence of relationship commitment on customer loyalty
Commitment relates to a customer’s desire and motivation to continue a valued relationship
with the brand in the future (cf. Moorman et al., 1992, p. 316; Grönroos, 2007, p. 41). It is
seen as a focal relationship construct that precedes customers’ relational behaviors such as
repurchase or positive of word‐of‐mouth communications (Garbarino & Johnson, 1999).
Commitment can be described as customers’ long‐term orientation toward the relationship
with the brand that is grounded in both emotional bonds (Moorman et al., 1992) and the
customer’s conviction that maintaining the relationship in the future will yield higher net
benefits than if the relationship is terminated (Geyskens et al., 1996; Söllner, 1994 in:
Hennig‐Thurau et al., 2002, p. 232). Understanding loyalty as the attitudes and behaviors in
response to commitment (Han et al., 2008, p. 24), it can be assumed that a customer’s
commitment to the relationship with the brand positively influences loyalty. Referring to Kim
et al. (2008) and Punniyamoorthy and Raj (2002, p. 224), commitment can even be
considered a necessity for the evolvement of true brand loyalty.
Beatson et al. (2008) found that relationship commitment positively influences behavioral
intentions. Pritchard et al. (1999) concluded that strong support for commitment was an
important direct antecedent of customer loyalty for airline services. Kim et al.’s (2008)
experimental study involving eight product classes and two involvement levels identified a
strong link between brand commitment and true loyalty.
Correspondingly, the following hypothesis is formulated:
H14: Relationship commitment positively influences customer loyalty.

54
5.4 Graphical illustration of the proposed ACL model
Summarizing the formulated hypotheses, Figure 5 provides a graphical illustration of the ACL
model.
Figure 5: The ACL model
6 Empirical testing of the proposed airline customer loyalty model This chapter describes the empirical testing of the ACL model. The analysis approach, the
data collection method, the operationalization of the model’s constructs, as well as the
analytical results are presented.
6.1 PLS as research method
6.1.1 Selection of PLS as research method
To empirically validate the ACL model developed in the previous chapter for its
transferability to reality, a research method needs to be chosen that is able to accurately
test the model. The method, therefore, needs to be able to analyze logically and
theoretically derived causal relationships between latent (i.e. unobservable) variables.
According to Malhotra and Birks (2007, p. 406) structural equation modeling (SEM), a
statistical technique based on multiple regression and factor analysis, is suitable to test
Social benefits
Psychological benefits
Functional benefits
Customer satisfaction
Country-of-origin
Co-creation of value
Service quality
Perceived value
Trust-worthiness
FFP attractiveness
Brand-self congruence
Social brand performance
Relationship commitment
Customer loyalty
Airline image
55
interrelationships among a set of variables (see also: Pallant, 2001, pp. 91‐92; Haenlein &
Kaplan, 2004, p. 285).
In general, there are two approaches to SEM which can be differentiated according to their
underlying estimation algorithms: covariance‐based approaches (e.g., LISREL, AMOS) and
variance‐based approaches (e.g., PLS) (Jahn, 2007, p. 1; Haenlein & Kaplan, 2004, p. 285).
Based on the differentiation of both approaches according to Jahn (2007; see also: Haenlein
& Kaplan, 2004), the variance‐based PLS approach proves to be the more appropriate
approach for the present analysis: first, besides constructs that are reflectively
operationalized, the ACL model established in Chapter 5 also includes one construct (i.e.
service quality) that is formatively operationalized.15 While PLS basically supports a
formative operationalization of latent variables and therefore can be used for models with
reflective and formative types of indicators (Fornell & Bookstein, 1982, p. 442), covariance‐
based approaches do not accept formative variables (Blunch, 2008, p. 155). Second, in
comparison to covariance‐based approaches, PLS is insensitive to skewed distributions; a
normal distribution of the empirical data is therefore not imperatively required (Fornell &
Bookstein, 1982, p. 443; Huber et al., 2007, p. 10). Third, as previously stated, the present
analysis pursues a managerial perspective and is thus strongly practice‐orientated. Especially
for this reason the variance‐based approach PLS is preferred in this study, since it is
demonstrably the approach with the highest predictive accuracy and, hence, the highest
practical explication (cf. Huber et al., 2007, p. 13; Jahn, 2007, p. 16).
6.1.2 Application of PLS
The partial least squares (PLS) estimation basically consists of three parts. (1) The structural
model (inner model) reflects the relationships between the latent variables (Haenlein &
Kaplan, 2004, p. 290). While latent variables are characterized by abstract, not directly
measurable content, each latent variable needs to be defined by a set of indicators (cf.
Huber et al., 2007, p. 3). (2) The measurement model (outer model) describes how the latent
variables and their manifest indicators (i.e., measurement variables) are connected
(Haenlein & Kaplan, 2004, p. 290; Blunch, 2008, p. 5). (3) Weight relations, which link the
15 See Edwards and Bagozzi (2000) for a more elaborate differentiation between reflective and formative variables.
56
indicators to their respective unobservable variables, are further used to estimate case
values for the latent variables (Chin & Newsted, 1999 in: Haenlein & Kaplan, 2004, p. 290).
In general, indicators can be divided into two groups – reflective and formative variables.
Their differentiation is based on the direction of the relationship between the latent variable
and its respective indicators (Edwards & Bagozzi, 2000, p. 155). Reflective variables mirror
the latent variable (cf. Edwards & Bagozzi, 2000, p. 155). They are caused by the latent
variables and are indirectly affected by exogenous influences on the latent variable (Bollen,
1989 in: Diamantopoulos, 1994, p. 445; Zinnbauer & Eberl, 2004, p. 4). Formative variables,
on the other hand, form the construct (Edwards & Bagozzi, 2000, p. 15), and constitute
conceptual elements of the latent variable (Huber et al., 2007, p. 18). In comparison to
reflective variables, changes in the latent variables are, therefore, caused by their formative
indicators (Haenlein & Kaplan, 2004, p. 288).
Based on the differentiation between the structural model and the measurement model as
well as the two types of indicators, different quality criteria need to be tested in order to
validate the model. Hulland (1999, p. 198) suggests that a PLS model should be analyzed and
interpreted sequentially in two stages: (1) the assessment of the reliability and validity of the
measurement model; and (2) the assessment of the structural model. Appendix 1 discusses
the quality criteria that need to be fulfilled for both stages, respectively.
Compared to covariance‐based structural equation models, there is no overall goodness‐of‐
fit measure for the PLS model. However, based on a summarized validation of the
previously‐mentioned quality criteria, an overall evaluation of the model’s informational
value is possible (cf. Fornell & Bookstein, 1982, p. 450; Huber et al., 2007, p. 43).
6.2 Data collection
While general methodological considerations have been dealt with in Chapter 2, the
following section addresses the particular data collection method chosen. It further
introduces the questionnaire design before providing information about the course of the
data collection and descriptive data of the sample.

57
6.2.1 Internet survey as data collection method
To collect the primary data needed to test the transferability of the hypothesized ACL model
to reality, a self‐administered Internet survey was chosen as the data collection method. This
choice is primarily based on the Internet survey’s inherent advantages compared to other
survey methods such as personal interviewing, telephone interviewing, or mail interviewing
(cf. Malhotra & Birks, 2007, pp. 273‐274). Internet surveys present a cost efficient method to
collect a great amount of data in a relatively short time frame. Furthermore, comparing data
reliability for telephone and Internet‐based surveys, Braunsberger et al. (2007) found that
web panels display higher levels of data reliability than telephone surveys. This effect can be
ascribed to the removed interviewer bias (Malhotra & Birks, 2007, p. 274) for self‐
administered surveys. The lack of an interviewer affords more privacy to the respondents
(Braunsberger et al., 2007, p. 763), which may lead respondents to answer questions more
truthfully. The software‐controlled collection of data further decreases the risk of wrong or
incomplete data. Respondents can be advised of uncompleted questions, for example.
Thereby, the quality of the data is increased (Malhotra & Birks, 2007, p. 274). As data is
already stored in electronic format, the electronic processing of the data is more efficient
and less prone to transmission error (cf. Saunders et al., 2007, p. 358).
The most important limitations to Internet surveys are probably sample representativeness
and issues of sample control and diversification (cf. Prophis, 2002 in: McConkey et al., 2003,
p. 78; Malhotra & Birks, 2007, p. 275). As Internet use has, however, been growing in all
societal segments in the last years, it is already evident that the total population is
increasingly well represented in the community of Internet users (cf. Lütters, 2004, pp. 15).
6.2.2 Questionnaire design
The questionnaire is divided into four parts. First, respondents are introduced to the survey
and informed about its purpose and background. In the context of the introduction,
respondents are advised of the anonymity of their information and instructed that it is their
personal perceptions and opinions that are to be the basis of their answers. Furthermore,
survey participants are advised that they have the opportunity to take part in a drawing for
an iPod nano by providing their email address at the end of the questionnaire. Second,
participants are asked to choose an airline about which they will answer the stated
questions. They are advised to choose an airline they have preferably flown with more than

58
once within the last three years. The self‐selection of the airline was chosen to make sure
that respondents have sufficient knowledge about the airline to answer the survey
questions. The third and major part of the questionnaire addresses questions related to the
concepts in the ACL model. Participants are asked to specify to which degree they agree or
disagree with each statement in a series about the concepts in the model (for the
operationalization of the concepts, see Chapter 6.3). A 7‐point Likert scale was chosen as the
rating scale, ranging from ‘strongly agree’ to ‘strongly disagree’. It was chosen in order to
give respondents a wide enough range, on the one hand, but to not overwhelm respondents
with too many answer possibilities, on the other hand (cf. Saunders et al., 2007, p. 372).
Fourth, respondents were asked to provide information about their general travel habits
with respect to air transport and some information on their socio‐demographic background.
The questionnaire designed for the study is available in Appendix 2.
6.2.3 Course of data collection and descriptive data of sample
To make sure that the questionnaire was easy to understand and fill in, a pretest was
conducted in the period from January 30 to February 03, 2009. In total, 8 people
participated in the pre‐test with most of the participants aged between 20 and 35 years. To
ensure that the questionnaire was also easy to fill in for older respondents, 2 persons older
than 60 years were asked to take part in the pre‐test. Furthermore, half of the testers were
chosen because of their regular flying habits, while the other half were fairly inexperienced
with regard to the airline industry in general. The selection of pre‐testers was made in order
to cover a wide variety of respondents, which was anticipated in the actual sample.
The sampling for the survey took place as a combination of targeted emails and a snowball
procedure (cf. Malhotra, 2007, p. 414). The link including a short introduction and the
request to participate was posted on several online platforms and was also sent via email. In
the field time, between February 15, 2009 and February 20, 2009, a total of 276 respondents
participated in the survey. An overview of the socio‐demographic distribution of the
respondents and their particular travel habits is provided in Appendix 3.
The sample indicates an almost even distribution between female (51.1%) and male (48.9%)
respondents. Two thirds of the survey participants belonged to the age range between 20
and 29 years, indicating an overrepresentation of young participants. Corresponding to the
age distribution, 43.1% indicated that they were students while 27.9% were company

59
employees. With respect to the information regarding travel habits, 72.8% claimed that they
primarily travelled on leisure while 27.2% stated that their primary reason for air travel was
business. These numbers almost correspond to Hanlon’s (2007, p. 35) 80/20 breakdown
between leisure and business airline passengers (see Chapter 3.3). Interestingly, 80% of
respondents indicated that they traveled by air at least once every 6 months (52.9% travel
by air at least once every 3 months), which emphasizes that respondents had profound
knowledge of and experience with airline travel.
In summary, it can be concluded that the sample indicates an overrepresentation of young
participants and students. Due to the high level of the overall sample quality, it should not
be overvalued, but must be kept in mind when interpreting the findings.
6.3 Operationalization of constructs and validation of measurement model
In the following, the operationalization of the constructs included in the ACL model is
described. A number of studies previously conducted by other authors have been reviewed
in order to compile measurement scales that suit the measurement of the integrated
constructs. These items were either directly adopted or adapted to the present study. If no
measurement items could be found to accurately measure the respective construct, new
indicators were created. A compilation of the measurement scales reviewed is provided in
Appendix 4.
Prior to the estimation of the ACL model with smartPLS, an exploratory factor analysis was
conducted in SPSS. The results are briefly discussed in Chapter 6.3.1 before the
operationalization of the constructs and the validity of the measurement model is analyzed
in Chapters 6.3.2 to 6.3.6.
6.3.1 Exploratory factor analysis
An exploratory factor analysis was conducted to examine to what extent the formulated
questionnaire items are related to the latent constructs of the ACL model (cf. Byrne, 1998,
p. 6). Factor analysis can only be conducted for reflective variables (cf. Fornell & Bookstein,
1982, p. 441). As service quality is defined by formative indicators, it is left out of the
exploratory factor analysis. Aside from the items measuring airline image, social brand
performance, and functional benefits, all other questionnaire items could be allocated to the
construct they were intended to measure. A list of the measurement items is provided in
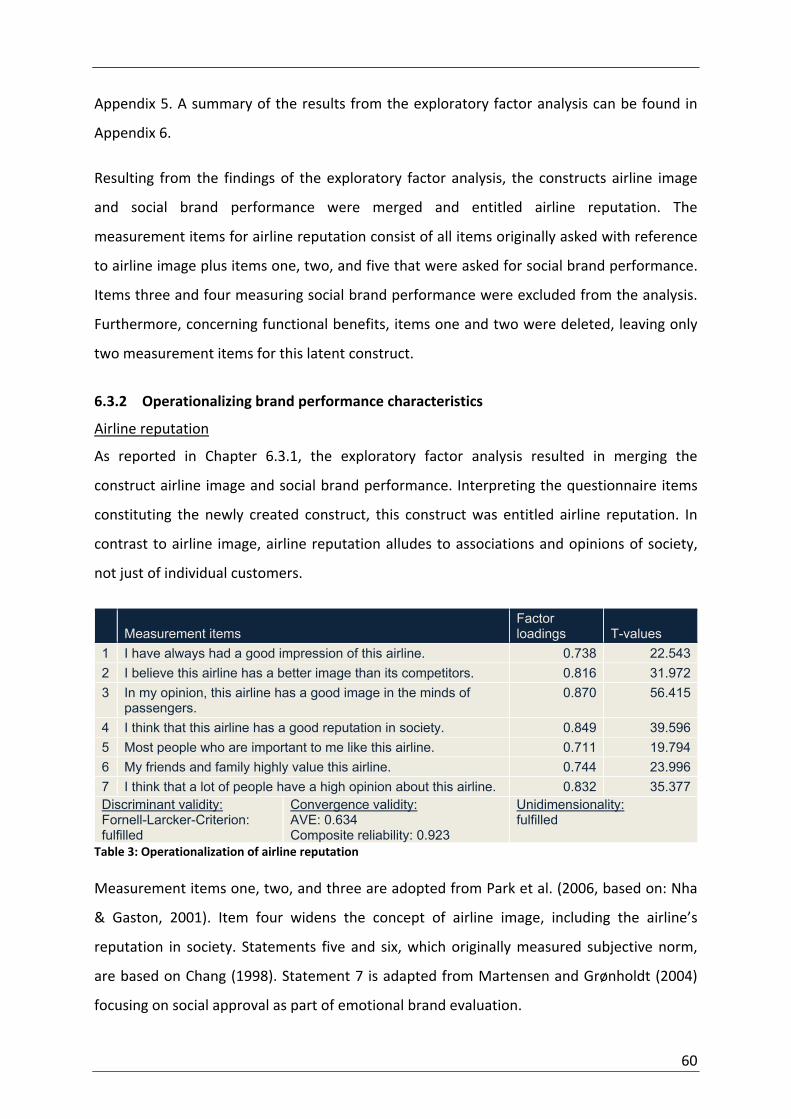
60
Appendix 5. A summary of the results from the exploratory factor analysis can be found in
Appendix 6.
Resulting from the findings of the exploratory factor analysis, the constructs airline image
and social brand performance were merged and entitled airline reputation. The
measurement items for airline reputation consist of all items originally asked with reference
to airline image plus items one, two, and five that were asked for social brand performance.
Items three and four measuring social brand performance were excluded from the analysis.
Furthermore, concerning functional benefits, items one and two were deleted, leaving only
two measurement items for this latent construct.
6.3.2 Operationalizing brand performance characteristics
Airline reputation
As reported in Chapter 6.3.1, the exploratory factor analysis resulted in merging the
construct airline image and social brand performance. Interpreting the questionnaire items
constituting the newly created construct, this construct was entitled airline reputation. In
contrast to airline image, airline reputation alludes to associations and opinions of society,
not just of individual customers.
Measurement items
Factor loadings T-values
1 I have always had a good impression of this airline. 0.738 22.5432 I believe this airline has a better image than its competitors. 0.816 31.9723 In my opinion, this airline has a good image in the minds of
passengers. 0.870 56.415
4 I think that this airline has a good reputation in society. 0.849 39.5965 Most people who are important to me like this airline. 0.711 19.7946 My friends and family highly value this airline. 0.744 23.9967 I think that a lot of people have a high opinion about this airline. 0.832 35.377Discriminant validity: Fornell-Larcker-Criterion: fulfilled
Convergence validity: AVE: 0.634 Composite reliability: 0.923
Unidimensionality: fulfilled
Table 3: Operationalization of airline reputation
Measurement items one, two, and three are adopted from Park et al. (2006, based on: Nha
& Gaston, 2001). Item four widens the concept of airline image, including the airline’s
reputation in society. Statements five and six, which originally measured subjective norm,
are based on Chang (1998). Statement 7 is adapted from Martensen and Grønholdt (2004)
focusing on social approval as part of emotional brand evaluation.
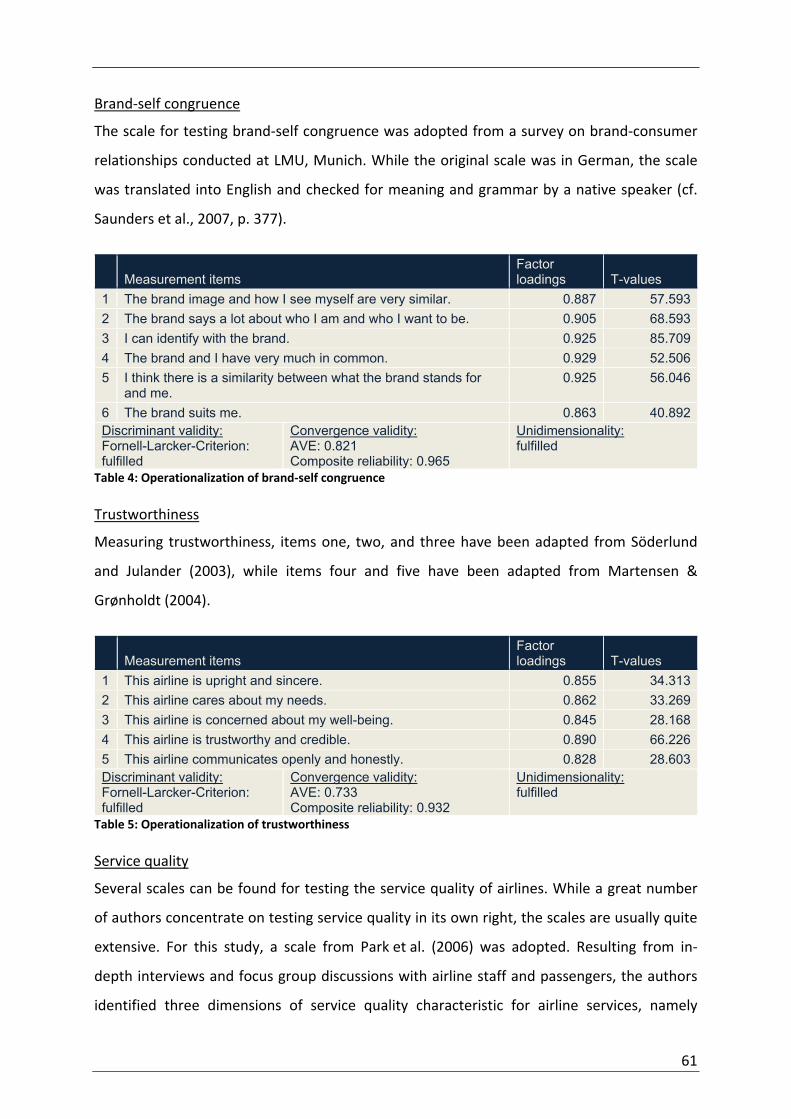
61
Brand‐self congruence
The scale for testing brand‐self congruence was adopted from a survey on brand‐consumer
relationships conducted at LMU, Munich. While the original scale was in German, the scale
was translated into English and checked for meaning and grammar by a native speaker (cf.
Saunders et al., 2007, p. 377).
Measurement items
Factor loadings T-values
1 The brand image and how I see myself are very similar. 0.887 57.5932 The brand says a lot about who I am and who I want to be. 0.905 68.5933 I can identify with the brand. 0.925 85.7094 The brand and I have very much in common. 0.929 52.5065 I think there is a similarity between what the brand stands for
and me. 0.925 56.046
6 The brand suits me. 0.863 40.892Discriminant validity: Fornell-Larcker-Criterion: fulfilled
Convergence validity: AVE: 0.821 Composite reliability: 0.965
Unidimensionality: fulfilled
Table 4: Operationalization of brand‐self congruence
Trustworthiness
Measuring trustworthiness, items one, two, and three have been adapted from Söderlund
and Julander (2003), while items four and five have been adapted from Martensen &
Grønholdt (2004).
Measurement items
Factor loadings T-values
1 This airline is upright and sincere. 0.855 34.3132 This airline cares about my needs. 0.862 33.2693 This airline is concerned about my well-being. 0.845 28.1684 This airline is trustworthy and credible. 0.890 66.2265 This airline communicates openly and honestly. 0.828 28.603Discriminant validity: Fornell-Larcker-Criterion: fulfilled
Convergence validity: AVE: 0.733 Composite reliability: 0.932
Unidimensionality: fulfilled
Table 5: Operationalization of trustworthiness
Service quality
Several scales can be found for testing the service quality of airlines. While a great number
of authors concentrate on testing service quality in its own right, the scales are usually quite
extensive. For this study, a scale from Park et al. (2006) was adopted. Resulting from in‐
depth interviews and focus group discussions with airline staff and passengers, the authors
identified three dimensions of service quality characteristic for airline services, namely

62
‘reliability and customer service’, ‘in‐flight service’, and ‘convenience and accessibility’. The 3
measurement items with the highest values within each dimension have been selected to
measure airline service quality in the present survey.
Measurement items Weights T-values 1 The employees of this airline are willing to help passengers. 0.181 1.8292 The employees of this airline are able to answer passengers’
questions in a satisfactory way. 0.152 1.765
3 The employees of this airline give passengers personal attention.
0.125 1.315
4 This airline offers high seating comfort. 0.143 1.4525 This airline offers great meal service. 0.259 2.6186 This airline offers great in-flight entertainment. 0.001 0.0117 The reservation and ticketing is prompt and accurate. 0.277 2.8138 The check-in service of this airline is very good. 0.086 0.8219 This airline offers a convenient flight schedule. 0.190 2.725Discriminant validity: Composite correlation < 0.9: fulfilled
Multicollinearity: Variance inflation factor (VIF) < 10: fulfilled
Table 6: Operationalization of service quality
Perceived value
The measurement items for perceived value are directly adopted from Park et al. (2006).
Measurement items
Factor loadings T-values
1 Considering the services that this airline offers, they are worth what I pay for them.
0.953 87.260
2 The ticket price of this airline is reasonable. 0.951 80.679Discriminant validity: Fornell-Larcker-Criterion: fulfilled
Convergence validity: AVE:0.906 Composite reliability: 0.951
Unidimensionality: fulfilled
Table 7: Operationalization of perceived value
Co‐creation of value
Rajah et al. (2008) argue that, while the idea of value co‐creation has been conceptually
discussed by a number of authors, their study is the first to support it empirically. Of the
three measurement items proposed by the authors, only item one was adopted from their
study. Items two to seven have been developed for this study. They relate to the
understanding of value co‐creation as has been elaborated in Chapter 4.2.1.
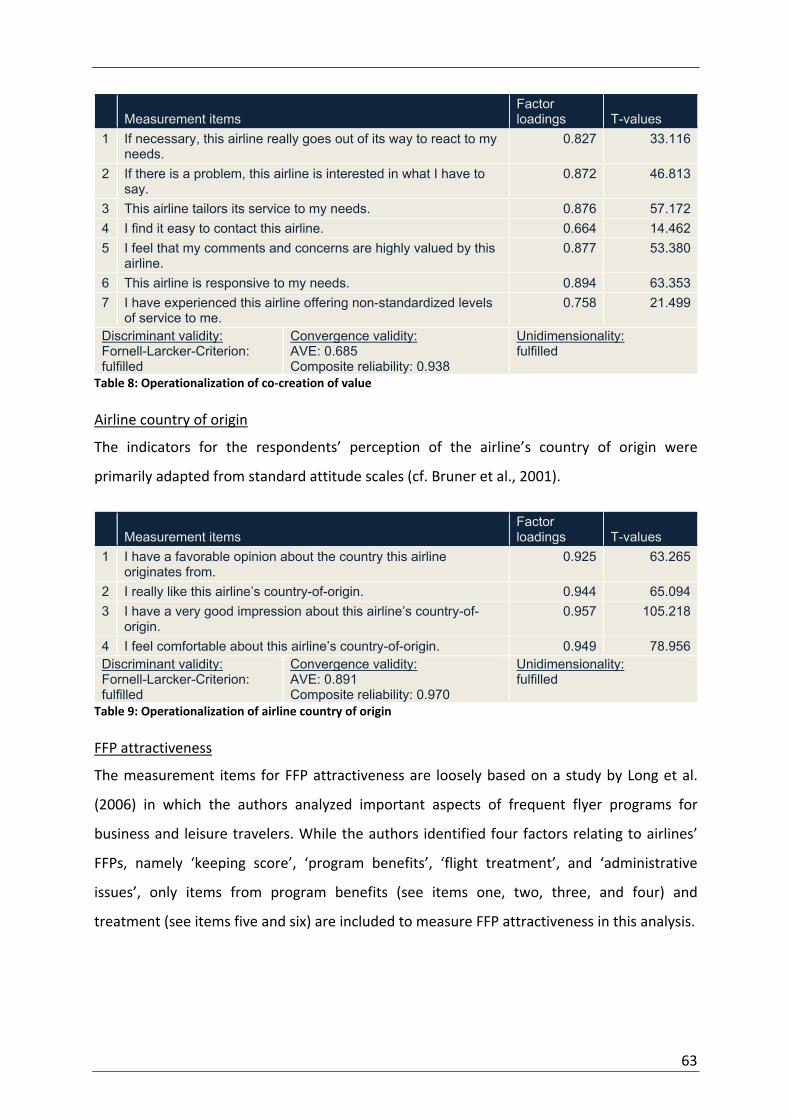
63
Measurement items
Factor loadings T-values
1 If necessary, this airline really goes out of its way to react to my needs.
0.827 33.116
2 If there is a problem, this airline is interested in what I have to say.
0.872 46.813
3 This airline tailors its service to my needs. 0.876 57.1724 I find it easy to contact this airline. 0.664 14.4625 I feel that my comments and concerns are highly valued by this
airline. 0.877 53.380
6 This airline is responsive to my needs. 0.894 63.3537 I have experienced this airline offering non-standardized levels
of service to me. 0.758 21.499
Discriminant validity: Fornell-Larcker-Criterion: fulfilled
Convergence validity: AVE: 0.685 Composite reliability: 0.938
Unidimensionality: fulfilled
Table 8: Operationalization of co‐creation of value
Airline country of origin
The indicators for the respondents’ perception of the airline’s country of origin were
primarily adapted from standard attitude scales (cf. Bruner et al., 2001).
Measurement items
Factor loadings T-values
1 I have a favorable opinion about the country this airline originates from.
0.925 63.265
2 I really like this airline’s country-of-origin. 0.944 65.0943 I have a very good impression about this airline’s country-of-
origin. 0.957 105.218
4 I feel comfortable about this airline’s country-of-origin. 0.949 78.956Discriminant validity: Fornell-Larcker-Criterion: fulfilled
Convergence validity: AVE: 0.891 Composite reliability: 0.970
Unidimensionality: fulfilled
Table 9: Operationalization of airline country of origin
FFP attractiveness
The measurement items for FFP attractiveness are loosely based on a study by Long et al.
(2006) in which the authors analyzed important aspects of frequent flyer programs for
business and leisure travelers. While the authors identified four factors relating to airlines’
FFPs, namely ‘keeping score’, ‘program benefits’, ‘flight treatment’, and ‘administrative
issues’, only items from program benefits (see items one, two, three, and four) and
treatment (see items five and six) are included to measure FFP attractiveness in this analysis.

64
Measurement items
Factor loadings T-values
1 This airline’s frequent flyer program is very attractive. 0.811 18.6192 This airline’s frequent flyer program offers desirable benefits. 0.855 22.7583 It is easy to redeem benefits earned from this airline’s frequent
flyer program. 0.803 19.614
4 This airline’s frequent flyer program helps me reduce the cost of air travel.
0.713 12.835
5 This airline’s frequent flyer program treats members better than other travelers who do not belong to the program.
0.754 11.981
6 Being a member of this airline’s frequent flyer program makes me feel special.
0.779 20.453
Discriminant validity: Fornell-Larcker-Criterion: fulfilled
Convergence validity: AVE: 0.891 Composite reliability: 0.970
Unidimensionality: fulfilled
Table 10: Operationalization of FFP attractiveness
6.3.3 Operationalizing relational benefits
Social benefits
As previously discussed in Chapter 4.2.3.1, in this study social benefits are considered to
have a much broader meaning compared to Gwinner et al.’s (1998) original description.
While measurement item one is adapted from LaBahn’s definition of social rapport as “the
client’s perception that the personal relationships have the right chemistry and are
enjoyable“, the remaining measurement items of social benefits have been developed for
this study based on the definition of social benefits predominant in this thesis.
Measurement items
Factor loadings T-values
1 The interaction with this airline and its employees is enjoyable. 0.698 19.0812 Dealing with this airline’s employees gives me a sense of
harmony. 0.817 37.497
3 Traveling with this airline, I perceive a feeling of familiarity. 0.796 28.4134 This airline emphasizes my role in society. 0.884 63.2955 This airline complements my social status. 0.858 48.8886 This airline supports my lifestyle. 0.792 28.947Discriminant validity: Fornell-Larcker-Criterion: fulfilled
Convergence validity: AVE: 0.656 Composite reliability: 0.919
Unidimensionality: fulfilled
Table 11: Operationalization of social benefits
Psychological benefits
As mentioned in Chapter 4.2.3.2, psychological benefits relate to the customers’ positive
feelings and emotions derived from the relationship with the brand. Since these include the
confidence benefits defined by Gwinner et al. (1998), some of the measurement items are
adopted from confidence benefit measurements adopted in related studies. For example,

65
measurement items one, two, and three are adopted from Chang and Chen (2007) who
analyzed the influence of confidence benefits on switching barriers and customer loyalty
among airline customers in Taiwan. Measurement items one and two have similarly been
used to measure psychological benefits in the B2B context by Sweeney and Webb (2007).
Measurement items four, five and six are adapted from Gwinner et al.’s (1998) confidence
benefit measurements, where item five has also been used by Sweeney and Webb (2007) to
measure psychological benefits. Item seven has been added to place more emphasis on the
feeling of security and comfort that characterizes the definition of psychological benefits in
this thesis.
Measurement items
Factor loadings T-values
1 I feel I can trust this airline. 0.803 23.7012 I am less worried when I fly with this airline. 0.879 51.2903 I am confident that the service will be performed correctly by
this airline. 0.829 33.936
4 I believe there is less risk that something will go wrong. 0.873 45.2285 I know what to expect from this airline. 0.724 13.5346 I have less anxiety when I buy a ticket for this airline. 0.801 27.7147 I feel secure and comfortable with this airline. 0.887 50.962Discriminant validity: Fornell-Larcker-Criterion: fulfilled
Convergence validity: AVE: 0.688 Composite reliability: 0.939
Unidimensionality: fulfilled
Table 12: Operationalization of psychological benefits
Functional benefits
As has been discussed in Chapter 6.3.1, two of the original measurement items regarding
functional benefits have been removed based on the results of the exploratory factor
analysis conducted prior to the calculation in smartPLS. The remaining measurement items
for functional benefits are loosely based on Reynolds and Beatty (1999) and Paul et al.
(2009). Special emphasis is put on the rational and economic benefits which characterize
functional benefits.
Measurement items
Factor loadings T-values
1 Compared to other airlines, I have the feeling to save money when I buy a ticket for this airline.
0.738 10.222
2 It is easy and convenient to use this airline. 0.867 19.810Discriminant validity: Fornell-Larcker-Criterion: fulfilled
Convergence validity: AVE: 0.648 Composite reliability: 0.785
Unidimensionality: fulfilled
Table 13: Operationalization of functional benefits

66
6.3.4 Operationalizing relationship quality
Customer satisfaction
Customer satisfaction is measured adapting Hennig‐Thurau et al.’s (2002) measurement
items to the airline context (items one to four). Additional items measuring customers’
satisfaction in relation to their previous expectations (item five) (cf. Han et al., 2008, p. 39)
and in comparison to the airline’s competitors (item six) (cf. Zhang & Bloemer, 2008) have
further been included.
Measurement items
Factor loadings T-values
1 Overall, I am very satisfied with this airline. 0.821 30.9402 I am always delighted with this airline’s service. 0.819 31.6463 It is wise of me to fly with this airline. 0.807 31.5054 I think I do the right thing when I decide to use this airline. 0.840 36.6085 My experiences with this airline exceed my expectations. 0.784 26.8296 In comparison to other airlines, I am very satisfied with this
airline. 0.849 43.228
Discriminant validity: Fornell-Larcker-Criterion: fulfilled
Convergence validity: AVE: 0.673 Composite reliability: 0.925
Unidimensionality: fulfilled
Table 14: Operationalization of customer satisfaction
Relationship commitment
All of the items measuring customers’ relationship commitment have been adopted from
Hennig‐Thurau et al.’s (2002) study.
Measurement items
Factor loadings T-values
1 I am very committed to my relationship to this airline. 0.863 52.3652 My relationship to this airline is very important to me. 0.963 181.0343 I really care about my relationship to this airline. 0.953 126.9734 My relationship to this airline deserves my maximum effort to
maintain. 0.912 66.887
Discriminant validity: Fornell-Larcker-Criterion: fulfilled
Convergence validity: AVE: 0.853 Composite reliability: 0.959
Unidimensionality: fulfilled
Table 15: Operationalization of relationship commitment
6.3.5 Operationalizing customer loyalty
To give consideration to both the attitudinal and the behavioral aspect of customer loyalty,
the measurement items for customer loyalty include both dimensions. Items one and two
relate to positive word‐of‐mouth and willingness to recommend the brand. Items three and
four measure the customers’ repurchase intention (i.e. the customers’ intention to utilize
the service of the airline again). All items are adapted from Nadiri et al. (2008). In addition,

67
measurement item five is included to measure the customer’s overall loyalty towards the
airline.
Measurement items
Factors loadings T-values
1 I say positive things about this airline to others. 0.866 44.3402 I recommend this airline to others. 0.871 47.9433 I consider this airline the first choice for air transport. 0.857 43.5914 I will consider this airline for air transport in the next few years. 0.759 25.6565 I consider myself to be loyal to this airline. 0.813 35.731Discriminant validity: Fornell-Larcker-Criterion: fulfilled
Convergence validity: AVE: 0.696 Composite reliability: 0.920
Unidimensionality: fulfilled
Table 16: Operationalization of customer loyalty
6.3.6 Validation of measurement model
The validity assessment of the measurement model is based on the previously mentioned
quality criteria that need to be fulfilled (see Chapter 6.1.2 and Appendix 1).
Except from one reflective indicator for the latent variable co‐creation of value (0.664) and
one reflective indicator for social benefits (0.698), all reflective indicators have loadings
above 0.7. However, as the values of both indicators are close to 0.7 and both their t‐values
well exceed the threshold of 1.66, they still fulfill the item reliability requirements. For the
latent variables brand‐self congruence, trustworthiness, country of origin, perceived value as
well as commitment the loadings of all reflective indicators exceed 0.8. The t‐values for all
reflective indicators are well above 1.66. Furthermore, all values for the AVE as well as the
composite reliability are above 0.6 and 0.7, respectively. Therefore, convergent validity for
all latent variables with reflective indicators is achieved. With respect to the extent to which
the latent variables differ from each other, Table 46 (in Appendix 7) presents the results of
the discriminant analysis. The Fornell‐Larcker‐Criterion is fulfilled for all latent variables,
indicating discriminant validity. The performance of an exploratory factor analysis prior to
the analysis with smartPLS has already assured that unidimensionality exists.
Within the measurement model, service quality is the only latent variable defined by
formative indicators. Two of the indicators, regarding in‐flight entertainment and check‐in
service have very low weightings and t‐values, while the respective values are acceptable for
the rest of the indicators. However, indicators cannot easily be eliminated as this would
change the structure of the construct (Bollen & Lenox, 1991, p. 308). Therefore, both
indicators are retained. The correlations between service quality and all other latent

68
variables are well below 0.9 (see Table 47 in Appendix 7). Therefore, the criterion for
discriminant validity is fulfilled. With a calculated VIF below 10 for all formative variables,
there is not multicollinearity among the indicators (see Table 48 in Appendix 7).
6.4 Validation of structural model and sub‐group comparison
Based on the validation of the measurement model, the construct relationships postulated
in Chapter 5, have to be assessed with respect to their nomological validity. The path
coefficients, t‐values and signs of the parameters function as criteria upon which the
formulated hypotheses are either accepted or rejected. Table 17 summarizes the results of
the hypothesis testing. A graphical illustration of the structural model is provided in Figure
10 (in Appendix 8).
Hypothesis Path coefficients T-values Result
Total effects
H1,2a Airline reputation → Social benefit 0.128 2.392 accepted H1,2b Airline reputation → Psychological benefit 0.237 3.832 accepted H3a Brand-self congruence → Social benefit 0.400 8.857 accepted H3b Brand-self congruence → Psychological benefit -0.041 0.675 rejected H4a Trustworthiness → Psychological benefit 0.306 4.223 accepted H4b Trustworthiness → Functional benefit -0.054 0.811 rejected H5a Service quality → Social benefit 0.133 2.012 accepted H5b Service quality → Psychological benefit 0.215 2.994 accepted H5c Service quality → Functional benefit 0.111 0.910 rejected H6a Perceived value → Social benefit 0.120 3.001 accepted H6b Perceived value → Functional benefit 0.566 8.070 accepted H7a Co-creation of value → Social benefit 0.250 3.658 accepted H7b Co-creation of value → Psychological benefit 0.098 1.211 rejected H8a Country of origin → Psychological benefit 0.125 2.599 accepted H8b Country of origin → Functional benefit 0.085 1.530 rejected H9a FFP attractiveness → Social benefit 0.078 2.091 accepted H9b FFP attractiveness → Functional benefit 0.049 0.883 rejected H10a Social benefit → Satisfaction 0.399 8.785 accepted H10b Social benefit → Commitment 0.501 7.050 accepted H10c Social benefit → Loyalty -0.060 0.873 rejected 0.283H11a Psychological benefit → Satisfaction 0.343 7.715 accepted H11b Psychological benefit → Commitment 0.144 2.135 accepted H11c Psychological benefit → Loyalty 0.154 2.814 accepted 0.366H12a Functional benefit → Satisfaction 0.303 7.127 accepted H12b Functional benefit → Commitment -0.012 0.226 rejected H12c Functional benefit → Loyalty 0.131 2.919 accepted 0.276H13a Satisfaction → Commitment 0.042 0.589 rejected H13b Satisfaction → Loyalty 0.481 6.665 accepted H14 Commitment → Loyalty 0.291 5.915 accepted
Table 17: Hypothesis testing for the ACL model
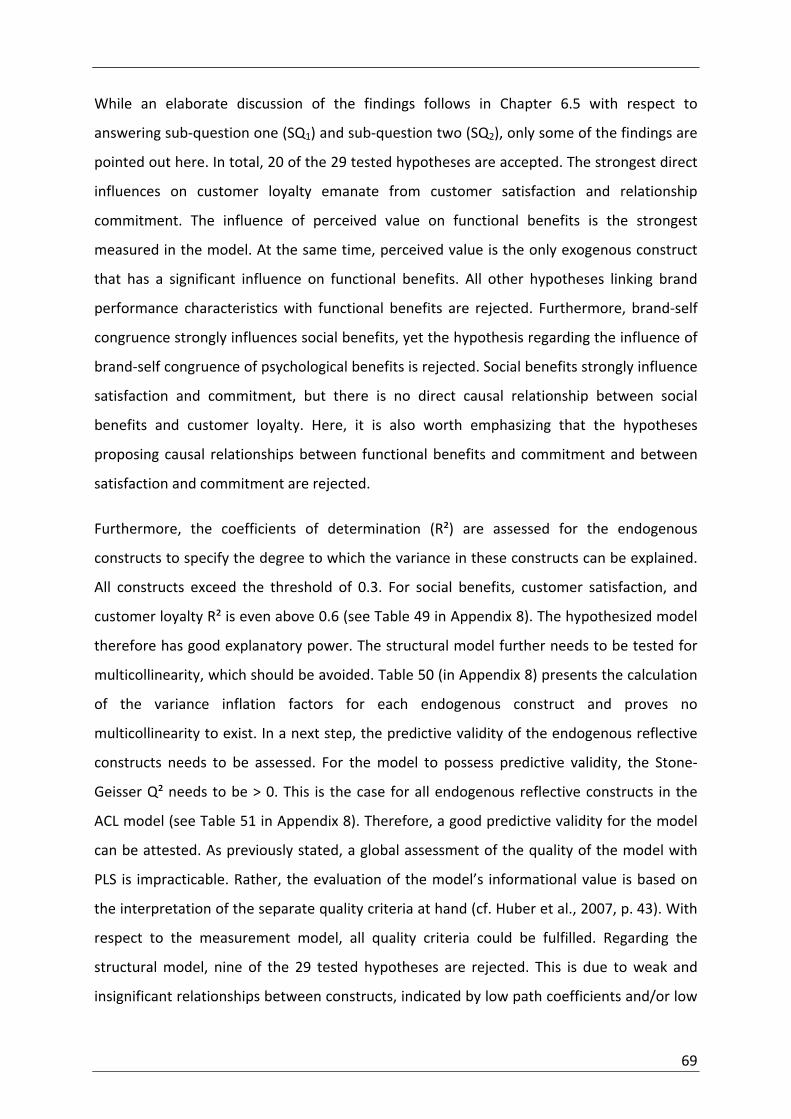
69
While an elaborate discussion of the findings follows in Chapter 6.5 with respect to
answering sub‐question one (SQ1) and sub‐question two (SQ2), only some of the findings are
pointed out here. In total, 20 of the 29 tested hypotheses are accepted. The strongest direct
influences on customer loyalty emanate from customer satisfaction and relationship
commitment. The influence of perceived value on functional benefits is the strongest
measured in the model. At the same time, perceived value is the only exogenous construct
that has a significant influence on functional benefits. All other hypotheses linking brand
performance characteristics with functional benefits are rejected. Furthermore, brand‐self
congruence strongly influences social benefits, yet the hypothesis regarding the influence of
brand‐self congruence of psychological benefits is rejected. Social benefits strongly influence
satisfaction and commitment, but there is no direct causal relationship between social
benefits and customer loyalty. Here, it is also worth emphasizing that the hypotheses
proposing causal relationships between functional benefits and commitment and between
satisfaction and commitment are rejected.
Furthermore, the coefficients of determination (R²) are assessed for the endogenous
constructs to specify the degree to which the variance in these constructs can be explained.
All constructs exceed the threshold of 0.3. For social benefits, customer satisfaction, and
customer loyalty R² is even above 0.6 (see Table 49 in Appendix 8). The hypothesized model
therefore has good explanatory power. The structural model further needs to be tested for
multicollinearity, which should be avoided. Table 50 (in Appendix 8) presents the calculation
of the variance inflation factors for each endogenous construct and proves no
multicollinearity to exist. In a next step, the predictive validity of the endogenous reflective
constructs needs to be assessed. For the model to possess predictive validity, the Stone‐
Geisser Q² needs to be > 0. This is the case for all endogenous reflective constructs in the
ACL model (see Table 51 in Appendix 8). Therefore, a good predictive validity for the model
can be attested. As previously stated, a global assessment of the quality of the model with
PLS is impracticable. Rather, the evaluation of the model’s informational value is based on
the interpretation of the separate quality criteria at hand (cf. Huber et al., 2007, p. 43). With
respect to the measurement model, all quality criteria could be fulfilled. Regarding the
structural model, nine of the 29 tested hypotheses are rejected. This is due to weak and
insignificant relationships between constructs, indicated by low path coefficients and/or low

70
t‐values respectively. However, satisfactory values for R² and Q² attest the model good
explanatory and predictive power.
In addition to the estimation of the ACL model for the entire sample, the model has also
been estimated for two sub‐groups. As discussed in Chapter 3.3, ‘reason for travel’ presents
an important situational factor along which airline customers are segmented. Respondents,
therefore, have been divided according to their primary reason for air travel. The sub‐group
of business travelers consists of 75 respondents, while respondents that primarily take
leisure trips account for 201 of the total sample. Prior to the sub‐group comparison, an
estimation of the structural model took place for each sub‐group separately. The validation
of the measurement model can be waived, since its validity has already been assessed with
respect to the entire sample. For the validation of the structural model for each sub‐group,
only the path coefficients, t‐values, R², and Stone‐Geisser Q² need to be considered.
Analyzing differences between the sub‐groups, four different constellations are possible.
Table 52 in Appendix 9 provides an overview of these constellations and further summarizes
the criteria that need to be fulfilled to make valid statements about the significance of
differences between the sub‐groups. The results of the sub‐group comparison are
summarized in Table 53, 54, and 55 (in Appendix 9). A graphical illustration of the differences
in the model according to ‘reason for travel’ is provided in Figure 11 (in Appendix 9). A
discussion of the findings is pursued in Chapter 6.5 with respect to answering sub question
three (SQ3).
6.5 Discussion of empirical findings
In this chapter, the empirical findings briefly presented in the previous section are discussed
with regard to their contribution to the understanding of drivers of customer loyalty in the
airline industry. The following discussion corresponds to the research sub‐questions one,
two, and three formulated in Chapter 1.2. A global contemplation of the findings concludes
the chapter.
SQ1: How do relational benefits affect customer loyalty toward a specific airline brand?

71
Relational benefits have been argued to be motivating drivers for customers to engage in
long‐term relationships with service providers, eventually leading to customer loyalty. The
assumption that relational benefits significantly influence customer loyalty in the airline
industry is generally confirmed by the empirical results. They indicate that psychological
benefits (p=0.154) and functional benefits (p=0.131) have considerable direct influence on
customer loyalty. Although widely supported theoretically and empirically in the literature
(see Chapter 5.2.1), the direct influence of social benefits on customer loyalty is not
confirmed in this study. Instead, a strong indirect influence mediated by the dimensions of
relationship quality is confirmed: social benefits significantly influence relationship
commitment (p=0.501) and customer satisfaction (p=0.399), which both, in turn, significantly
impact customer loyalty (satisfaction, p=0.481; commitment, p=0.291). Therefore, through
the constructs satisfaction and commitment, social benefits’ total effect on customer loyalty
is significant (p=0.283). The strongest total effect of relational benefits on customer loyalty
derive from psychological benefits (p=0.366). Since the consumption of services is connected
to relatively high risks and uncertainty (see Chapter 4.2.1), trust in the service provider plays
a crucial role. The measured importance of psychological benefits, therefore, reflects their
theoretical weight and, hence, emphasizes the nomological validity of the ACL model.
Further empirical evidence for the model’s high explanatory power lies within the high R2 of
customer loyalty, which indicates that 64.5% of the measured variance of customer loyalty
can be explained by the ACL model. Eliminating the relationship quality dimensions
satisfaction and commitment, the explained variance decreases to 51.5%, thereby further
highlighting the conceptual significance of relationship quality for the customer loyalty
model.
Of all three types of relational benefits, social benefits have the strongest effect on both
relationship quality dimensions. While their influence is stronger on commitment than on
satisfaction, both psychological and functional benefits have considerable influence on
satisfaction, with functional benefits exhibiting no significant influence on commitment. A
possible explanation for these findings lies in the conceptualization of relationship quality in
Chapter 4.2.4: customer satisfaction can loosely be described as the result of met
expectations. That is, customers are satisfied with their relationship with the brand, if it
produces the outcomes they expect from it. Satisfaction, therefore, focuses on the

72
evaluation and assessment of the customer‐brand relationship’s outcomes. The perception
of social, psychological, and functional benefits resulting from the relationship with the
brand determines whether customers are satisfied.
In contrast, relationship commitment relates to the evaluation of the relationship itself. It
can result from the assessment of the interactions that take place and which constitute the
relationship, rather than from the appraisal of the outcomes of this relationship as perceived
by the customer. The interaction with the brand is an important element in the
conceptualization of social benefits, hence, the particularly strong influence of social
benefits on relationship commitment. In contrast, functional benefits are strictly focused on
rational aspects of the relationship with the brand. The evaluation of the relationship as
such, detached from its outcome, plays only an inferior role for perceived functional
benefits, thus implying that the relationship between functional benefits and commitment is
insignificant. In comparison, the perception of psychological benefits requires some degree
of positive assessment of the interaction with the brand. Consequently, an impact of
psychological benefits on commitment can be measured – albeit smaller than the observed
influence of social benefits. Based on this conceptual distinction of satisfaction and
commitment – the first being particularly outcome‐oriented, while the latter is particularly
relationship‐oriented – the rejection of the hypothesis proposing a link between customer
satisfaction and relationship commitment can also be explained.
With respect to SQ1, the following main findings can be summarized: relational benefits
positively affect customer loyalty directly and through the two relationship quality
dimensions, customer satisfaction and relationship commitment, which act as mediating
constructs. Due to their conceptual differences, specific influential paths for each of the
relational benefits for customer loyalty can be distinguished: While psychological and
functional benefits have a significant direct influence on customer loyalty, no direct link
between social benefits and customer loyalty is evident. However, social benefits exhibit
significant indirect influence on customer loyalty through satisfaction and commitment. All
three types of relational benefits reveal a significant influence on satisfaction, while social
benefits are in particular causally associated with commitment. Regarding the three types of
relational benefits, the strongest total influence on customer loyalty derives from
psychological benefits, followed by social and functional benefits, respectively. Including the
73
relationship quality dimensions, satisfaction and commitment, the model explains 64.5% of
the variance in customer loyalty – thereby verifying its high explanatory power.
As discussed in the previous section, relational benefits constitute important drivers of
customer loyalty. To reiterate, relational benefits result from the interaction with the brand
and the evaluation of the airline brand’s specific performance characteristics. The following
section discusses the influence of airline brand performance characteristics on relational
benefits.
66% of the variance in social benefits is explained by brand‐self congruence (p=0.4), co‐
creation of value (p=0.25), service quality (p=0.133), airline reputation (0.128), perceived
value (p=0.12), and FFP attractiveness (p=0.078). While all of the hypotheses concerning the
influence of brand performance characteristics on social benefits are confirmed, two key
determinants of social benefits come to light: With comparatively high path coefficients,
brand‐self congruence and co‐creation of value constitute the main influencing factors of
social benefits. At the same time, the postulated influence of these two brand performance
variables on psychological benefits are rejected, presenting them as specific determinants of
social benefits. Accordingly, customers seem to choose brands that are perceived as being
similar to their self‐concept, i.e., a brand is not chosen for its ability to meet the customer’s
intrinsic needs but rather for its ability to express and communicate the customer’s identity
to his social environment. Similarly, customers’ impression of being valued by the airline
brand as an active partner in the value creation process seems to positively influence the
perception of social benefits that arise from this relationship. Thereby, both brand‐self
congruence and value co‐creation are results of an interactive process between the
customer and the airline brand. Considering the conceptualization of social benefits, which is
mainly determined by its interactive characteristic, this finding strongly corresponds with the
theoretical foundation of this thesis.
With regard to psychological benefits, distinct influencing brand performance factors can be
determined: trustworthiness (p=0.306), airline reputation (p=0.237), and service quality
SQ2: How do fundamental airline brand performance characteristics influence the
relational benefits perceived by airline customers?
74
(p=0.215) are the key determinants of psychological benefits, followed by the much weaker
influencing factor airline country of origin (p=0.125). As already mentioned and previously
explained, the initially proposed links between co‐creation of value and psychological
benefits, and between brand‐self congruence and psychological benefits are refuted.
With 59.6% of the variance in psychological benefits explained by these brand performance
characteristics, they can be ascribed good explanatory power. Furthermore – considering
that psychological benefits are the most influential relational benefit of customer loyalty –
these brand performance characteristics gain special momentum in their influence on
customer loyalty. With a path coefficient of 0.306, trustworthiness exhibits the strongest
influence on psychological benefits and, hence, is one of the most influential brand
performance characteristics for customer loyalty. Against the background of comparably
high uncertainty and perceived risk in the consumption of services, this finding corresponds
to the general scientific notion in marketing that trustworthiness is one of the most
important brand characteristics in the service industries. Similarly, airline reputation and
service quality as strong influential factors of psychological benefits can be seen as cues for
risk reduction and, consequently, uncertainty avoidance.
Concerning causal relationships between airline brand performance characteristics and
functional benefits, perceived value is the only variable with significant influence on
functional benefits (p=0.566). Its impact is quite strong and explains 37.7% of the variance in
functional benefits. However, due to the average R², other variables that have an influence
on functional benefits must exist but have not been considered here. Since perceived value
has been conceptualized and was subsequently operationalized primarily as a value‐for‐
money consideration, ticket price and the corresponding service level can be regarded as
important factors affecting functional benefits as perceived from the interaction with the
airline brand.
While most of the brand performance characteristics included in the ACL model have
previously been tested for their influence on customer loyalty in related studies, CoO and
FFP attractiveness have been deliberately added to this study due to their explicit
connection with the airline industry. However, only a comparatively weak or even
insignificant impact of these two brand performance characteristics on the respective
relational benefits was observed within the framework of this study. While controversial
75
opinions concerning the impact of FFPs on loyalty were pointed out in Chapter 3.4, the
airline industry’s strong focus on FFPs rather negates the notion of a generally low
significance of these factors for an airline’s success. Therefore, the assumption is put
forward that the operationalization of the two constructs did not quite match their
considered meaning. Independent of the actual reason for the weak effect of FFP
attractiveness and of CoO, further research should be conducted to clarify their relevance
for customer loyalty in the airline industry. Due to their minor significance in this study, they
will not be considered in the further discussion of the ACL model.
With respect to SQ2, the airline brand performance characteristics identified essentially
explain the relational benefits perceived by airline customers. Similar to SQ1, specific
characteristics of each relational benefit and, accordingly, the effect each relational benefit
has on customer loyalty can be determined for SQ2: As the most influential relational
benefit, psychological benefits are, to a large extent, shaped by the perceived
trustworthiness of an airline, as well as its reputation and service quality. Social benefits as
the second most important benefit are strongly affected by brand‐self congruence and co‐
creation of value. Perceived value is the only brand performance characteristic that
influences functional benefits, still explaining 37.7% of the variance. Notably, it must be
mentioned that the allocation of brand performance characteristics to the considered
relational benefits matches their theoretical conceptualization, thereby reinforcing the ACL
model’s validity.
It has been argued (see Chapter 3.3) that customers’ differing situational characteristics
constitute important dimensions for segmentation in the airline industry. Customers’
reasons for traveling, i.e., whether they are traveling for business purposes or for leisure is a
fundamental situational segmentation criterion. The following section addresses the
differences that emerge in the ACL model, considering both customer groups individually.
In view of the influence of brand performance characteristics on relational benefits, several
differences between the two customer segments, business travelers and leisure travelers,
SQ3: How do differences in airline customer characteristics moderate the airline customer
loyalty model?

76
can be highlighted. In general, only five of the eight brand performance characteristics
significantly impact on business travelers’ relational benefits, while all brand performance
characteristics considerably influence at least one of the relational benefits for leisure
travelers. Brand‐self congruence is the only construct that has a significant influence on
social benefits for business travelers. Nevertheless, it explains 70% of the variance in social
benefits. Its influence is, furthermore, significantly stronger for business travelers than for
leisure travelers. Based on this finding, it can be inferred that business travelers explicitly use
the airline brand to present who they are or who they want to be to their social
environment. The congruence between their self‐concept and how they perceive the brand
contributes to their expression of their lifestyle and emphasizes the role and status they hold
or aim to hold in society. Business travelers’ focus on social environment is further
supported by the brand performance characteristic with the strongest influence on
psychological benefits. While trustworthiness is the most important contributor to the
perception of psychological benefits for leisure travelers, airline reputation has the strongest
influence on psychological benefits for business travelers. Therefore, it can be argued that
business travelers relate their airline choice to how society as a whole perceives the given
airline and which airline business travelers assume their social environment expects them to
fly, rather than concentrating on whether they perceive the airline brand as being
trustworthy. While perceived value is the only brand performance characteristic that
influences functional benefits for leisure travelers, service quality additionally influences
functional benefits for business travelers. The impact of service quality is even stronger than
that of perceived value. At the same time, the effect of perceived value is significantly
stronger for leisure travelers than it is for business travelers. These findings highlight
business travelers’ relative price inelasticity in comparison to that of leisure travelers (see
Chapter 3.3). That is, whether business travelers deem functional benefits to emerge from
their relationship with the brand is determined more by the quality of the service than by its
price.
Taking into account the direct influence of relational benefits on customer loyalty and the
mediating role of the dimensions of relationship quality, further differences between the
two sub‐groups become apparent. First, functional benefits exert no significant direct
influence on customer loyalty for business travelers; only an indirect influence through
customer satisfaction is evident. Second, the influence of commitment on customer loyalty is
77
insignificant for business travelers as well. Furthermore, in comparison to the overall model,
the causal relationship between psychological benefits and commitment is rejected for both
traveler groups, leaving social benefits as the only relational benefit with an impact on
commitment. Social benefits explain 56.3% of the variance in relationship commitment for
business travelers, but only 34.7% for leisure travelers. Effected by the insignificant links
between functional benefits and customer loyalty and between relationship commitment
and customer loyalty, less variance in customer loyalty is evident for business travelers
(59.3%) than for leisure travelers (67.9%).
With respect to the sub‐group comparison based on primary reason for air travel, it can be
summarized that airline reputation, brand‐self congruence, perceived value, and service
quality influence the respective relational benefits for business travelers. In comparison to
the leisure traveler segment, all other identified brand performance characteristics exhibit
no significant influence on relational benefits for business travelers. Furthermore, while
commitment is well‐explained by social benefits, no significant influence of commitment on
customer loyalty is evident for the business traveler segment.
From a global perspective, the findings with respect to SQ1 and SQ2 indicate that each type
of relational benefit is characterized by specific brand performance characteristics that
exhibit a particularly strong influence on them. These key determinants are further
distinguished for each relational benefit so that no overlapping can be reported.
Furthermore, relational benefits influence customer loyalty in different ways. By depicting
these cause‐effect relationships in Figure 6, three essential paths to airline customer loyalty
can be distinguished: the social path, the psychological path, and the functional path. These
paths accentuate the main cause‐effect‐relationships that lead to customer loyalty in the
airline industry and, therefore, represent a meaningful foundation from which to derive
managerial implications. However, as the discussion of SQ3 has demonstrated, it should be
noted that the general ACL model will demonstrate minor deviations when only specific
customer segments are considered.

78
Figure 6: The three paths to airline customer loyalty
Taking a closer look at the paths, it becomes apparent that they are well‐suited based not
only on their empirically verified relationships, but also on their intrinsic logic. The social
path to customer loyalty is characterized by the interaction that takes place between the
customer and the brand. Both brand‐self congruence and co‐creation of value require the
simultaneous consideration of the interplay between the customer and the brand. The
psychological path to customer loyalty is initiated by the consideration of airline
trustworthiness, airline reputation, and service quality. All three variables are closely related
to the assertion that the engagement in a relationship with the brand is appropriate. While
trustworthiness and service quality relate more to a subjective evaluation of the brand,
airline reputation contributes to an objective assessment of the brand. Perceived value,
again, as the starting point for the functional path to customer loyalty, emphasizes the
rational assessment of what is received in return for what was given.
7 Managerial implications The previous chapter identified three essential paths to airline customer loyalty. Building on
these, three main avenues can be taken by airline managers to strengthen customer loyalty.
Recommendations with regard to sub‐question four (SQ4) are presented in this chapter:
Social benefits
Psychological benefits
Functional benefits
Customer satisfaction
Country-of-origin
Co-creation of value
Service quality
Perceived value
Airline reputation
FFP attractiveness
Brand-self congruence
Relationship commitment
Customer loyalty
Trust-worthiness
The social path
The psychological pathThe functional path
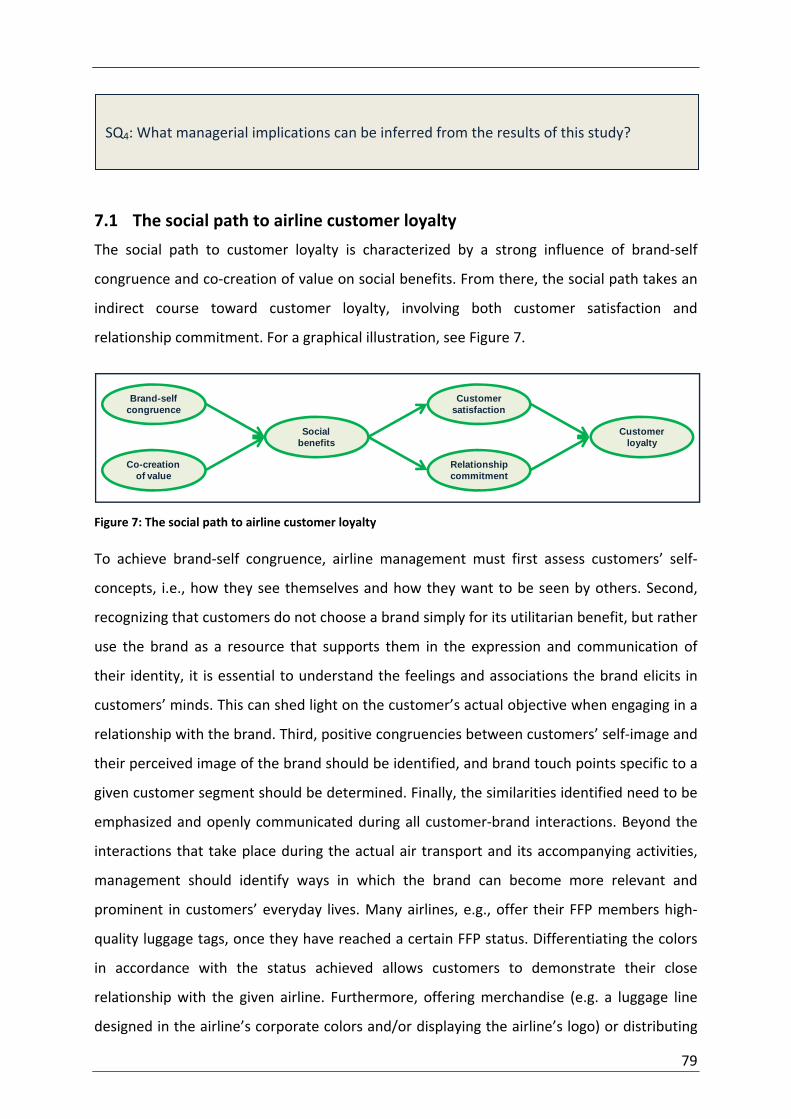
79
7.1 The social path to airline customer loyalty
The social path to customer loyalty is characterized by a strong influence of brand‐self
congruence and co‐creation of value on social benefits. From there, the social path takes an
indirect course toward customer loyalty, involving both customer satisfaction and
relationship commitment. For a graphical illustration, see Figure 7.
Figure 7: The social path to airline customer loyalty
To achieve brand‐self congruence, airline management must first assess customers’ self‐
concepts, i.e., how they see themselves and how they want to be seen by others. Second,
recognizing that customers do not choose a brand simply for its utilitarian benefit, but rather
use the brand as a resource that supports them in the expression and communication of
their identity, it is essential to understand the feelings and associations the brand elicits in
customers’ minds. This can shed light on the customer’s actual objective when engaging in a
relationship with the brand. Third, positive congruencies between customers’ self‐image and
their perceived image of the brand should be identified, and brand touch points specific to a
given customer segment should be determined. Finally, the similarities identified need to be
emphasized and openly communicated during all customer‐brand interactions. Beyond the
interactions that take place during the actual air transport and its accompanying activities,
management should identify ways in which the brand can become more relevant and
prominent in customers’ everyday lives. Many airlines, e.g., offer their FFP members high‐
quality luggage tags, once they have reached a certain FFP status. Differentiating the colors
in accordance with the status achieved allows customers to demonstrate their close
relationship with the given airline. Furthermore, offering merchandise (e.g. a luggage line
designed in the airline’s corporate colors and/or displaying the airline’s logo) or distributing
Social benefits
Customer satisfaction
Co-creation of value
Brand-self congruence
Relationship commitment
Customer loyalty
SQ4: What managerial implications can be inferred from the results of this study?
80
giveaways depicting the brand’s logo (e.g. sweat shirts, amenity kits) conveys the customer’s
experience with the airline brand to his social environment, thereby also making it less
ephemeral.
The fact that brand‐self congruence constitutes the most important variable influencing
social benefits for the entire sample, as well as for both sub‐groups presents an additional
challenge for airline managers. They need to very carefully and narrowly group customers
according to similar self‐concepts and shared perceptions of the brand. To address more
than one segment, the messages geared at different segments have to be modified to the
segment’s specific self‐images while at the same time ensuring that these complement each
other in order to avoid confusion. Aside from the fact that customers’ differing social
backgrounds influence their self‐concepts, airlines have to take cultural differences into
special consideration as well. Against this background, service employees as key brand
representatives can function as important intermediaries between the brand and the
customer. This, however, requires the simultaneous tackling of two crucial challenges: first,
employees have to internalize the brand’s values and act in the brand’s best interest.
Second, they have to adequately relate these values to customers’ emotions, feelings, and
cultural diversities. Employees’ empathy, as well as their cross‐cultural competence should,
therefore, be crucial requirements in employee selection. Trainings and internal
communication should further sensitize service employees, so they can adequately
represent the brand’s values and respond to the customers’ needs. Moreover, targeted
assignments of regional flight attendants offer an additional possibility for effectively
transferring and adapting the brand’s values to foreign passengers’ cultures and customs.
Thereby, special attention should also be paid to the clear communication and
exemplification of the brand’s values, as well as appropriate rewards for employees’
achievements. Demonstrating to employees that their work is indeed appreciated and that
they can actively influence the brand’s success inhibits the power to increase employees’ job
satisfaction, which, in turn, can positively affect customer satisfaction (cf. Heskett et al.,
2008). As the airline’s service‐chain is characterized by a number of activities (e.g., check‐in,
boarding, actual flight, baggage claim) in which the customer interacts with different
employees in each sequence, the comprehensive training of all employees ensures a
consistent communication of the brand’s key values and a seamless service experience for
the customer.

81
Besides brand‐self congruence’s influence on customer loyalty, the importance of this
concept should also be considered with respect to strategic branding decisions. Particularly
against the background of ongoing consolidation activities in the airline industry, attention
must be paid to the adequate management of airlines’ brand portfolios: emerging
opportunities of communication synergies resulting from brand consolidations should not
lead to the omission of the immense risk that lies in the reciprocal image‐transfer effect of
these consolidations and the possible consequential disturbance of the brand‐self
congruence, especially for the loyal and valuable customers of the airlines involved.
In addition to brand‐self congruence, co‐creation of value constitutes the second key
determinant of social benefits. Therefore, special attention must be paid to the customer’s
active involvement in the creation of the customer experience, as this fosters feelings of
belongingness to the brand. Customers’ involvement in the service process can be, for
example, spurred by inviting them to participate in product tests. By reaching out to the
customer, the airline demonstrates that its customers’ opinions and ideas are greatly
appreciated. Furthermore, actively seeking customer feedback and suggestions for
improvement underlines airlines’ roles as sponsors of customers’ value‐creation processes.
Aside from traditional feedback opportunities, such as in‐flight surveys, valued customers
can be invited to round‐table meetings where their experiences and future demands are
discussed with the airline’s service employees. Such discussion sessions exhibit two specific
advantages over traditional feedback opportunities. First, customers’ comments are
addressed to those employees that directly interact with them. Second, by actively inviting
customers to share their experiences, airline management signals to customers that their
comments are highly valued and that they can make an important contribution to service
improvements. However, value is not created by only listening to customers’ concerns.
Further action must be taken to process and evaluate customers’ recommendations. This is
achieved be implementing efficient and effective communication processes among
customers, service employees, and management to ensure the exchange and timely
realization of recommendations. Communication platforms could be created that can reach
a large number of employees and generate intensive experiences that are easy to recall
while at the same time keeping track of the incurring costs (e.g. mouth‐to‐mouth
communications, business TV).

82
The first path to customer loyalty along social benefits is first and foremost characterized by
the direct interaction that takes place between the customer and the brand. Special
importance should thereby be attached to the service employees in their function as
representatives of the brand. The creation of customer loyalty is based on the reciprocal
effect both relationship partners – the customer and the brand ‐ have on each other. While
the brand supports customers in expressing themselves to their social environments,
customers, on the other hand, can help vitalize the brand in their social surrounding.
7.2 The psychological path to airline customer loyalty
Originating in trustworthiness, airline reputation, and service quality, the psychological path
to airline customer loyalty is the strongest and most efficient, since psychological benefits
influence customer loyalty directly as well as indirectly through satisfaction and
commitment. The psychological path to airline customer loyalty is illustrated in Figure 8.
Figure 8: The psychological path to airline customer loyalty
In addition to the general significance of a brand’s trustworthiness with respect to services
(see Chapter 5.1.4), its special relevance in the airline industry can be explained by the great
number of aspects that are beyond the scope of customers’ direct control. Studies have
found that up to 40% of passengers have some degree of anxiety or feel uneasy when flying
(Murphy, 2007). This matter should be taken very seriously by airlines. For customers to
perceive an airline brand as trustworthy, the brand must demonstrate credible, reliable, and
honest behavior. This implies that airlines must be careful in what they promise that they are
able to deliver. Once promises are made and communicated to customers, management has
to ensure that these are kept. Otherwise, the airline brand’s reliability is jeopardized. In
addition, airlines should communicate honestly and timely about what precisely they can
deliver. The same applies to incidents in which the airline is unable to deliver on the
promises made. In order to uphold the brand’s trustworthiness, airline managers have to
Psychological benefits
Customer satisfaction
Service quality
Airline reputation
Relationship commitment
Customer loyalty
Trust-worthiness
83
show genuine interest in their customers’ well‐being. Reports about safety issues or
accidents, for example, should be addressed and clarified as accurately and promptly as
possible.
Reducing risk and anxiety can further be achieved by creating a safe and comfortable
environment for the customer. Again, airline employees should be considered important
contributors to this objective. Well‐trained employees come across as informed,
experienced, and competent. Clean and proper facilities, such as airport areas and the
aircraft interior, can further increase customers’ perceptions of safety and comfort.
The above‐mentioned initiatives, while contributing to the brand’s trustworthiness, can also
be related to the second key determinant of psychological benefits: service quality. Training
employees to smoothly and competently perform the service processes, for example, can
increase customers’ perception of the airline’s degree of customer service. Ergonomically
and technologically advanced aircraft interiors add to the perceived in‐flight service level. As
most initiatives to increase service quality involve increasing costs ‐ and it is customers’
perception of the service that eventually determines the service level ‐ airline management
needs to have a thorough understanding of what their customers require and what level of
service they expect the airline to deliver. Instead of undertaking bold and expensive
initiatives, the acceleration of a pronounced service culture and the implementation of
programs that actively encourage employees to make suggestions for service improvements
can lead to the continuous improvement of the airline’s service quality level. Service
employees as important intermediaries between customers and management should be
regarded as important sources of intelligence. Furthermore, airline management needs to be
aware that during the entire duration of their journey, airline travelers interact with a
number of service providers that are directly or only indirectly linked to the airline with
which they originally booked their ticket. The appearance of airport facilities, the
performance of handling agencies, or even the service of partner airlines operating the
actual flight on a code share agreement all influence the level of service quality perceived by
customers and are projected on the given airline. Therefore, a thorough assessment of the
customers’ chain of activities during their journey instead of the limited focus on the airline’s
service chain helps identify important brand touch points that influence customers’
evaluation of the airline’s service quality. Collaborations and partnerships with other service

84
providers participating in the customers’ ‘journey chain’ help ensure a consistent and
standardized level of service quality.
While trustworthiness and service quality mainly relate to the personal, subjective
evaluation of the brand, airline reputation refers to how the airline is assessed in society as a
whole, thereby describing a rather objective assessment of the brand. In comparison to
brand image, which can be different for each stakeholder, airline reputation incorporates
the images of multiple stakeholders to create an overall picture of the brand over time (cf.
de Chernatony, 1999). Based on the results of a study analyzing the importance of corporate
reputation in the airline context (Graham & Bansal, 2007), the following organizational
characteristics are proposed to be significant predictors of customers’ reputation
perceptions: the endorsement of governmental institutions monitoring the airline industry,
crash status, and the airline’s financial performance. Endorsements can be perceived as
objective evaluations of the airline’s actions. In addition to customers’ subjective assessment
of the airline, they can help rationalize their evaluation, thereby enhancing the airline’s
reputation in society. Second, recent accidents or an unusually high record of safety issues
can damage the airline’s reputation. As already discussed with regard to the airline’s
trustworthiness, airline managers need to ensure that the airline has a flawless safety record
and that appropriate crisis management procedures are in place in case of an unforeseen
incident. A strong financial performance further signals to customers that the airline is well‐
managed and positively assessed by other stakeholder groups. External communications like
press releases, annual reports, and environmental reports, give airlines the opportunity to
address the above‐mentioned topics. Mentioning pilot and cabin crew training in press
releases, for example, can help customers evaluate the flight crews’ competence, while
financial reports help airlines communicate management’s skills to make strategic decisions
in the airline’s and, consequently, the customer’s best interest.
From an aggregate consideration of the three key determinants of psychological benefits,
uncertainty avoidance can be determined as a common denominator. Based on this
observation, the previously discussed suggestions about how to increase the brand’s
trustworthiness, service quality, and reputation have to be regarded with some reservation.
Uncertainty avoidance relates to an entrenched feeling. Hence, the three airline brand
performance variables cannot be easily improved in a short period of time. Rather, they have

85
to be carefully and considerately built over time. Comfort and security cannot be created
through a small number of interactions but necessitate an ongoing relationship in which the
customer is repeatedly assured that the brand can be trusted. Considerable care must be
taken not to destroy the confidence in the brand by inconsiderate behavior. Caution should
also be exercised when planning the acquisition of or merger with other airlines. Positive
safety records, quality standards, and a favorable airline reputation cannot easily be
transferred from one brand to the other, while quite the opposite is true for negative
impressions.
7.3 The functional path to airline customer loyalty
Compared to psychological and social benefits, functional benefits exhibit the weakest total
effect on customer loyalty. Considering the functional path to airline customer loyalty,
perceived value is the only variable that significantly affects functional benefits which, in
turn, influence customer loyalty directly and through customer satisfaction (see Figure 9).
Figure 9: The functional path to airline customer loyalty
Perceived value is defined as the outcome of weighing the airline’s perceived performance
against the perceived ticket price. A positive value‐for‐money appraisal leads customers to
perceive functional/economic benefits as resulting from their relationship with the brand.
Based on this conceptualization, two general alternatives for the improvement of customers’
perceived value emerge: Lowering the perceived price or increasing the perceived service
level.
The two identified sources of perceived value possibly constitute the most important
foundation for the differentiation between low‐cost carriers and network carriers. For the
most part, network carriers focus on offering a high service level at a corresponding price.
Their image is based on the service offer rather than on the price customers have to pay for
it. Quite the contrary is true for low‐cost carriers’ approach of delivering value to their
customers, which is strongly based on offering low‐priced tickets in return for a reduced
Functional benefits
Customer satisfaction
Perceived value
Customer loyalty
86
level of service. Given the fact that network carriers are pressured to lower their fares on
routes on which they directly compete with low‐cost carriers, a special opportunity arises for
them. While their brand’s image is related more to a high level of service than to low ticket
prices, network carriers can use the concept of perceived value as an interesting competitive
tool. Charging a comparable price to that offered by low‐cost carriers, network carriers can
suggest better value for money since customers associate a higher service level with
traditional carriers.
Marketing communications have the greatest potential to change customers’ perception
about the price and/or the service level. Concentrating on the communication of benefits
aside from low ticket price can help airlines increase the perceived value‐for‐money ratio.
To conclude this chapter, the relationship quality dimensions – customer satisfaction and
relationship commitment – need to be addressed. Although these variables were found to
emanate the greatest direct influence on airline customer loyalty, no specific managerial
recommendations about how to improve them will be formulated. This is first and foremost
due to the way in which the ACL model has been developed and depicted. The fundamental
understanding of a cause‐effect model implies that each construct within the model is
influenced by its respective antecedents. Hence, with respect to the two variables of
relationship quality it can be argued that the successful realization of the presented
recommendations, mostly geared at improving the identified brand performance
characteristics, will initially have a positive effect on the respective relational benefits and,
consequently, improve customer satisfaction and relationship commitment.
8 Conclusion With regard to the challenges that managers in the airline industry find themselves
confronted with, the following overarching research question was formulated:
Based on the review of relevant literature in the fields of customer loyalty, relationship and
service marketing, relational benefits were identified as important antecedents to customer
What kind of benefits do customers seek when they engage in relationships with airline
brands, and how can these relationships strengthen airline customer loyalty?

87
loyalty in the airline industry. These relational benefits were defined as benefits that result
for customers from relationships with the airline brand, thereby moving beyond the actual
benefit of the service being offered. Three types of relational benefits were derived as being
relevant in the airline business: social, psychological, and functional benefits. Based on these
three types of relational benefits, the airline customer loyalty (ACL) model was developed,
depicting cause‐effect relationships that lead to airline customer loyalty. The testing of
empirical data attested the model strong explanatory power, thereby verifying its value for
the management of customer loyalty in the airline industry.
A global contemplation of the empirical findings identified three distinct paths to airline
customer loyalty in the ACL model. Each path evolves around one particular type of the
observed relational benefits, and thus, they were entitled the social, the psychological, and
the functional path. All three paths originate from distinct airline brand performance
characteristics, proceed along the respective types of relational benefits and progress either
directly and/or through the relationship quality dimensions – satisfaction and commitment ‐
to airline customer loyalty. These influential paths provide airline management with two
important insights into the management of airline customer loyalty: On a broader level, they
emphasize the overall importance of different brand performance characteristics relevant in
the airline industry, thereby identifying opportunities, as well as risks that lie in their
improvement and their deterioration, respectively. On a more specific level, they allow the
derivation of concrete management decisions to improve customer loyalty.
In consideration of the identified paths, a wide spectrum of distinct implications for the
improvement of airline customer loyalty has been provided by this thesis. Summarizing
these, the following general inference can be pinpointed: The empirical findings accentuate
the particular relevance of airlines’ social‐psychological aspects for customers. Important
drivers of customer loyalty such as the congruence between customer self‐image and airline
brand image, the trustworthiness of the airline brand, as well as the process of value co‐
creation emphasize this notion. These main findings lead to an interesting conclusion:
comparable to developments in other industries, functional aspects seem to be important,
but, at the same time presupposed, by airline customers. In contrast, social‐psychological
benefits have an accentuated role, especially in the building of strong and committed
relationships between customers and airline brands. Accordingly, management initially must

88
ensure a basic provision of rather ‘hard’ service criteria such as the delivery of a flawless
service at a reasonable price‐performance ratio. Most importantly, however, airline
management must ensure that the service environment enables the realization of a socially
and psychologically enriching customer experience. As has been argued in this thesis,
successfully dealing with these social‐psychological challenges can, to a great extent, be met
through appropriate interactions between customers and service employees. The
systematized and comprehensive recruitment and training of these employees, as well as
the creation of a satisfactory work environment, therefore, constitute important tasks that
airline management needs to address. In addition, customers have to be actively involved in
the service process to ensure their satisfaction and commitment in the long‐run. The
coordination of the different service components, as well as their incorporation in a clear
and integrated communication strategy further supports the creation of a harmonious brand
image in customers’ minds, which is the basis for the development of relationships between
customers and the airline and, moreover, a prerequisite for the development of true
customer loyalty.
By implementing a holistic perspective on the creation of customer loyalty in the airline
industry, this study has developed an innovative approach for its examination. The
integration of brand performance characteristics, relational benefits, and the relationship
quality concept into the ACL model enables a differentiated analysis of cause‐effect
relationships of customer loyalty in the airline industry. Furthermore, contributing to the
recent discussions about the concept of value co‐creation in academic literature, this study
has empirically verified that the co‐creation of value is an important antecedent to social
benefits and, hence, to customer loyalty.
Following directions for future research can be addressed: The empirical testing of the
model provided significant and meaningful results for the given sample. However, in order to
make a clear statement about its overall applicability with regard to the entire target
population of airline customers, it is proposed to re‐test the model with a different sample.
In order to further affirm the above‐mentioned conclusion about the predominance of
social‐psychological benefits over functional benefits, future studies should examine the
particular function of social‐psychological and functional benefits, as well as their
interdependency. While the industry‐specific brand performance characteristics ‘airline

89
country of origin’ and ‘FFP attractiveness’ showed only weak influences on the respective
relational benefits, further research should clarify their relevance for the industry. Although
the model has been specifically developed to understand drivers of customer loyalty in the
airline industry, future research should further develop the three distinct paths to customer
loyalty and test the model’s relevance in other service industries.
With the development of the ACL model and the identification of the three loyalty paths,
this thesis has made an important contribution to marketing science. Future potential
research fields have also been addressed. Last but not least, it contributes beneficial
knowledge to the airline industry, especially in consideration of the expected further
intensification of competition and the forecast consolidation of airlines which calls for the
deliberate management of brand portfolios.

References
90
References
Books, articles, reports
A.T. Kearney (2003), "The emerging airline industry", retrieved: Jan. 15, 2009, URL: http://www.atkearney.de/content/veroeffentlichungen/whitepaper_practice.php/practice/transportation/id/48677.
Aaker, D.A. (2002), Building strong brands, New York: The Free Press.
Ambler, T., Styles, C. (1997), "Brand development versus new product development: toward a process model of extension decisions", Journal of Product & Brand Management, Vol. 6 No. 4, pp. 222‐234.
Anderson, E.W., Fornell, C. (1994), “A customer satisfaction research prospectus,” in Service quality: new directions in theory and practice, Rust, R.T., Oliver, R.L., eds. Thousand Oaks, CA: Sage, pp. 241‐268.
Anderson, E.W., Fornell, C., Lehmann, D.R., (1994), "Customer satisfaction, market share, and profitability: findings from Sweden", Journal of Marketing, Vol. 58, pp. 53‐66.
Anderson, S., Pearo, L.K., Widener, S.K. (2008), "Drivers of service satisfaction: linking customer satisfaction to the service concept and customer characteristics", Journal of Service Research, Vol. 10 No. 4, pp. 356‐381.
Andreassen, T.W., Lindestad, B. (1998), "Customer loyalty and complex services: the impact of corporate image on quality, customer satisfaction and loyalty for customers with varying degrees of service expertise", International Journal of Service Industry Management, Vol. 9 No. 1, pp. 7‐23.
Anonymous (2006), "Easyjet and Ryanair flying high on the Southwest model: charting the ups and downs of low‐cost carriers", Strategic Direction, Vol. 22 No. 6, pp. 18‐21.
Argenti, P.A., Druckenmiller, B. (2004), "Reputation and the corporate brand", Corporate Reputation Review, Vol. 6 No. 4, pp. 368‐375.
Bandyopadhyay, S., Martell, M. (2007), "Does attitudinal loyalty influence behavioral loyalty?: a theoretical and empirical study", Journal of Retailing and Consumer Services, Vol. 14, pp. 35‐44.
Barclaycard Business (2008), "The Barclaycard Business travel survey 2008: Twelve years of industry excellence and insight", retrieved Jan. 15, 2009, URL: http://www.barclaycardbusiness.co.uk/information_zone/travel/2008_survey_results.pdf.
Beatson, A., Lings, I., Gudergan, S. (2008), "Employee behavior and relationship quality: impact on customers", The Service Industries Journal, Vol. 28 No. 2, pp. 211‐223.
Beatty, S.E., Mayer, M., Coleman, J.E., Reynolds, K.E., Lee, J. (1996), "Customer‐sales associate retail relationships", Journal of Retailing, Vol. 72 No. 3, pp. 223‐247.
Bendapudi, N., Berry, L.L. (1997), "Customers' motivations for maintaining relationships with service providers", Journal of Retailing, Vol. 37 No. 1, pp. 15‐37.
Berentzen, J.B., Bachhaus, C., Michaelis, M., Blut, M., Ahlert, D. (2009), "Does 'made in…' also apply to Services?: an empirical assessment of the country‐of‐origin effect in service settings", Journal of Relationship Marketing, Vol. 7 No. 4, pp. 391‐405.
Berry, L.L. (1995), "Relationship marketing of services: growing interest, emerging perspectives", Journal of the Academy of Marketing Science, Vol. 23 No. 4, pp. 236‐2445.
References
91
Berry, L.L. (2000), “Cultivating service brand equity”, Journal of the Academy of Marketing Science, Vol. 28 No. 1, pp. 128‐137.
Berry, L.L. (2002), "Relationship marketing of services: perspectives from 1983 and 2000", Journal of Relationship Marketing, Vol. 1 No.1, pp. 59‐77.
Berry, L.L., Parasuraman, A. (1991), Marketing services: competing through quality, New York: The Free Press.
Bieger, T., Agosti, S. (2005), "Business Models in the airline sector: evolution and perspectives, in: Delfmann, D., Baum, H., Auerbach, S., Albers, S. (2005), Strategic management in the aviation industry, Aldershot: Ashgate Publishing Ltd.
Bitner, M.J. (1995), "Building service relationships: it's all about promises", Journal of the Academy of Marketing Science, Vol. 23 No. 4, pp. 246‐251.
Blackwell, S.A., Szeinbach, S.L., Barnes, J.H., Garner, D.W., Bush, V. (1999), "The antecedents of customer loyalty: an empirical investigation of the role of personal and situational aspects on repurchase decisions", Journal of Service Research, Vol. 1 No. 4, pp. 362‐375.
Bloemer, J.M.M., de Ruyter, K., Wetzels, M. (1999), “Linking perceived service quality and service loyalty: a multi‐dimensional perspective”, European Journal of Marketing, Vol. 33 No. 11/12, pp. 1028‐1106.
Bloemer, J.M.M., Kasper, H.D.P. (1995), "The complex relationship between consumer satisfaction and brand loyalty", Journal of Economic Psychology, Vol. 16, pp. 311‐329.
Blunch, N.J. (2008), Introduction to structural equation modelling using SPSS and AMOS, Los Angeles, CA: Sage
Bollen, K., Lennox, R. (1991), "Conventional wisdom on measurement: a structural equation perspective", Psychological Bulletin, Vol. 110 No. 2, pp. 305‐314.
Bolton, R.N., Drew, J.H. (1991), “A multistage model of customers’ assessments of service quality and value", Journal of Consumer Research, Vol. 17, pp. 375‐385.
Bolton, R.N., Kannan, P.K., Bramlett, M.D., (2000), "Implications of loyalty program membership and service experiences for customer retention and value", Journal of the Academy of Marketing Science, Vol. 28 No. 1, pp. 95‐108.
Braunsberger, K., Wybenga, H., Gates, R. (2007), "A comparison of reliability between telephone and web‐based surveys", Journal of Business Research, Vol. 60, pp. 758‐764.
Bruner, G.C., James, K.E., Hensel, P.J. (2001), Marketing scales handbook: a compilation of multi‐item measures, 3rd ed., Chicago: American Marketing Association.
Bruning, E.R. (1997), "Country of origin, national loyalty and product choice: the case of international air travel", International Marketing Review, Vol. 14 No. 1, pp. 59‐74.
Brunner, T.A., Stöcklin, M., Opwis, K. (2008), Satisfaction, image and loyalty: new versus experience customers", European Journal of Marketing, Vol. 62 No. 9/10, pp. 1095‐1105.
Byrne, B.M. (1998), Structural equation modeling with LISREL, PRELIS, and SIMPLIS: basic concepts, applications, and programming, Mahwah, NJ: Lawrence Erlbaum Associates, Inc.
Carlsson, F., Löfgren, A (2006), "Airline choice, switching costs and frequent flyer programmes", Applied Economics, Vol. 38, pp. 1469‐1475.
Chang, M.K. (1998), "Predicting unethical behavior: a comparison of the theory of reasoned action and the theory of planned behavior", Journal of Business Ethics, Vol. 17, pp. 1825‐1834.

References
92
Chang, Y.‐H., Chen, F.Y. (2007), "Relational benefits, switching barriers and loyalty: a study of airline customers in Taiwan", Journal of Air Transport Management, Vol. 13, pp. 104‐109.
Chaudhuri, A., Holbrook, M.B. (2001), "The chain of effects from brand trust and brand affect to brand performance: the role of brand loyalty, Journal of Marketing, Vol. 65 (April 2001), pp. 81‐93.
Chin, W.W. (1998), "The Partial Least Squares approach to structural equation modeling", in: Marcoulides, G.A. (ed.), Modern methods of business research, pp. 295‐336.
Clark, M., Payne, A. (1994), “Achieving long‐term customer loyalty: a strategic approach”, Working paper, Centre for Services Management, Cranfield School of Management.
Collis, J., Hussey, R. (2003), Business research: a practical guide for undergraduate and postgraduate students, 2nd ed., London/Basingstoke: Palgrave Macmillan.
Coulter, R.A., Ligas, M. (2004), "A typology of customer‐service provider relationships: the role of relational factors in classifying customers", Journal of Services Marketing, Vol. 18 No. 6, pp. 482‐493.
Cronin, J.J., Taylor, S.A. (1992), "Measuring service quality: a reexamination and extension", Journal of Marketing, Vol. 56, pp. 55‐68.
Cunningham, L.F., Young, C.E., Lee, M. (2002), "Cross‐cultural perspectives of service quality and risk in air transport", Journal of Air Transportation, Vol. 7 No. 1, pp. 3‐26.
Cunningham, R.M. (1956), "Brand loyalty: what, where, how much?", Harvard Business Review, Vol. 34 No. 1, pp.116‐128.
Czepiel, J.A. (1990), “Service encounters and service relationships: implications for research”, Journal of Business Research, Vol. 20 No. 1, pp. 13‐21.
Dall'Olmo Riley, F., de Chernatony, L. (2000), "The service brand a relationship builder", British Journal of Management, Vol. 11, pp. 137‐150.
Danaher, P.J., Conroy, D.M., McColl‐Kennedy, J.R. (2008), "Who wants a relationship anyway?: conditions when consumers expect a relationship with their service provider", Journal of Service Research, Vol. 11 No. 1, pp. 43‐62.
Day, G.S. (1969), "A two‐dimensional concept of brand loyalty", Journal of Advertising Research, Vol. 9 No. 3, pp. 29‐35.
de Chernatony, L. (1999), "Brand management through narrowing the gap between brand identity and brand reputation", Journal of Marketing Management, Vol. 15, pp. 157‐179.
de Chernatony, L., Cottam, S., Segal‐Horn, S. (2006), "Communicating services brands' values internally and externally", The Service Industries Journal, Vol. 26 No. 8, pp. 819‐836.
Delfmann, D., Baum, H., Auerbach, S., Albers, S. (2005), Strategic management in the aviation industry, Aldershot: Ashgate Publishing Ltd.
Diamantopoulos, A. (1994), "Export performance measurement: reflective versus formative indicators", International Marketing Review, Vol. 16 No. 9, pp. 444‐457.
Dick, A.S., Basu, K. (1994), "Customer loyalty: toward an integrated conceptual framework", Academy of Marketing Science, Vol. 22 No. 2, pp. 99‐113.
Doganis, R. (2006), The airline business, 2nd ed., Abingdon: Routledge.
Dowling, G.R., Uncles, M. (1997), "Do customer loyalty programs really work?", Sloan Management Review, Summer 1997, pp. 71‐82.
References
93
Dresner, M. (2006), "Leisure versus business passengers: similarities, differences, and implications", Journal of Air Transport Management, Vol. 12, pp. 28‐32.
Edwards, J.R., Bagozzi, R.P. (2000), "On the nature and direction or relationships between constructs and measures", Psychological Methods, Vol. 5 No. 2, pp. 155‐174.
Esch, F.‐R., Langner, T., Schmitt, B.H., Geus, P. (2006), "Are brands forever?: how brand knowledge and relationships affect current and future purchases", Journal of Product & Brand Management, Vol. 15 No. 2, pp. 98‐105.
Fornell, C., Bookstein, F.L. (1982), "Two structural equation models: LISREL and PLS applied to consumer exit‐voice theory", Journal of Marketing Research, Vol. 19, pp. 440‐452.
Fornell, C., Larcker, D.F. (1981), "Evaluating structural equation models with unobservable variables and measurement error", Journal of Marketing Research, Vol. 18, pp. 39‐50.
Fournier, S. (1998), "Consumers and their brands: developing relationship theory in consumer research", Journal of Consumer Research, Vol. 24, pp. 343‐373.
Fournier, S., Yao, J.L. (1997), "Reviving brand loyalty: a reconceptualization within the framework of consumer‐brand relationships", International Journal of Research in Marketing, Vol. 14, pp. 451‐472.
Franke, M. (2004), "Competition between network carriers and low‐cost carriers: retreat battle or breakthrough to a new level of efficiency?", Journal of Air Transport Management, Vol. 10. pp. 15‐21.
Garbarino, E., Johnson, M.S. (1999), "The different roles of satisfaction, trust, and commitment in customer relationships", Journal of Marketing, Vol. 63, pp. 70‐87.
Ghauri, P., Grønhaug, K. (2005), Research methods in business studies: a practical guide, 3rd ed., London: Pearson Higher Education.
Gill, J., Johnson, P. (2002), Research methods for managers, 3rd ed., London: SAGE Publication Ltd.
Goodwin, C., Gremler, D.D. (1996), "Friendship over the counter: how social aspects of service encounters influence consumer service loyalty", Advances in Services Marketing and Management, Vol. 5, pp. 247‐282.
Graham, A. (2006), "Have the major forces driving leisure airline traffic changed?", Journal of Air Transport Management, Vol. 12, pp. 14‐20.
Graham, M.E., Bansal, P. (2007), "Consumers' willingness to pay for corporate reputation: the context of airline companies", Corporate Reputation Review, Vol. 10 No. 3, pp. 189‐200.
Grayson, K., Ambler, T. (1999), "The dark side of long‐term relationships in marketing services", Journal of Marketing Research, Vol. 36, pp. 132‐141.
Gremler, D.D., Brown, S.W. (1999), "The loyalty ripple effect: appreciating the full value of customers", International Journal of Service Industry Management, Vol. 10 No. 3, pp. 271‐291.
Gremler, D.D., Gwinner, K.P. (2000), "Customer‐employee rapport in service relationships", Journal of Service Research, Vol. 3 No. 1, pp. 82‐104.
Grönroos, C. (2004), "From marketing mix to relationship marketing: towards a paradigm shift in marketing", Marketing Decision, Vol. 32 No. 2, pp. 4‐20.
Grönroos, C. (2006), "Adopting a service logic for marketing", Marketing Theory, Vol. 6 No. 3, pp. 317‐333.

References
94
Grönroos, C. (2007), Service management and marketing: customer management in service competition, 3rd ed., Chichester: John Wiley & Sons.
Grzeskowiak, S., Sirgy, M.J. (2007), "Consumer well‐being (CWB): the effects of self‐image congruence, brand‐community belongingness, brand loyalty, and consumption regency", Applied Research Quality Life, Vol. 2, pp. 298‐304.
Gummesson, E. (2008), "Extending the service‐dominant logic: from customer centricity to balanced centricity", Journal of the Academy of Marketing Science, Vol. 36 No. 1, pp. 15‐17.
Gutek, B.A., Cherry, B., Bhappu, A.D., Schneider, S., Woolf, L. (2000), "Features of service relationships and encounters", Work and Occupation, Vol. 27 No. 3, pp. 319‐351.
Gwinner, K.P., Gremler, D.D., Bitner, M.J. (1998), "Relational benefits in services industries: the customer's perspective", Journal of the Academy of Marketing Science, Vol. 26 No. 2, pp. 101‐114.
Haenlein, M., Kaplan, A. (2004), "A beginner's guide to partial least squares analysis", Understanding statistics, Vol. 3 No. 4, pp. 283‐97.
Hair, J., Bush, R.P., Ortinau, D.J. (2006), Marketing research: within a changing information environment, 3rd. ed., New York: McGraw‐Hill/Irwin.
Han, X., Kwortnik, R.J., Wan, C. (2008), "Service loyalty: an integrative model and examination across service contexts", Journal of Service Research, Vol. 1 No. 1, pp. 22‐42.
Hanlon, P. (2007), Global airlines: competition in a transnational industry, 3rd ed., Burlington, MA: Butterworth‐Heinemann.
Hennebichler, P. (2007), Country of origin knowledge: insights into consumers' knowledge, Saarbrücken: VDM
Hennig‐Thurau, T., Gwinner, K.P., Gremler, D.D. (2002), "Understanding relationship marketing outcomes: an integration of relational benefits and relationship quality", Journal of Service Research, Vol. 4 No.3, pp. 230‐247.
Hennig‐Thurau, T., Klee, A. (1997), "The impact of customer satisfaction and relationship quality on customer retention: a critical reassessment and model development", Psychology & Marketing, Vol. 14 No. 8, pp. 737‐764.
Heskett, J.L., Jones, T.O., Loveman, G.W., Sasser Jr., W.E., Schlesinger, L.A. (2008), "Putting the service‐profit chain to work", Harvard Business Review, Jul‐Aug, pp. 118‐129.
Hess, J., Story, J. (1995), "Trust‐based commitment: multidimensional consumer‐brand relationships", Journal of Consumer Marketing, Vol. 22 No. 6, pp. 313‐322.
Huber, F., Herrmann, A., Henneberg, S.C. (2007), "Measuring customer value and satisfaction in services transactions, scale development, validation and cross‐cultural comparison", International Journal of Consumer Studies, Vol. 31, pp. 554‐564.
Huber, F., Herrmann, A., Meyer, F., Vogel, J., Vollhardt, K. (2007), Kausalmodellierung mit Partial Least Square: Eine anwendungsorientierte Einführung, Wiesbaden: Gabler.
Hulland, J. (1999), "Use of Partial Least Square (PLS) in strategic management research: a review of four recent studies", Strategic Management Journal, Vol. 20, pp. 195‐204.
IATA (2007), "Corporate air travel survey: edition 2008", International Air Transport Association.
Jacoby, J., Chestnut, R.W. (1978), Brand loyalty measurement and management, New York: John Wiley.

References
95
Jacoby, J., Kyner, D.B. (1973), "Brand loyalty vs. Repeat purchasing behavior", Journal of Marketing Research, Vol. 10, pp. 1‐9.
Jaffe, E.D., Nebenzahl, I.D. (2006), National image & competitive advantage: the theory and practice of place branding, 2nd ed., Copenhagen: Copenhagen Business School Press.
Jahn, S. (2002), "Strukturgleichungsmodellierung mit LISREL, AMOS und SmartPLS: eine Einführung", Technische Universität Chemnitz, retrieved: Feb. 24, 2009, URL: http://www‐user.tu‐chemnitz.de/~stjah/Jahn2007‐Strukturgleichungsmodellierung%20mit%20LISREL,AMOS%20und%20SmartPLS.%20Eine%20Einf%81hrung.pdf.
Jones, T., Taylor, S.F. (2007), "The conceptual domain of service loyalty: how many dimensions?", Journal of Services Marketing, Vol. 21 No. 1, pp. 36‐51.
Keller, K.L. (2003), Strategic brand management: Building, measuring, and managing brand equity, 2nd int. ed., Upper Saddle River, NJ: Prentice Hall.
Kim, H.R., Lee, M., Ulgado, F.M. (2005), "Brand personality, self‐congruity and the consumer‐brand relationship", Advances in Consumer Research ‐ Asia‐Pacific Conference Proceedings, Vol. 6, pp. 111‐117.
Kim, J., Morris, J.D., Swait, J. (2008), "Antecedents of true brand loyalty", Journal of Advertising, Vol. 37 No. 2, pp. 99‐117.
Knox, S. (1998), "Loyalty‐based segmentation and the customer development process", European Management Journal, Vol. 16 No. 6, pp. 729‐737.
Kressmann, F., Sirgy, M.J., Herrmann, A., Huber, F., Huber, S., Lee, D.‐J. (2006), "Direct and indirect effects of self‐image congruence on brand loyalty", Journal of Business Research, Vol. 59, pp. 955‐964.
Kumar, S, Shah, D. (2004), "Building and sustaining profitable customer loyalty for the 21st century", Journal of Retailing, Vol. 80, pp. 317‐330.
LaBahn, D.W. (1996), "Advertiser perceptions of fair compensation, confidentiality, and rapport", Journal of Advertising Research, Vo. 36, pp. 28‐38.
Lederman, M. (2007), "Do enhancements to loyalty programs affect demand? The impact of international frequent flyer partnerships on domestic airline demand", RAND Journal of Economics, Vol. 38 No. 4, pp. 1134‐1158.
Liu, Y., Yang, R. (2009), "Competing loyalty programs: impact of market saturation, market share, and category expandability", Journal of Marketing, Vol. 93, pp. 93‐108.
Long, M.M., McMellon, C., Clark, S.D., Schiffman, L.G. (2006), "Building relationships with business and leisure flyers: perceived loyalty and frequent flyer programs", Services Marketing Quarterly, Vol. 28 No. 1, pp. 1‐17.
Lufthansa Consulting (2008), "Airline performance: past, present & future", retrieved: Jan 15., 2009, URL: http://www.lhconsulting.com/fileadmin/images/www.lhconsulting.com/downloads/speeches/080504_LON_Conferenc_AL_Sales_Marketing_Varfis.pdf.
Lütters, H. (2004), Online‐Marktforschung: eine Positionsbestimmung im Methodenkanon der Marktforschung unter Einsatz eines webbasierten Analytic Hierarchy Process (webAHP), Wiesbaden: Gabler.
Malhotra, N.K., Birks, D.F. (2007), Marketing research: an applied approach, Harlow: Prentice Hall/Financial Times.

References
96
Martensen, A., Grønholdt, L. (2004), "Building brand equity: a customer‐based modelling approach", Journal of Management Systems, Vol. 16 No. 3, pp. 37‐51.
Martín Ruiz, D., Barroso Castro, C., Armario, E.M. (2007), "Explaining market heterogeneity in terms of value perceptions", The Service Industries Journal, Vol. 27 No.8, pp. 1087‐1110.
Marzo‐Navarro, M., Pedraja‐Iglesias, M., Rivera‐Torres, M.P. (2004), “The benefits of relationship marketing for the consumer and for the fashion retailers”, Journal of Fashion Marketing and Management, Vol. 8, pp. 425–436.
Mason, K.J. (2005), "Observations of fundamental changes in the demand for aviation services", Journal of Air Transport Management, Vol. 11, pp. 19‐25.
Mason, K.J., Alamdari, F. (2007), "EU network carriers, low cost carriers and consumer behaviour: a Delphi study of future trends", Journal of Air Transport Management, Vol. 13, pp. 299‐310.
McConkey, C.W., Stevens, R.E., Loudon, D.L. (2003), "Surveying the service sector: a pilot study of the effectiveness of mail vs. Internet approaches", Services Marketing Quarterly, Vol. 25 No. 1, pp. 75‐84.
Moorman, C., Zaltman, G., Deshpandé, R. (1992), "Relationships between providers and users of marketing research: the dynamics of trust within and between organizations”, Journal of Marketing Research, Vol. 29, pp. 314‐329.
Morgan, R.M., Hunt, S.D. (1994), "The commitment‐trust theory of relationship marketing", Journal of Marketing, Vol. 58 No. 3, pp. 20‐38.
Morschett, D., Schramm‐Klein, H., Hälsig, F., Jara, Magali (2008), The influence of self‐congruity, brand personality and brand performance on store loyalty", Advances in Consumer Research ‐ European Conference Proceedings, Vol. 8, pp. 417‐418.
Murphy, T. (2007), "For fear of flying, therapy takes to the skies", The New York Times Company, Jul. 24, 2007, retrieved: Apr. 01, 2009, URL: http://www.nytimes.com/2007/07/24/health/psychology/24fear.html?_r=1&pagewanted=all.
Nadiri, H., Hussain, K., Ekiz, E.H., Erdoğan, S. (2008), "An investigation on the factors influencing passengers' loyalty in the North Cyprus national airline", The TQM Journal, Vol. 20 No. 3, pp. 265‐280.
Oliver, R.L. (1980), “A cognitive model of the antecedents and consequences of satisfaction decisions", Journal of Marketing Research, Vol. 17 (November), pp. 460‐469.
Oliver, R.L. (1997), Satisfaction: a behavioral perspective on the consumer, New York: McGraw‐Hill, p. 13.
Oliver, R.L. (1999), "Whence consumer loyalty?", Journal of Marketing, Vol. 63 (special issue 1999), pp.33‐44.
Ostrowski, P.L., O'Brien, T.V., Gordon, G.L. (1993), Service quality and customer loyalty in the commercial airline industry", Journal of Travel Research, Vol. 32 No. 2, pp. 16‐24.
Oyewole, P., Choudhury, P. (2006), "Purchase situations and the level of importance that consumers attach to services in the airline industry", Services Marketing Quarterly, Vol. 28 No. 1, pp. 19‐34.
Pallant, J. (2001), SPSS survival manual, Open University Press
Palmer, A. (2005), Principles of service marketing, 4th ed., Maidenhead: McGraw‐Hill Education.
Parasuraman, A., Zeithaml, V.A., Berry, L.L. (1988), "SERVQUAL: a multiple‐item scale for measuring consumer perceptions of service quality", Journal of Retailing, Vol. 64 No. 1, pp. 12‐40.

References
97
Park, J.‐W., Robertson, R., Wu, C.‐L. (2006), "Modelling the impact of airline service quality and marketing variables on passengers' future behavioural intentions", Transportation Planning and Technology, Vol. 29 No. 5, pp. 359‐381.
Patterson, M., O'Malley, L. (2006), "Brands, consumers and relationships: a review", Irish Marketing Review, Vol. 18 No. 1&2, pp. 10‐20.
Paul, M., Hennig‐Thurau, T., Gremler, D.D., Gwinner, K.P., Wiertz, C. (2009): "Toward a theory of repeat purchase drivers for consumer services", Journal of the Academy of Marketing Science, Vol. 37, pp. 215‐237.
Pecotich, A., Pressley, M., Roth, D. (1996), "The impact of country of origin in the retail service context", Journal of Retailing and Consumer Services, Vol. 3 No. 4, pp. 213‐224.
Peter, J.P., Olson, J.C. (2008), Consumer behavior and marketing strategy, 8th ed., Boston: McGraw‐Hill.
Plimmer, G. (2006), "Loyalty programmes", Financial Times Ltd., Sep. 15, 2006, retrieved: Apr. 1, 2009, URL: http://www.ft.com/cms/s/0/bcb047e8‐44d7‐11db‐b804‐0000779e2340.html.
Pompl, W., Schuckert, M.R., Möller, C. (2003), "Zur Differenzierung der Geschäftsmodelle im Personenluftverkehr: die Full Service Network Carrier", Tourism Journal, retrieved Jan. 15, 2009, URL: http://www.pompl.net/Pompl/Luftverkehr/Downloads/TJ_Geschaeftsmodelle.pdf.
Prahalad, C.K., Ramaswamy, V. (2004), "Co‐creating unique value with customers", Strategy & Leadership, Vol. 32 No. 3, pp. 4‐9.
Price, L.L., Arnould, E. (1999), Commercial friendship: service provider‐client relationships in context", Journal of Marketing, Vol. 63, pp. 38‐56.
Pritchard, M.P., Havitz, M.E., Howard, D.R. (1999), “Analyzing the commitment‐loyalty link in service contexts,” Journal of the Academy of Marketing Science, Vol. 27 (Summer), pp. 333‐48.
Punniyamoorthy, M., Raj, M.P.M. (2002), "An empirical model of brand loyalty measurement", Journal of Targeting, Measurement and Analysis for Marketing, Vol. 15 No. 4, pp. 222‐233.
Rajah, E., Marshall, R., Nam, I. (2008), "Relationship glue: customers and marketers co‐creating a purchase experience", Advances in Consumer Research ‐ North American Conference Proceedings, Vol. 35, pp. 367‐373.
Ravald, A., Grönroos, C. (1996), "The value concept and relationship marketing", European Journal of Marketing, Vol. 30 No. 2, 1996, pp. 9‐30.
Reichheld, F.F. (1993), “Loyalty‐based management”, Harvard Business Review, Vol. 71, pp. 64‐73.
Reichheld, F.F. (1996), The loyalty effect: the hidden force behind growth, profits, and lasting value, Boston: Harvard Business School Press
Reichheld, F.F., Sasser, W.E. (1990), “Zero defections: quality comes to services” Harvard Business Review, Vol. 68, pp. 105‐111.
Reinartz, W. J., Kumar, V. (2002), "The mismanagement of customer loyalty", Harvard Business Review, Vol. 80 No. 7, p. 86‐94.
Reynolds, K.E., Beatty, S.E. (1999), “Customer benefits and company consequences of customer‐salesperson relationships in retailing”, Journal of Retailing, Vol. 75 No. 1, pp. 11‐32.
Ringle, C.M., Spreen, F. (2007), Beurteilung der Ergebnisse von PLS‐Pfadmodellen", WISU 2/07, pp. 211‐216.

References
98
Rust, R.T., Chung, T.S. (2006), "Marketing models of service and relationships", Marketing Science, Vol. 25 No. 6, pp. 560‐580.
Saunders, M., Lewis, P., Thornhill, A. (2007), Research methods for business students, London: Prentice Hall.
Schlesinger, L., Heskett, J. (1991), “Breaking the cycle of failure in services“, Sloan Management Review, Vol. 32, pp. 17‐28.
Sharp, A., Sharp, B., Wright, M., (2002), “Questioning the value of the ‘‘true’’ brand loyalty distinction”, International Journal of Research in Marketing, Vol. 19 No. 1, pp. 81–90.
Shaw, S. (2007), Airline marketing and management, 6th ed., Aldershot: Ashgate Publishing Ltd.
Sheth, J.N., Parvatiyar, A. (1995a) “The evolution of relationship marketing”, International Business Review, Vol. 4 No. 4, pp. 397‐418.
Sheth, J.N., Parvatiyar, A. (1995b), "Relationship marketing in consumer markets: antecedents and consequences", Journal of the Academy of Marketing Science, Vol. 23 No. 4, pp. 255‐271.
Sheth, J.N., Parvatiyar, A. (2002), "Evolving relationship marketing into a discipline", Journal of Relationship Marketing, Vol. 1 No. 1, pp. 3‐16.
Simon, B. (2008), "Zoom grounds transatlantic jet fleet", Financial Times Ltd., Aug. 28, 2008, retrieved: Feb. 09, 2009, URL: http://www.ft.com/cms/s/74bc5fde‐7532‐11dd‐ab30‐0000779fd18c,dwp_uuid=87ef6c98‐3018‐11da‐ba9f‐00000e2511c8,print=yes.html.
Sirgy, M.J., Lee, D.‐J., Johar, J.S., Tidwell, J. (2008), "Effect of self‐congruity with sponsorship on brand loyalty", Journal of Business Research, Vol. 61, pp. 1091‐1097.
Söderlund, M., Julander, C.‐R., (2003), "The variable nature of services: an empirical examination of trust and its effects on customers' satisfaction response to poor and good service", Total Quality Management, Vol. 14 No. 3, pp. 291‐304.
Solomon, M., Bamossy, G.J., Askegaard, S., Hogg, M., Longman, P. (2006), Consumer behavior: an European perspective, 3rd ed., Harlow: Financial Times Prentice Hall.
Sweeney, J.C., Chew, M. (2000), "Consumer‐brand relationships: an exploratory study in the services context", ANZMAC 2000 Visionary Marketing for the 21st Century: Facing the Challenge, pp. 1234‐1238.
Sweeney, J.C., Webb, D.A. (2007), "How functional, psychological, and social relationship benefits influence individual and firm commitment to the relationship", Journal of Business & Industrial Marketing, Vol. 22 No. 7, pp. 474‐488.
Teichert, T., Shehu, E., von Wartburg, I. (2008), "Customer segmentation revisited: the case of the airline industry", Transportation Research Part A: Policy and Practice, Vol. 42 No. 1, pp. 227‐242.
Tiernan, S., Rhoades, D.L., Waguespack, B. Jr. (2008), "Airline service quality: exploratory analysis of consumer expectations and operational performance in the USA and EU", Managing Service Quality, Vol. 18 No. 3, pp. 212‐224.
Vargo, S.L., Lusch, R.F. (2004), "Evolving to a new dominant logic for marketing", Journal of Marketing, Vol. 68, pp. 1‐17.
Vargo, S.L., Lusch, R.F. (2008a), "From goods to service(s): Divergence and convergence of logics", Industrial Marketing Management, Vol. 37, pp. 254‐259.
Vargo, S.L., Lusch, R.F. (2008b), “Service‐dominant logic: continuing the evolution", Journal of the Academy of Marketing Science, Vol. 36 No. 1, pp. 1‐10.

References
99
Wallin, A.C., Coote, L.V. (2007), "What do brands signal?" AMA Winter Educators' Conference Proceedings, Vol. 18, pp 90‐91.
Webster, F.E. (1994), “Defining the new marketing concept", Marketing Management, Vol. 2 No. 4, pp. 22‐31.
Wensveen, J.G., Leick, R. (2009), "The long‐haul low‐cost carrier: a unique business model", Journal of Air Transport Management, (forthcoming), pp. 1‐7.
Wikström, S. (1996), “Value creation by company‐consumer interaction”, Journal of Marketing Management, Vol. 12, pp. 359‐374.
Yen, H.J.R., Gwinner, K.P. (2003), "Internet retail customer loyalty: the mediating role of relational benefits", International Journal of Service Industry Management, Vol. 14 No. 5, pp. 483‐500.
Zeithaml, V.A. (1988), "Consumer perceptions of price, quality, and value: a means‐end model and synthesis of evidence", Journal of Marketing, Vol. 52, pp. 2‐22.
Zeithaml, V.A., Berry, L.B., Parasuraman, A. (1996), “The behavioral consequences of service quality”, Journal of Marketing, Vol. 60, pp. 31‐46.
Zeithaml, V.A., Bitner, M.J. (1996), Services Marketing, New York: McGraw‐Hill.
Zeithaml, V.A., Bitner, M.J. (2003), Services marketing: integrating customer focus across the firm, Boston: Irwin McGraw‐Hill.
Zhang, J., Bloemer, J.M.M., (2008), "The impact of value congruence on consumer‐service brand relationships", Journal of Service Research, Vol. 11 No.2, pp. 161‐178.
Zinnbauer, M., Eberl, M. (2004), "Die Überprüfung von Spezifikation und Güte von Strukturgleichungsmodellen: Verfahren und Anwendung", EFOplan, Heft 21/2004.
Zins, A.H. (2001), "Relative attitudes and commitment in customer loyalty models: some experience in the commercial airline industry", International Journal of Service Industry Management, Vol. 12 No. 3, pp. 269‐294.
Websites
Oneworld (2009), retrieved: Apr. 01, 2009, URL: http://www.oneworld.com/
SkyTeam (2009), retrieved: Apr. 01, 2009, URL: http://www.skyteam.com/about/carriers/index.html
Star Alliance (2009), retrieved: Apr. 01, 2009, URL: http://www.staralliance.com/en/meta/airlines/index.html

Appendices
100
Appendices
Appendix 1: Quality criteria for the validation of the ACL model in PLS
Quality criteria for the measurement model
Reflective variables Formative variables
Loading > 0.7 (better > 0.8) (not relevant) Weights (not relevant) (no specifications) T-values > 1.66 > 1.98 Convergent validity - Ave - Composite reliability
> 0.6 > 0.7
(not possible) (not possible)
Discriminant validity Fornell-Larcker-Criterion Composite correlations (< 0.9) Multicollinearity not possible Variance inflation factor (VIF) < 10
Table 18: Quality criteria for the measurement model16
Evaluating reflective variables
Item reliability: Value and significance of indicator loadings
In PLS individual item reliability is assessed by examining the loadings of the measures with
their respective construct (Hulland, 1999, p. 198). The loadings should at least exceed 0.6,
however a value above 0.8 is recommended for the variables to remain in the model
(Herrmann et al., 2006, p. 56 in: Huber et al., 2007, p. 87). Hulland suggests accepting items
with loadings of 0.7 or more and to drop items with loadings less than 0.5 (Hulland, 1999,
p. 198). The t‐values, which determine the significance of the loadings, should exceed the
value of 1.66 (Huber et al., 2007, pp. 87‐88).
Convergent validity
While individual item reliability and significance is assessed by the loadings and the
respective t‐values, the extent to which all items measuring a specific latent variable
demonstrate convergent validity should also be evaluated (Hulland, 1999, pp. 198‐199). PLS
reports the internal consistency of a set of items forming a specific scale as composite
reliability, a measure developed by Fornell and Larcker (1981, p. 45). According to the
authors, this measure is superior to Cronbach’s alpha since it does not assume that all
indicators are equally weighted (cf. Ringle & Spreen, 2007, p. 212; Hulland, 1999, p. 1999).
The AVE (average variance extracted) measures the variance explained by the relevant latent
variable relative to the amount due to measurement error and, should be above 0.6 (Huber
et al., 2007, p. 45). 16 In accordance with Huber et al. (2007, p. 45).
Appendices
101
Discriminant validity
The discriminant validity indicates “the extent to which measures of a given construct differ
from measures of other constructs in the same model” (Hulland, 1999, p. 199). A construct
should, therefore, share more variance with its measures than its shares with other
constructs in the model in order to constitute a self‐contained construct. The discriminant
validity is determined by the Fornell‐Larcker‐Criterion. For the criterion to be fulfilled, the
square rooted AVE of a latent construct needs to be greater than each correlation with
another construct (Hulland, 1999, p. 200).
Unidimensionality
Unidimensionality can be assessed by conducting an exploratory factor analysis. It is given,
when all indicators of a construct actually load on the construct they are supposed to be
measuring, while not loading on any other construct so that a definite allocation of
indicators with regard to a construct is possible. For the present analysis, the exploratory
factor analysis is conducted prior to the model’s estimation in smartPLS.
Evaluating formative variables
Item reliability: Value and significance of regression coefficients
To evaluate formative variables, the weights and the t‐values of the respective indicators
need to be evaluated. The weights make a statement about the predictive validity of an
indicator with respect to the latent variable possible. The respective t‐value gives evidence
to the reliability of the indicator. While there is no threshold specified for the formative
variable’s weights the t‐values should be above 1.98. However, indicators that do not fulfill
these criteria cannot easily be eliminated. As a formative construct is defined through the
totality of its indicators, “omitting an indicator is omitting a part of the construct” (Bollen &
Lenox, 1991, p. 308).
Discriminant validity
For formative variables, discriminant validity is achieved when the correlations in the
correlation matrix for the latent variables are smaller than 0.9 (Huber et al., 2007, p. 102).
Multicollinearity
Multicollinearity is given when the indicators of one latent variable are highly correlated
among themselves (cf. Hair et al., 2006, p 573). This should be avoided for formative
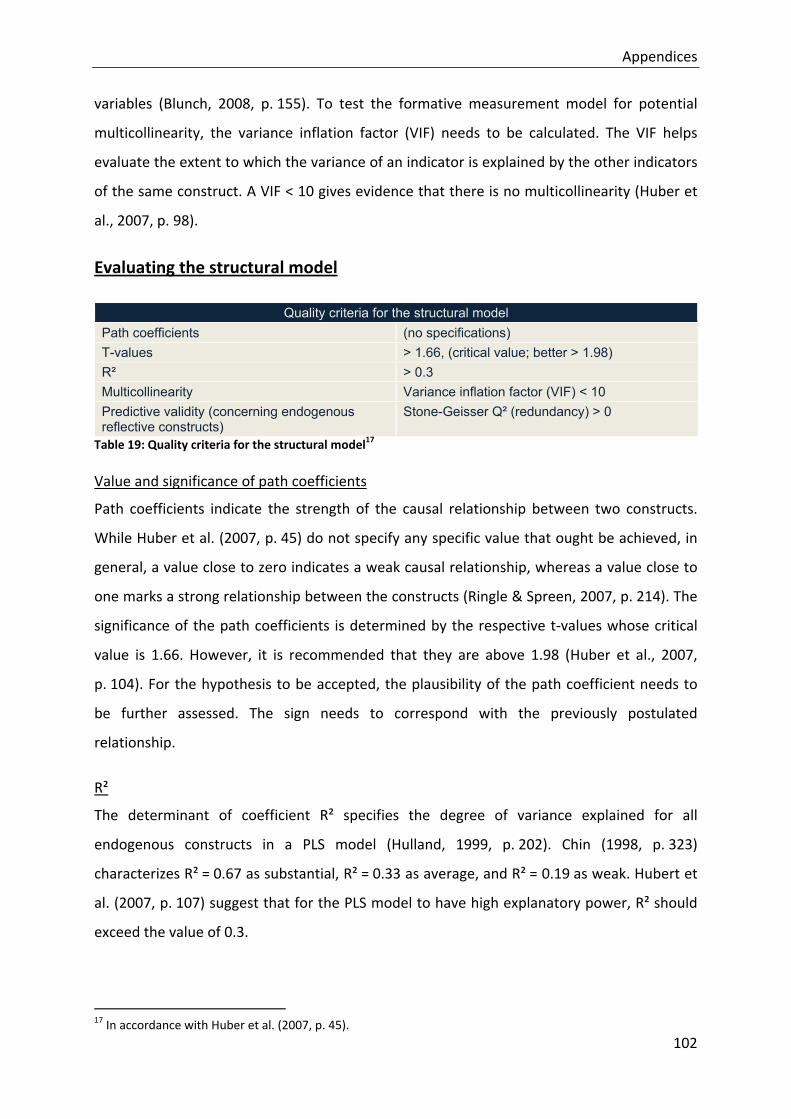
Appendices
102
variables (Blunch, 2008, p. 155). To test the formative measurement model for potential
multicollinearity, the variance inflation factor (VIF) needs to be calculated. The VIF helps
evaluate the extent to which the variance of an indicator is explained by the other indicators
of the same construct. A VIF < 10 gives evidence that there is no multicollinearity (Huber et
al., 2007, p. 98).
Evaluating the structural model
Quality criteria for the structural model Path coefficients (no specifications) T-values > 1.66, (critical value; better > 1.98) R² > 0.3 Multicollinearity Variance inflation factor (VIF) < 10 Predictive validity (concerning endogenous reflective constructs)
Stone-Geisser Q² (redundancy) > 0
Table 19: Quality criteria for the structural model17
Value and significance of path coefficients
Path coefficients indicate the strength of the causal relationship between two constructs.
While Huber et al. (2007, p. 45) do not specify any specific value that ought be achieved, in
general, a value close to zero indicates a weak causal relationship, whereas a value close to
one marks a strong relationship between the constructs (Ringle & Spreen, 2007, p. 214). The
significance of the path coefficients is determined by the respective t‐values whose critical
value is 1.66. However, it is recommended that they are above 1.98 (Huber et al., 2007,
p. 104). For the hypothesis to be accepted, the plausibility of the path coefficient needs to
be further assessed. The sign needs to correspond with the previously postulated
relationship.
R²
The determinant of coefficient R² specifies the degree of variance explained for all
endogenous constructs in a PLS model (Hulland, 1999, p. 202). Chin (1998, p. 323)
characterizes R² = 0.67 as substantial, R² = 0.33 as average, and R² = 0.19 as weak. Hubert et
al. (2007, p. 107) suggest that for the PLS model to have high explanatory power, R² should
exceed the value of 0.3.
17 In accordance with Huber et al. (2007, p. 45).

Appendices
103
Multicollinearity
For each endogenous construct that is explained by two or more latent variables, the
structural model also has to be tested for multicollinearity, which should be avoided. For the
structural model, the variance inflation factor (VIF) should be < 10. In order to conduct a
regression analysis in SPSS, weighted construct values for each variable have to be
calculated. The adjusted R², which result from the regression are used for the calculations of
the VIF.
Predictive validity
The predictive validity of the proposed model can be assessed with the help of Stone‐Geisser
Q². If Q² = 1, the observed endogenous variables can be perfectly reconstructed by the
model (Fornell & Bookstein, 1982, p. 449). For the model to have predictive relevance, Q²
needs to be > 0.
Appendices
104
Appendix 2: Questionnaire

Appendices
105

Appendices
106
Appendices
107
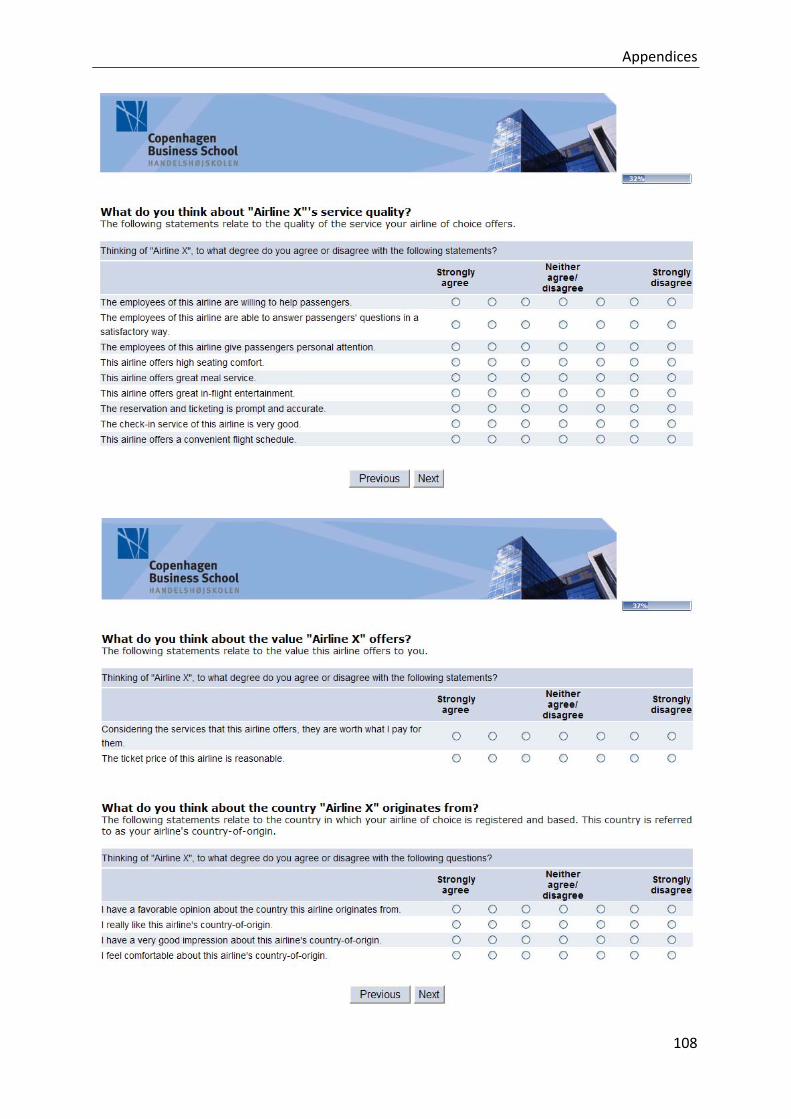
Appendices
108

Appendices
109

Appendices
110
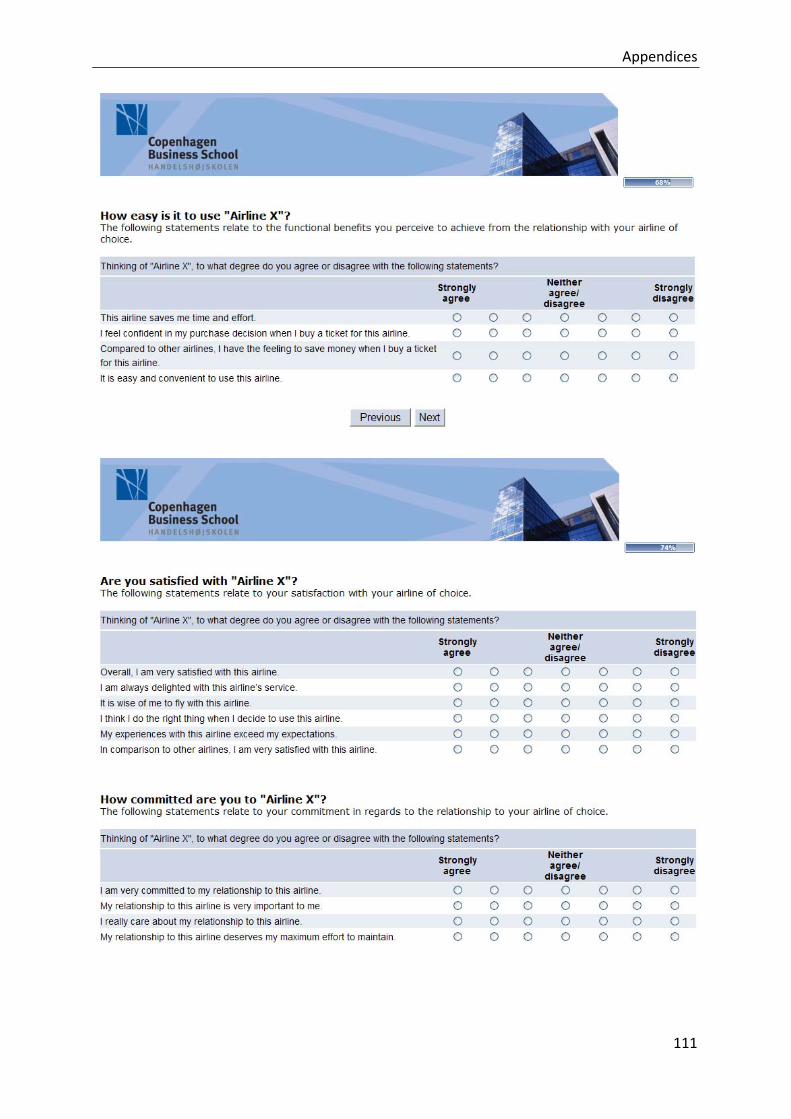
Appendices
111

Appendices
112
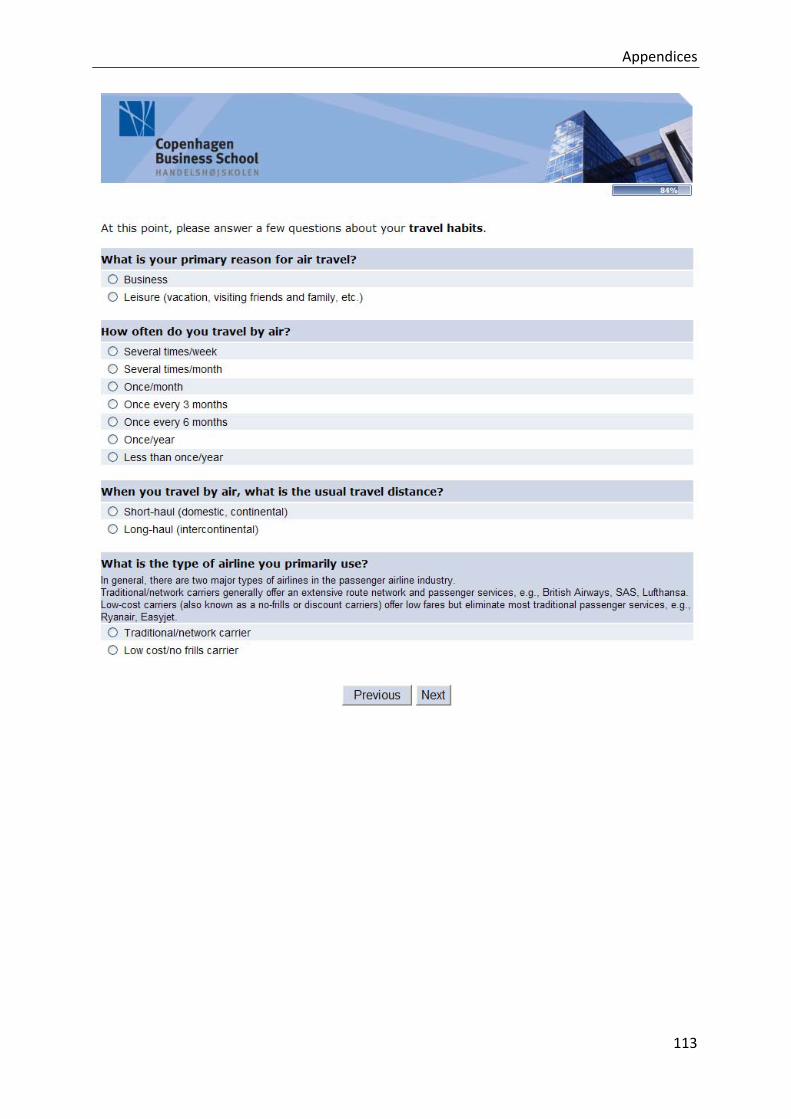
Appendices
113

Appendices
114

Appendices
115

Appendices
116
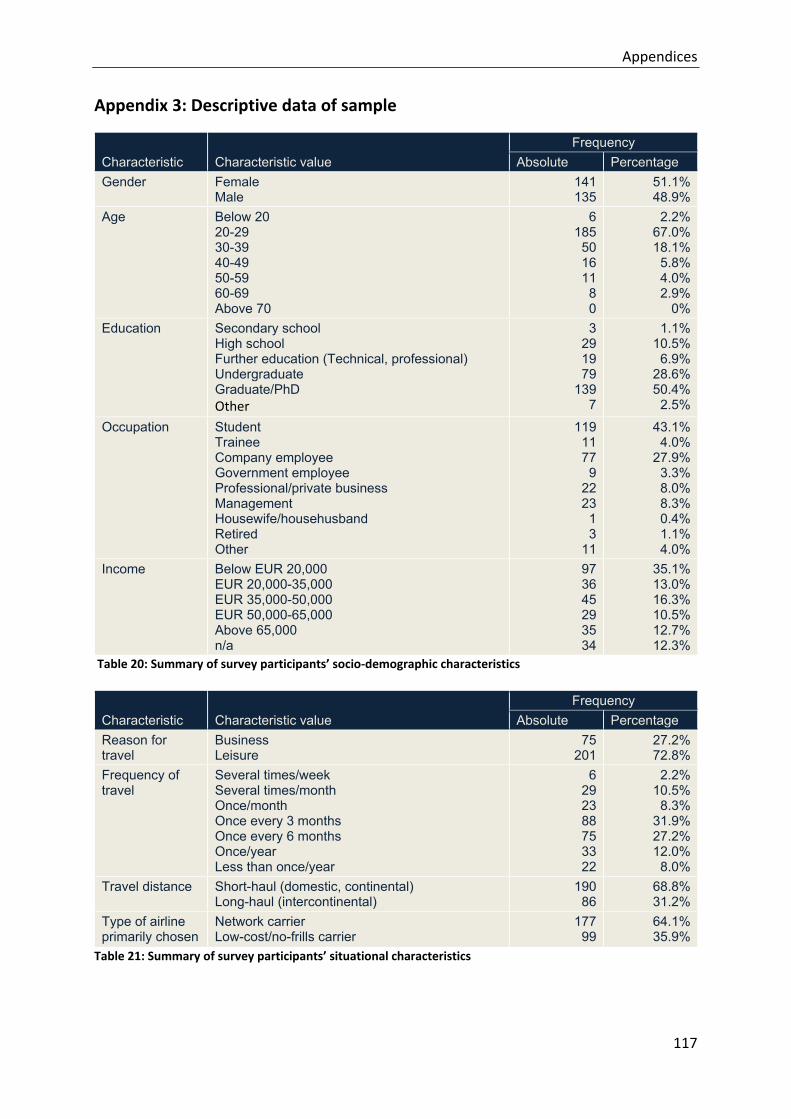
Appendices
117
Appendix 3: Descriptive data of sample
Characteristic Characteristic value Frequency
Absolute Percentage Gender Female
Male 141 135
51.1%48.9%
Age Below 20 20-29 30-39 40-49 50-59 60-69 Above 70
6 185
50 16 11 8 0
2.2%67.0%18.1%
5.8%4.0%2.9%
0%Education Secondary school
High school Further education (Technical, professional) Undergraduate Graduate/PhD Other
3 29 19 79
139 7
1.1%10.5%
6.9%28.6%50.4%
2.5%
Occupation Student Trainee Company employee Government employee Professional/private business Management Housewife/househusband Retired Other
119 11 77 9
22 23 1 3
11
43.1%4.0%
27.9%3.3%8.0%8.3%0.4%1.1%4.0%
Income Below EUR 20,000 EUR 20,000-35,000 EUR 35,000-50,000 EUR 50,000-65,000 Above 65,000 n/a
97 36 45 29 35 34
35.1%13.0%16.3%10.5%12.7%12.3%
Table 20: Summary of survey participants’ socio‐demographic characteristics
Characteristic Characteristic value Frequency
Absolute Percentage Reason for travel
Business Leisure
75 201
27.2%72.8%
Frequency of travel
Several times/week Several times/month Once/month Once every 3 months Once every 6 months Once/year Less than once/year
6 29 23 88 75 33 22
2.2%10.5%
8.3%31.9%27.2%12.0%
8.0%Travel distance Short-haul (domestic, continental)
Long-haul (intercontinental) 190
86 68.8%31.2%
Type of airline primarily chosen
Network carrier Low-cost/no-frills carrier
177 99
64.1%35.9%
Table 21: Summary of survey participants’ situational characteristics
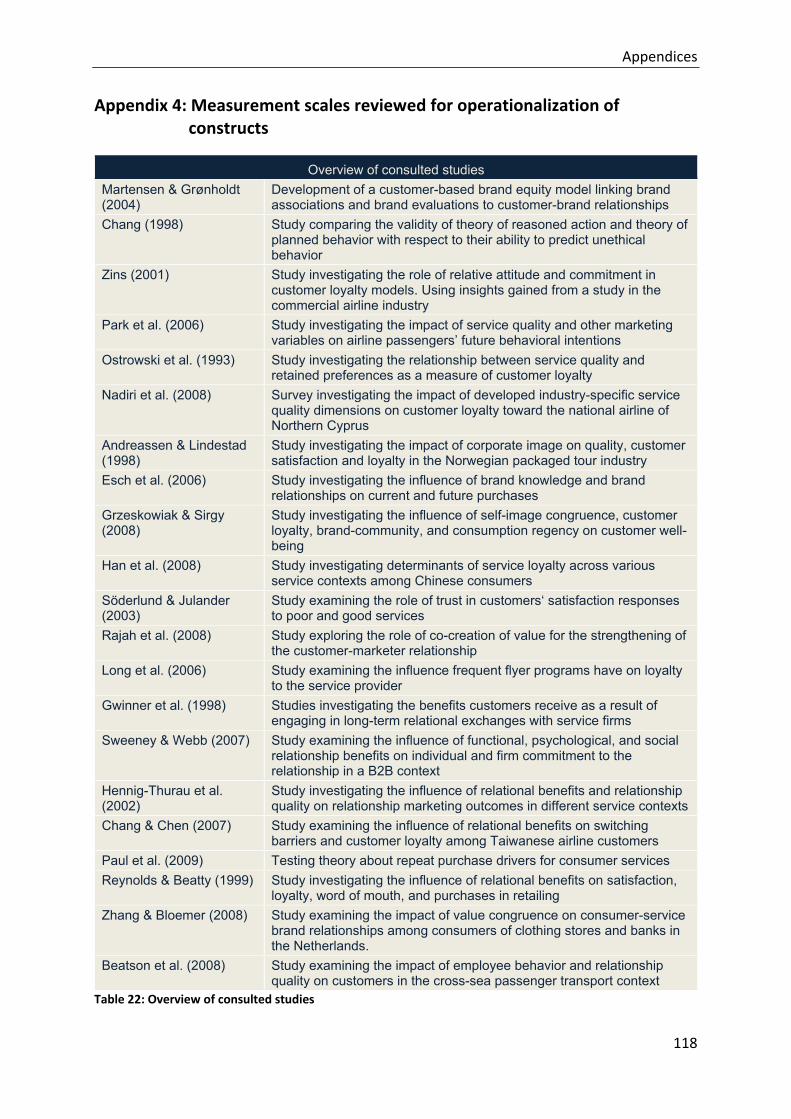
Appendices
118
Appendix 4: Measurement scales reviewed for operationalization of constructs
Overview of consulted studies Martensen & Grønholdt (2004)
Development of a customer-based brand equity model linking brand associations and brand evaluations to customer-brand relationships
Chang (1998) Study comparing the validity of theory of reasoned action and theory of planned behavior with respect to their ability to predict unethical behavior
Zins (2001) Study investigating the role of relative attitude and commitment in customer loyalty models. Using insights gained from a study in the commercial airline industry
Park et al. (2006) Study investigating the impact of service quality and other marketing variables on airline passengers’ future behavioral intentions
Ostrowski et al. (1993) Study investigating the relationship between service quality and retained preferences as a measure of customer loyalty
Nadiri et al. (2008) Survey investigating the impact of developed industry-specific service quality dimensions on customer loyalty toward the national airline of Northern Cyprus
Andreassen & Lindestad (1998)
Study investigating the impact of corporate image on quality, customer satisfaction and loyalty in the Norwegian packaged tour industry
Esch et al. (2006) Study investigating the influence of brand knowledge and brand relationships on current and future purchases
Grzeskowiak & Sirgy (2008)
Study investigating the influence of self-image congruence, customer loyalty, brand-community, and consumption regency on customer well-being
Han et al. (2008) Study investigating determinants of service loyalty across various service contexts among Chinese consumers
Söderlund & Julander (2003)
Study examining the role of trust in customers‘ satisfaction responses to poor and good services
Rajah et al. (2008) Study exploring the role of co-creation of value for the strengthening of the customer-marketer relationship
Long et al. (2006) Study examining the influence frequent flyer programs have on loyalty to the service provider
Gwinner et al. (1998) Studies investigating the benefits customers receive as a result of engaging in long-term relational exchanges with service firms
Sweeney & Webb (2007) Study examining the influence of functional, psychological, and social relationship benefits on individual and firm commitment to the relationship in a B2B context
Hennig-Thurau et al. (2002)
Study investigating the influence of relational benefits and relationship quality on relationship marketing outcomes in different service contexts
Chang & Chen (2007) Study examining the influence of relational benefits on switching barriers and customer loyalty among Taiwanese airline customers
Paul et al. (2009) Testing theory about repeat purchase drivers for consumer services Reynolds & Beatty (1999) Study investigating the influence of relational benefits on satisfaction,
loyalty, word of mouth, and purchases in retailing Zhang & Bloemer (2008) Study examining the impact of value congruence on consumer-service
brand relationships among consumers of clothing stores and banks in the Netherlands.
Beatson et al. (2008) Study examining the impact of employee behavior and relationship quality on customers in the cross-sea passenger transport context
Table 22: Overview of consulted studies
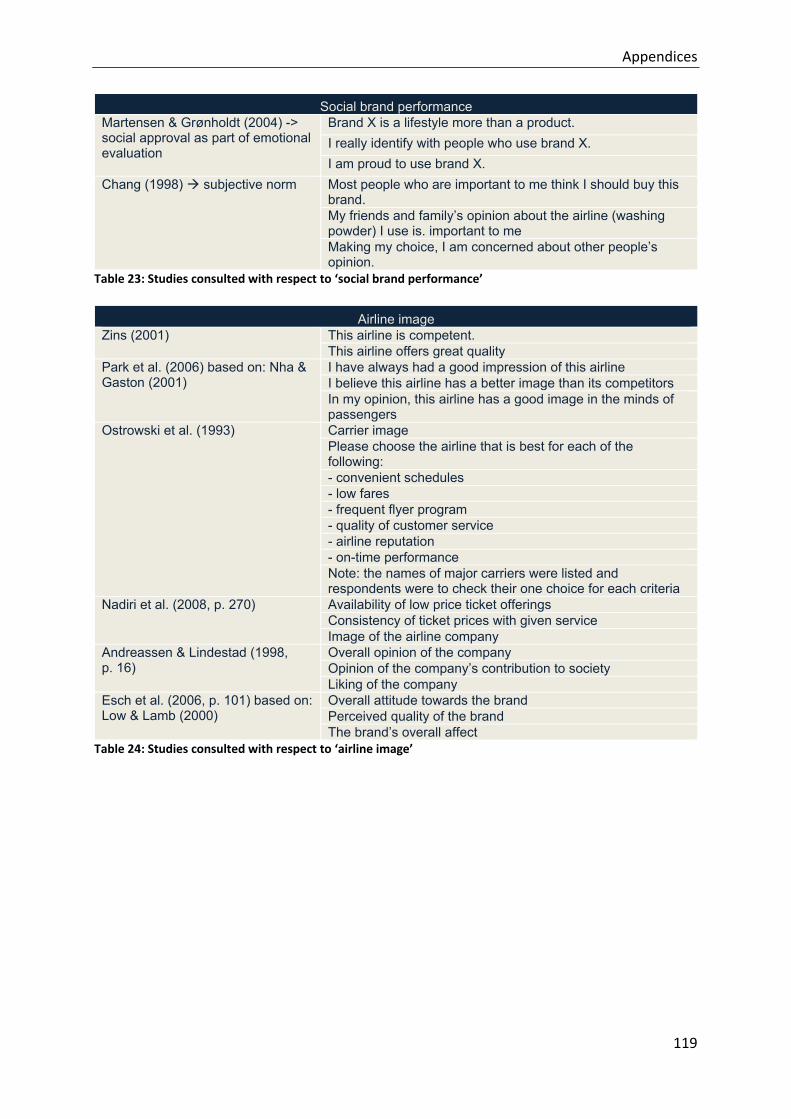
Appendices
119
Social brand performance Martensen & Grønholdt (2004) -> social approval as part of emotional evaluation
Brand X is a lifestyle more than a product. I really identify with people who use brand X. I am proud to use brand X.
Chang (1998) subjective norm Most people who are important to me think I should buy this brand. My friends and family’s opinion about the airline (washing powder) I use is. important to me Making my choice, I am concerned about other people’s opinion.
Table 23: Studies consulted with respect to ‘social brand performance’
Airline image Zins (2001) This airline is competent.
This airline offers great quality Park et al. (2006) based on: Nha & Gaston (2001)
I have always had a good impression of this airline I believe this airline has a better image than its competitors In my opinion, this airline has a good image in the minds of passengers
Ostrowski et al. (1993) Carrier image Please choose the airline that is best for each of the following: - convenient schedules - low fares - frequent flyer program - quality of customer service - airline reputation - on-time performance Note: the names of major carriers were listed and respondents were to check their one choice for each criteria
Nadiri et al. (2008, p. 270) Availability of low price ticket offerings Consistency of ticket prices with given service Image of the airline company
Andreassen & Lindestad (1998, p. 16)
Overall opinion of the company Opinion of the company’s contribution to society Liking of the company
Esch et al. (2006, p. 101) based on: Low & Lamb (2000)
Overall attitude towards the brand Perceived quality of the brand The brand’s overall affect
Table 24: Studies consulted with respect to ‘airline image’
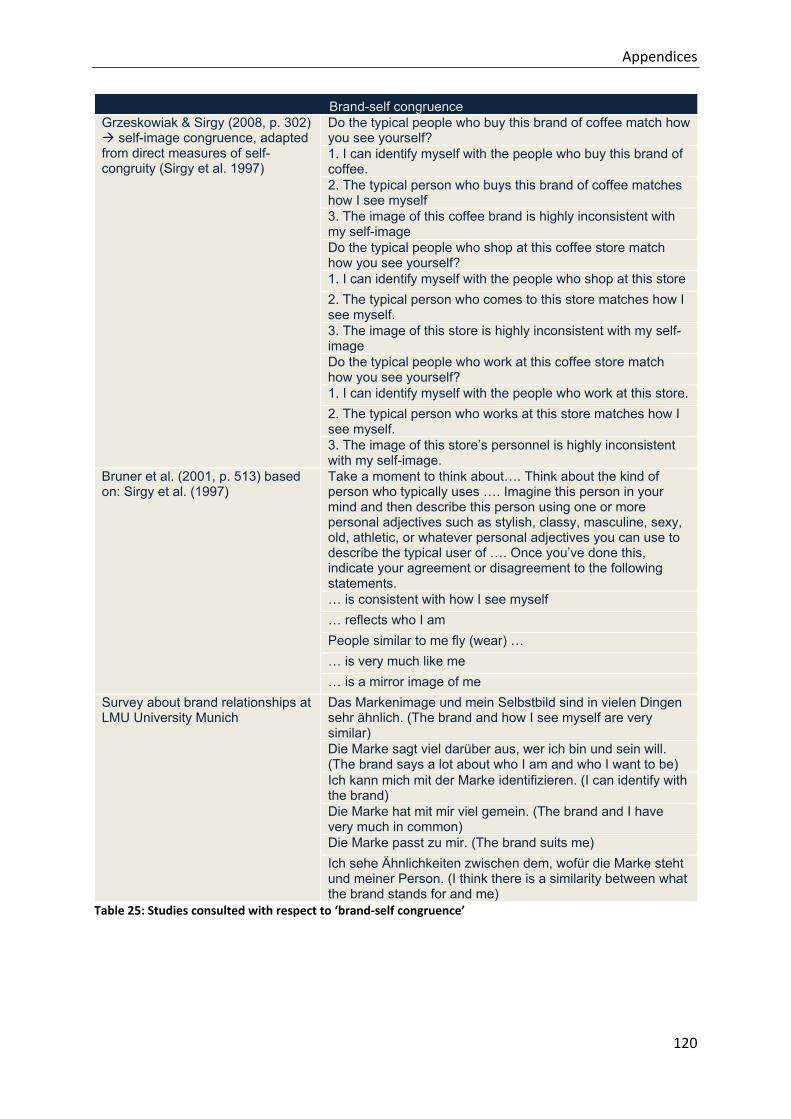
Appendices
120
Brand-self congruence Grzeskowiak & Sirgy (2008, p. 302)
self-image congruence, adapted from direct measures of self-congruity (Sirgy et al. 1997)
Do the typical people who buy this brand of coffee match how you see yourself? 1. I can identify myself with the people who buy this brand of coffee. 2. The typical person who buys this brand of coffee matches how I see myself 3. The image of this coffee brand is highly inconsistent with my self-image Do the typical people who shop at this coffee store match how you see yourself? 1. I can identify myself with the people who shop at this store 2. The typical person who comes to this store matches how I see myself. 3. The image of this store is highly inconsistent with my self-image Do the typical people who work at this coffee store match how you see yourself? 1. I can identify myself with the people who work at this store. 2. The typical person who works at this store matches how I see myself. 3. The image of this store’s personnel is highly inconsistent with my self-image.
Bruner et al. (2001, p. 513) based on: Sirgy et al. (1997)
Take a moment to think about…. Think about the kind of person who typically uses …. Imagine this person in your mind and then describe this person using one or more personal adjectives such as stylish, classy, masculine, sexy, old, athletic, or whatever personal adjectives you can use to describe the typical user of …. Once you’ve done this, indicate your agreement or disagreement to the following statements. … is consistent with how I see myself … reflects who I am People similar to me fly (wear) … … is very much like me … is a mirror image of me
Survey about brand relationships at LMU University Munich
Das Markenimage und mein Selbstbild sind in vielen Dingen sehr ähnlich. (The brand and how I see myself are very similar) Die Marke sagt viel darüber aus, wer ich bin und sein will. (The brand says a lot about who I am and who I want to be) Ich kann mich mit der Marke identifizieren. (I can identify with the brand) Die Marke hat mit mir viel gemein. (The brand and I have very much in common) Die Marke passt zu mir. (The brand suits me) Ich sehe Ähnlichkeiten zwischen dem, wofür die Marke steht und meiner Person. (I think there is a similarity between what the brand stands for and me)
Table 25: Studies consulted with respect to ‘brand‐self congruence’

Appendices
121
Trustworthiness Martensen & Groenholdt (2004) Trust and credibility
Brand X is trustworthy and credible Brand X communicates openly and honestly I have great faith in brand X
Han et al. (2008, p. 39) Trust This hotel is trustworthy because it is concerned with the customer’s interests. This hotel treats customers with honesty. This hotel has the ability to provide for my needs. I trust and am willing to depend on this hotel.
Söderlund & Julander (2003) based on: Anderson et al. (1994); Ganesan, (1994); Garbarino & Johnson (1999); Morgan & Hunt (1994)
X keeps its promise to me X does really care for me I feel I can trust X X is concerned about my well-being I feel confidence with regards to X
Table 26: Studies consulted with respect to ‘trustworthiness’
Service quality Zins (2001) In-flight comfort
- leg-room - chair width Personal service - friendliness - service on board Catering - variety - quality
Park et al. (2006) Reliability and customer service - courtesy of employees - employees who are willing to help passengers - employees who have the knowledge to answer passengers' questions - give passengers personal attention - neat appearance of employee - safety of flying - sincere interest in solving problems - on-time performance Convenience and accessibility - convenience of reservation and ticketing - Promptness and accuracy of reservation and ticketing - Check-in service - Frequent flyer program - Promptness and accuracy of baggage delivery - availability of non-stop flight - Convenient flight schedule - seat allocation - amount imposed for overweight baggage In-flight service (Park et al., 2006) - seating comfort - seat space and legroom - meal service - in-flight entertainment services - up-to-date aircraft and in-flight facilities
Martensen & Grønholdt (2004) The employees are competent The employees give me individual attention The employees are courteous and forthcoming

Appendices
122
Han et al. (2008) Service reliability (very unreliable/very reliable) Service individuation (very standard/very individualized) Service professionalism (very unprofessional/very professional) Service speed (very slow/very fast) Service facilities (very dated/very advanced) Staff appearance and manner (very inappropriate/very appropriate) Staff interest and caring (very little/very much) Overall service quality (poor/excellent)
Table 27: Studies consulted with respect to ‘service quality’
Perceived value Park et al. (2006) Considering the services that the airline offers, are they worth
what you paid for them? The ticket price of this airline is reasonable
Martensen & Groenholdt (2004) brand value as dimension of rational evaluation
Brand X provides good value for money Brand X lives up to my expectations It makes sense to buy brand X instead of any other brand, even if they are the same
Andreassen & Lindestad (1998, p. 15)
Quality given price Price given quality
Table 28: Studies consulted with respect to ‘perceived value’
Co-creation of value Rajah et al. (2008) The company really went out of its way to work with the
customer. The final purchase solution was arrived at mainly through the joint effort of the company and the customer. I would describe the situation described as a very high level of purchasing co-creation.
Table 29: Study consulted with respect to ‘co‐creation of value’
FFP attractiveness Long et al. (2006) Keeping score
Program benefits Flight treatment Administrative issues
Table 30: Study consulted with respect to ‘FFP attractiveness’
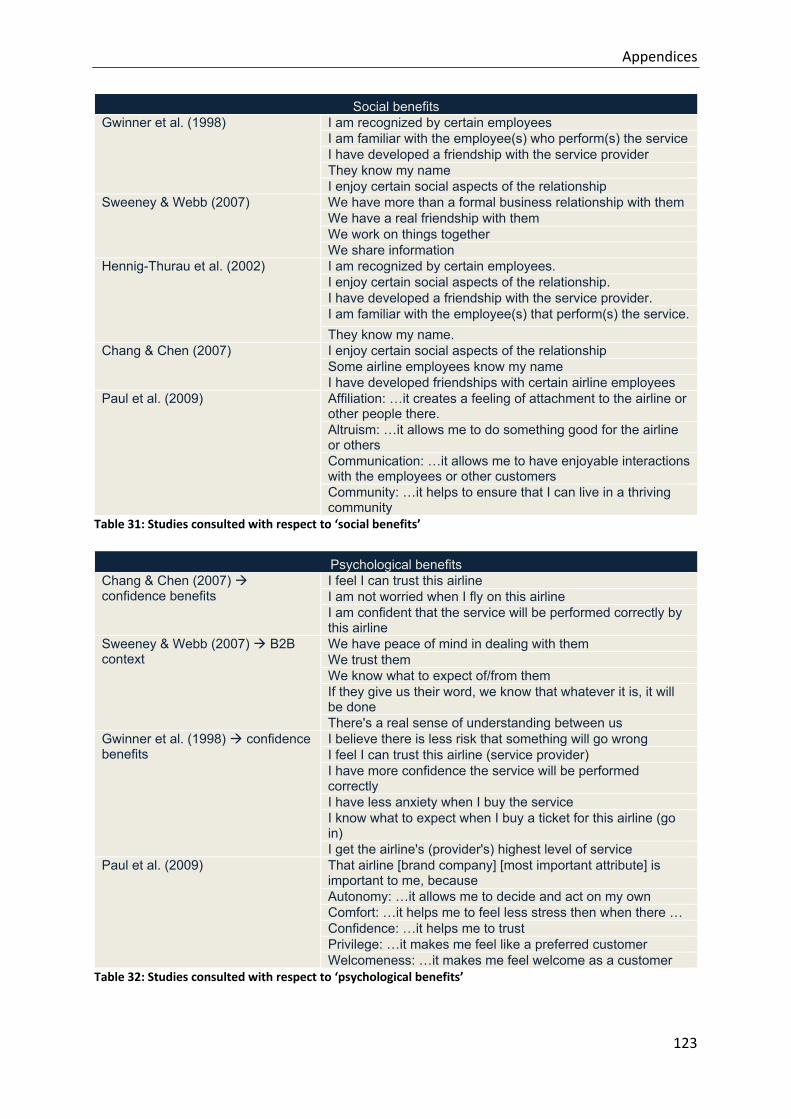
Appendices
123
Social benefits Gwinner et al. (1998) I am recognized by certain employees
I am familiar with the employee(s) who perform(s) the service I have developed a friendship with the service provider They know my name I enjoy certain social aspects of the relationship
Sweeney & Webb (2007) We have more than a formal business relationship with them We have a real friendship with them We work on things together We share information
Hennig-Thurau et al. (2002) I am recognized by certain employees. I enjoy certain social aspects of the relationship. I have developed a friendship with the service provider. I am familiar with the employee(s) that perform(s) the service. They know my name.
Chang & Chen (2007) I enjoy certain social aspects of the relationship Some airline employees know my name I have developed friendships with certain airline employees
Paul et al. (2009) Affiliation: …it creates a feeling of attachment to the airline or other people there. Altruism: …it allows me to do something good for the airline or others Communication: …it allows me to have enjoyable interactions with the employees or other customers Community: …it helps to ensure that I can live in a thriving community
Table 31: Studies consulted with respect to ‘social benefits’
Psychological benefits Chang & Chen (2007) confidence benefits
I feel I can trust this airline I am not worried when I fly on this airline I am confident that the service will be performed correctly by this airline
Sweeney & Webb (2007) B2B context
We have peace of mind in dealing with them We trust them We know what to expect of/from them If they give us their word, we know that whatever it is, it will be done There's a real sense of understanding between us
Gwinner et al. (1998) confidence benefits
I believe there is less risk that something will go wrong I feel I can trust this airline (service provider) I have more confidence the service will be performed correctly I have less anxiety when I buy the service I know what to expect when I buy a ticket for this airline (go in) I get the airline's (provider's) highest level of service
Paul et al. (2009) That airline [brand company] [most important attribute] is important to me, because Autonomy: …it allows me to decide and act on my own Comfort: …it helps me to feel less stress then when there … Confidence: …it helps me to trust Privilege: …it makes me feel like a preferred customer Welcomeness: …it makes me feel welcome as a customer
Table 32: Studies consulted with respect to ‘psychological benefits’

Appendices
124
Functional benefits Reynolds & Beatty (1999) I value the convenience benefits my airline (sales associate)
provides me very highly. I value the time saving benefits my airline (sales associate) provides me very highly. I benefit from the advice my sales associate gives me. I make better purchase decisions because of my sales associate.
Chang & Chen (2007) special treatment benefits
I can get faster service if necessary I am placed higher on the stand-by lost when the flight is full This airline will manage to give me a seat when the flight is full This airline will upgrade my seat when possible
Gwinner et al. (1998) special treatment benefits
I get discounts or special deals that most customers do not get I get better prices than most customers They do services for me that they do not do for most customers I am placed higher on the priority list when there is a line I get faster service than most customers.
Paul et al. (2009) That airline [brand company] [most important attribute] is important to me, because Convenience: …it helps me to save time and effort Knowledge: …it allows me to feel informed Money savings: …it helps me to save money
Table 33: Studies consulted with respect to ‘functional benefits’
Customer satisfaction Park et al. (2006) based on: Oliver (1980)
Overall, how satisfied are you with the airline's service quality? My choice to use this airline was a wise one I think that I did the right thing when I decided to use this airline
Hennig-Thurau et al. (2002) My choice to use this airline (company) was a wise one. I am always delighted with this airline's (firm’s) service. Overall, I am satisfied with this airline (organization). I think I did the right thing when I decided to use this airline (firm).
Zhang & Bloemer (2008) adapted from: Bettencourt (1997)
Compared to other airlines (banks), I am very satisfied with X Based on all my experience with X, I am very satisfied My experiences at X have always been pleasant Overall, I am satisfied with X
Martensen & Groenholdt (2004) satisfaction as dimension of rational evaluation
Overall, how satisfied are you with brand X? How well does brand X meet your expectations? When thinking of your ideal brand, how well does brand X compare?
Andreassen & Lindestad (1998, p. 16)
Overall satisfaction Comparison with an ideal package tour company Congruence with expectations
Han et al. (2008, p. 39) I am satisfied with my experiences in this hotel. I have had pleasurable stays in this hotel. I am satisfied with this hotel overall. My experiences at this hotel have exceeded my expectations.It was wise of me to stay at this hotel.
Table 34: Studies consulted with respect to ‘customer satisfaction’

Appendices
125
Relationship commitment Hennig-Thurau et al. (2002) My relationship to this specific airline (service provider) . . .
- is something that I am very committed to. - is very important to me. - is something I really care about. - deserves my maximum effort to maintain.
Beatson et al. (2008) I am loyal to [firm name]. I am committed to my relationship with [firm name] because I like being associated with them I feel strongly attached to [firm name]. I would like to develop a long term relationship with [firm name]. I feel a sense of belonging to [firm name].
Table 35: Studies consulted with respect to ‘relationship commitment’
Repurchase intention Nadiri et al. (2008) I consider this airline company first choice for air
transportation. I will consider this airline company more for air transport in the next few years.
Chang & Chen (2007) I will continue patronizing this airline. Zhang & Bloemer (2008) adapted from: Lam et al. (2004); Zeithaml et al. (1996)
I consider X as my first choice for airlines (banks). I will do more business with X in the next few years. If I had to do it over again, I would make the same choice.
Positive word-of-mouth Nadiri et al. (2008) I say positive things about this airline company to other
people. I recommend this airline company to someone who seeks my advice. I encourage my friends and relatives to fly with this airline company.
Chang & Chen (2007) I say positive things about this airline to others. I recommend this airline to others.
Hennig-Thurau et al. (2002) I often recommend this airline (service provider) to others. Zhang & Bloemer (2008) adapted from: Fullerton (2003); Zeithaml et al. (1996)
I say positive things about X to other people. I recommend X to people who seek my advice. I encourage friends and relatives to do business with X.
Willingness to interact Martensen & Groenholdt (2004) engagement
I am very interested in brand X.
Willingness to pay more Zhang & Bloemer (2008) I am willing to continue to do business with X, even if its
prices increase. I am willing to pay a higher price than other airlines (banks) charge for the benefits I currently receive from X.
Table 36: Studies consulted with respect to ‘customer loyalty’

Appendices
126
Appendix 5: Measurement items included in questionnaire
Model constructs Measurement items
Soc
ial b
rand
pe
rform
ance
1. Most people who are important to me like this airline. 2. My friends and family highly value this airline. 3. I am proud to fly with this airline. 4. This airline represents a specific lifestyle. 5. I think that a lot of people have a high opinion about this airline.
Airl
ine
imag
e
1. I have always had a good impression of this airline. 2. I believe this airline has a better image than its competitors. 3. In my opinion, this airline has a good image in the minds of passengers. 4. I think that this airline has a good reputation in society.
Bra
nd-s
elf
cong
ruen
ce
1. The brand image and how I see myself are very similar. 2. The brand says a lot about who I am and who I want to be. 3. I can identify with the brand. 4. The brand and I have very much in common. 5. I think there is a similarity between what the brand stands for and me. 6. The brand suits me.
Trus
t-w
orth
ines
s
1. This airline is upright and sincere. 2. This airline cares about my needs. 3. This airline is concerned about my well-being. 4. This airline is trustworthy and credible. 5. This airline communicates openly and honestly.
Ser
vice
qua
lity
1. The employees of this airline are willing to help passengers. 2. The employees of this airline are able to answer passengers’ questions in a
satisfactory way. 3. The employees of this airline give passengers personal attention. 4. This airline offers high seating comfort. 5. This airline offers great meal service. 6. This airline offers great in-flight entertainment. 7. The reservation and ticketing is prompt and accurate. 8. The check-in service of this airline is very good. 9. This airline offers a convenient flight schedule.
Perceived value
1. Considering the services that this airline offers, they are worth what I pay for them. 2. The ticket price of this airline is reasonable.
Co-
crea
tion
of
valu
e
1. If necessary, this airline really goes out of its way to react to my need. 2. If there is a problem, this airline is interested in what I have to say. 3. This airline tailors its service to my needs. 4. I find it easy to contact this airline. 5. I feel that my comments and concerns are highly valued by this airline. 6. This airline is responsive to me needs. 7. I have experienced this airline offering non-standardized levels of service to me.
Cou
ntry
-of
-Orig
in 1. I have a favorable opinion about the country this airline originates from.
2. I really like this airline’s country-of-origin. 3. I have a very good impression about this airline’s country-of-origin. 4. I feel comfortable about this airline’s country-of-origin.
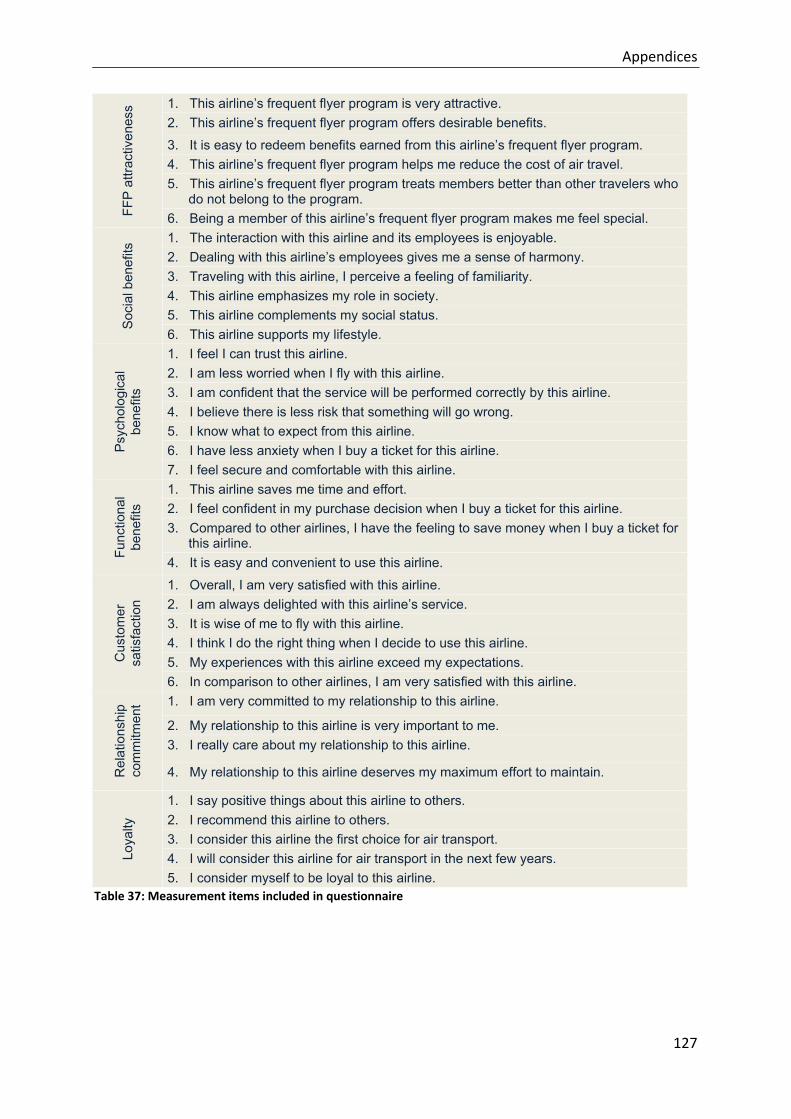
Appendices
127
FFP
attr
activ
enes
s 1. This airline’s frequent flyer program is very attractive. 2. This airline’s frequent flyer program offers desirable benefits.
3. It is easy to redeem benefits earned from this airline’s frequent flyer program. 4. This airline’s frequent flyer program helps me reduce the cost of air travel. 5. This airline’s frequent flyer program treats members better than other travelers who
do not belong to the program. 6. Being a member of this airline’s frequent flyer program makes me feel special.
Soc
ial b
enef
its 1. The interaction with this airline and its employees is enjoyable.
2. Dealing with this airline’s employees gives me a sense of harmony. 3. Traveling with this airline, I perceive a feeling of familiarity. 4. This airline emphasizes my role in society. 5. This airline complements my social status. 6. This airline supports my lifestyle.
Psy
chol
ogic
al
bene
fits
1. I feel I can trust this airline. 2. I am less worried when I fly with this airline. 3. I am confident that the service will be performed correctly by this airline. 4. I believe there is less risk that something will go wrong. 5. I know what to expect from this airline. 6. I have less anxiety when I buy a ticket for this airline. 7. I feel secure and comfortable with this airline.
Func
tiona
l be
nefit
s
1. This airline saves me time and effort. 2. I feel confident in my purchase decision when I buy a ticket for this airline. 3. Compared to other airlines, I have the feeling to save money when I buy a ticket for
this airline. 4. It is easy and convenient to use this airline.
Cus
tom
er
satis
fact
ion
1. Overall, I am very satisfied with this airline. 2. I am always delighted with this airline’s service. 3. It is wise of me to fly with this airline. 4. I think I do the right thing when I decide to use this airline. 5. My experiences with this airline exceed my expectations. 6. In comparison to other airlines, I am very satisfied with this airline.
Rel
atio
nshi
p co
mm
itmen
t 1. I am very committed to my relationship to this airline.
2. My relationship to this airline is very important to me. 3. I really care about my relationship to this airline.
4. My relationship to this airline deserves my maximum effort to maintain.
Loya
lty
1. I say positive things about this airline to others. 2. I recommend this airline to others. 3. I consider this airline the first choice for air transport. 4. I will consider this airline for air transport in the next few years. 5. I consider myself to be loyal to this airline.
Table 37: Measurement items included in questionnaire

Appendices
128
Appendix 6: Results of exploratory factor analysis
KMO- und Bartlett’s Test Kaiser-Meyer-Olkin measure of sampling adequacy
,920Bartlett’s Test of Sphericity Approx. Chi-sq. 9439,231 df 741
Sig. ,000Table 38: KMO‐ and Bartlett‐test for constructs of brand performance characteristics
Rotated component matrix
Component 1 2 3 4 5 6 7 Remarks
Bsc4 ,866 Bsc5 ,863 Bsc3 ,851 Bsc2 ,840 Bsc1 ,823 Bsc6 ,801 Spb4 ,614 Deleted before
PLS analysis Spb3 ,592 CoV6 ,833 CoV2 ,831 CoV5 ,816 CoV3 ,783 CoV1 ,716 CoV7 ,696 CoV4 ,569 AirI4 ,749
Merged to become indicators for airline reputation
AirI3 ,732 ,430 Sbp2 ,716 Sbp1 ,714 AirI2 ,696 Spb5 ,690 AirI1 ,547 FFP2 ,868 FFP1 ,826 FFP3 ,826 FFP4 ,711 FFP5 ,698 FFP6 ,678 CoO2 ,943 CoO3 ,928 CoO4 ,914 CoO1 ,884 Trustw4 ,710 Trustw5 ,662 Trustw1 ,650 Trustw2 ,631 Trustw3 ,600 Perv2 ,917 Perv1 ,900
Table 39: Rotated component matrix for constructs of brand performance characteristics

Appendices
129
KMO- und Bartlett’s Test Kaiser-Meyer-Olkin measure of sampling adequacy
,902Bartlett’s Test of Sphericity Approx. Chi-sq. 3239,738
df 136Sig. ,000
Table 40: KMO‐ and Bartlett‐test for constructs of relational benefits
Rotated component matrix
Component 1 2 3 Remarks
PsyBen4 ,865 PsyBen7 ,841 PsyBen2 ,834 PsyBen6 ,789 PsyBen3 ,728 PsyBen1 ,688 PsyBen5 ,650 SocBen4 ,881 SocBen5 ,866 SocBen6 ,813 SocBen2 ,724 SocBen3 ,691 SocBen1 ,579 FunBen4 ,743FunBen3 ,733FunBen1 ,680 Deleted before
PLS analysis FunBen2 ,534 ,585Table 41: Rotated component matrix for constructs of relational benefits
KMO- and Bartlett’s Test Kaiser-Meyer-Olkin measure of sampling adequacy
,877Bartlett’s Test of Sphericity Approx. Chi-sq. 2337,254
df 45Sig. ,000
Table 42: KMO‐ and Bartlett‐test for constructs of relationship quality
Rotated component matrix Component
1 2 Sat1 ,840 Sat4 ,831 Sat6 ,794 Sat2 ,785 Sat3 ,779 Sat5 ,740 Comm3 ,951 Comm2 ,940 Comm4 ,910 Comm1 ,778
Table 43: Rotated component matrix for constructs of relationship quality
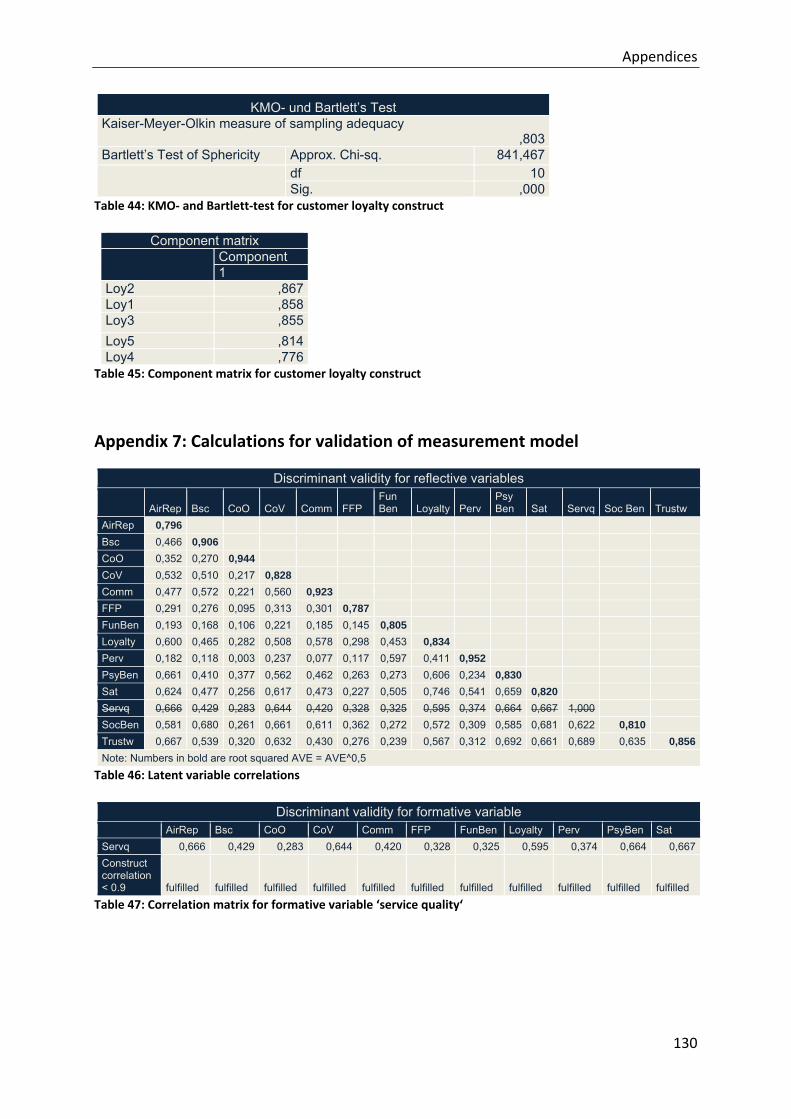
Appendices
130
KMO- und Bartlett’s Test Kaiser-Meyer-Olkin measure of sampling adequacy
,803Bartlett’s Test of Sphericity Approx. Chi-sq. 841,467
df 10Sig. ,000
Table 44: KMO‐ and Bartlett‐test for customer loyalty construct
Component matrix
Component 1
Loy2 ,867 Loy1 ,858 Loy3 ,855 Loy5 ,814 Loy4 ,776
Table 45: Component matrix for customer loyalty construct
Appendix 7: Calculations for validation of measurement model
Discriminant validity for reflective variables
AirRep Bsc CoO CoV Comm FFP Fun Ben Loyalty Perv
Psy Ben Sat Servq Soc Ben Trustw
AirRep 0,796 Bsc 0,466 0,906 CoO 0,352 0,270 0,944 CoV 0,532 0,510 0,217 0,828 Comm 0,477 0,572 0,221 0,560 0,923 FFP 0,291 0,276 0,095 0,313 0,301 0,787 FunBen 0,193 0,168 0,106 0,221 0,185 0,145 0,805 Loyalty 0,600 0,465 0,282 0,508 0,578 0,298 0,453 0,834 Perv 0,182 0,118 0,003 0,237 0,077 0,117 0,597 0,411 0,952 PsyBen 0,661 0,410 0,377 0,562 0,462 0,263 0,273 0,606 0,234 0,830 Sat 0,624 0,477 0,256 0,617 0,473 0,227 0,505 0,746 0,541 0,659 0,820 Servq 0,666 0,429 0,283 0,644 0,420 0,328 0,325 0,595 0,374 0,664 0,667 1,000 SocBen 0,581 0,680 0,261 0,661 0,611 0,362 0,272 0,572 0,309 0,585 0,681 0,622 0,810 Trustw 0,667 0,539 0,320 0,632 0,430 0,276 0,239 0,567 0,312 0,692 0,661 0,689 0,635 0,856Note: Numbers in bold are root squared AVE = AVE^0,5
Table 46: Latent variable correlations
Discriminant validity for formative variable AirRep Bsc CoO CoV Comm FFP FunBen Loyalty Perv PsyBen Sat
Servq 0,666 0,429 0,283 0,644 0,420 0,328 0,325 0,595 0,374 0,664 0,667Construct correlation < 0.9 fulfilled fulfilled fulfilled fulfilled fulfilled fulfilled fulfilled fulfilled fulfilled fulfilled fulfilled
Table 47: Correlation matrix for formative variable ‘service quality‘

Appendices
131
Indicators Weights t-statistics Adjusted R² VIF= 1/1-R² < 10 Servq1 0,181 1,829 0,626 2,67Servq2 0,152 1,765 0,595 2,47Servq3 0,125 1,315 0,595 2,47Servq4 0,143 1,452 0,582 2,39Servq5 0,259 2,618 0,531 2,13Servq6 0,001 0,011 0,536 2,16Servq7 0,277 2,813 0,538 2,16Servq8 0,086 0,821 0,530 2,13Servq9 0,190 2,725 0,332 1,50
Table 48: Calculation of variance inflation factor (VIF) for ‘service quality’
Appendix 8: Calculations for validation of structural model
Endogenous construct R² Social benefit 0,660Psychological benefit 0,596Functional benefit 0,377Satisfaction 0,650Commitment 0,391Loyalty 0,645
Table 49: Coefficients of determination (R²) for endogenous constructs
Calculation of VIF for social benefits Regression on Adjusted R² VIF = 1/1-R²AirRep 0,391 1,642Bsc 0,303 1,435Servq 0,516 2,066Perv 0,109 1,122CoV 0,464 1,866
Calculation of VIF for psychological benefits Regression on Adjusted R² VIF = 1/1-R²AirRep 0,443 1,795Bsc 0,336 1,506Trustw 0,536 2,155Servq 0,53 2,128CoV 0,479 1,919CoO 0,116 1,131
Calculation of VIF for functional benefits Regression on Adjusted R² VIF = 1/1-R²Trustw 0,437 1,776Servq 0,424 1,736Perv 0,135 1,156CoO 0,102 1,114FFP 0,053 1,056
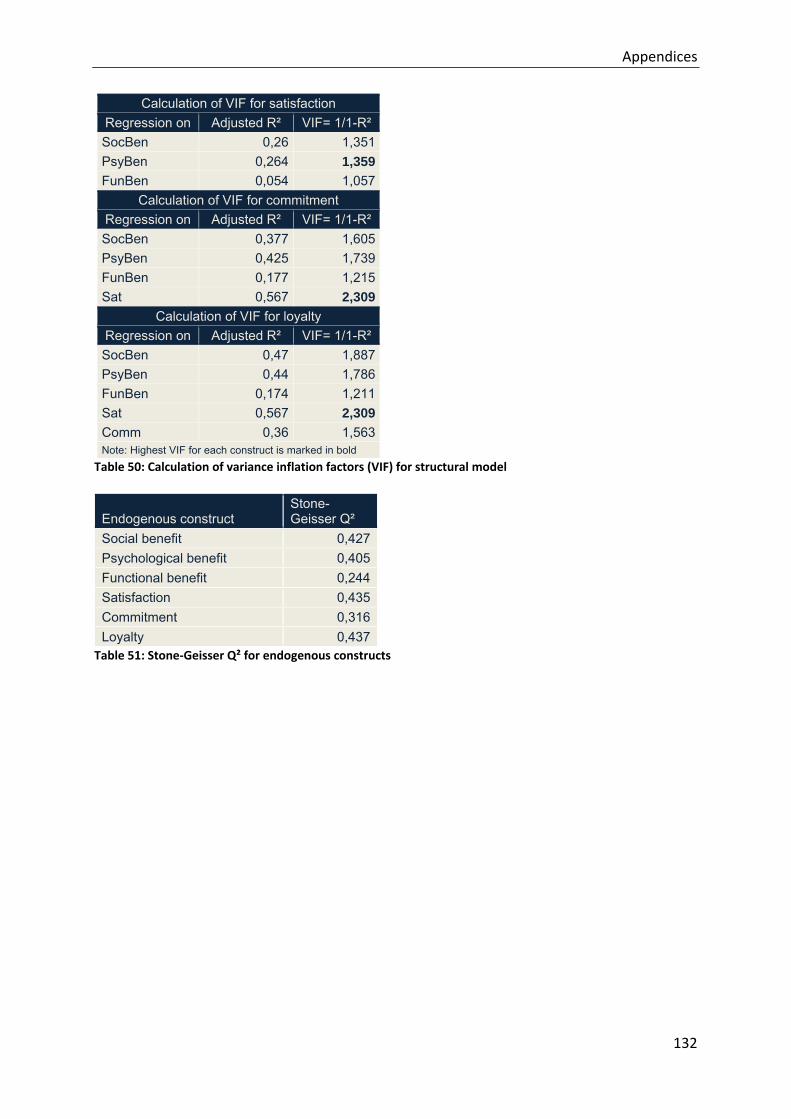
Appendices
132
Calculation of VIF for satisfaction Regression on Adjusted R² VIF= 1/1-R² SocBen 0,26 1,351PsyBen 0,264 1,359FunBen 0,054 1,057
Calculation of VIF for commitment Regression on Adjusted R² VIF= 1/1-R² SocBen 0,377 1,605PsyBen 0,425 1,739FunBen 0,177 1,215Sat 0,567 2,309
Calculation of VIF for loyalty Regression on Adjusted R² VIF= 1/1-R² SocBen 0,47 1,887PsyBen 0,44 1,786FunBen 0,174 1,211Sat 0,567 2,309Comm 0,36 1,563Note: Highest VIF for each construct is marked in bold
Table 50: Calculation of variance inflation factors (VIF) for structural model
Endogenous construct Stone-Geisser Q²
Social benefit 0,427Psychological benefit 0,405Functional benefit 0,244Satisfaction 0,435Commitment 0,316Loyalty 0,437
Table 51: Stone‐Geisser Q² for endogenous constructs
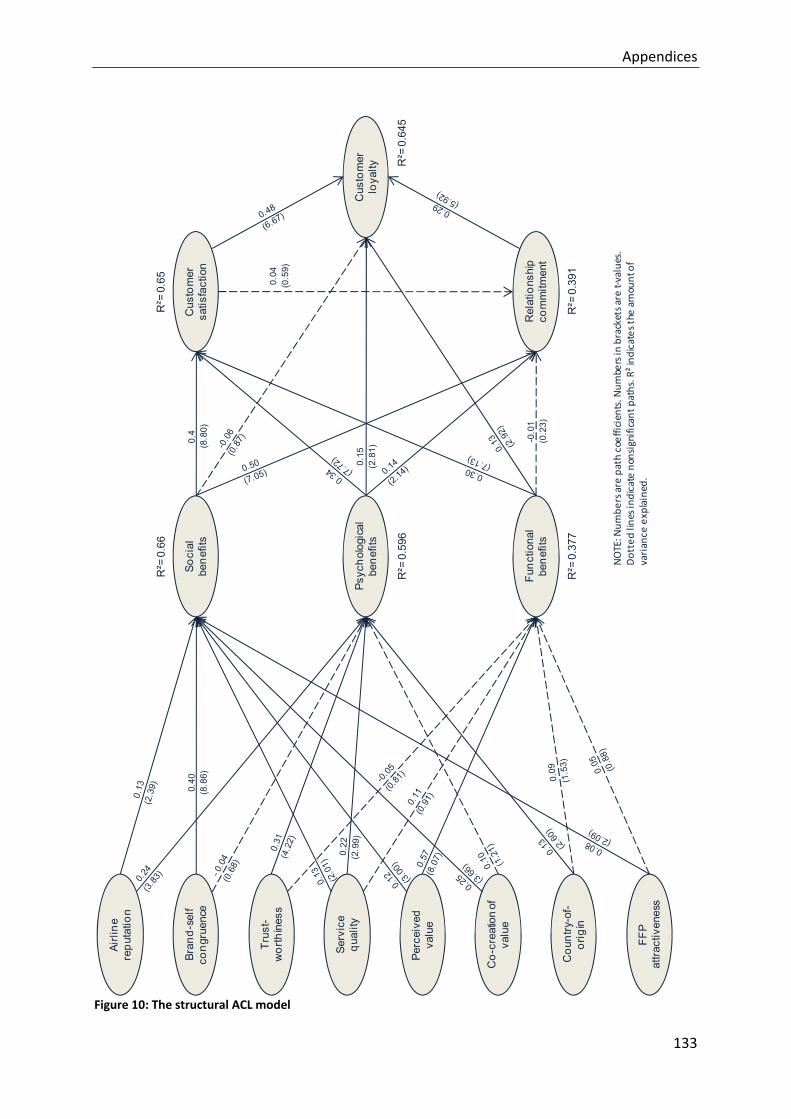
Appendices
133
Figure 10: The structural ACL model
Soci
al
bene
fits
Psyc
holo
gica
l be
nefit
s
Func
tiona
l be
nefit
s
Cus
tom
er
satis
fact
ion
Serv
ice
qual
ity
Perc
eive
d va
lue
Co-
crea
tion
of
valu
e
FFP
attra
ctiv
enes
s
Cou
ntry
-of-
orig
in
Trus
t-w
orth
ines
s
Bran
d-se
lf co
ngru
ence
Airli
ne
repu
tatio
n
Rel
atio
nshi
p co
mm
itmen
t
Cus
tom
er
loya
lty
0.40
(8.8
6)0.
4(8
.80)
0.15
(2.8
1)
-0.0
1(0
.23)
0.04
(0.5
9)
R²=
0.6
6
R²=
0.5
96
R²=
0.3
77
R²=
0.6
5
R²=
0.3
91
R²=
0.6
45
NOTE: N
umbe
rs are path coefficients. Num
bers in
brackets are t‐values.
Dotted lines indicate nonsignificant
paths. R² ind
icates the am
ount of
variance
explained.

Appendices
134
Appendix 9: Sub‐group comparison
Combination Group comparison Combination 1 The hypothesis is rejected for both sub-groups. Hence, there is no
significant difference between the sub-groups. Combination 2 The assessed values for the evaluated hypothesis are identical for both
sub-groups. Hence, there is no significant difference between the sub-groups.
Combination 3 The hypothesis is accepted for one sub-group but rejected for the other. Hence, there is a significant difference between the sub-groups.
Combination 4 The hypothesis is accepted for both sub-groups. By means of a t-test it has to be evaluated whether the difference is significant. The difference between the sub-groups is significant for a calculated t-value > 1.66 (α=10%) or > 1.98 (α=5%). According to Chin (2002):
n Size of sub-group 1 m Size of sub-group 2
; Estimate of the original sample with regard to the model association of interest in both sub-groups
); Standard error of the generated bootstrap sample Table 52: Criteria for the evaluation of significant differences between sub‐groups18
AirRep PsyBen
Bsc SocBen
FunBen Sat
Perv FunBen
PsyBen Loy
PsyBen Sat
Sat Loy
SocBen Comm
SocBen Sat
Sample 1 75 75 75 75 75 75 75 75 75Sample 2 201 201 201 201 201 201 201 201 201Standard error 1 0,127 0,093 0,084 0,142 0,124 0,107 0,161 0,121 0,098Standard error 2 0,073 0,048 0,050 0,071 0,061 0,054 0,070 0,089 0,056Path coefficient 1 0,302 0,525 0,373 0,368 0,257 0,225 0,468 0,574 0,380Path coefficient 2 0,186 0,357 0,279 0,620 0,128 0,391 0,491 0,464 0,401S 1,054 0,714 0,714 1,063 0,922 0,805 1,109 1,204 0,804T-value 0,813 1,729 0,977 -1,753 1,032 -1,520 -0,153 0,678 -0,192Difference significant No Yes No Yes No No No No No
Table 53: Calculation of t‐values for sub‐group comparison
18 In accordance with Huber et al. (2007, pp. 118).
nmS
ppt xx
11*
21
+
−=
( ) ( ) 222
212
))((*2
1))((*2
1xx p
nmnp
nmmS σσ
−+−
+−+
−=

Appendices
135
Hypothesis
Business Leisure Path coefficients
T-values Results
Path coefficients
T-values Results
Airline reputation → Social benefit 0,084 0,872 rejected 0,155 2,550 acceptedAirline reputation → Psychological benefit
0,302 2,376 accepted 0,186 2,528 accepted
Brand-self congruence → Social benefit
0,525 5,648 accepted 0,357 7,433 accepted
Brand-self congruence → Psychological benefit
0,098 0,830 rejected -0,071 1,136 rejected
Country of origin → Psychological benefit
-0,010 0,128 rejected 0,169 2,707 accepted
Country of origin → Functional benefit
0,009 0,100 rejected 0,112 1,631 rejected
Co-creation of value → Social benefit 0,124 1,160 rejected 0,277 3,638 acceptedCo-creation of value → Psychological benefit
0,074 0,643 rejected 0,088 1,098 rejected
FFP attractiveness → Social benefit 0,053 0,664 rejected 0,124 2,500 acceptedFFP attractiveness → Functional benefit
-0,008 0,067 rejected 0,030 0,538 rejected
Perceived value → Social benefit 0,080 0,766 rejected 0,121 2,504 acceptedPerceived value → Functional benefit 0,368 2,591 accepted 0,620 8,780 acceptedService quality → Social benefit 0,159 1,245 rejected 0,126 1,633 rejected Service quality → Psychological benefit
0,197 1,553 rejected 0,239 2,856 accepted
Service quality → Functional benefit 0,383 2,047 accepted -0,007 0,042 rejected Trustworthiness → Psychological benefit
0,259 1,718 accepted 0,330 3,817 accepted
Trustworthiness → Functional benefit 0,035 0,279 rejected -0,041 0,509 rejected Social benefit → Satisfaction 0,380 3,885 accepted 0,401 7,169 acceptedSocial benefit → Commitment 0,574 4,727 accepted 0,464 5,212 acceptedSocial benefit → Loyalty -0,145 0,868 rejected -0,042 0,604 rejected Psychological benefit → Satisfaction 0,225 2,113 accepted 0,391 7,273 acceptedPsychological benefit → Commitment
0,153 1,527 rejected 0,107 1,304 rejected
Psychological benefit → Loyalty 0,257 2,070 accepted 0,128 2,096 acceptedFunctional benefit → Satisfaction 0,373 4,432 accepted 0,279 5,561 acceptedFunctional benefit → Commitment 0,117 1,304 rejected -0,049 0,724 rejected Functional benefit → Loyalty 0,100 0,956 rejected 0,153 2,964 acceptedSatisfaction → Commitment -0,003 0,024 rejected 0,093 1,047 rejected Satisfaction → Loyalty 0,468 2,899 accepted 0,491 7,039 acceptedCommitment → Loyalty 0,211 1,274 rejected 0,317 6,445 accepted
Table 54: Hypothesis testing; sub‐group comparison of business and leisure travelers19
19 Note: Significant differences between the two subgroups are marked in darker beige.

Appendices
136
Construct Business Leisure R² R²
Social benefits 0,700 0,659Psychological benefits 0,628 0,604Functional benefits 0,457 0,380Satisfaction 0,656 0,659Commitment 0,563 0,347Loyalty 0,593 0,679
Table 55: Comparison of R² for business and leisure travelers

Appendices
137
Figure 11: Differences in the ACL model between business and leisure travelers
Soci
al
bene
fits
Psyc
holo
gica
l be
nefit
s
Func
tiona
l be
nefit
s
Cus
tom
er
satis
fact
ion
Serv
ice
qual
ity
Perc
eive
d va
lue
Co-
crea
tion
of
valu
e
FFP
attra
ctiv
enes
s
Cou
ntry
-of-
orig
in
Trus
t-w
orth
ines
s
Bran
d-se
lf co
ngru
ence
Airli
ne
repu
tatio
n
Rel
atio
nshi
p co
mm
itmen
t
Cus
tom
er
loya
lty
0.53
0.36
0.38
0.4
0.26
0.13
0.12
-0.0
5
-0.0
0.09
R² B
= 0.
7R
² L=
0.65
9
NOTE: Top
num
bers are path coefficients for business travelers. Bottom num
bers are path coefficients for leisu
re travelers.
Dotted lines indicate nonsignificant
paths. Bold lines indicate significant differences b
etween sub groups.
R²Brefers to
variance explained for b
usiness travelers. R² Lrefers to
variance explained for leisure travelers.
R² B
= 0.
628
R² L
= 0.
604
R² B
= 0.
457
R² L
= 0.
380
R² B
= 0.
563
R² L
= 0.
347
R² B
= 0.
593
R² L
= 0.
679
R² B
= 0.
656
R² L
= 0.
659
Top Related