


Languages
Pages
Legal


LTADS – UCD OverviewJohn Carroll and Cort AnastasioUniversity of California – Davis
26 May 2004
A presentation of work funded by the ARB through Interagency Agreement #01-326

Part 1:Aircraft & Real-time Sampling Instruments
for Meteorology and Pollutants (NOy, O3, PM)

Cessna 182 Used for Sampling

Ozone, NOy and ParticleInstruments in Rear of Aircraft

View of Cockpit Instrumentation

AIMMS-10 Unit Beneath Wing

0
5
10
15
20
25
30
35
40M
ax W
D e
rror
(de
g)
3 5 8 11 14 17 20 23Wind speed (mps)
H=0,V=1 H=0,V=1.8 H=1,V=0 H=2,V=0 H=1.5,V=1
Wind finding errorsVair = 50 mps

Air Sampling Areas at Lake Tahoe

Ozone at 2380 m MSL
0
20
40
60
80
100
120
140
07-1
0
07-1
1
07-1
7
07-1
8
07-3
1
08-0
1
08-0
5
08-0
6
08-2
8
09-0
4
09-0
5
09-1
1
09-1
2
09-1
6
09-1
7
09-2
1
09-2
2
09-2
5
10-0
9
10-1
0
10-1
5
10-1
6
DATE in year 2002
pp
bv
White bar = maximum ozoneBlack bar = average ozoneHatched bar = minimum ozone


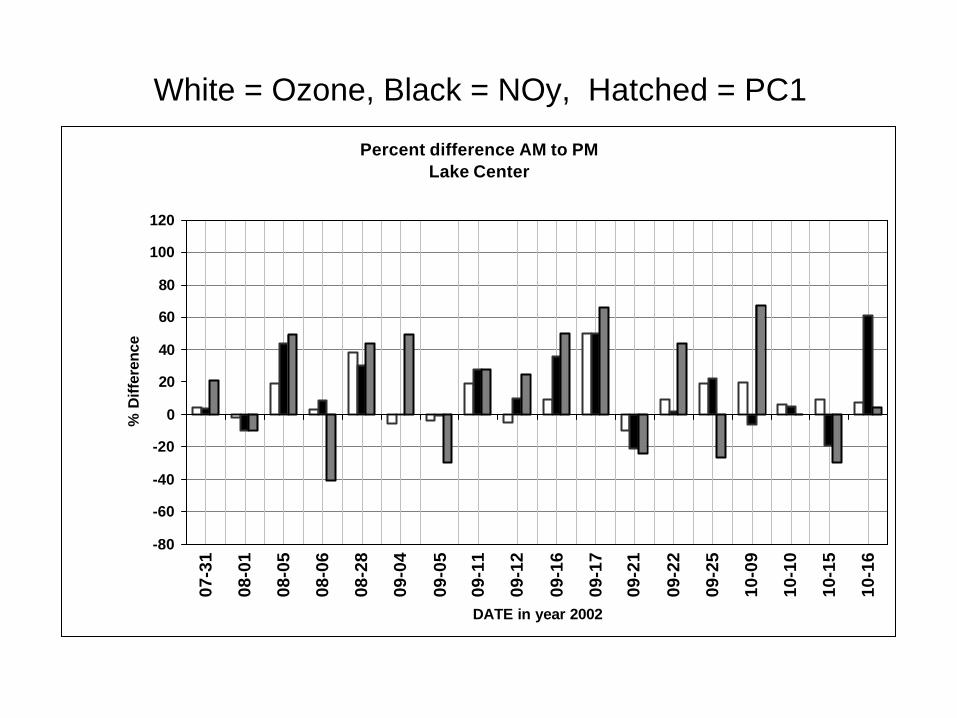
White = Ozone, Black = NOy, Hatched = PC1
Percent difference AM to PMLake Center
-80
-60
-40
-20
0
20
40
60
80
100
12007
-31
08-0
1
08-0
5
08-0
6
08-2
8
09-0
4
09-0
5
09-1
1
09-1
2
09-1
6
09-1
7
09-2
1
09-2
2
09-2
5
10-0
9
10-1
0
10-1
5
10-1
6
DATE in year 2002
% D
iffer
ence


Part 2:Denuder – Filter Pack (DFP) Measurements
of Gaseous and Particulate Nitrogen

Aircraft Denuder / Filter Pack (DFP)
• Extraction and Analysis• Samples taken to UCD lab at end of 2nd sampling day• Denuders and filters extracted w/ purified water (Milli-Q)• Analyzed for inorganic N (IN) with ion chromatography• Organic nitrogen (ON) determined by photolysis of extracts
ON = IN (after photolysis) – IN (before photolysis)More difficult to quantify ON compared to IN because of
multiple steps and because it is determined by difference
K2CO3Denuder :HNO2 (g)HNO3 (g)
Citric AcidDenuder :NH3 (g)
Teflon Filter (PM3.5):NO2
- (p), NO3- (p)
NH4+ (p), PO4
3- (p)
• DFP Apparatus and Analytes

DFP Sampling
• Sampling Schedule• 2 DFP samples for each flight (one each at 2380 and 2070 m)• One flight in morning & one in afternoon on each sampling day• Usually sampled on two consecutive days• Samples taken from July 10th – October 16th, 2002• Total of 22 days of sampling and 86 samples
• For Each Flight• Sampled at 7800’ (2380 m)• Sampled at 6800’ (2070 m)• Air volume sampled =
1.00 ± 0.16 m3
• Took sounding at Loon Lake

DFP Blanks and Blank Corrections
• Blank Corrections• The average blank value was subtracted from each sample
value for a given analyte• For uncertainty calculations, the relative standard deviation of
the blank values (RSD = σ/average) for a given analyte wasused as an approximation of the sample RSD
• Blanks• A blank DFP was collected on nearly every sample day• Blanks extracted and analyzed in the same way as samples• For each analyte, the average and standard deviation of the
blanks were calculated for the entire sampling campaign

Sample and Blank Statistics
• For major species (HNO3, NH3, NO3-, NH4
+) samples levels are typically ~ 3times greater than in blanks: good quantification
• For minor species (HNO2, NO2-, ON) sample values are typically too low to
distinguish significantly from blanks: sample values are only qualitative
Blank-Subtracted Sample Values (nmol N m-3-air)
Gaseous Species (n = 86) Particulate Species (n = 52) Gas + Particle a
HNO2 (g) HNO3 (g) NH3 (g) ON (g) NO2- (p) NO3
- (p) NH4+ (p) ON (p) TIN TN
Min 0.1 0.6 2.4 0.0 < LOD 0.8 0.2 0.4 21.7 32.5Max 11.5 59.9 312.7 102.9 < LOD 13.2 33.6 33.0 342.7 362.1Median 0.8 25.8 45.3 5.9 < LOD 1.8 10.0 3.0 85.7 106.4Mean 1.4 25.1 65.3 13.3 < LOD 2.2 12.1 6.0 107.4 124.3Std Dev 1.9 11.7 58.4 21.8 < LOD 2.8 9.4 7.9 69.5 75.9
Field Blank Values (nmol per denuder or filter)
Denuders (n = 22) Filters (n = 13) Denuder + FilterHNO2 (g) HNO3 (g) NH3 (g) ON (g) NO2
- (p) NO3- (p) NH4
+ (p) ON (p) TIN TN
Mean 0.9 10.1 25.9 21.6 0.0 0.8 3.3 19.5 37.2 82.1Std Dev 1.1 4.9 12.7 15.2 0.1 0.7 2.4 14.3 10.8 14.7
Ratio of Sample Mean/Blank Mean (assuming 1 m3 of air for each sample)Gaseous Species Particulate Species Gas + Particle
HNO2 (g) HNO3 (g) NH3 (g) ON (g) NO2- (p) NO3
- (p) NH4+ (p) ON (p) TIN TN
1.5 2.5 2.5 0.6 na 2.8 3.7 0.3 2.9 1.5
a TIN = Total Inorganic Nitrogen; TN = Total Nitrogen = TIN + ON(g) + ON(p)

DFP Data Limitations and Problems
• Phosphorus (P)• Because of high and variable blank levels of P on the filters, values
of P are not reported• For P levels measured in the summer of 2001, see Zhang et al.
(Environ. Sci. Technol., 2002, 36, 4981-4989; copy is on this CD)
• Missing PM Data• Because of filter blank problems, we do not report particle data
during July 7th – Sept. 5th
• However, PM was typically a small component of the N budget
• Boat Samples• Because of high blank levels for all N species, we do not report
values from the boat samples taken in winter/spring 2003.

Nitrogen Distributions: 2002 vs. 2001(Summer 2001 data from Zhang et al., 2002)
• Very similar distributions and TN levels between the two years• Approx 65% NH3/NH4
+, 20% HNO3/NO3-, 14% ON, 1% HNO2
ON (g)10%
NH3 (g)55%
ON (p)3%
NO2- (p)
0%
HNO2 (g)0.7%
HNO3 (g)16%
2001 Average (N = 8)(Avg. TN(g+p) = 140 ± 33 nmol N m-3-air)
NO3- (p)
5%
NO2- (p)
0%
HNO2 (g)1%
2002 Average (N = 52)(Avg. TN(g+p) = 124 ± 76 nmol N m-3-air)
ON (g)9%
NH3 (g)55%
HNO3 (g)19%
NO3- (p)
2% NH4+ (p)
10%
ON (p)5%
NH4+ (p)
9%

Vertical Distribution of HNO3(g)
• Each pointrepresents asingle flight
• Average Ratio inMorning (± σ):0.63 ± 0.32(90% are < 1)
• Average Ratio inAfternoon:0.90 ± 0.25(72% are < 1)
0.0
1.0
2.0Morning (AM)Afternoon (PM)
HN
O3(
g) a
t 238
0 m
/ H
NO
3(g)
at 2
070
m
OCT 2002AUG 2002 SEPT 2002JULY 2002
• HNO3 is typically higher at 2070 m compared to 2380 m, especially in AM
• Suggests a significant in-basin source for nitric acid (likely via NOx)

Vertical Distribution of NH3(g)
• Each pointrepresents asingle flight
• Average Ratio inMorning (± σ):1.10 ± 0.90(45% are < 1)
• Average Ratio inAfternoon :1.43 ± 1.38(44% are < 1)
• NH3 is slightly higher at higher altitude (2380 m), but not significantly so
• Vertical gradient is more significant if lowest conc. samples are omitted(e.g., as in UCD presentation from October 2002)
0.0
1.0
2.0
3.0
4.0
5.0
6.0Morning (AM)Afternoon (PM)
NH
3(g)
at 2
380
m /
NH
3(g)
at 2
070
m
OCT 2002AUG 2002 SEPT 2002JULY 2002

Variability in N Amounts and SpeciationA complete record of the 2002 Sampling
• text• xxx• yyy
Sample Date (2002)
Con
cent
ratio
n (n
mol
N m
-3-a
ir)
0
50
100
150
200
250
300
350
400
No Filter Data
11-J
ul
17-J
ul
31-J
ul
1-A
ug
6-A
ug
28-A
ug
5-S
ept
11-S
ept
Top, hatched segments of column(s) = particulate NBottom, solid segments of column(s) = gaseous N
12-S
ept
16-S
ept
21-S
ept
22-S
ept
25-S
ept
ON(g) + ON(p)
NH3(g) + NH4+(p)
HNO2(g) + NO2-(p)
HNO3(g) + NO3-(p)
10-J
ul
16-O
ct
15-O
ct
10-O
ct
9-O
ct
17-S
ept
4-S
ept
5-A
ug
18-J
ul
• High variability suggests very complicated & variable sources & transport
• Examine three episodes (pairs of sampling days) as examples
Episode 1:10-11 Jul

Episode 1: 10 – 11 July, 2002
ON (g)7%
NH3 (g)65%
ON (p)8%
NO2- (p)
0%
HNO2 (g)0.8%HNO3 (g)
8%
11 - July - 02(Avg. TN(g+p) = 153 ± 46 nmol N m-3-air)
NO3- (p)
3%
NO2- (p)
0%HNO2 (g)
0.3%
10 - July - 02(Avg. TN(g+p) = 291 ± 71 nmol N m-3-air)
ON (g)8%
NH3 (g)78%
HNO3 (g)5%
NO3- (p)
2% NH4+ (p)
5%
ON (p)2%
NH4+ (p)
9%
• 10 July 2002 had some of highest TN concentrations we measured
• Average TN level on 11 July was ½ of the 10 July average
• NH3(g) & NH4+(p)
were dominantspecies onboth days,accounting for70-80% of N
• Temperatureshigh both days (24 –30 °C when sampling)
• HYSPLIT trajectories suggest regional pollution episode ofsomewhat stagnant air from 08 – 10 July, being diluted with flowfrom NE on 11 July
• Emissions from a small fire observed inside the basin (SSE of thelake) could have also contributed to high pollutant levels

Episode 2: 11 – 12 September, 2002
• text• xxx• yyy
Sample Date (2002)
Con
cent
ratio
n (n
mol
N m
-3-a
ir)
0
50
100
150
200
250
300
350
400
No Filter Data
11-J
ul
17-J
ul
31-J
ul
1-A
ug
6-A
ug
28-A
ug
5-S
ept
11-S
ept
Top, hatched segments of column(s) = particulate NBottom, solid segments of column(s) = gaseous N
12-S
ept
16-S
ept
21-S
ept
22-S
ept
25-S
ept
ON(g) + ON(p)
NH3(g) + NH4+(p)
HNO2(g) + NO2-(p)
HNO3(g) + NO3-(p)
10-J
ul
16-O
ct
15-O
ct
10-O
ct
9-O
ct
17-S
ept
4-S
ept
5-A
ug
18-J
ulEpisode 2:11-12 Sept

Episode 2: 11 – 12 September, 2002• Moderate TN levels, increasing by ~ 40% from 11th to 12th
• Large shift in Nspeciation, with ONfraction approximatelydoubling between11th and 12th
• HYSPLIT backtrajectories indicateair on these 2 dayswas from SW Oregon,with stronger influence on 2nd day.
• Massive Biscuit fire in SW Oregon burned from 13 July (started) to 05Sept (contained) to 09 Nov (extinguished), 2002. Burned 500,000 acres.
• Our 2001 samples suggested ON is a marker for aged forest fire smoke
• 2002 results suggest that OR forest fire emissions affected Lake Tahoeduring this episode, especially on 2nd day.
ON (g)36%
NH3 (g)22%
ON (p)7%
NO2- (p)
0%
HNO2 (g)1%
HNO3 (g)22%
12 - Sept - 02(Avg. TN(g+p) = 160 ± 40 nmol N m-3-air)
NO3- (p)
0.6%
NO2- (p)
0%
HNO2 (g)0.1%
11 - Sept - 02(Avg. TN(g+p) = 116 ± 9 nmol N m-3-air)
ON (g)9%
NH3 (g)32%
HNO3 (g)26%
NO3- (p)
0.3%NH4
+ (p)22%
ON (p)10%
NH4+ (p)
11%

Episode 3: 09 – 10 October, 2002
• text• xxx• yyy
Sample Date (2002)
Con
cent
ratio
n (n
mol
N m
-3-a
ir)
0
50
100
150
200
250
300
350
400
No Filter Data
11-J
ul
17-J
ul
31-J
ul
1-A
ug
6-A
ug
28-A
ug
5-S
ept
11-S
ept
Top, hatched segments of column(s) = particulate NBottom, solid segments of column(s) = gaseous N
12-S
ept
16-S
ept
21-S
ept
22-S
ept
25-S
ept
ON(g) + ON(p)
NH3(g) + NH4+(p)
HNO2(g) + NO2-(p)
HNO3(g) + NO3-(p)
10-J
ul
16-O
ct
15-O
ct
10-O
ct
9-O
ct
17-S
ept
4-S
ept
5-A
ug
18-J
ul
Episode 3:09 – 10 Oct

Episode 3: 09 – 10 October, 2002Chemical Measurements
• Dramatic shift in levels of N between two days of episodeVery low N on 9th, but TN concentration quadruples by 10th
• Large shift in N speciation occurred simultaneouslyClean day (9th) has roughly equal amounts of HNO3 and NH3/NH4
+
Dirty day (10th) is dominated by NH3(g) & NH4+(p)
ON (g)5%
NH3 (g)59%
ON (p)2%
NO2- (p)
0%
HNO2 (g)0.8%
HNO3 (g)17%
10 - Oct - 02(Avg. TN(g+p) = 229 ± 17 nmol N m-3-air)
NO3- (p)
4%
NO2- (p)
0%
HNO2 (g)2%
09 - Oct - 02(Avg. TN(g+p) = 54 ± 17 nmol N m-3-air)
ON (g)7%
NH3 (g)27%
HNO3 (g)39%
NO3- (p)
3%
NH4+ (p)
20%
ON (p)3%
NH4+ (p)
11%

Episode 3: 09 – 10 October, 2002Meteorology
• Local winds (e.g., from Tahoe City Coast Guard pier)Show strong SW winds on 10th, consistent with…
• HYSPLIT back trajectories ending at TahoeOct 9th: Marine air that had passed over central OROct 10th: Air that had crawled through the Central Valley for ~ 2
days and then pushed up to Tahoe
NOAA HYSPLIT, 4-dayback trajectories ending atTahoe at 10 am PST on 09Oct (left) and 10 Oct (right).
Ending heights: red = 2070m, blue = 2380 m, green =3070 m.

Episode 3: 09 – 10 October, 2002Interpretation and corroborating O3 data
• Previous data suggest that this episode is a “Valley washout”,where pollutants from the CV are pushed into the Tahoe Basin
• ARB ozone data is consistent with this interpretation• 07 – early 09 October: relatively high ozone (peaks of 80 – 85 ppbv)
in Valley (Folsom; red line) and Foothills (Cool; blue), but low (< 45ppbv) at South Lake Tahoe (SLT; black)
• 09 Oct (late) – 10 Oct:O3 in Folsom and Coolfalls as SLT O3 rises,exceeding Valley levels
• By the morning of 11 Octall 3 sites have very lowozone (~ 15 ppbv),suggesting pollution hasbeen mostly pushedthrough Tahoe Basin
0
10
20
30
40
50
60
70
80
90
Ozo
ne (p
pb)
South Lake Tahoe-Sandy Way
Folsom-Natoma ST
Cool, CA - Hwy 193
07 - Oct - 02 08 - Oct - 02 11 - Oct - 0210 - Oct - 0209 - Oct - 02 12 - Oct - 02
09 Oct 10 Oct

Summary of DFP Data• N concentrations were highly variable, ranging from ~ 30 to 360
nmol N m-3-air
• Ammonia and ammonium were typically the dominant N species,accounting for approximately 2/3 of N, on average
• Atmospheric levels of N in the Tahoe air basin appear to be affectedby a wide variety of “sources”, including– Regional background pollutant levels– In-basin emissions– Local and distant forest fires– The Central Valley
• Limitations of our DFP data– Only provides “snapshots” of certain days, not a continuous record or
climatology of atmospheric N.– Source identification is limited by a number of factors, including lack of
meteorological data inside and upwind of Tahoe Basin

Top Related