


Languages
Pages
Legal

STATE OF OREGON, OFFICE OF ECONOMIC ANALYSIS
Job Polarization in Oregon An Examination of Occupational Growth by Wage
Level, 1980-2012
Josh Lehner
October, 2013
The majority of Oregon’s workers are employed in occupations that pay between $25,000 and $50,000 per year. Although occupations in this pay range still represent a majority of the workforce, their share of the job market is shrinking rapidly. For the past three decades, employment growth has become polarized, with the majority of job gains occurring at the high and low extremes of the wage distribution. The primary factors contributing to this polarization, including the effects of both technology and globalization, are expected to continue throughout this decade. The following analysis applies the methodology from national studies to examine the extent to which job polarization is occurring within Oregon’s regional labor market. Aside from a brief respite during the boom years of the 1990’s, Oregon’s job market has become polarized at roughly the same pace as has the overall U.S. job market.
2
Introduction
Job polarization represents a key labor market
development of the past thirty years across the globe.
Job polarization refers to an increasing concentration
of jobs in occupations at both the high and low ends of
the wage scale, with a relative shrinking share of
middle-wage jobs. For now, the majority of Americans,
and Oregonians, continue to be employed within
middle-wage occupations. However, employment
growth over the past three decades has become very
polarized, with this trend projected to continue in the
coming decade.
A growing body of research has illustrated these
changes at the national level and at least a partial
consensus is forming as to why this polarization is
occurring. The two most common explanations involve
technological change and globalization—factors which
certainly are not mutually exclusive. The role of
technology, including the computerization of the
workplace, is generally considered the most
significant contributor to job polarization.
Technological investments often involve the
automation of what may be termed routine work,
allowing each individual worker to be more productive
and allowing firms to get by with fewer workers.
As defined by Autor, Levy, and Murnane (2003),
routine jobs have sufficiently well-defined tasks that
can be satisfactorily completed by a computer
program. As discussed in Autor (2010), examples
include bookkeeping, clerical work and repetitive
production tasks (manufacturing). For example, use of
modern software allows each bookkeeper to serve
more clients than in the past. Similarly, for
occupations where globalization is a contributing
factor, routine jobs can be performed abroad by
workers who are willing to accept lower wages and
who possibly have less education or less experience.
Relative to routine occupations, jobs that require
abstract thinking and decision making and/or in-
person interactions and communications are more
difficult to replace. For example, the face-to-face
interaction required for lower wage consumer service
occupations (e.g. hairdressers, and childcare workers)
make automation or offshoring of these services
nearly impossible with current technology. Also,
occupations that require specialized capital stocks or
access to natural resources face less pressure than
do routine occupations.
While job polarization has been reshaping the labor
market for decades, the Great Recession exacerbated
the process in both the nation and in Oregon. As
noted by Jaimovich and Siu (2012), in their “The
Trend is the Cycle” research paper, most job losses
among middle-wage occupations occur during
recessions. Making matters worse, the lack of growth
among middle-wage occupations in the early stages
of the expansions has resulted in the jobless
recoveries experienced in recent decades. This job
polarization trend has resulted in the characterization
or nature of the recent business cycles, hence their
paper’s title. In other words, many jobs in middle-
wage occupations are eliminated during economic
downturns and are not replaced to the same degree
as both high- and low-wage jobs during the
subsequent expansion.
Although much national and international research
has focused on measuring job polarization, little has
been done on a regional or local level. This report is
designed to highlight the job polarization trends in
Oregon over the past thirty years, how the Great
Recession has impacted the state, and also how the
jobs of tomorrow will further alter the state’s economy.
Much of Oregon’s job polarization has occurred during
periods when its manufacturing firms have downsized.
Many middle-wage jobs were lost during the 1980’s
when the wood product industry restructured, and
once again in the 2000’s due to both the dotcom
recession and the Great Recession. Although the
pace of job polarization in Oregon has been severe
during these downturns, the state has fared better
than most at creating middle-wage jobs during periods
of economic expansion. In particular, due to healthy
job gains during its technology expansion in the
1990’s, job polarization in Oregon has not been as
severe over the past three decades as in other states.
Even so, Oregon’s workforce began, and remains,
somewhat more polarized than that of the typical state
due to a higher concentration of low paid Farming,
Fishing and Forestry jobs.
The remainder of the report is organized as follows.
The next two sections briefly describe the study
methodology, data used and wage group

3
classifications. Employment changes over the past
thirty years are then examined for Oregon and
compared with national trends over the same time
period, followed by an analysis of the Great
Recession’s impact on Oregon’s occupational
structure. Additional consideration is given to
differences seen in job polarization in Oregon’s
metropolitan or urban areas compared with the
remainder of the state. Finally, the economic outlook
in the coming years reveals that job polarization is
expected to continue in the coming decade. The final
two sections conclude, discuss implications of job
polarization and highlight possible areas for further
research.
Methodology
This report analyzes employment in Oregon at the
occupational level and its growth and changes over
recent decades. Generally, most analyses of
employment refer to industries – manufacturing,
leisure and hospitality, government, etc. – however
examining the labor market through the occupational
lens provides a somewhat different look. Occupations,
such as accountants or managers, span all industries
and should a trend, either cyclical or structural,
emerge among these occupations, it may not be
detected when examining just industry employment.
Using both industry and occupational data provides a
more complete picture of the labor market than just
one or the other.
Following the Federal Reserve Bank of New York’s
research (2012), this report uses two main
classifications to examine occupational trends in
Oregon. First, using the Standard Occupational
Classification system, 840 individual occupational
categories are classified within 23 overarching
occupational groups1. A second categorization is also
made that sorts these occupational groups into four
wage groups based on their 2012 median wages.
The analysis contained in this report examines
employment changes and trends based on both the
22 non-military occupational groups and the broader
set of four wage groups. The analysis covers multiple
1 This report uses the first 22 occupational groups and does not include the 23rd: military specific occupations. For more detailed information on which individual occupations are classified in which occupational groups, please see Appendix A.
time frames depending upon the exact data set used.
U.S. Census Bureau (Census) data is available for
1980, 1990, 2000 and 2010. Occupational
Employment Statistics are available for 1997-2012
from the U.S. Bureau of Labor Statistics (BLS).
Using decennial Census data as the basis for the long
run trends over the past 30 years has both positive
and negative attributes. The consistency with which
Census is able to compile data and information across
both regions and time is the data’s greatest strength
and provides a solid foundation on which to analyze
these trends. However, the Census occurs only once
per decade and the exact years do coincide with
distinct points in the business cycle. 1980, 1990 and
2000 are all considered to be at, or near, the relative
peak of business cycles, however 2010 certainly is not
and is considered the labor market trough of the Great
Recession. Oregon’s business cycles overall, in terms
of timing, match the U.S. business cycles however
given the volatility of the state’s economy, Oregon
tends to fare better than the nation as a whole during
expansions and worse than the average state during
recession. These facts are likely to influence some of
the information as it is only available once every ten
years.
One additional item to highlight is the fact that data
from different sources or different surveys do vary
somewhat when calculating exact figures.
Occupational data from Census, occupational data
from BLS and industry data from BLS or OED, while
certainly exhibiting the same underlying labor market
trends over time, will yield somewhat different results
when examining specific changes over a given period.
One common step made in the literature is to link
high-wage occupations with high-skilled employment
and also low-wage occupations with low-skilled
employment. There is an overall positive correlation
between skill and wages however this is not a perfect
relationship. Economic theory suggests that in a
properly functioning labor market, the value of what a
worker produces for a firm is the primary determinant
of what that worker gets paid.
Unfortunately, data available at the regional or local
level is unable to provide a long enough history with
consistently defined occupations to assess these
occupational changes based on skill levels instead of

4
wage levels. Therefore, in this report, job polarization
refers to employment by wage level and not explicitly
by skill level. Nevertheless, these concepts are closely
interconnected. Avenues for future research include a
more thorough examination of each of the hundreds of
detailed occupations in an effort to create a
consistently defined set of occupations at the regional
level over time.
Wage Group Classification
Each of the 22 occupational groups is categorized into
one of four main wage groups based on their 2012
median annual wage2. Each group is defined as
follows. Please see Appendix A for more information
on the classification of individual occupations and
Appendix B for each occupational group’s median
wage.
High Wage (> $50,000)
Business and Finance, Computer and Mathematical,
Engineers and Architects, Health Practitioners, Legal,
Management, and Scientists, including Social
Upper Middle ($40,000 - $50,000)
Arts and Entertainment, Community Service,
Construction, Installation and Repair, Protective
Services, and Teachers
Lower Middle ($25,000 - $40,000)
Administrative Support, Health Support, Production,
Sales, and Transportation
Low Wage (< $25,000)
Building Maintenance, Farming, Food Preparation,
and Personal Care
Panel A in Figure 1 shows the occupational groups in
each of the four main wage groups. The employment
2 Even though 2012 is the basis for these categorizations, there has been surprising consistency of occupational groups across categories over time. High-wage occupational groups tend to always be high-wage while low-wage groups tend to be low-wage over time. The same is true for both upper middle and lower middle-wage occupational groups. Counterexamples do exist and include Installation and Repair which was high-wage in the 80s and 90s but is upper middle today, Arts and Entertainment which were lower middle-wage in earlier decades but upper middle today, Healthcare Support which were low-wage in earlier decades but lower middle today and Farming which were lower middle-wage in earlier decades but low-wage today.
share of each wage group is shown on the horizontal
axis. The largest group, representing 42 percent of all
Oregon jobs in 2012, is the lower middle-wage group.
Within these occupations, Administrative Support is
the largest occupational group, followed by Sales and
Transportation. Combined, the two middle-wage
groups employ nearly 62 percent of Oregonians, while
at the national level these same groups employ nearly
63 percent.
Another way to examine the wage groups and their
relative employment sizes is shown in Panel B. The
occupations are listed in the same order as in Panel A
and the size of each bubble represents each
occupational group’s employment.
Figure 1
Panel A
Panel B
$0
$10,000
$20,000
$30,000
$40,000
$50,000
$60,000
$70,000
$80,000
$90,000
$100,000
Median Occupational Wage, 2012
High Wage Upper Middle Lower Middle Low Wage
Employment Share
22% 19% 42% 17%
LegalComputer/MathEngineers/ArchitectsManagement
High WageScientistsSocial ScientistsBusiness/FinanceHealth Practitioners
Upper MiddleConstructionTeachersProtective ServicesInstallation/RepairArts/EntertainmentCommunity Service
Bldg MaintenanceFarmingPersonal CareFood Prep
Low Wage
Admin SupportProductionTransportationHealth SupportSales
Lower Middle
$10,000
$20,000
$30,000
$40,000
$50,000
$60,000
$70,000
$80,000
$90,000
Median Wage and Employment, 2012
Management
Health Practitioners
Legal
Eng/Arch
Biz/Fin
Scientists
Comp/Math
Construction
Teachers
Protective Serv.
Install/Repair
Arts/Ent.
Com. Serv.
Production
Admin Sup.
Transp.
Health Sup.
Sales
Farming
Bldg Maint.
Personal Care
Food Prep

5
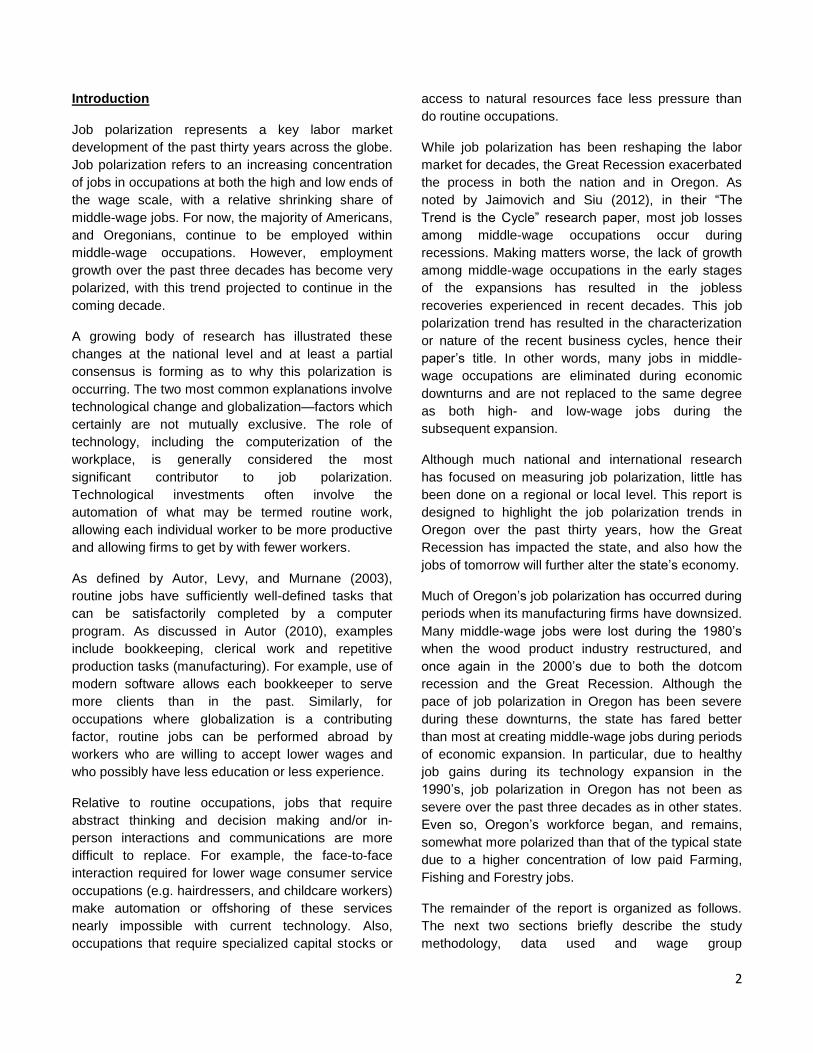
Figure 2
Three Decades of Polarization
Job polarization has been ongoing in the United
States for three decades and the same is true in
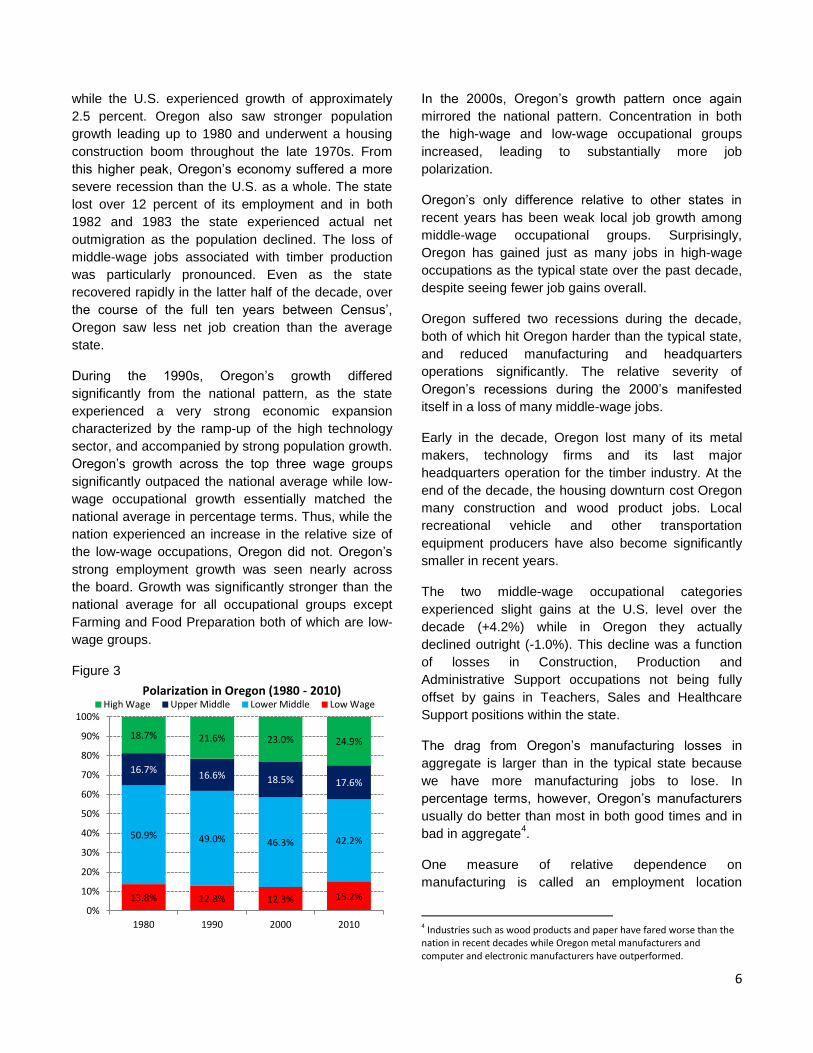
Oregon. Figure 2 shows the employment change by
wage group over both the entire 1980 to 2010 time
period and each decade therein, while Figure 3 shows
each wage group’s share of total employment in
Oregon over the same period. Both figures use data
from the U.S. Census Bureau, courtesy of the Federal
Reserve Bank of New York3.
Overall, Oregon’s pattern is similar to that of the U.S.
as a whole. However, a few differences do emerge.
Specifically, Oregon’s growth in both high-wage and
lower middle-wage occupations has outpaced the
national average while the state’s growth in low-wage
occupations over these years has been less than the
national average. While the end result may be that
Oregon has experienced somewhat less job
polarization relative to the nation, the process of job
polarization has been pronounced within the state
3 The data were obtained from the Federal Reserve Bank of New York and are based on information from the 1980, 1990 and 2000 Census and the 2010 American Community Survey.
nevertheless. Middle-wage occupations in Oregon
have grown at consistently lower rates than high- and
low-wage groups in recent decades.
As detailed in Autor (2010), employment growth
during the 1980s was concentrated in high-wage
occupations, while middle-wage occupations
remained relatively steady as a share of overall
employment and relative declines occurred among
low-wage jobs. Within the high-wage occupations,
Computer and Math grew at the strongest rate in
Oregon during the time period (108%), while the
Management and Health Practitioners groups led the
increase in the number of workers with gains of
20,654 and 13,960, respectively. While the pattern of
growth was similar to the nation’s, Oregon
experienced slower growth, throughout the decade
due to the severity of the early 1980s recessions in
the state.
Late 1979 or early 1980 represented the peak of the
business cycle for both Oregon and the U.S., however
Oregon’s relative peak was much higher than the
nation overall. Throughout the 1970s employment in
Oregon grew approximately 4.0 percent annually
0%
20%
40%
60%
80%
100%
120%
High Wage Upper Middle Lower Middle Low Wage
Job Growth by Wage Group (1980 - 2010)
Oregon U.S.
0%
5%
10%
15%
20%
25%
30%
35%
40%
High Wage Upper Middle Lower Middle Low Wage
Job Growth 1990-2000
Oregon U.S.
0%
10%
20%
30%
40%
50%
High Wage Upper Middle Lower Middle Low Wage
Job Growth 1980-1990
Oregon U.S.
-5%
0%
5%
10%
15%
20%
25%
30%
35%
40%
High Wage Upper Middle Lower Middle Low Wage
Job Growth 2000-2010
Oregon U.S.
6
while the U.S. experienced growth of approximately
2.5 percent. Oregon also saw stronger population
growth leading up to 1980 and underwent a housing
construction boom throughout the late 1970s. From
this higher peak, Oregon’s economy suffered a more
severe recession than the U.S. as a whole. The state
lost over 12 percent of its employment and in both
1982 and 1983 the state experienced actual net
outmigration as the population declined. The loss of
middle-wage jobs associated with timber production
was particularly pronounced. Even as the state
recovered rapidly in the latter half of the decade, over
the course of the full ten years between Census’,
Oregon saw less net job creation than the average
state.
During the 1990s, Oregon’s growth differed
significantly from the national pattern, as the state
experienced a very strong economic expansion
characterized by the ramp-up of the high technology
sector, and accompanied by strong population growth.
Oregon’s growth across the top three wage groups
significantly outpaced the national average while low-
wage occupational growth essentially matched the
national average in percentage terms. Thus, while the
nation experienced an increase in the relative size of
the low-wage occupations, Oregon did not. Oregon’s
strong employment growth was seen nearly across
the board. Growth was significantly stronger than the
national average for all occupational groups except
Farming and Food Preparation both of which are low-
wage groups.
Figure 3
In the 2000s, Oregon’s growth pattern once again
mirrored the national pattern. Concentration in both
the high-wage and low-wage occupational groups
increased, leading to substantially more job
polarization.
Oregon’s only difference relative to other states in
recent years has been weak local job growth among
middle-wage occupational groups. Surprisingly,
Oregon has gained just as many jobs in high-wage
occupations as the typical state over the past decade,
despite seeing fewer job gains overall.
Oregon suffered two recessions during the decade,
both of which hit Oregon harder than the typical state,
and reduced manufacturing and headquarters
operations significantly. The relative severity of
Oregon’s recessions during the 2000’s manifested
itself in a loss of many middle-wage jobs.
Early in the decade, Oregon lost many of its metal
makers, technology firms and its last major
headquarters operation for the timber industry. At the
end of the decade, the housing downturn cost Oregon
many construction and wood product jobs. Local
recreational vehicle and other transportation
equipment producers have also become significantly
smaller in recent years.
The two middle-wage occupational categories
experienced slight gains at the U.S. level over the
decade (+4.2%) while in Oregon they actually
declined outright (-1.0%). This decline was a function
of losses in Construction, Production and
Administrative Support occupations not being fully
offset by gains in Teachers, Sales and Healthcare
Support positions within the state.
The drag from Oregon’s manufacturing losses in
aggregate is larger than in the typical state because
we have more manufacturing jobs to lose. In
percentage terms, however, Oregon’s manufacturers
usually do better than most in both good times and in
bad in aggregate4.
One measure of relative dependence on
manufacturing is called an employment location
4 Industries such as wood products and paper have fared worse than the nation in recent decades while Oregon metal manufacturers and computer and electronic manufacturers have outperformed.
13.8% 12.8% 12.3% 15.2%
50.9% 49.0% 46.3% 42.2%
16.7% 16.6% 18.5% 17.6%
18.7% 21.6% 23.0% 24.9%
0%
10%
20%
30%
40%
50%
60%
70%
80%
90%
100%
1980 1990 2000 2010
Polarization in Oregon (1980 - 2010) High Wage Upper Middle Lower Middle Low Wage

7
quotient. A location quotient (LQ) compares the share
of jobs in manufacturing locally to the share nationally.
An LQ greater than one implies Oregon depends
more on manufacturing than does the typical state.
Oregon’s manufacturing LQ has been increasing over
time, helping to support the lower middle-wage
occupational group relative to the nation, or average
state. Oregon added manufacturing jobs during the
1980s and 1990s while the nation overall was losing
these jobs. More importantly, Oregon lost relatively
fewer during the 2000s when compared to the nation
overall. Following the timber industry restructuring in
the 1980s, Oregon’s manufacturing LQ was just 1.01
in 1990, indicating that the relative size of the
manufacturing sector in Oregon was just slightly larger
than the national average. However by 2000, the
state’s LQ had increased to 1.06, by 2010 it had
increased to 1.15 and by 2012 it had increased further
to 1.17.
A heavy dependence on struggling manufacturing
industries remains a primary factor behind job
polarization in Oregon. However, the state’s economy
would be much worse if our local manufacturers
performed as poorly as those in other states.
Low-wage occupations in Oregon have grown slower
than the nation over the past thirty years. This
difference is largely due to slower growth during
Oregon’s dark period of the 1980s. Since 1990,
Oregon’s growth in low-wage occupations has
essentially matched the national rates of growth. From
1990-2010, U.S. low-wage occupations have grown
60 percent, compared to 58 percent in Oregon.
The Impact of the Great Recession
During the Great Recession many occupations were
scaled back significantly. The economy is currently
recovering, and jobs are being created and filled, but
not necessarily the same jobs that were lost. In
particular, many manufacturing jobs are gone for
good, and the construction industry remains a shell of
its old self. It is important to examine how, if at all, job
polarization has been affected by the post-recession
mix of industries in Oregon.
Occupational employment statistics data are available
from the U.S. Bureau of Labor Statistics for the 1997
through 2012 time period5. The analysis of
occupational changes in Oregon over the past decade
using this data source closely mirrors that of the
Census data discussed previously and is therefore
omitted from this report6.
As shown in Figure 4, the Great Recession’s impact
on job polarization has been to exacerbate the
occupational employment trends in Oregon.
Figure 4 – The Great Recession’s Impact
During the recession, employment loss in both the
high-wage and low-wage occupations was
significantly smaller than losses among middle-wage
5 Due to technical changes in the data gathering process, such as occupational or geographic definition changes, the Bureau of Labor Statistics does not use the data for time-series analysis. However, given the consistent geographical definitions of both the State of Oregon and the Portland Metropolitan Statistical Area and the fact that the occupational definitions are consistent during the 1999-2009 period and also the 2010-2012 period, the Office of Economic Analysis has been able to combine the annual occupational employment statistics for Oregon that cover the 1999-2012 period. 6 For more information, please see the accompanying presentation slides
-12%
-10%
-8%
-6%
-4%
-2%
0%
TOTAL High Wage Upper Middle
Lower Middle Low Wage
Changes in Recession (2008-2010)
Oregon U.S.
0%
2%
4%
6%
8%
TOTAL High Wage Upper Middle
Lower Middle
Low Wage
Changes in Recovery (2010-2012)
Oregon U.S.

8
occupations. While Oregon lost 8 percent of its jobs
overall, high-wage occupations only lost 2 percent of
employment, while low-wage occupations lost 3.5
percent. The vast majority of the job loss during the
recession occurred in both the upper middle- and
lower middle-wage occupations.
Out of the state’s total job losses of slightly more than
137,000, 88 percent were in either upper middle or
lower middle occupational groups. Two-thirds of these
losses can be traced to Construction, Production and
Administrative Support occupations. The relative
strength of the high-wage occupations was partly due
to 6.2 percent growth in Health Practitioners during
the recession, or nearly 5,000 jobs. However, even
when Health Practitioners are excluded, high-wage
occupations only fell 4.6 percent, significantly less
than the total statewide.
Two years into the labor market recovery the same
general job polarization pattern has emerged. From
2010 to 2012, job growth has been dominated by both
high- and low-wage occupations. In fact, nearly
23,000 of the 40,000 jobs gained in the past two
years7 have been among high-wage occupations,
while just over 15,000 of the jobs gained have been
among low-wage occupations.
Approximately 10,000 of the high-wage gains have
been within the Management occupational group
however Business and Finance, Computer and
Mathematical and Architecture and Engineering
occupational groups have each added around 5,000
jobs over the past two years.
Low-wage occupational gains have been
concentrated in Personal Care and Services – 9,000
jobs gained – while both Food Preparation and
Farming, Fishing and Forestry have each added
nearly 2,400 jobs.
The counterweight to the gains at the high and low
ends, are the small gains seen in the upper middle-
wage group and continued losses in the lower middle-
wage group. Employment gains were seen in the
Teacher and Arts and Entertainment occupations in
2011 and 2012, while job losses continued in
7 Job gains across different data sources indicate similar growth. Occupational data shows gains of 40,210 while corresponding gains from the CES show 34,300 and the QCEW gains number 39,613.
Construction, Protective Services and Healthcare
Support occupations. Even within these occupational
groups, there is substantial variation. For example,
even though employment in Teaching occupations
increased, this was due to strong growth in
Postsecondary occupations as college enrollment
skyrocketed during and after the recession in a tough
labor market. K-12 teaching positions, however,
continued to see job losses as local governments,
including school districts, faced budget reductions and
difficult spending decisions.
Regional Divide
While job polarization is a nationwide issue, the extent
of the occupational changes does vary at the local
level. Figure 5 illustrates the effects of job polarization
in Oregon’s metropolitan areas8 and the rest of the
state.
Like the nation as a whole, both Oregon’s
metropolitan and non-metropolitan areas have seen
job polarization occur. However the nature of this
polarization differs as the larger cities have
experienced a more “high-wage heavy” job
polarization, while the more rural areas have
experienced a more “low-wage heavy” polarization.
Figure 5 – Metro and Non-Metro Job Polarization
The fact that the occupational data show the state’s
urban areas are recovering faster than the rest of the
state is consistent with what we are observing in
alternative data on job gains across industries. New
8 Oregon’s metropolitan areas are defined here as the Coravllis, Eugene, Medford, Portland and Salem MSAs. Bend is excluded due to data availability.
-15%
-10%
-5%
0%
5%
10%
15%
20%
25%
30%
High Wage Upper Middle Lower Middle Low Wage
Occupational Change (2000-2012)
Metro Oregon Oregon Non-metro Oregon

9
high-wage jobs are in occupational groups such as
Legal, Management, Business and Finance, which
tend to be housed in professional service industries
that can be found in large and economically diverse
metropolitan areas.
The Outlook
While examining historical changes helps place
current events in their proper perspective, what does
the future hold for Oregon employment? Both our
office’s economic forecast and the Oregon
Employment Department’s 10-Year Employment
Projections by Industry and Occupation reveal that the
same general job polarization pattern is expected to
continue going forward.
The job gains seen in these first two years of
expansion following the Great Recession have been
very polarized, as shown previously. While
polarization is expected to continue, it will likely be
somewhat muted over the next few years as there will
be some cyclical bounce following such a deep
recession.
Specifically, Construction and Teachers – both upper
middle-wage occupations – will see job gains in the
near term. The housing market continues to recover
and new construction activity is just now returning to a
level commiserate with job gains. Similarly, state and
local government budgets are being repaired, both
from a revenue and expenditure perspective, and
moving forward school districts are expected to hire
additional teachers. These gains will help stem the
tide of polarization in the near term, as the economy
continues to recover.
However, despite the cyclical improvement in some
middle-wage occupations, there will remain structural
impacts on jobs due to globalization and technology.
In particular, manufacturing in both Oregon and the
U.S. continues to be pressured by both forces as
today’s production workers are much more productive
than their predecessors even as their ranks have
declined considerably in the past two decades. Going
forward, it is expected that manufacturers will continue
to need to become more productive in order to
survive. With each manufacturing worker expected to
produce more, job counts will continue to lag output
for much of the industry.
Administrative Support workers – bookkeeping,
payroll, clerks, etc – are likely to continue to face
technological advancements in the workplace as
these occupations, generally, perform routine tasks
which are prime candidates for automation. This
process has been ongoing for decades already.
According to the Census data, in 1980 Administrative
Support accounted for over 17 percent of the Oregon
workforce. In 2010, they accounted for less than 15
percent. This relative decline represents
approximately 38,000 Administrative Support jobs in
Oregon today. Given that businesses continue to
investment in business equipment and technological
advancements, this trend is expected to continue. The
number of Oregonians employed within these
occupations will increase over time, however their
relative share of the workforce will continue to erode.
Overall, despite some cyclical improvements in the
near term, job polarization is projected to continue to
shape the state and national labor market in the years
to come.
For more detailed information on occupational
projections, please visit the Oregon Employment
Department’s website: http://www.qualityinfo.org9.
Policy Considerations of Job Polarization
Job polarization is not necessarily bad. To the extent
that the jobs being created today and tomorrow are in
high-wage occupations that fit the skill set of Oregon’s
households, polarization represents a positive
development in the economy. Shrinking job
opportunities in the middle-wage occupational groups
become a problem when these jobs are replaced by
corresponding low-wage jobs, or by jobs for which
local workers are not qualified.
The lack of hard-to-define “family wage” jobs is
problematic when the only available opportunities are
either unemployment or a low-wage job. This results
in a lower standard of living for those individuals and
families that lose a middle-wage job and are unable to
find another one with similar wages. It also has
negative implications for upward mobility among low-
income households.
9 http://www.qualityinfo.org/pubs/projections/projections.pdf

10
Over the long run, the primary determinant of what a
worker gets paid is the value that worker brings to
their employer. As such, in order to improve the
income level of Oregon’s workers, either these
workers must become more productive, or additional
productive employers must be attracted to the region.
Workers may become more productive by investing in
education, by gaining experience within an industry or
at a specific firm, or by gaining access to additional
equipment, technology or other resources.
Over the past three decades, it has become more
difficult to obtain a job in high-wage or upper middle-
wage occupation in Oregon without additional training
or a college degree. During the 1960s and 1970s,
when timber industry employment was booming10
,
workers commonly finished high school and began
working at the local mill. During this period, timber
industry jobs paid wages that were typically 30
percent above the statewide average. This type of
employment has declined considerably in the past 30
years and real wages have likewise not kept pace.
Continuing with the timber example, the remaining
industry jobs now pay the statewide average wage,
and employment has declined by approximately two-
thirds. This represents not only a decline in the
number of middle-wage jobs, but the wages
themselves have eroded as well.
Education attainment in the form of four year degrees
is not the be-all and end-all for finding a high-wage
job, but it does help considerably at the individual
level. Inevitably some dropouts will become
successful managers, while some graduate degree
holders will continue to work food preparation jobs. On
aggregate, however, the correlation between
education and pay is strong. It is important to point out
that educational attainment beyond college degrees
may refer to additional training such as a certification
process in which individuals further their skills and
become more competitive in the labor market.
Furthermore, in a weak labor market, such as in the
aftermath of the Great Recession, employers can be
more selective in their hires as there are more
applicants from which to choose.
10 http://oregoneconomicanalysis.wordpress.com/2012/01/23/historical-look-at-oregons-wood-product-industry/
Figure 6 – Job Openings & Education Requirements
Job polarization cannot be addressed without a focus
on educational attainment. That said, Oregon’s
success story of the 1990’s was not driven by high
enrollment at local colleges and universities. At that
time job polarization stalled and educational
attainment improved, because Oregon was able to
attract many valuable firms and skilled workers to the
area.
One important aspect along the education—wage
spectrum is to focus on the differences among similar
groups (see Figure 7, next page). For example, even
among the occupations that have a high concentration
of four year degrees, shown in Panel B, there is
considerable wage variation. Computer Programmers,
Doctors, Engineers, and Lawyers all earn more than
double the statewide median wage and approximately
two-thirds of these occupational groups have at least
a Bachelor’s Degree.
However, interestingly enough, Management, the
highest paid occupational group, has the lowest level
of educational attainment among this subset. This
indicates that there is path forward to high paying jobs
for employees without formal education, albeit it is
likely a narrower path. One example would be a
construction worker who, after years of experience,
starts his or her own firm. Or an employee at a
business who gains considerable within firm
experience and knows the business inside and out
who receives a promotion to a management position.
These hypothetical examples illustrate that, in addition
to education, experience within a given firm or
industry can increase worker productivity. The value
of experience is likely why the Management group has
0%
20%
40%
60%
80%
100%
High Wage Upper Middle Lower Middle Low Wage
Competitive Education Needed (2010-2020) Related Work Experience Bachelor's or Higher

11
lower formal educational requirements than the other
high-wage groups.
Conversely, on the other end of the highly educated
spectrum are occupations that, while certainly paying
more than the median statewide wage, do pay less
than similar workers in other occupations. Among
these are Scientists, Teachers, Community Service
(counselors, social workers, clergy and religious
workers, etc) and Arts, Design and Entertainment
occupations. The majority of these jobs do require a
bachelor’s degree and may reflect more of a lifestyle
occupational choice than a pure salary story, where
the workers enjoy additional nonpecuniary rewards in
addition to their salary.
Where one sees an even broader divergence is in the
variation of educational attainment among the upper
middle-wage occupations (the dark blue bubbles). All
of these occupations pay approximately the same
wage, and are performed by skilled workers, yet
require vastly different levels of formal education. The
typical construction worker (54% high school degree
or less) earns the same the typical teacher (76%
bachelor’s degree or higher). One reason for this is
that these occupations require some abstract thinking
and problem solving skills, not to mention nonroutine
physical activities and human interaction. Not all of
these skills are learned in the classroom. For example
installation and repairmen typically learn on the job
and/or through an apprenticeship program.
This has important implications for creating and
sustaining upper middle-wage jobs. One good way of
categorizing these occupations is they are driven in
large part by population and demographics. Stronger
population growth leads to an increase in demand for
housing, repair work, police officers, social workers
and teachers. During the strong 1990s expansion in
Oregon, population growth averaged nearly 2 percent
per year and the upper middle-wage jobs actually
grew the quickest among all wage groups (see Figure
2). It was during this time period that Oregon was able
to stem the polarization tide, given the strong gains in
these middle-wage jobs.
Lower middle-wage jobs do not tend to require four-
year degrees and pay approximately the state median
wage, although educational attainment does vary
within this larger group. Employing 42 percent of
Oregonians, these occupations comprise the largest
wage group in the state. These occupations have also
been the most prone to the impacts of automation,
technology and globalization. Their relative share of
Figure 7 – Occupations, Wages and Education
Panel A – High School Degree or Less Panel B – Bachelor’s Degree or Higher
Biz / Finance
Admin Support
Healthcare Practitioners
Food Prep
Trans.
Arch / Eng
Arts, Design, Ent
Bldg Maint
Community Service
Comp / Math
Construction
Ag
Install & Repair
Legal
Management
Production
Protective
Sales
Scientists
Teachers
Personal Care
Healthcare Support
$10,000
$20,000
$30,000
$40,000
$50,000
$60,000
$70,000
$80,000
$90,000
0% 10% 20% 30% 40% 50% 60% 70% 80%
Me
dia
n W
age
, 20
12
Share with High School Degree or Less
Biz / Finance
Admin Support
Healthcare Practitioners
Food Prep
Trans.
Arch / Eng
Arts, Design, Ent
Bldg Maint
Community Service
Comp / Math
Construction
Ag
Install & Repair
Legal
Management
Production
Protective
Sales
Scientists
Teachers
Personal Care
Healthcare Support
$10,000
$20,000
$30,000
$40,000
$50,000
$60,000
$70,000
$80,000
$90,000
0% 15% 30% 45% 60% 75% 90%
Me
dia
n W
age
, 20
12
Share with Bachelor's Degree or Higher

12
the Oregon labor market has shrunk from 51 percent
of all jobs in 1980 to just 42 percent today. This is due
to outright losses in Production (manufacturing),
slower than average gains in Administrative Support
and effectively flat employment in Transportation and
Material Moving. These occupations tend to perform
more routine and repetitive tasks that require less
abstract thinking than other groups. With
advancements in technology and automation, these
occupations are being eliminated and replaced with
computers and programs. Production and
Transportation jobs also require less in terms of
formal education with over half of all employees
obtaining a high school degree or less and not quite
10 percent having obtained at least a bachelor’s
degree.
Jobs in the Health Support and Sales occupational
groups have increased faster than average over the
past thirty years and these occupations tend to require
more in terms of formal education than their lower
middle-wage peers. Forty percent of workers within
Sales have an associate’s degree or at least some
college while 57 percent of Health Support workers
do.
While the upper middle-wage jobs can be considered
as being driven by population growth, these lower
middle-wage jobs can broadly be considered as
business support occupations. Administrative Support,
Sales and Transportation all act as suppliers of labor
and services to other businesses or employees. With
increases in business operations, including
headquarters, the demand for such occupations will
increase even if technological advancements continue
to eliminate a portion of these jobs. This provides an
opportunity for continued investment into activities that
foster both an entrepreneurial business climate and
also recruitment and retention efforts of existing firms.
The loss of significant headquarter operations in
Oregon over recent decades has decreased the
demand for some of these business support firms and
workers.
Low-wage occupations tend to not require much in
terms of formal education although some Personal
Care workers, particularly in cosmetology, are
required to be certified and some occupations in Food
Preparation, such as chefs, do have many workers
who have attended a career or trade school. Other
requirements for low-wage work are general physical
activities and/or face-to-face interaction with
customers and co-workers. While the educational
requirements are generally minimal, these
occupations have been harder for businesses to
automate given the required interaction or
nonrepetitive manual labor. Demand for these
services (and workers to provide the services) is
expected to increase faster than most occupations are
the economy continues to recover and expand.
A key question moving forward is whether the coming
decades in Oregon will be more like the 1990s or the
2000s. Our office’s economic outlook for the state in
the next decade is somewhere in between these
benchmarks. The expansion is projected to continue
and even gather steam in the coming years; however
the rate of growth – at least in terms of employment –
will not reach the rates seen in previous expansions in
the state.
For more information on educational attainment by
occupation, please see Appendix B.
Transitions are not Costless
Investments in equipment and technology on the part
of Oregon’s firms also lead to higher wages for local
workers. Although it is often the case that investments
in equipment and technology lead to the need for
fewer employees, the workers that remain become
more productive and valuable, and their jobs more
secure, at least in the near-term, before the advent of
future technological advancement.
Since many currently low-paid occupations are
expected to be in demand in the future, one
prescription is to make them better through
investment. Over time, automation and
computerization of the workplace are making current
workers more and more productive, regardless of
which occupational group one wishes to discuss. The
employees of today are significantly more productive
than the employees of yesterday and, most likely,
significantly less productive than the employees of
tomorrow.
With that being said, the transition for workers
displaced by these processes is not costless. It can
take considerable time and/or money to find another

13
job, particularly if the displaced worker has to retrain
for a different career path or relocate.
An example of such a transition is the recreational
vehicle (RV) manufacturing industry in Oregon. The
industry lost nearly 80 percent of its jobs during the
Great Recession of which many were high-paying and
high-skill. Through wage records, the Oregon
Employment Department11
was able to track these
former RV employees over time as they found a
different job. Overall the median wage for former RV
workers declined 11 percent from the wage earned
while working in the RV industry to their current
position four years later. Approximately one-third of
these workers saw a wage gain during this transition,
however for the nearly two-thirds who saw wage
reductions, the median loss was 27 percent or over
$8,700 on an annual, full-time basis.
During periods of transition, such as the RV example,
it is important to have both properly functioning safety
net programs to help financially and also appropriate
training programs available so that workers may
obtain the skills that are in demand from employers.
Conclusion
Job polarization, defined as employment growth at
both the high-wage and low-wage level with shrinking
job opportunities in the middle-wage occupations, has
been ongoing for at least three decades in Oregon.
The majority of Americans and Oregonians are still
employed within middle-wage occupational groups.
11
http://www.qualityinfo.org/olmisj/ArticleReader?itemid=00008243
However, new jobs are disproportionately being
created in other industries or occupations. The
conventional wisdom in recent years is that both the
U.S. and Oregon economies are losing middle-wage
occupations and are replacing these jobs with low-
wage ones. This is undoubtedly true as far as it goes,
however the economy is also disproportionately
creating high-wage occupations as well. This last fact
is either not part of the general conversation of the
changing nature of the economy or the conventional
wisdom, however is a major component of job
polarization overall.
There are a number of contributing factors to this
polarization including the effects of both technology
and globalization. Given the outlook for growth across
occupations, job polarization is expected to continue
in Oregon throughout this decade.
With that being said, not all hope is lost. Oregon has
many comparative advantages that can be maintained
and improved through investment. Oregon enjoys
long-term advantages of low electricity costs, partially
due to the region’s renewable hydroelectricity, a
central location between the large markets of
California, Vancouver, B.C. and Asia, abundant and
clean water, low business rents and living costs, and
an increasingly diverse industrial base. These
advantages, along with an increasingly educated
population and the proven ability to attract young
migrants provide growth opportunities to help stem the
tide of polarization more than in states that lack such
advantages. The march of technology will continue to
transform both the economy and the labor market;
however having the people and the skills necessary to
take advantage of these new opportunities is vital.
Examining the data and identifying trends in job
polarization, as this report has attempted to do, is an
important first step. Areas of interest for future
research include: a more detailed examination of
individual occupations, wage distributions within
occupations and a more local or regional analysis
within the state. Further considerations could also
address the state tax revenue implications of
increased job polarization and a more tactical
discussion of public policy options, including analyzing
workers transitioning from a middle-wage occupation
to either a high- or low-wage one.
0%
5%
10%
15%
20%
25%
< $
8
$8
$1
0
$1
2
$1
4
$1
6
$1
8
$2
0
$2
2
$2
4
$2
6
$2
8
$3
0-$
35
$3
5-$
40
$4
0-$
50
>$5
0
Hourly Wage
Former RV Workers Take A Pay Cut Distribution of Hourly Earnings
2007q3 (RV Manufacturing)
2011q3 (Different Industry)

14
The author would like to thank the Federal Reserve
Bank of New York for their data assistance and both
the Oregon Employment Department and the
Legislative Revenue Office for valuable comments on
the report. Additional thanks to Oregon’s State
Economist, Mark McMullen, for substantial comments
and edits and also to Oregon’s State Demographer,
Kanhaiya Vaidya, for data assistance on the
educational attainment by occupation in Oregon.
References:
The Skill Content of Recent Technological Change:
An Empirical Exploration. Quarterly Journal of
Economics, 118(4), November 2003, 1279-1334.
David Autor, Frank Levy and Richard Murnane.
http://economics.mit.edu/faculty/dautor/data/autlevmur
n03
The Trend is the Cycle: Job Polarization and Jobless
Recoveries. March 31, 2012. Nir Jaimovich, Duke
Univeristy and Henry E. Siu, University of British
Columbia.
http://faculty.arts.ubc.ca/hsiu/research/polar20120331.
The Polarization of Job Opportunities in the U.S.
Labor Market. David Autor, MIT Department of
Economics and NBER. April 2010. Jointly released by
The Center for American Progress and The Hamilton
Project. http://economics.mit.edu/files/5554
Job Polarization in the United States: A Widening Gap
and Shrinking Middle. Jaison R. Abel and Richard
Deitz. Federal Reserve Bank of New York. November
21, 2011.
http://libertystreeteconomics.newyorkfed.org/2011/11/j
ob-polarization-in-the-united-states-a-widening-gap-
and-shrinking-middle.html
Regional Economic Press Briefing on Job Polarization
and Rising Inequality. Jaison R. Abel and Richard
Deitz. Federal Reserve Bank of New York. May 30,
2012.
http://libertystreeteconomics.newyorkfed.org/2012/05/j
ust-released-regional-press-briefing-on-job-
polarization-and-rising-inequality.html
Data Sources:
Census occupational data provided by the Federal
Reserve Bank of New York.
Educational attainment data from the Census
Bureau’s American Community Survey, Public Use
Microdata Sample, for 2009-2011.
Occupational data from the U.S. Bureau of Labor
Statistics. http://www.bls.gov/oes/oes_dl.htm
Oregon’s Occupational Projections data from the
Oregon Employment Department.
http://www.qualityinfo.org/pubs/projections/projections

15
Appendix A: Occupational Group Summaries
For a complete list of all occupations, please see the U.S. Bureau of Labor Statistics website:
http://www.bls.gov/soc/2010/soc_alph.htm
Management (SOC 11-0000): Chief Executives, Managers, Administrators and Directors of all industries and
business types, Legislators
Business/Finance (SOC 13-0000): Accountants, Appraisers, Budget, Credit and Financial Analysts,
Underwriters, Loan Officers, Tax Professionals, Buyers, Purchasing Agents, Claims Adjusters, Compliance
Officers, Cost Estimators, Human Resources, Market Research
Computer/Math (SOC 15-0000): Computer Systems and Programmers, Software Developers, Database
Administrators, Web Developers, Actuaries, Statisticians, Mathematical Technicians
Engineers/Architects (SOC 17-0000): Architects, Surveyors, Engineers, Drafters
Scientists/Social Scientists (SOC 19-0000): Food, Soil, Life, Medical, Materials and Physical Scientists,
Zoologists, Foresters, Physicists, Chemists, Economists, Psychologists, Planners, Biological and Chemical
Technicians, Research Assistants, Forensic Science
Community Service (SOC 21-0000): Counselors, Therapists, Social Workers, Treatment and Social Specialists,
Clergy, Religious Workers
Legal (SOC 23-0000): Lawyers, Law Clerks, Judges, Adjudicators, Arbitrators, Paralegals, Court Reporters, Title
Examiners, Legal Support Workers
Teachers (SOC 25-0000): Primary, Secondary and Postsecondary Teachers including Special Education,
Archivists, Curators, Museum Technicians, Librarians, Teacher Assistants
Arts/Entertainment (SOC 27-0000): Art Directors, Craft, Fine and Multimedia Artists, Fashion, Floral, Graphic,
Interior and Set Designers, Actors, Producers, Athletes, Coaches, Referees, Dancers, Choreographers, Radio
and Television Announcers, Reporters, Editors, Writers, Interpreters, Broadcast Technicians, Photographers
Health Practitioners (SOC 29-0000): Chiropractors, Dentists, Pharmacists, Anesthesiologists, Practitioners,
Psychiatrists, Surgeons, Physicians, Registered Nurses, Physical, Radiation and Respiratory Therapists,
Veterinarians, Medical Laboratory Technicians, Dental Hygienists, Athletic Trainers
Health Support (SOC 31-000): Home Health, Nursing, Pharmacy and Psychiatric Aides, Physical Therapist,
Massage, Dental, Medical and Veterinary Assistants
Protective Services (SOC 33-0000): Firefighters, Bailiffs, Correctional Officers, Detectives, Parking
Enforcement, Police and Sheriff Officers, Animal Control, Security Guards, Lifeguards
Food Prep (SOC 35-0000): Chefs, Fast Food, Cafeteria and Restaurant Cooks, Bartenders, Counter Attendants,
Waiters and Waitresses, Food Servers, Dishwashers
Bldg Maintenance (SOC 37-0000): Maids, Housekeeping, Building Cleaners, Pest Control, Landscaping,
Groundskeeping, Pesticide Handlers, Tree Trimmers
Personal Care (SOC 39-0000): Gaming, Amusement, Recreation, Locker Room and Funeral Attendants,
Barbers, Hairdressers, Manicurists, Skin Care, Concierges, Tour Guides, Flight Attendants, Child Care, Fitness
Trainers

16
Sales (SOC 41-0000): Cashiers, Rental Clerks, Advertising, Insurance Sales, Financial Services Agents, Travel
Agents, Sales Representatives, Models, Real Estate Brokers and Agents, Telemarketers
Office Support (SOC 43-0000): Bill and Account Collectors, Bookkeeping, Payroll, Procurement, Tellers,
Customer Service Representatives, File, Hotel Desk, New Accounts, Office and Order Clerks, Receptionists,
Couriers, Emergency Dispatchers, Meter Readers, Postal Service, Shipping, Receiving and Stock Clerks,
Executive, Legal and Medical Secretaries, Data Entry
Farming (SOC 45-0000): Agricultural Inspectors, Graders, Sorters, Equipment Operators, Farmworkers,
Laborers, Forest and Conservation, Fallers, Logging
Construction (SOC 47-0000): Brick and Stone Masons, Carpenters, Floor Layers, Tile Setters, Construction
Laborers, Paving, Drywall, Electricians, Insulation, Painters, Plumbers, Roofers, Sheet Metal, Helpers, Building
Inspectors, Highway Maintenance, Septic Tank Servicers
Installation/Repair (SOC 49-0000): Repair and/or Installation of Machines, Motors, Electronics, Automobiles,
Glass, Boats, Tires, Security Systems, HVAC, Appliance, Bicycles, Watches and Telecommunications,
Mechanics, Locksmiths
Production (SOC 51-0000): Inspectors, Testers, Sorters, Team Assemblers, Fabricators, Welders, Machinists,
Electrical Equipment Assemblers, Cabinetmakers, Semiconductor Processors, Bakers, Laundry and Dry-
Cleaning, Butchers, Water Treatment Plants, Sewing
Transportation (SOC 53-0000): Truck Drivers, Taxis, Pilots, Air Traffic Controllers, Bus Drivers, Sailors, Parking
Lot and Service Station Attendants, Freight, Stock and Material Laborers, Packers and Packagers, Refuse and
Recyclable Collectors

17
Appendix B: Median Wages and Educational Attainment
High-wage Occupations
Management $84,320
Healthcare Practitioners $73,950
Legal $72,930
Architecture & Engineering $72,060
Computer & Mathematical $71,220
Business & Finance $58,310
Scientists, including Social $55,370
Upper Middle-wage Occupations
Construction $45,550
Teachers $44,250
Protective Service $43,780
Installation & Repair $43,710
Arts & Entertainment $41,800
Community Service $40,480
Lower Middle-wage Occupations
Administrative Support $32,690
Production $32,530
Transportation $29,960
Healthcare Support $29,790
Sales $27,360
Low-wage Occupations
Building Maintenance $23,750
Farming and Related $22,660
Personal Care $21,850
Food Preparation $19,970
Total $35,650
Source: U.S. Bureau of Labor Statistics
Oregon Median Wage, 2012
4.8
5.7
8.0
7.5
5.7
4.8
8.0
11.0
10.4
16.5
30.9
31.8
21.7
28.7
28.4
42.6
50.7
54.9
56.2
61.1
53.6
41.2
77.5
12.4
18.5
19.5
22.3
28.6
32.9
31.7
29.6
32.9
34.3
37.3
41.0
53.8
51.1
56.9
43.6
37.6
36.1
35.7
30.9
38.8
51.5
16.3
82.9
75.8
72.5
70.1
65.7
62.3
60.3
59.5
56.7
49.2
31.9
27.2
24.5
20.1
14.8
13.8
11.8
9.0
8.1
8.0
7.6
7.2
6.2
0% 20% 40% 60% 80% 100%
Scientists
Teachers
Legal
Community Service
Engineer/Arch
Healthcare Practitioners
Computer / Math
Arts, Design, Ent
Business, Finance
Management
Total
Sales
Protective Services
Admin Support
Heathcare Support
Personal Care
Food Prep
Production
Transportation
Bldg Cleaning & Maint
Construction
Install, Maint, Repair
Agriculture
Educational Attainment by Occupation 2009-11 American Community Survey
High School or Less
Some College
Bachelor's Degree or Higher
18
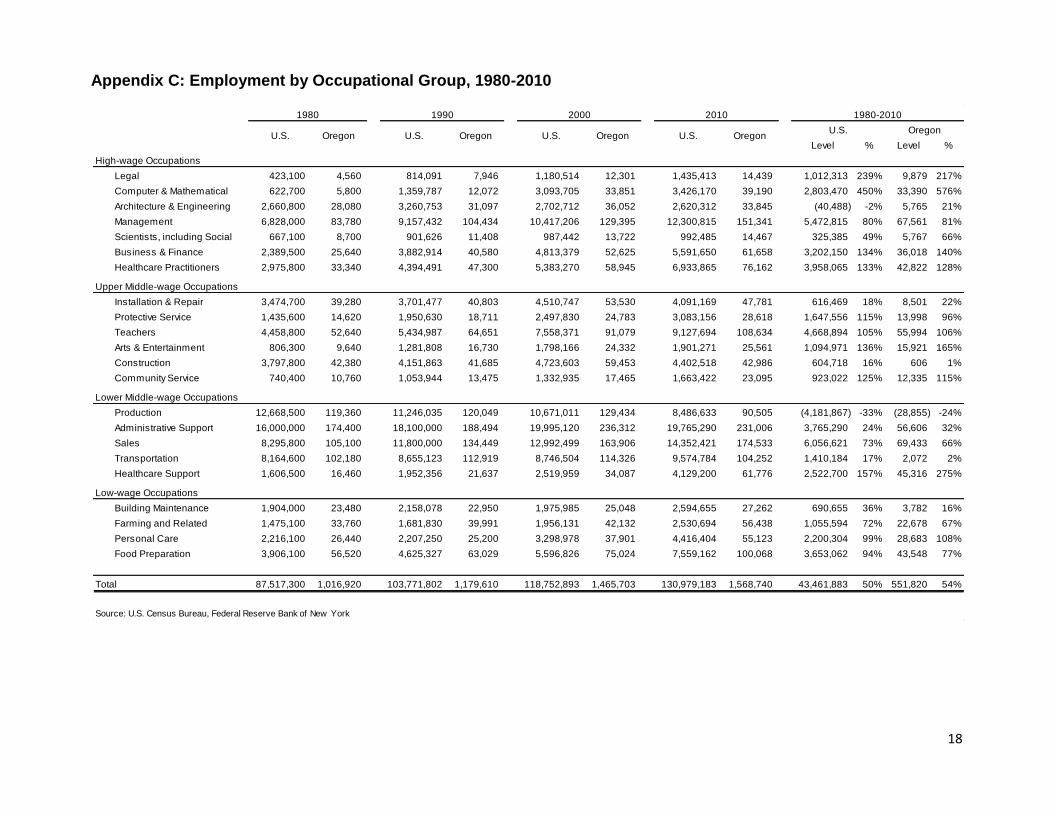
Appendix C: Employment by Occupational Group, 1980-2010
Level % Level %
High-wage Occupations
Legal 423,100 4,560 814,091 7,946 1,180,514 12,301 1,435,413 14,439 1,012,313 239% 9,879 217%
Computer & Mathematical 622,700 5,800 1,359,787 12,072 3,093,705 33,851 3,426,170 39,190 2,803,470 450% 33,390 576%
Architecture & Engineering 2,660,800 28,080 3,260,753 31,097 2,702,712 36,052 2,620,312 33,845 (40,488) -2% 5,765 21%
Management 6,828,000 83,780 9,157,432 104,434 10,417,206 129,395 12,300,815 151,341 5,472,815 80% 67,561 81%
Scientists, including Social 667,100 8,700 901,626 11,408 987,442 13,722 992,485 14,467 325,385 49% 5,767 66%
Business & Finance 2,389,500 25,640 3,882,914 40,580 4,813,379 52,625 5,591,650 61,658 3,202,150 134% 36,018 140%
Healthcare Practitioners 2,975,800 33,340 4,394,491 47,300 5,383,270 58,945 6,933,865 76,162 3,958,065 133% 42,822 128%
Upper Middle-wage Occupations
Installation & Repair 3,474,700 39,280 3,701,477 40,803 4,510,747 53,530 4,091,169 47,781 616,469 18% 8,501 22%
Protective Service 1,435,600 14,620 1,950,630 18,711 2,497,830 24,783 3,083,156 28,618 1,647,556 115% 13,998 96%
Teachers 4,458,800 52,640 5,434,987 64,651 7,558,371 91,079 9,127,694 108,634 4,668,894 105% 55,994 106%
Arts & Entertainment 806,300 9,640 1,281,808 16,730 1,798,166 24,332 1,901,271 25,561 1,094,971 136% 15,921 165%
Construction 3,797,800 42,380 4,151,863 41,685 4,723,603 59,453 4,402,518 42,986 604,718 16% 606 1%
Community Service 740,400 10,760 1,053,944 13,475 1,332,935 17,465 1,663,422 23,095 923,022 125% 12,335 115%
Lower Middle-wage Occupations
Production 12,668,500 119,360 11,246,035 120,049 10,671,011 129,434 8,486,633 90,505 (4,181,867) -33% (28,855) -24%
Administrative Support 16,000,000 174,400 18,100,000 188,494 19,995,120 236,312 19,765,290 231,006 3,765,290 24% 56,606 32%
Sales 8,295,800 105,100 11,800,000 134,449 12,992,499 163,906 14,352,421 174,533 6,056,621 73% 69,433 66%
Transportation 8,164,600 102,180 8,655,123 112,919 8,746,504 114,326 9,574,784 104,252 1,410,184 17% 2,072 2%
Healthcare Support 1,606,500 16,460 1,952,356 21,637 2,519,959 34,087 4,129,200 61,776 2,522,700 157% 45,316 275%
Low-wage Occupations
Building Maintenance 1,904,000 23,480 2,158,078 22,950 1,975,985 25,048 2,594,655 27,262 690,655 36% 3,782 16%
Farming and Related 1,475,100 33,760 1,681,830 39,991 1,956,131 42,132 2,530,694 56,438 1,055,594 72% 22,678 67%
Personal Care 2,216,100 26,440 2,207,250 25,200 3,298,978 37,901 4,416,404 55,123 2,200,304 99% 28,683 108%
Food Preparation 3,906,100 56,520 4,625,327 63,029 5,596,826 75,024 7,559,162 100,068 3,653,062 94% 43,548 77%
Total 87,517,300 1,016,920 103,771,802 1,179,610 118,752,893 1,465,703 130,979,183 1,568,740 43,461,883 50% 551,820 54%
Source: U.S. Census Bureau, Federal Reserve Bank of New York
U.S.OregonU.S.OregonU.S.
1980-2010
OregonU.S.OregonU.S.Oregon
2010200019901980
Top Related