


Languages
Pages
Legal


Issues involved in designing and administering an assessment instrument to
measure adult learners’ progress in numeracy classes
Introduction
This paper describes the process of designing and administering a sufficiently valid
and reliable assessment instrument to measure the progress in attainment of adult
learners studying numeracy, and discusses some of the inherent difficulties that
were involved. The instrument was one of a range of research instruments that were
used in a 33-month correlational study entitled A study of effective practice in
inclusive adult numeracy teaching. The study aimed to investigate a range of
naturally occurring variations in teaching numeracy to adult learners in different
settings, to measure the correlations between teaching practices and learners’
progress, and to make recommendations for teaching, teacher training and
continuing professional development (CPD). The research was commissioned by
the Department for Education and Skills (DfES), part-funded by the European
Social Fund, and carried out by the National Research and Development Centre for
Adult Literacy and Numeracy (NRDC). It was one of a suite of five NRDC studies
based at three different centres, the others being concerned with reading, writing,
ESOL and ICT. The research design was based on a US study of the teaching of
literacy and English language to adult learners for whom English is an additional
language (Condelli et al., 2003).
1
Background
Until recently adult numeracy has been under-researched and under-developed
(Coben et al,. 2003). However, low levels of numeracy skill in the adult population,
as revealed by national and international surveys, have begun to raise the profile of
research in numeracy. The study was set within the context of the government’s
Skills for Life strategy to improve adult literacy and numeracy in England (DfEE,
2001a), and took place against a backdrop of policy changes in adult numeracy
education (DfEE, 1999; QCA, 2000; DfES, 2001; DfES/FENTO, 2002), post-14
mathematics education and training (Smith, 2004; Tomlinson, 2004; DfES, 2005),
initial teacher education (DfES/FENTO, 2002) and concerns about adults’ skill
levels (DfES/DWP/HMT, 2005).
In Skills for Life, numeracy is defined as the ability ‘to use mathematics at a level
necessary to function at work and in society in general’ (DfEE, 1999). The Skills
for Life target is for 1.5 million adults to improve their literacy and numeracy skills
by 2007 (DfES, 2003a), and this target needs to be seen against the background of
the extent of ‘need’ for basic skills in the adult population. The Skills for Life
survey found that 15 million adults of working age in England (47%) were
classified at or below level 1 of the National Qualifications Framework (NQF), the
level expected of an average 11 year old in numeracy (DfES 2003: 19). As we shall
see below, our study adapted the survey’s main instrument of numeracy
assessment.
2
Sample
Adult numeracy tuition is extremely heterogeneous in terms of the range of
provision, settings, teachers and the purposes of learners, by comparison not only
with numeracy and mathematics education in schools, but also with other Skills for
Life areas. One of the remits of the research project was to reflect this diversity.
The research in our study was undertaken in a variety of learning contexts
throughout England. Sites selected broadly reflected the range of settings nationally
and the proportion and types of learners studying in those types of settings. In our
study, 31 of the 47 classes were in FE colleges (11 classes of 16-19 year olds and
20 classes with adults, including ESOL, ICT, etc.), 4 in adult/neighbourhood
colleges, 2 in family numeracy, 4 in workplaces, 2 Jobcentre Plus, 1 Army training
course, 2 in prisons and 1 private training provider. While some courses were
taught from late September to the beginning of July, others (e.g., Jobcentre Plus)
ran for 10 weeks or less – indeed the Army training course was taught in a
concentrated package of 30 hours over 5 days. Classes ranged from one to 23
learners, with an average of 8. Some of the classes observed (28%) had a learning
support assistant or volunteer. Most classes took place in the daytime, and sessions
lasted for between 1 and 3 hours with an average of just under 2 hours.
Of the 34 teachers who took part, 25 (74%) were women and 9 (26%) were men; on
average, they had been teaching mathematics or numeracy for 13 years. A wide
3
variety of practice was observed, both between and within different teachers, which
they justified to researchers in relation to their specific circumstances. There was
also a wide range of learners of different ages, with different experiences of
schooling and a variety of motivations, dispositions, aspirations and needs,
including increasing numbers of non-traditional adult learners (Crossan, Field,
Gallacher, & Merrill, 2003). Of the 412 learners in our study, more than half the
sample was female (54%, n=222); 36% were of British origin; 31% Asian; 6%
Afro-Caribbean; and 6% African; 59% had English as their first language; and 23%
reported at least one factor affecting their ability to learn, with dyslexia occurring
most frequently (7%). A relatively large proportion, 41% (n=169), were 16-19 year
olds, but this is in line with Government Skills for Life statistics (see Bathmaker,
2005).
The fieldwork
The research team included four university researchers and six teacher-researchers,
and used a mixture of quantitative and qualitative approaches. The fieldwork took
place in two phases in the academic years 2003/04 and 2004/05. Phase 1 ran from
January to June 2004 (which meant we missed any learning that took place during
the first term), and Phase 2, from September 2004 to June 2005. Phase 1 was used
to further develop our research instruments, which were trialled at the outset of the
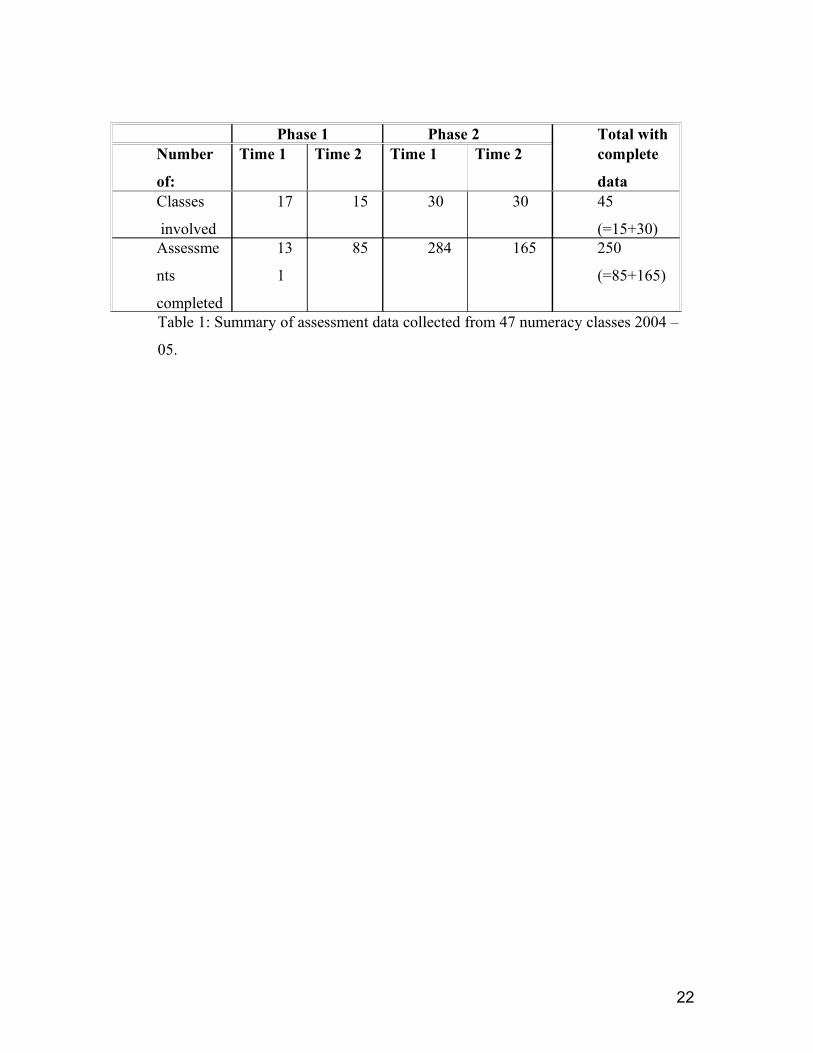
project. Over phases 1 and 2, we assessed 250 learners as close as possible to the
beginning (Time 1 (T1)) and end (Time 2 (T2)) of their learning programmes (see
4
Table 1). Although we originally planned to include only those classes of 30 hours
or more, because of the intermittent nature of work and workplace settings, this was
not always achieved. The average number of hours attended between pre- and post-
assessment for each class was 39.
Table 1 goes about here
Inherent difficulties relating to numeracy
As well as the diverse nature of the provision, settings, teachers and learners, there
are at least five other reasons related to the subject of numeracy teaching that make
research in adult numeracy particularly complex and problematic. Firstly, numeracy
is not a discrete entity: it is intimately bound up with literacy and language.
Numeracy problems may be presented through texts involving pictures and
diagrams, written words, numbers and symbols or through spoken language;
writing may also be required. This causes difficulties for learners with weaknesses
in these areas and was a challenge for us in the design and administration of our
assessment instrument. Secondly, numeracy is not a discrete entity in another sense:
adults’ numerate practices are deeply embedded in the contexts in which they occur
(Coben et al., 2003). Learners may or may not recognise the mathematics involved
in different activities and contexts. Moreover, transfer of learning between these
may be problematic (Carraher, Carraher, & Schliemann, 1985; Lave, 1988), posing
a challenge for teachers attempting to relate the curriculum to learners’ lives and, in
embedded provision, to the subject area for which numeracy is required. Thirdly,
5
numeracy skills are “more fluid, less ingrained” than literacy skills (Parsons,
Bynner, & Foudouli, 2005), which implies that levels of achievement may not be
stable across time or under varying circumstances. Fourthly, we know that some
adults have strong negative feelings and/or anxiety about mathematics, amounting
in some cases to ‘mathophobia’ (Winter, 1992). There is also a wider issue of the
impossibility of simulating, in the classroom, real-world situations in which
mathematics occurs (Dowling, 1991), so that an assessment might not give a clear
indication of an individual’s strengths and weaknesses when confronted with
mathematics outside the classroom. For all these reasons, the assessment of
numeracy is especially complex and further research is needed in order to produce
robust assessment instruments able to take account of the range of factors outlined
above.
Designing and administering the assessment instrument for measuring
learners’ progress
We were aware at the outset that there is a lack of adult-friendly, linguistically- and
culturally-sensitive instruments for assessing numeracy (Brooks, Heath, Pollard, &
Rees, 2003), and that “the measurement of adult numeracy skills is problematic,
especially for adults with lower ability levels (including special educational needs
and dyscalculia) and/or reading or language difficulties” (Coben et al., 2003: 1).
We reviewed several instruments against criteria established in an international
review of formative assessment procedures in adult numeracy teaching (Cumming
6
& Gal, 2000) and our wider knowledge of the research literature and decided to
adapt the instrument used in the Skills for Life national survey of need in adult
literacy and numeracy (DfES, 2003b) under licence from Her Majesty’s Stationery
Office (HMSO).
We were given access to data on the performance of assessment items (questions)
in the Skills for Life survey, and we selected an equal number of items at each of
the five relevant NQF levels, a balance of items on the curricular areas (number;
shape and space; data handling) and a range of types of question. We initially set a
threshold of 66% of those judged to be functioning at the corresponding level in the
Skills for Life survey who had answered that item correctly in order for it to be used
in our study. In the event, too few items achieved this level of reliability and we
had to lower our threshold to 55% to obtain enough items.
The Skills for Life survey tested 8730 randomly selected adults aged 16-65 in
England. The numeracy test was adaptive and administered one-to-one, by laptop
computer. For reasons of time, cost and resources, we adapted the test to a paper
and pencil form which could be given to a class of learners simultaneously. The T1
assessment was usually administered on the researcher’s first visit. We were
anxious not to take up too much of participants’ time so a more comprehensive test,
which would have provided a more detailed assessment, was rejected as being
impracticable. In practice, the test took about 30-40 minutes, but this varied widely
7
between different learners, who were as far as possible free to take as long as they
wanted.
Before Phase 1 began, the assessment instrument was trialled in three classes and
two questions were changed or amended in order to improve comprehensibility and
readability. During Phase 1, researchers noted that one further question caused
confusion and this was modified for Phase 2 to make its purpose clearer.
Test items were all multiple-choice. This had the advantage that the assessments
were easy to grade but the disadvantage that learners had a 25% chance of getting
the right answer by chance. Questions were weighted at different levels: Entry level
1 questions (1 mark); Entry level 2 (2 marks); up to Level 2 questions (5 marks).
The maximum total achievable from the 20 questions was therefore 60 marks.
Because our sample involved a significant proportion of ESOL learners and
learners with reading difficulties, we selected items with pictures and diagrams and
only simple text wherever possible, and presented each question on a single page.
An example of an Entry level 2 question is shown below (see Figure 1).
Figure 1 goes about here
All items were situated in ‘real life’ contexts, with an emphasis on shopping and
money calculations. While we recognised that such questions become removed
8
from real life situations as soon as they are translated onto paper, we thought this
was preferable to giving learners sums out of context.
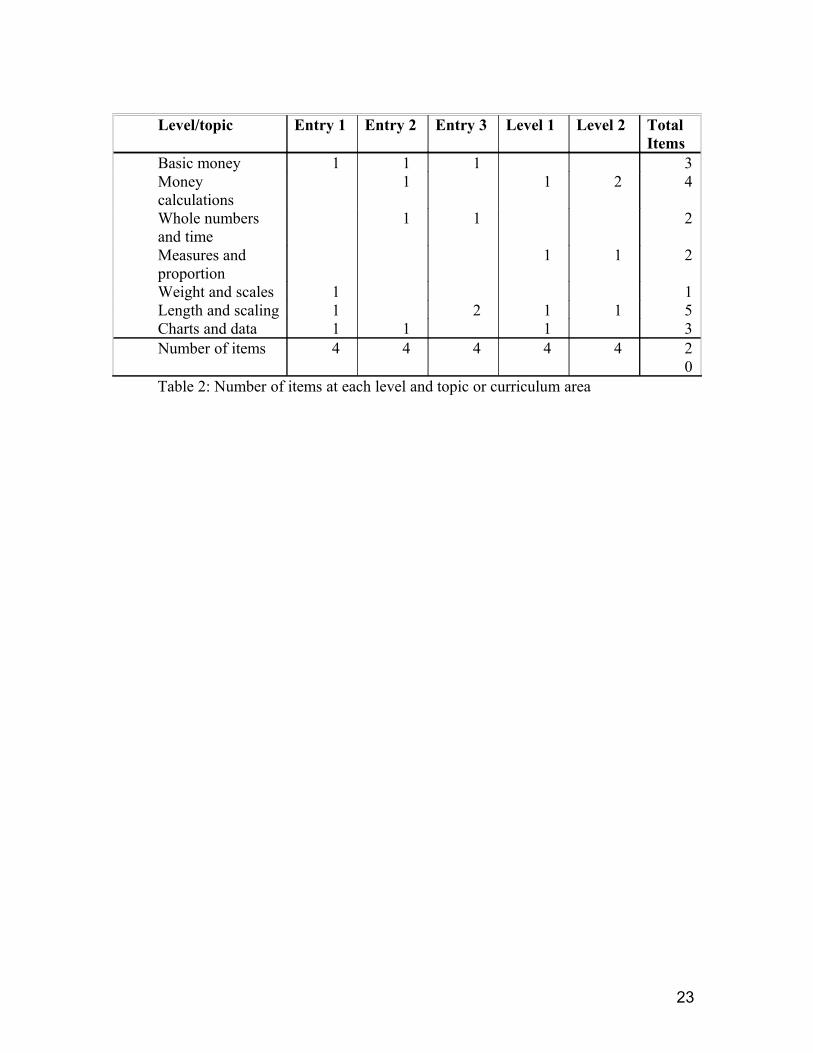
Table 2 below shows the number of items at each level and curriculum area.
Table 2 goes about here
The assessment instrument was aimed at learners who were said by their teachers to
be working between Entry level 1 and Level 2 (equivalent to GCSE grades A*-C).
In Phase 1, we used three colour-coded booklets: one contained all 20 questions
(white); another had 12 Entry Level questions (blue); and another contained 8
Level 1 and 2 questions (green). This was because we thought that learners might
be put off by questions at a higher or lower level than their own. Questions were
arranged in ascending order of difficulty for 5 questions and then reverted to the
beginning of the cycle. Learners were told that if they reached some difficult
questions an easier one would follow. Following discussions with teachers, we
offered some learners the Entry level booklet first with the option to continue to the
Level 1 and 2 questions. In the event, most learners in Phase 1 completed the longer
(white) booklet and some who succeeded with the Entry level booklet chose not to
attempt the Level 1 and 2 booklet. As a result, we decided to use only the longer
booklet in Phase 2 in order to maximise the number of learners attempting all
questions, but to print the harder questions on green paper. The instrument was
administered within one teaching session and, in keeping with the terms of our
9
HMSO licence, was not shown to the teachers, thereby avoiding the possibility of
teachers prejudicing the results by ‘teaching to the test’.
Another important decision concerned how often learners should be assessed. In the
NRDC ‘effective practice’ project on reading, researchers decided to assess learners
at three points during the course, using two versions of the assessment instrument.
However, the Skills for Life survey instrument did not yield enough items for two
versions of the numeracy test, so we decided to test towards the beginning and end
of each course, using the same 20 questions at both T1 and T2, with a minimum of
30 hours teaching between the two points. We thought learners might lose interest
or become too familiar with the questions if they did the test more than twice. We
decided to utilise the time and resources freed up by dropping the mid-course
assessment to interview the teachers and learners.
To summarise: the remit of the research and the research questions meant that the
assessment instrument needed to fulfil certain criteria which imposed constraints on
both its design and administration. The instrument had to:
1. Assess learners’ progress in numeracy over the range from Entry level 1 to
Level 2;
2. Include only items which had been trialled successfully with a comparable
sample;
10
3. Ensure a balance of curriculum areas was assessed;
4. Contain items that referred to ‘real life’ situations;
5. Be appropriate in a number of contexts with a wide range of learners;
6. Be administered simultaneously to groups of learners;
7. Be used with ESOL learners and learners who experienced difficulties in
reading;
8. Be sensitive to learning and able to measure learners’ progress on a small
timescale;
9. Be administered quickly and efficiently, within one session, without taking too
much time away from teaching.
Findings: gains in numeracy attainment measured between two time points
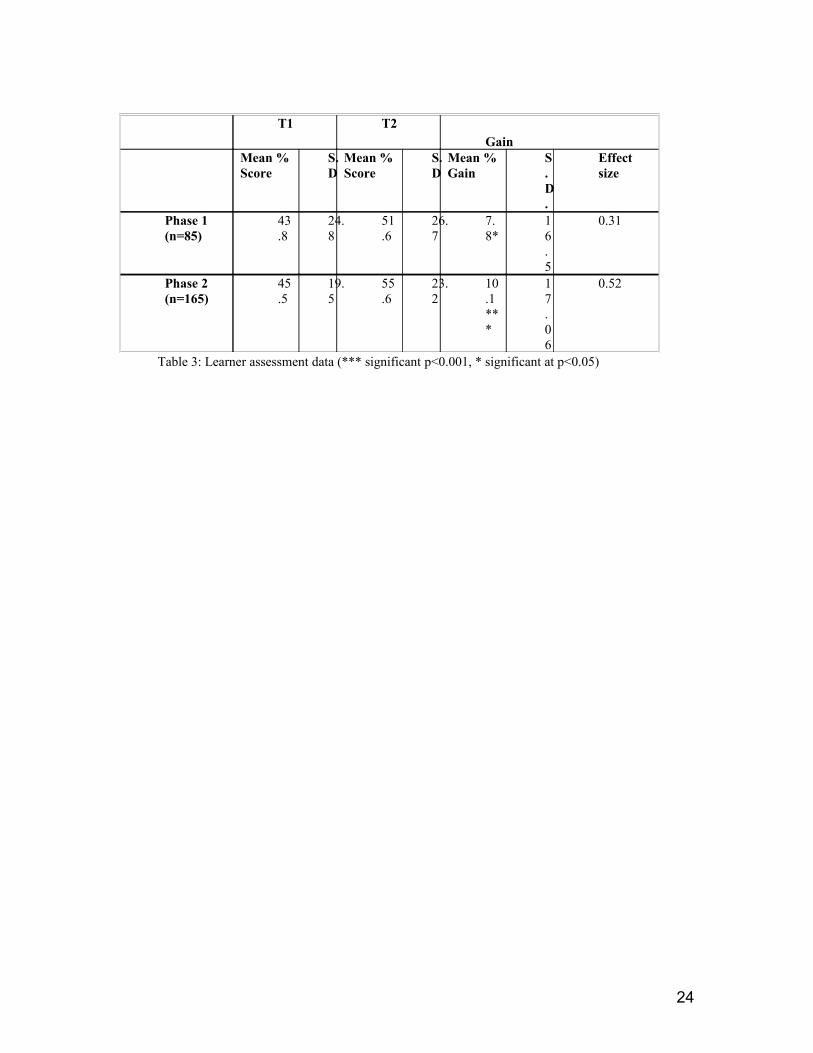
The mean percentage scores and standard deviations on the test for the 250 learners
who completed the assessment tests at both time periods (T1 and T2) are presented
in Table 3 below.
11
Table 3 goes about here
Phase 1 gains are less than those for Phase 2, presumably because learners were
well into their Phase 1 courses and had made early gains before the first assessment
was given. The mean gains are statistically significant with reasonably high effect
sizes, and are equivalent to an average learner being able to correctly answer about
2 additional questions in the final administration of the test, in which there were 4
questions at each of the 5 levels.
Differential gains for different levels and areas of mathematics
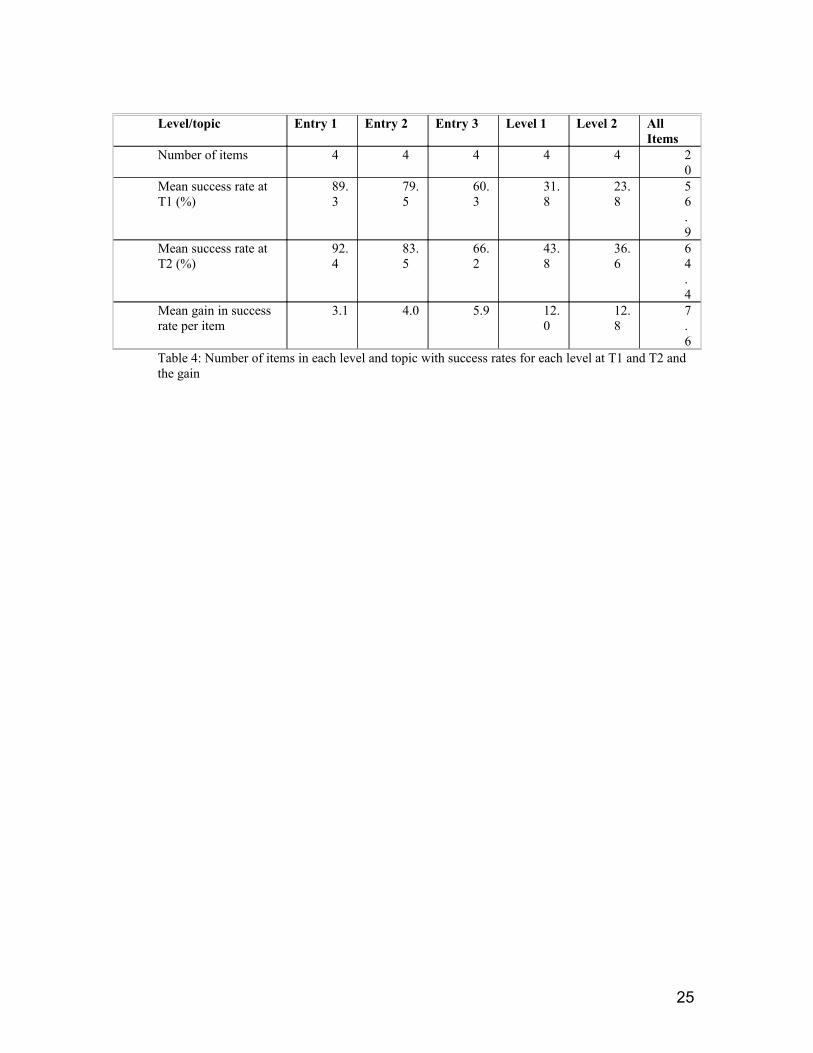
Table 4 shows the distribution of the items within the assessment in terms of the
levels covered (using Skills for Life classifications). It also shows the initial success
rate of learners at T1 for the items in each level and their progress at T2. Although
gains were generally smaller for Phase 1, the trends were similar for both groups,
so the data from both phases has been combined in Table 4 to increase the sample
size. The overall mean gain per item was 7.6%, indicating that on an average item
nearly 8% more learners were successful at the end than at the start.
Table 4 goes about here
A significant negative correlation was found between the easiness of the question,
as measured by the proportion answering it correctly at T1, and the gain between
12
T1 and T2 in the number of people answering the question correctly. As the success
rate of the question decreased, so gains increased (n=20, rho= - 0.87). One reason
for small gains in the Entry level 1 and 2 items is the high proportion of learners
that answered them correctly at T1, so there was little room for progress in these
items. The other reason for the higher gains in Levels 1 and 2 items is that 18
groups were aiming at Levels 1 and/or 2, and just 10 were aiming only at Entry or
Pre-Entry levels (the remaining 17 were mixed). Moreover, Entry level classes
generally contained fewer learners. Once level is controlled for, there were no clear
differences in gain between the different mathematical topics.
We went on to investigate whether the learners with higher test scores in the first
assessment made greater progress. However, this was not the case, as indicated by a
weakly negative correlation between learner gains and their test score at T1 (n=250,
rho= - 0.15). This suggests that the test design allowed learners from a range of
initial attainment levels to make progress, rather than favouring those with either
initially high or low attainment. In view of the earlier finding that the harder items
rise most, gains made by learners with lower scores must be mainly on the harder
items.
Further issues for reflection and some recommendations
As we noted earlier in this article, the heterogeneous nature of adult numeracy
education makes it difficult to produce a research instrument capable of
13
encompassing the diversity of the sector in a valid and reliable way. While we were
able to exert some control over some areas of the design of the assessment
instrument, other factors, such as the overall ‘effective practice’ projects’ research
remit and research questions, were outside our control.
The need for practicability was paramount. There was a trade-off between
gathering sufficient information and taking up the learners’ time in class. As noted
above, we struggled to find enough previously trialled questions to fulfil our criteria
of reliability and in the end could only include 20 questions in one test. Although
this might have been insufficiently sensitive to detect changes in learners’ level of
attainment, we felt we could not take up more than 40 minutes of their class-time.
The fact that we used the same version of the text on both occasions also might
have introduced a ‘testing effect’. However, while learners were more familiar with
the form of the test on the second occasion, we feel that the two administrations
were sufficiently far apart in time (usually 7 or 8 months) to mitigate this effect.
The short teaching time of only 39 hours between pre- and post-testing (T1 and T2)
was also problematic but beyond our control.
We also could not “encompass the range of assessment forms being used in other
educational settings and […] include oral reports, group activities, portfolios, and
so forth”. While we were aware that “adult learners may perform at quite different
14
levels in oral mathematical discussions than on written tasks” (Cumming & Gal,
2000:328-329), for reasons of practicality and consistency we used a written test.
When mathematical questions are presented in a written form, poor readers, or
those with a weak grasp of English, are likely to be disadvantaged. The attempt to
set questions in a ‘real life’ context meant that some words were, potentially,
difficult; they include, for example, ‘bracket’, ‘dispensary’ and ‘pharmacy’. Two in
every five learners in the sample spoke English as an additional language, and
about 7% of the sample reported that they had dyslexia. Some of the greatest gains
in attainment in the study came from ESOL classes, perhaps because these learners’
language skills also improved between the two tests. For a few learners who could
barely understand the questions even when read out by researchers, another learner
was able to translate the questions into his or her own language. Where this
happened, researchers did not know whether learners were merely translating the
questions, or whether they were interpreting the question or providing their fellow
learner with the answer.
Other problems became apparent during the administration and marking of the test.
The multiple-choice format was relatively insensitive to changes in learners’
understanding. It also meant that while some learners may have guessed answers
and attempted every question, others did not. As the questions were weighted (from
1 at Entry 1 up to 5 at Level 2) a learner would have a one-in-four chance of getting
a question right by guesswork, or 5 questions correct out of the 20. Scores were
15
reduced if learners decided not to attempt more difficult sections of the test (the
green booklet in Phase 1 or the green pages in Phase 2).
Another limitation of our chosen assessment instrument – perhaps any numeracy
assessment instrument – is also pertinent here: the areas of mathematics taught in
class may not have matched those covered in the assessment. We therefore cannot
be certain that newly correct answers at T2 result from class teaching rather than
other sources of learning.
Three other factors affected both the reliability and the validity of the test: the
changing population of learners, learner attrition and learners’ motivations. Some
courses were designed on a roll-on/roll-off basis which meant that some learners
who had taken the first test were no longer there at T2, and new learners may have
arrived who had not taken the test at T1 and were therefore ineligible for T2. About
40% of learners left their course for a variety of reasons, and the effect of this was
compounded when researchers came to administer the second assessment if the
class was poorly attended on that particular day. One case serves as an example: 15
well-motivated learners took the test at T1; however, when the researcher
administered the test at T2, only 4 of them were present, including two who now
appeared to lack motivation.
We concluded that learners’ motivation, self-discipline, aspirations, abilities and
dispositions towards numeracy, socio-cultural background and previous
16
experiences both inside and outside the classroom, may have as much, or more
influence on their learning than any specific difference in teacher behaviour.
Learners’ motivation in completing the assessment test obviously affected the
results. In some cases the second administration was given too close to learners’
end-of-course assessments which may have meant that the learners did not take the
test very seriously, as they wanted to get on with their revision. The tests were not
high-stakes since they did not count towards a qualification. Despite this,
researchers generally reported that learners were generally conscientious and
diligent during the instrument’s administration.
Recommendations
An assessment instrument needs to be designed which is more sensitive to small
changes in learners’ progress. The problem is that to be kept within tight time limits
appropriate for such short courses the testing would need to be adaptive unless it is
only expected to be valid within a narrow range of attainment. The latter might not
be satisfactory as we found prior classifications by teachers or institutions to be
unreliable.
We have already pointed out the problem of not being able to match the assessment
questions to the curriculum taught between T1 and T2. If a bank of secure, reliable
and valid questions – possibly based on the National Tests for numeracy – were
available, it might be possible to link the test more closely to individual teaching
17
programmes, and therefore have a more genuine test of learning in relation to
teaching. This may be particularly important in mathematics teaching because,
unlike other curriculum areas such as literacy (particularly reading), it is less likely
that mathematics is learned outside the classroom.
Conclusions
This paper has examined issues involved in adapting and administering an
assessment instrument to measure adult learners’ progress in numeracy classes. It
has found that the lack of a range of suitable instruments, the heterogeneous nature
of adult numeracy teaching, the remit and requirements of the research project and
other practical factors, made it very difficult to produce an instrument capable of
measuring learners’ progress accurately, and hence to produce robust and reliable
conclusions, generalisable across the whole sector.
As a result the degree of sensitivity and accuracy achieved in measuring gains in
learning is less than ideal. Having said this, and despite all the problems we faced,
we still believe that the test has a sufficient degree of validity for the purposes of
the study. For instance, when we showed teachers a graph of learners’ results they
were usually able to identify their learners by their scores.
We hope that other researchers may learn from some the problems that we
experienced during the research process. This paper should also make researchers,
18
practitioners, managers and policy makers cautious of accepting results of brief
surveys (see, for example, the Skills for Life Survey, 2003 and the larger surveys,
the British Cohort Study, 1970 (BCS70) and the International Adult Literacy
Survey, 1996, (IALS)) that claim to measure the wider population’s understanding
of numeracy.
4471 words
19
References
Bathmaker, A-M. (2005) Achieving the Skills for Life adult basic skills targets in England:
What picture can we gain from available statistical data and what issues does this
raise? Paper presented at the British Educational Research Association Conference
at the University of Glamorgan, Wales, 15-17 September 2005.
Brooks, G., Heath, K., Pollard, A., & Rees, F. (2003). Review of Assessment Instruments.
London: National Research and Development Centre for Adult Literacy and
Numeracy.
Carraher, T. N., Carraher, D. W., & Schliemann, A. D. (1985). Mathematics in the streets
and in schools. British Journal of Developmental Psychology, 3, 21-29.
Coben, D., Colwell, D., Macrae, S., Boaler, J., Brown, M., & Rhodes, V. (2003). Adult
Numeracy: Review of research and related literature. London: National Research
and Development Centre for Adult Literacy and Numeracy (NRDC).
Crossan, B., Field, J., Gallacher, J., & Merrill, B. (2003). Understanding participation in
learning for non-traditional adult learners: Learning careers and the construction of
learning identities. British Journal of Sociology of Education, 24(1), 55-67.
DfES. (2003a). Skills for Life. The national strategy for improving literacy and numeracy
skills - Focus on delivery to 2007. London: Department for Education and Skills.
DfES. (2003b). The Skills for Life Survey: A national needs and impact survey of literacy,
numeracy and ICT skills (Research Report No. RR490). London: Department for
Education and Skills.
DfES/DWP/HMT. (2005). Skills: Getting On in Business, Getting On at Work (White
Paper No. Cm 6483-I; Cm 6483-II; Cm 6483-III). Norwich: The Stationery Office.
Dowling, P. (1991). The contextualizing of mathematics: Towards a theoretical map. In M.
Harris (Ed.), Schools, Mathematics and Work (pp. 93-120). Basingstoke: Falmer
Press.
Lave, J. (1988). Cognition in Practice: Mind, mathematics and culture in everyday life.
Cambridge: Cambridge University Press.
Parsons, S., Bynner, J., & Foudouli, V. (2005). Measuring Basic Skills for Longitudinal
Study. The design and development of instruments for use with cohort members in
20
the age 34 follow-up in the 1970 British Cohort Study (BCS70). London: National
Research and Development Centre for Adult Literacy and Numeracy (NRDC).
Winter, R. (1992). Mathophobia, Pythagoras and roller-skating. In M. Nickson & S.
Lerman (Eds.), The Social Context of Mathematics Education: Theory and
practice, Proceedings of the Group for Research into Social Perspectives of
Mathematics Education (pp. 81-93). London: South Bank Press.
21
Phase 1 Phase 2 Total with Number
of:
Time 1 Time 2 Time 1 Time 2 complete
data Classes
involved
17 15 30 30 45
(=15+30)Assessme
nts
completed
13
1
85 284 165 250
(=85+165)
Table 1: Summary of assessment data collected from 47 numeracy classes 2004 –
05.
22
Level/topic Entry 1 Entry 2 Entry 3 Level 1 Level 2 Total Items
Basic money 1 1 1 3Money calculations
1 1 2 4
Whole numbers and time
1 1 2
Measures and proportion
1 1 2
Weight and scales 1 1Length and scaling 1 2 1 1 5Charts and data 1 1 1 3Number of items 4 4 4 4 4 2
0Table 2: Number of items at each level and topic or curriculum area
23
T1 T2 Gain
Mean % Score
S.D
Mean % Score
S.D
Mean %Gain
S. D.
Effect size
Phase 1 (n=85)
43.8
24.8
51.6
26.7
7.8*
16.5
0.31
Phase 2 (n=165)
45.5
19.5
55.6
23.2
10.1***
17.06
0.52
Table 3: Learner assessment data (*** significant p<0.001, * significant at p<0.05)
24
Level/topic Entry 1 Entry 2 Entry 3 Level 1 Level 2 All Items
Number of items 4 4 4 4 4 20
Mean success rate at T1 (%)
89.3
79.5
60.3
31.8
23.8
56.9
Mean success rate at T2 (%)
92.4
83.5
66.2
43.8
36.6
64.4
Mean gain in success rate per item
3.1 4.0 5.9 12.0
12.8
7.6
Table 4: Number of items in each level and topic with success rates for each level at T1 and T2 and the gain
25
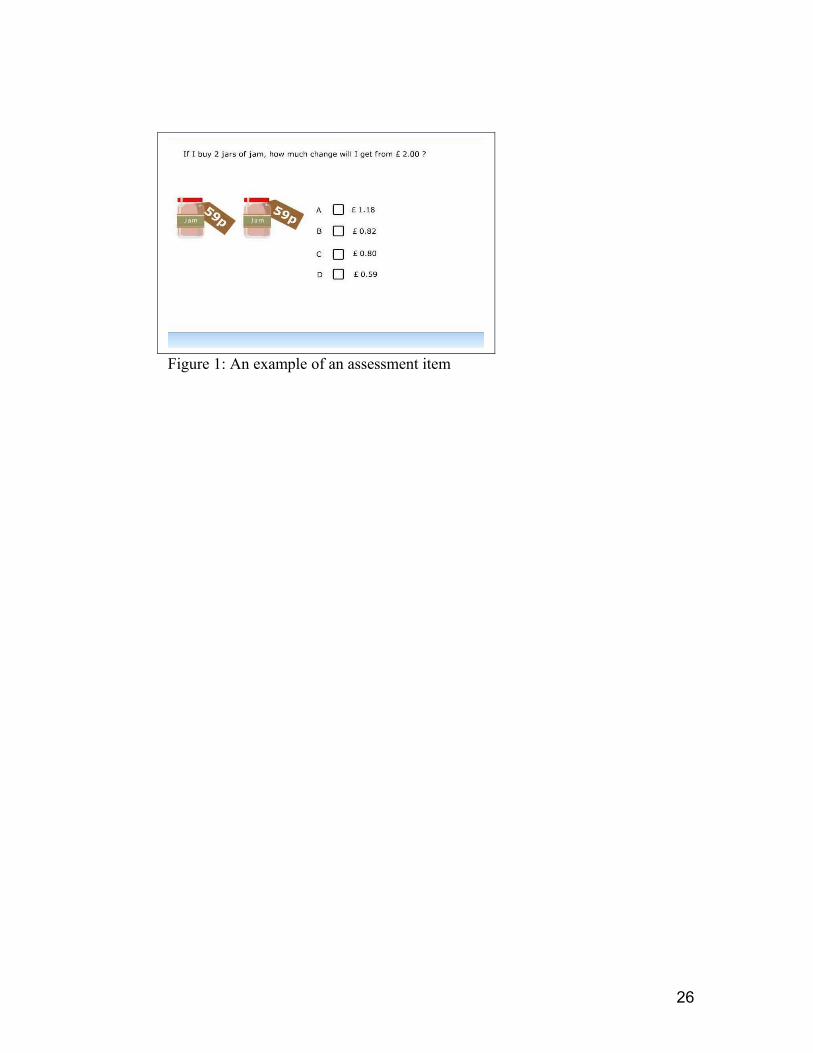
Figure 1: An example of an assessment item
26
Top Related