


Languages
Pages
Legal


Iron Ore Composition Monitoring Using an Automated On-Line X-Ray Spectrometer Analyzer
Iron Ore Composition Monitoring Using anAutomated On-Line X-Ray Spectrometer Analyzer
Sidney A. A. Viana, Allan S. Souza, Wallace C. Araujo, Rilei V. Ribeiro
VALE
Stefan W. Brauer, Ronald Polski, Gerhard Pflug
APC Analytics GmbH

Iron Ore Composition Monitoring Using an Automated On-Line X-Ray Spectrometer Analyzer
Summary
● Quality Control in Mining Plants
● What is SOLAS?
● Plant Installation
● Principle of Operation
● Off-Line & On-Line Calibration
● Practical Results
● Advantadges and Limitations

Iron Ore Composition Monitoring Using an Automated On-Line X-Ray Spectrometer Analyzer
Quality Control in Mining Plants
● Well stabilished standards and procedures.
● Time-consuming tasks for samples extraction, preparation and analysis.
● Necessity for faster - and yet reliable - analysis.
● Improvements from advances in analysis technology and equipments (e.g.: on-line spectrometers for chemical; on-line laser difractometers for size distribution).
● Automated quality control.
Iron Ore Composition Monitoring Using an Automated On-Line X-Ray Spectrometer Analyzer
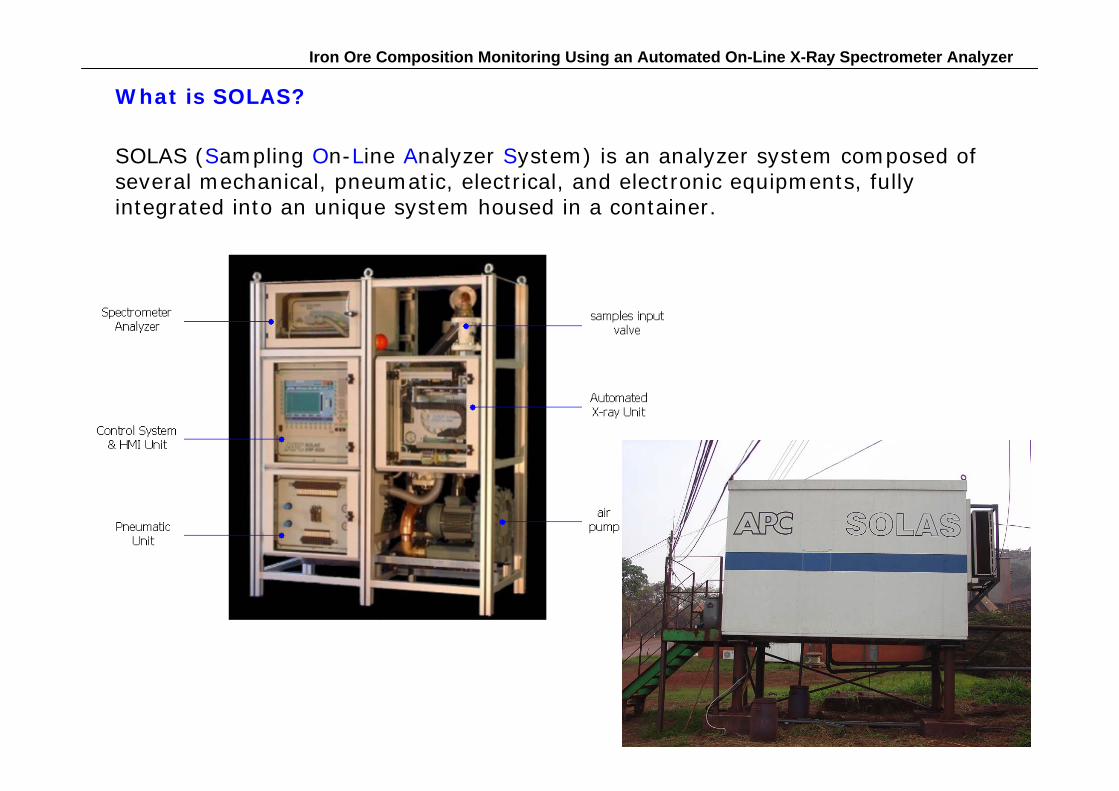
SOLAS (Sampling On-Line Analyzer System) is an analyzer system composed of several mechanical, pneumatic, electrical, and electronic equipments, fully integrated into an unique system housed in a container.
What is SOLAS?

Iron Ore Composition Monitoring Using an Automated On-Line X-Ray Spectrometer Analyzer
What is SOLAS?
Sampled material handling system

Iron Ore Composition Monitoring Using an Automated On-Line X-Ray Spectrometer Analyzer
Plant Installation

Iron Ore Composition Monitoring Using an Automated On-Line X-Ray Spectrometer Analyzer
Operation Principle:
What is SOLAS?

Iron Ore Composition Monitoring Using an Automated On-Line X-Ray Spectrometer Analyzer
• SOLAS is the combination of pneumatic sampling, pneumatic transport, pneumatical milling and EDXRF analysis, all integrated by a specifc controlunit.
• First step is Airmill for rapid grinding of the sample material < 200 µm
What is SOLAS?

Iron Ore Composition Monitoring Using an Automated On-Line X-Ray Spectrometer Analyzer

Iron Ore Composition Monitoring Using an Automated On-Line X-Ray Spectrometer Analyzer
Sample
X-RayTube
Detector
X-Ray Analysis
∆E 6,40 [keV]
1,74 [keV]
1,49[keV]
FeSiAl
Problems of x-ray analysis:• Absorption of x-rays in ambient
air• Sensitivity only on surface / grain
size effectsSolutions:• Helium Flushing• Fine grinding

Iron Ore Composition Monitoring Using an Automated On-Line X-Ray Spectrometer Analyzer
0
2000
4000
6000
8000
10000
12000
0 1 2 3 4 5 6 7 8
Energie [keV]
Impu
lse
Al
Si
SRh
K
Ca
Ti
Fe
Peak Areaproportionalto concentration
Helium flushingamplified peaksAl + Si
X-Ray spectrum of lignite

Iron Ore Composition Monitoring Using an Automated On-Line X-Ray Spectrometer Analyzer
Calibration
Example of spectrum provided by SOLAS for iron ore:

Iron Ore Composition Monitoring Using an Automated On-Line X-Ray Spectrometer Analyzer
Calibration
● Off-Line Calibration
A set of samples is divided in two parts: one to be analysed in Laboratory, and the other to be analysed by SOLAS.
Chemicals of interest: Fe, Mn, Si, P, Al, and Ti.

Iron Ore Composition Monitoring Using an Automated On-Line X-Ray Spectrometer Analyzer
Iron (Fe)
60,0
61,0
62,0
63,0
64,0
65,0
66,0
67,0
68,0
69,0
70,0
0 1 2 3 4 5 6 7 8 9 10 11
Sample
Con
cent
rati
on R
esul
ts (
%)
Laboratory SOLAS Manganese (Mn)
0,0
0,5
1,0
1,5
2,0
2,5
3,0
3,5
4,0
0 1 2 3 4 5 6 7 8 9 10 11
SampleC
once
ntra
tion
Res
ults
(%
)
Laboratory SOLAS Silicium (Si)
0,0
0,2
0,4
0,6
0,8
1,0
1,2
1,4
0 1 2 3 4 5 6 7 8 9 10 11
Sample
Con
cent
rati
on R
esul
ts (
%)
Laboratory SOLAS
Phosphor (P)
0,00
0,01
0,02
0,03
0,04
0,05
0,06
0,07
0,08
0 1 2 3 4 5 6 7 8 9 10 11
Sample
Con
cent
rati
on R
esul
ts (
%)
Laboratory SOLAS Aluminium (Al)
0,0
0,2
0,4
0,6
0,8
1,0
1,2
1,4
1,6
1,8
2,0
0 1 2 3 4 5 6 7 8 9 10 11
Sample
Con
cent
rati
on R
esul
ts (
%)
Laboratory SOLAS Titanium (Ti)
0,00
0,02
0,04
0,06
0,08
0,10
0,12
0,14
0,16
0 1 2 3 4 5 6 7 8 9 10 11
Sample
Con
cent
rati
on R
esul
ts (
%)
Laboratory SOLAS
Calibration
Off-Line Calibration Results (Laboratory x SOLAS)
Fe Mn Si
P Al Ti

Iron Ore Composition Monitoring Using an Automated On-Line X-Ray Spectrometer Analyzer
Iron (Fe)
60,0
61,0
62,0
63,0
64,0
65,0
66,0
67,0
68,0
69,0
70,0
0 1 2 3 4 5 6 7 8 9 10 11 12 13
Sample
Con
cent
rati
on R
esul
ts (
%)
Laboratory SOLAS Manganese (Mn)
0,0
0,2
0,4
0,6
0,8
1,0
1,2
1,4
1,6
1,8
0 1 2 3 4 5 6 7 8 9 10 11 12 13
SampleC
once
ntra
tion
Res
ults
(%
)
Laboratory SOLAS Silicium (Si)
0,0
0,5
1,0
1,5
2,0
2,5
3,0
0 1 2 3 4 5 6 7 8 9 10 11 12 13
Sample
Con
cent
rati
on R
esul
ts (
%)
Laboratory SOLAS
Phosphor (P)
0,00
0,01
0,02
0,03
0,04
0,05
0,06
0,07
0,08
0,09
0,10
0 1 2 3 4 5 6 7 8 9 10 11 12 13
Sample
Con
cent
rati
on R
esul
ts (
%)
Laboratory SOLAS Aluminium (Al)
0,0
0,2
0,4
0,6
0,8
1,0
1,2
1,4
1,6
1,8
2,0
0 1 2 3 4 5 6 7 8 9 10 11 12 13
Sample
Con
cent
rati
on R
esul
ts (
%)
Laboratory SOLAS Titanium (Ti)
0,00
0,02
0,04
0,06
0,08
0,10
0,12
0,14
0,16
0 1 2 3 4 5 6 7 8 9 10 11 12 13
Sample
Con
cent
rati
on R
esul
ts (
%)
Laboratory SOLAS
Fe Mn Si
P Al Ti
Calibration
On-Line Calibration Results (SOLAS x Plant Laboratory)
Iron Ore Composition Monitoring Using an Automated On-Line X-Ray Spectrometer Analyzer
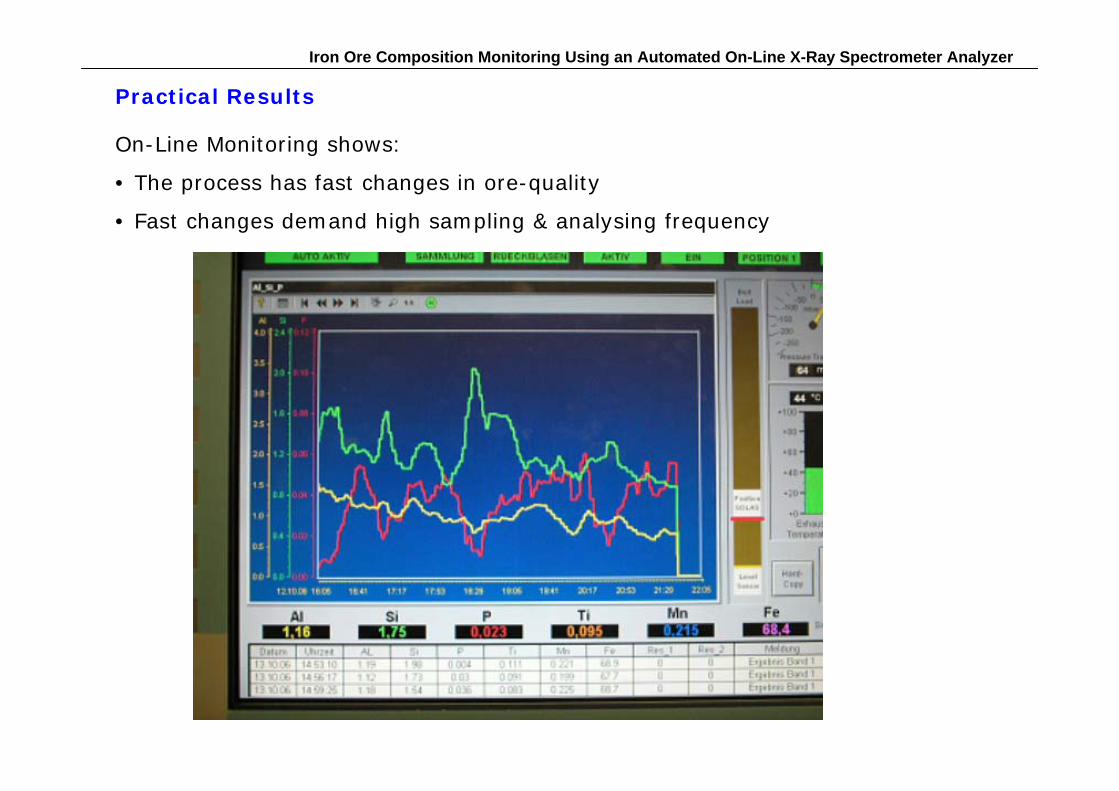
Practical Results
On-Line Monitoring shows:
• The process has fast changes in ore-quality
• Fast changes demand high sampling & analysing frequency
Iron Ore Composition Monitoring Using an Automated On-Line X-Ray Spectrometer Analyzer
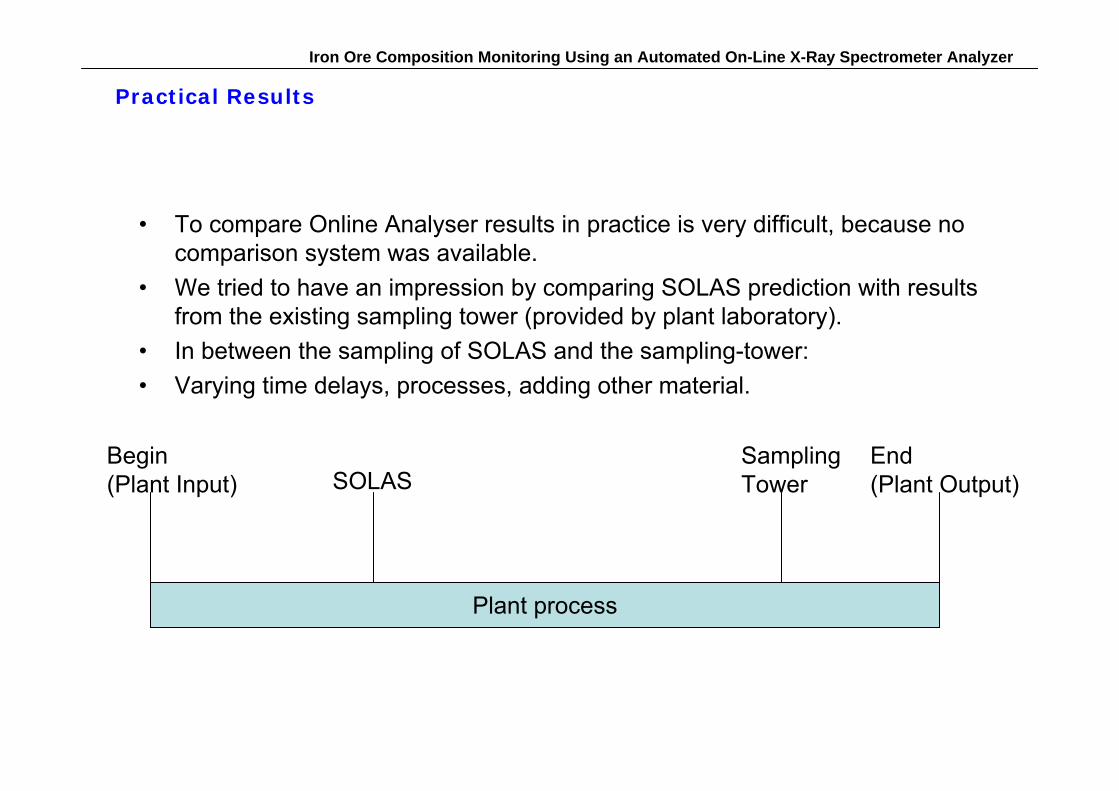
• To compare Online Analyser results in practice is very difficult, because no comparison system was available.
• We tried to have an impression by comparing SOLAS prediction with resultsfrom the existing sampling tower (provided by plant laboratory).
• In between the sampling of SOLAS and the sampling-tower:• Varying time delays, processes, adding other material.
Practical Results
Begin(Plant Input)
Plant process
SOLASSamplingTower
End(Plant Output)

Iron Ore Composition Monitoring Using an Automated On-Line X-Ray Spectrometer Analyzer
Manganese (Mn)
0,0
0,2
0,4
0,6
0,8
1,0
1,2
1,4
1,6
1,8
0 10 20 30 40 50 60
Sample
Con
cent
rati
on (
%)
Laboratory (averaged) SOLAS
Silicium (Si)
0,0
0,5
1,0
1,5
2,0
2,5
3,0
0 10 20 30 40 50 60
Sample
Con
cent
rati
on (
%)
Laboratory (averaged) SOLAS Phosphor (P)
0,00
0,01
0,02
0,03
0,04
0,05
0,06
0,07
0,08
0,09
0,10
0 10 20 30 40 50 60
Sample
Con
cent
rati
on (
%)
Laboratory (averaged) SOLAS
Practical Results
Plant Sampling Tower x SOLAS
Iron (Fe)
0,0
10,0
20,0
30,0
40,0
50,0
60,0
70,0
0 10 20 30 40 50 60
Sample
Con
cent
rati
on (
%)
Laboratory Predicted using SOLAS
Iron Ore Composition Monitoring Using an Automated On-Line X-Ray Spectrometer Analyzer
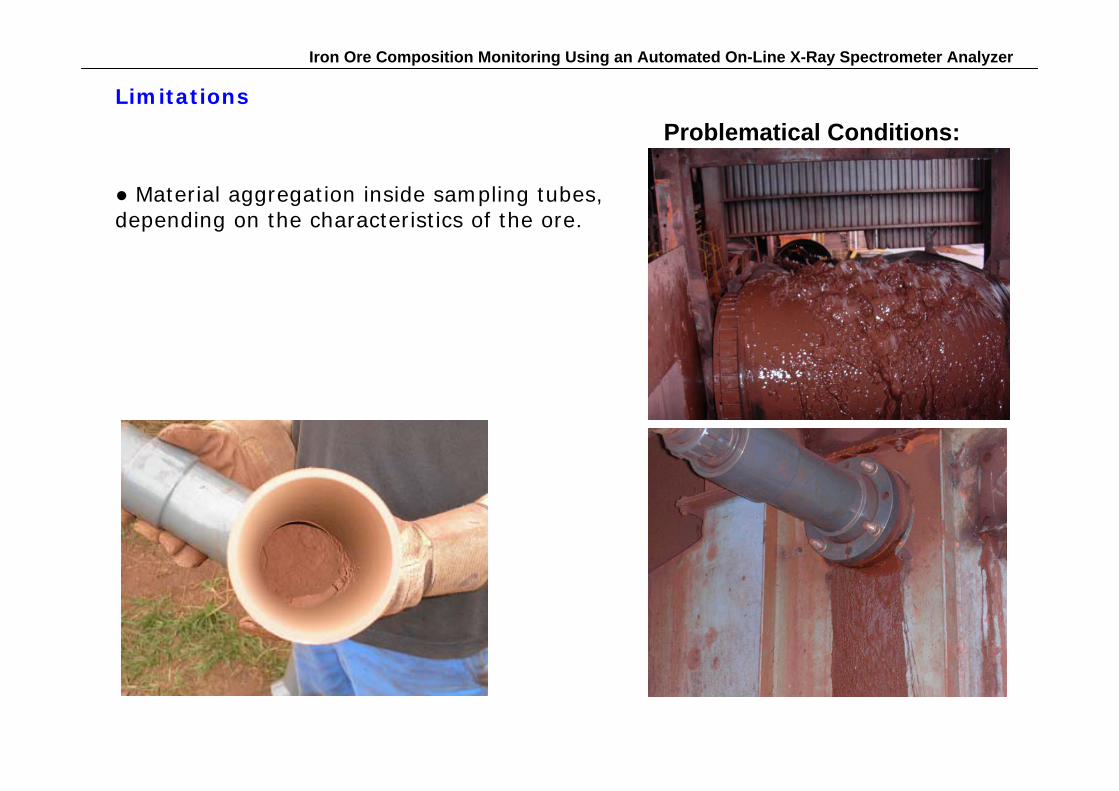
Limitations
● Material aggregation inside sampling tubes, depending on the characteristics of the ore.
Problematical Conditions:

Iron Ore Composition Monitoring Using an Automated On-Line X-Ray Spectrometer Analyzer
Advantadges
● No problems regarding sampling and handling the sample material in normal dry conditions. ● Accurate on-line analysis results.● Remote monitoring from the Control Room.● Provide support for fast decision-making
Normal Conditions:
Iron Ore Composition Monitoring Using an Automated On-Line X-Ray Spectrometer Analyzer
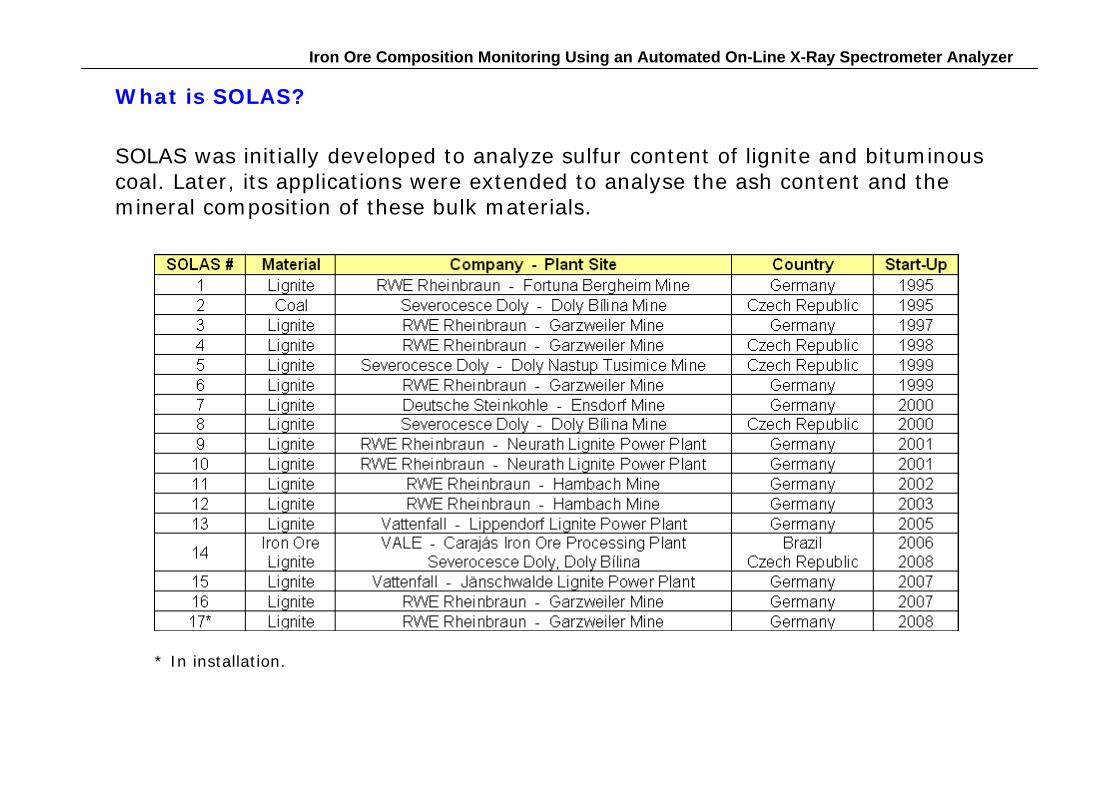
SOLAS was initially developed to analyze sulfur content of lignite and bituminous coal. Later, its applications were extended to analyse the ash content and the mineral composition of these bulk materials.
* In installation.
What is SOLAS?

Iron Ore Composition Monitoring Using an Automated On-Line X-Ray Spectrometer Analyzer
Thank you.
Top Related