Languages
Pages
Legal


Q3 2019
1
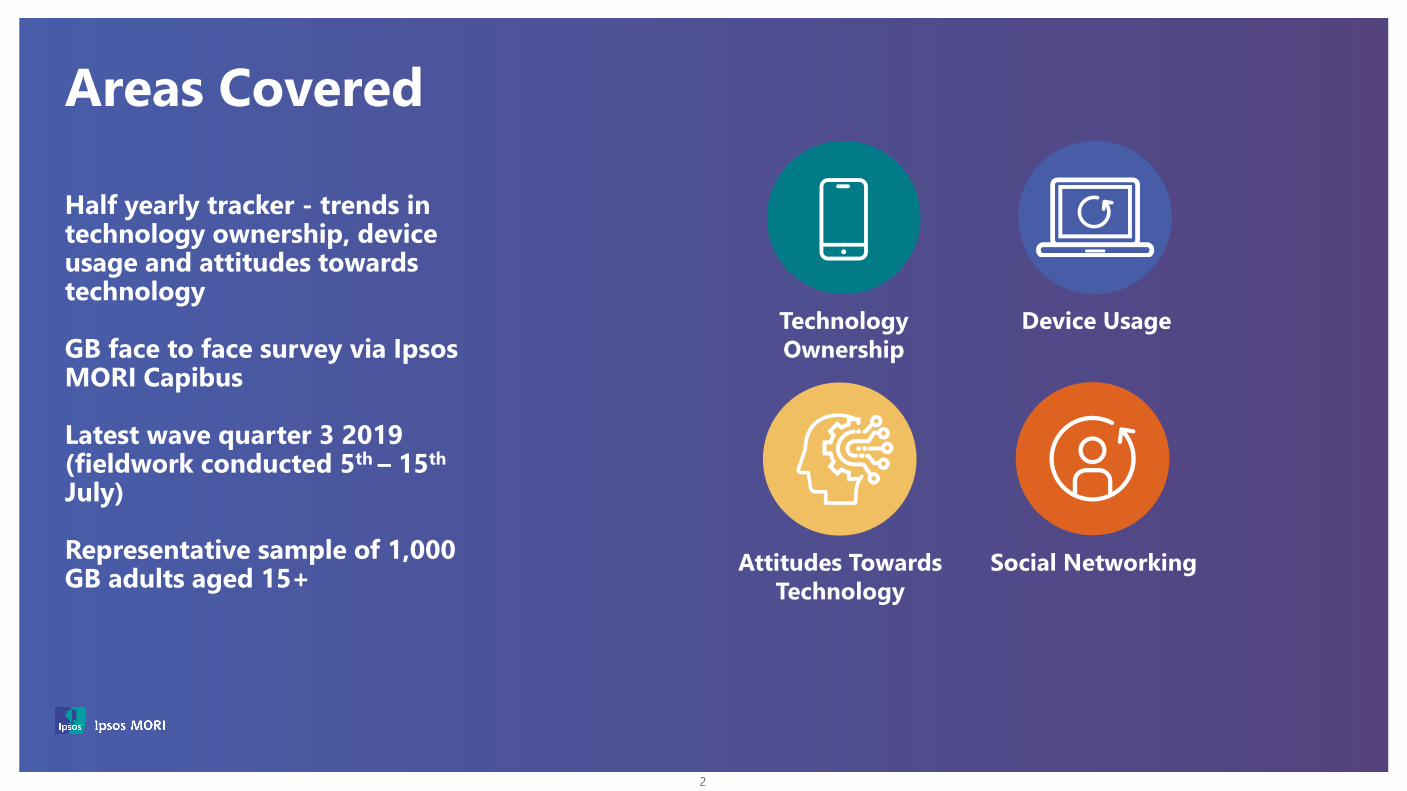
Areas Covered
Half yearly tracker - trends in technology ownership, device usage and attitudes towards technology
GB face to face survey via Ipsos MORI Capibus
Latest wave quarter 3 2019 (fieldwork conducted 5th – 15th
July)
Representative sample of 1,000 GB adults aged 15+ Social Networking
Device UsageTechnologyOwnership
Attitudes Towards Technology
2

SummaryThis quarter’s Tech Tracker shows us for the first time the awareness of emerging technologies such as driverless cars, artificial intelligence and foldable smartphones amongst the British public.
Data shows us that emerging technology providers must improve knowledge of their products to increase uptake. As an example, VR devices are owned by just 7% of the GB population, but this number goes up to 24% ownership when it comes to people who already have a good level of awareness about them.
As awareness of a technology's benefits increases, so to does concern over its negatives. Our participants have shown they have strong opinions when it comes to concerns over their online privacy or their happiness in sharing their information online.
We have identified a group with the highest affinity towards new technology that we have termed Tech Trendsetters. This attitudinally different group are significantly more likely to own and be aware of emerging tech compared to the general population.
When it comes to online activities, smartphones have been cemented as the most popular device for functional activities, but it shares this crown with other devices when it comes to consumption of video and music on demand services. GB adults are using a wide variety of devices to consume the content they want, anytime, anywhere.
We hope you enjoy the tech highlights we have provided in this report and we look forward to updating you again in the New Year!
3

Technology Ownership
4

79%
66%
55%
33%29% 29%
21%17% 17% 14% 14%
Smartphone Laptop Tablet Games Console(any)
Desktop Smart HomeDevices
Ebook Reader NonSmartphone
Fitness Tracker Smart Watch Voice ActivatedSpeaker
Smartphones are the most owned devices with 4 in 5 GB
Ownership of Technology
Base: 1,000 GB adults aged 15+ Q3 2019
adults owning one
5
Q01. Which, if any, of the following do you own?

79%
66%
55%
37%33%
29% 29% 27%
21%17% 17%
14% 14%
89%
67%
48%
37%
52%
23%28% 27%
14%9%
16% 15%11%
89%
73%69%
45%41%
31% 32%27% 27%
14%
26%23% 22%
61%58%
49%
29%
10%
31%27% 27%
21%
27%
10%6%
9%
Smartphone Laptop Tablet 4K/Smart TV GamesConsole (any)
Desktop Smart HomeDevices
TV (Non4K/Smart)
Ebook Reader NonSmartphone
FitnessTracker
Smart Watch VoiceActivatedSpeaker
Those aged 35-54 are significantly more likely to own niche devices such as Voice Activated Speakers or Fitness Trackers
Base: 1,000 GB adults aged 15+ Q3 201915-34 n=299, 35-54 n=269, 55+ n=402
Significantly higher / lower @ 95% confidence level vs. every other age group
15-34
GB Adults
55+
35-54
Source: Ipsos MORI
Q01. Which, if any, of the following do you own?
Ownership of Technology
6

;
8K
Drones Driverless Cars 5G Mobile Internet
Artificial Intelligence
Virtual Reality
Wearable Technology*
Crypto Currency
Foldable Smartphones
Augmented Reality
8K TVs
77%
GB Adults
78%81%84%
75% 71% 62% 45% 38%
Having launched in the UK earlier this year, over ¾ of people are aware of 5G mobile internetAwareness of Emerging Technology (includes: have heard of, know a little or know a lot)Q02. How much, if anything, do you feel you know about these things?
Base: 1,000 GB adults aged 15+ Q3 2019
Source: Ipsos MORI
*Wearable Technology (excluding smart watches and fitness trackers)
89%
7

;
8K
Drones Driverless Cars 5G Mobile Internet
Artificial Intelligence
Virtual Reality
Wearable Technology*
Crypto Currency
Foldable Smartphones
Augmented Reality
8K TVs
92%77%
Males ABC1
GB Adults
Base: 1,000 GB adults aged 15+ Q3 2019Males ABC1: n=283
*Wearable Technology (excluding smart watches and fitness trackers)
Source: Ipsos MORI
89%78%
89%81%
93%84%
96%89%
84%75%
85%71%
78%62%
61%45%
55%38%
Significantly higher / lower @ 95% confidence level vs. Total Sample
Awareness of Emerging Technology (includes: have heard of, know a little or know a lot)
Males in the ABC1 Social Grade are significantly more likely to be aware of emerging technology than GB adults on average
Q02. How much, if anything, do you feel you know about these things?
8

Of the emerging technologies available to purchase, Wearable Tech is the most popular with almost a fifth of people owning some
Base: 1,000 GB adults aged 15+ Q3 2019
*Wearable Technology (excluding smart watches and fitness trackers)
Q03. Do you currently own or use any of these?
Ownership of Emerging Technology
Source: Ipsos MORI
1%3%
6%6%7%
18%
8K TVsAugmented RealityCrypto CurrencyDronesVirtual RealityWearableTechnology*
9

75% Aware
26% Know A lotOf Those Aware
49% OwnOf Those Who Know A Lot
Emerging technology providers must improve knowledge of their products to increase uptake
*Wearable Technology (excluding smart watches and fitness trackers)
Conversion of Awareness to Ownership for Emerging Tech
Base: 1,000 GB adults aged 15+ Q3 2019Those aware of emerging tech: Wearable Tech n=752, VR n=814, Drones n=886
Those who know a lot about emerging tech: Wearable Tech n=196, VR n=150, Drones n=166
Almost half of those who know a lot about wearable tech own a piece
Q02. How much, if anything, do you feel you know about these things?Q03. Do you currently own or use any of these?
Source: Ipsos MORI
Wearable Technology* DronesVirtual Reality
81% Aware
15% Know A lotOf Those Aware
24% OwnOf Those Who Know A Lot
89% Aware
17% Know A lotOf Those Aware
18% OwnOf Those Who Know A Lot
10

Social Networking & Device Usage
11

44%41% 41%
25% 24%
12%
48%44%
51%
29%33%
16%
39% 38%
28%
20%14%
8%
Base: 1,000 GB adults aged 15+: Q3 2019ABC1 n=585, C2DE n=385
Source: Ipsos MORISignificantly higher / lower @ 95% confidence level vs. Total Sample
GB Adults
ABC1
C2DE
Netflix is the most popular VOD Service, but social grade is a large factor in use of each serviceCatch-up TV services need to work harder to attract lower social grades
Usage of Video On Demand ServicesQ05. Which of the following music or video on demand services, if any, do you use?
12

;
29%
24% 23%
15%
10%
2%
33% 34%
23%19%
14%
1%
24%
13%
22%
9%6%
2%
Base: 1,000 GB adults aged 15+: Q3 2019ABC1 n=585, C2DE n=385
Source: Ipsos MORISignificantly higher / lower @ 95% confidence level vs. Total Sample
YouTube Music users are split evenly across Social Grades
GB Adults
ABC1
C2DE
Spotify is the most popular Music On Demand service, whilst BBC Sounds comes in second but with higher presence amongst higher social gradesUsage of Music On Demand ServicesQ05. Which of the following music or video on demand services, if any, do you use?
13

63%55%
34%
22% 20% 19%
80%
65% 65%70%
31%
17%
79% 76%
57%
38%
27% 28%
Significantly higher / lower @ 95% confidence level vs. Total Sample
GB Adults
15-24
25-34
Amongst social media brands, Snapchat has the largest difference by age, with 7 in 10 15-24s using the service compared to less than 4 in 10 25-34sUsage of Social MediaQ06. Which of the following social networking services, if any, do you ever use?
Base: 1,000 GB adults aged 15+: Q3 201915-24 n=149, 25-34 n=150
Source: Ipsos MORI
14

63%57% 55%
50%
38%
23%
14% 13%
23%18%
21%17%
13%10% 12%
15%20%
14%
5% 6% 4% 6%9%
17%
5%
13%
6%10%
13%
29%
Several Times Per Day
Once Per Day
A Few Times Per Week
Once Per Week
Less Often
Base: Social Media Users: Facebook n=635, Twitter n=201, Instagram n=342, WhatsApp n=547, Snapchat n=216, LinkedIn n=190
Source: Ipsos MORI
For most Social Media platforms, the majority of their users will use the service several times per day
Frequency of Social Media usageQ07. How often do you use each of these [Social Media]?
15

9%41%
23%
51% 34%
18%
57%
53% 9%
Base: 1,000 GB adults aged 15+: Q3 2019
Source: Ipsos MORI
A wide variety of devices are used to consume video content whereas audio content skews more towards being consumed on a smartphoneQ04. Which device or devices, if any, do you use for the following activities?
Laptop/Desktop Computer
Smart TV
-
Tablet
Devices used to watch Video content
Devices used to listen to Music content
Smartphone Games Console
-
Voice Activated Speaker
-
- -
-
16

;;
;
72%12%12%
68%28%
53%
55%14%
35%
31%16%
31%
Base: 1,000 GB adults aged 15+: Q3 2019
Source: Ipsos MORI
Sending or receiving emails
Instant messaging
Shopping groceries, goods or services
When it comes to more functional tasks (such as email or online banking) the use of a single device is often preferable
Online activities by deviceQ04. Which device or devices, if any, do you use for the following activities?
Online banking Smartphone
Tablet
Laptop/Desktop
17

Attitudes Towards Technology
18
Base: 1,000 GB adults aged 15+ Q3 2019
Source: Ipsos MORI
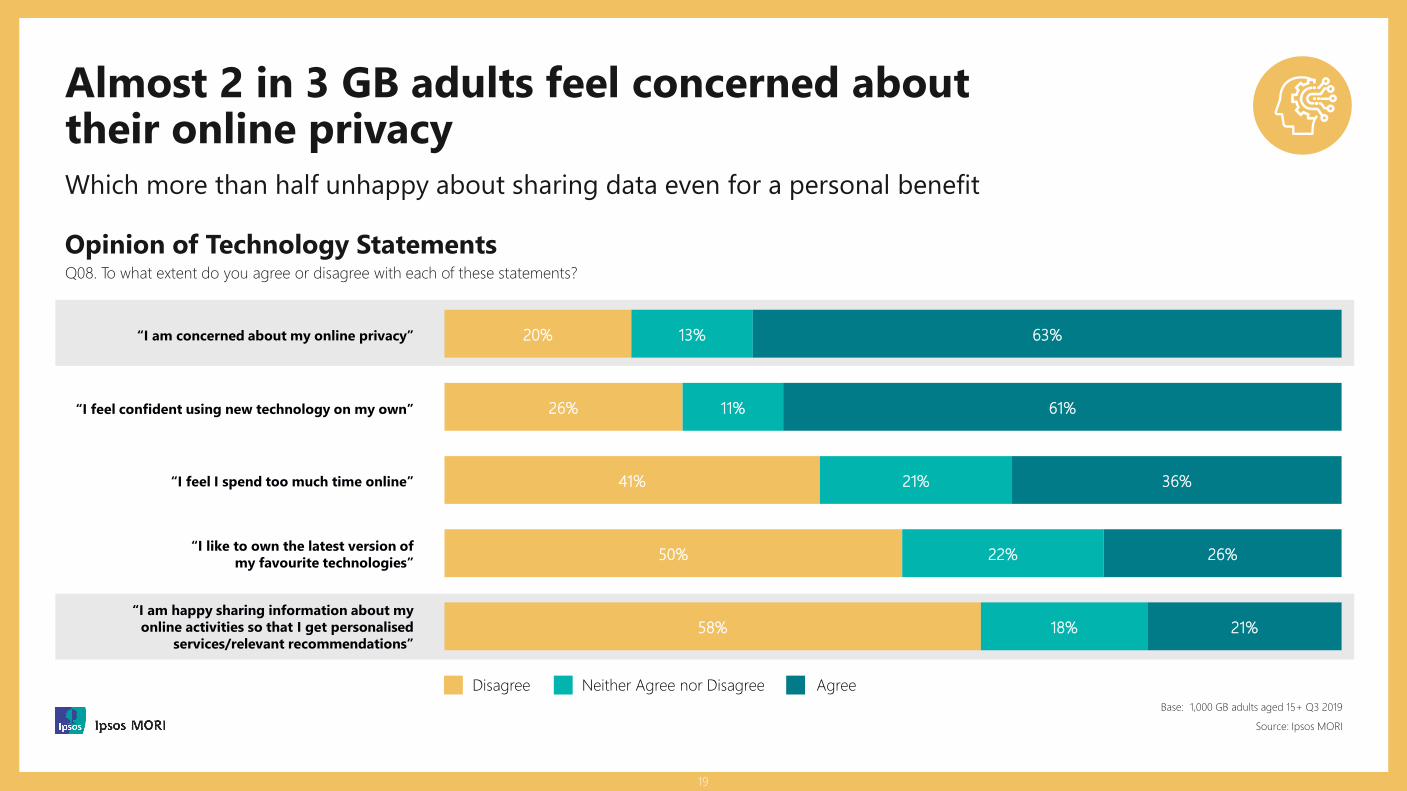
“I am concerned about my online privacy”
“I feel confident using new technology on my own”
“I feel I spend too much time online”
“I like to own the latest version of my favourite technologies”
“I am happy sharing information about my online activities so that I get personalised
services/relevant recommendations”
Almost 2 in 3 GB adults feel concerned about their online privacyWhich more than half unhappy about sharing data even for a personal benefit
Opinion of Technology StatementsQ08. To what extent do you agree or disagree with each of these statements?
58%
50%
41%
26%
20%
18%
22%
21%
11%
13%
21%
26%
36%
61%
63%
Disagree Neither Agree nor Disagree Agree
19

When analysing the previous statements a group emerges that are confident in using technology and who always like to own the latest versions of their favourite tech
We identified this group as the Tech TrendsettersQ08. To what extent do you agree or disagree with each of these statements?
Base: 1,000 GB adults aged 15+ Q3 2019Tech Trendsetters n=225
Source: Ipsos MORI
“I feel confident using new technology on my own”61%
“I like to own the latest version of my favourite technologies” 26%
24%Tech Trendsetters
24% Tech Trendsetter group formed by people who agreed on these:
&
20

8%
35%
56%
67%
33%
55+
35-54
15-34
Male
Female
Base: Tech Trendsetters n=225
We identified this group as the Tech TrendsettersQ08. To what extent do you agree or disagree with each of these statements?
The Tech Trendsetters are more likely to be male, under 35 and ABC1 social grade
Source: Ipsos MORI
67%
33%
ABC1
C2DE
Social grade
21

6%12%
Tech Trendsetters are significantly more likely to own a wide range of technologies
Significantly higher / lower @ 95% confidence level vs all GB adults
7%14%
18%25%
66%73%
33%55%
37%49%
Smart Watch
14%24%
3%7%
6%10%
Ownership of TechnologyQ01. Which, if any, of the following do you own?Q03. Do you currently own or use any of these?
Base: 1,000 GB adults aged 15+ Q3 2019Tech Trendsetters n=225
Source: Ipsos MORI
Drones
Augmented Reality
Crypto Currency
Virtual Reality
Wearable Technology*
4K4K/Smart TVs GB Adults
Tech Trendsetters
Games Console
Laptop Computer
22
*Wearable Technology (excluding smart watches and fitness trackers)

Please contact us if you would like further data
23
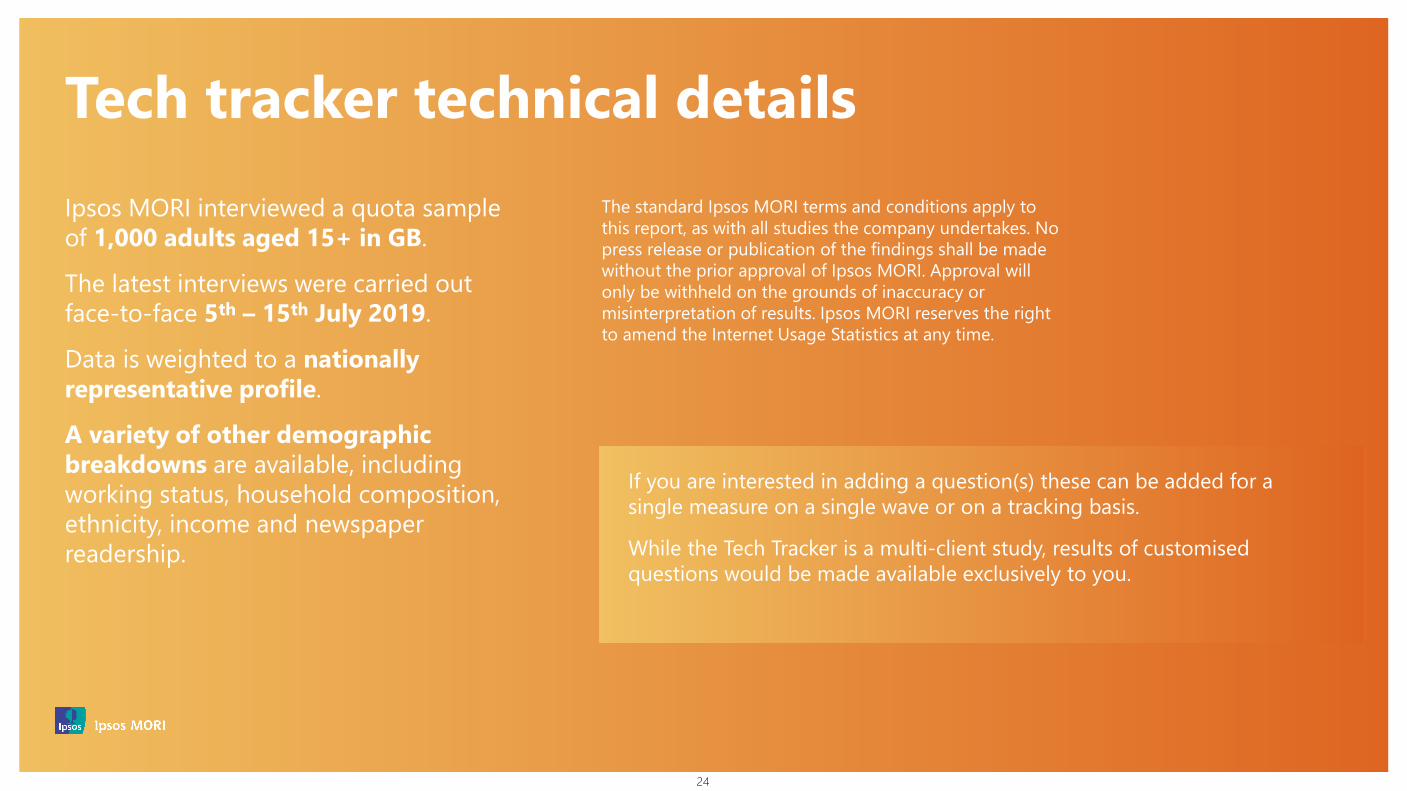
Ipsos MORI interviewed a quota sample of 1,000 adults aged 15+ in GB.
The latest interviews were carried out face-to-face 5th – 15th July 2019.
Data is weighted to a nationally representative profile.
A variety of other demographic breakdowns are available, including working status, household composition, ethnicity, income and newspaper readership.
The standard Ipsos MORI terms and conditions apply to this report, as with all studies the company undertakes. No press release or publication of the findings shall be made without the prior approval of Ipsos MORI. Approval will only be withheld on the grounds of inaccuracy or misinterpretation of results. Ipsos MORI reserves the right to amend the Internet Usage Statistics at any time.
If you are interested in adding a question(s) these can be added for a single measure on a single wave or on a tracking basis.
While the Tech Tracker is a multi-client study, results of customised questions would be made available exclusively to you.
Tech tracker technical details
24

For more information
Hannah [email protected] 8080 6135
Eda [email protected] 8861 8775
Samara [email protected] 3059 8061
Pierce [email protected] 3059 4718
25
Top Related