


Languages
Pages
Legal

Global Retail Banking
30 June 2010
PresentationInvestor Seminar
111
111
Global Retail Banking Investor SeminarIntroduction
John Varley, CEO Barclays Plc30 June 2010
22
22
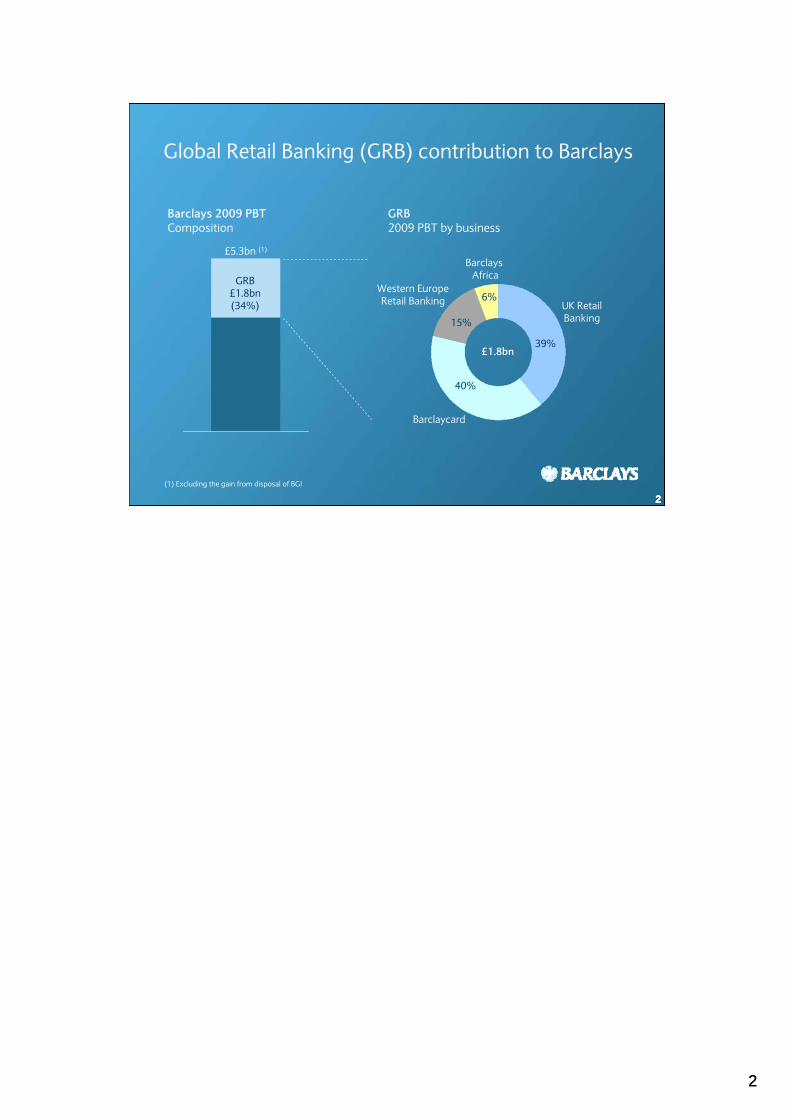
Global Retail Banking (GRB) contribution to Barclays
2
£5.3bn (1)
(1) Excluding the gain from disposal of BGI
Barclays 2009 PBT Composition
GRB 2009 PBT by business
GRB£1.8bn(34%)
£1.8bn
UK RetailBanking
Barclaycard
Western EuropeRetail Banking
Barclays Africa
15%
6%
40%
39%
33
33
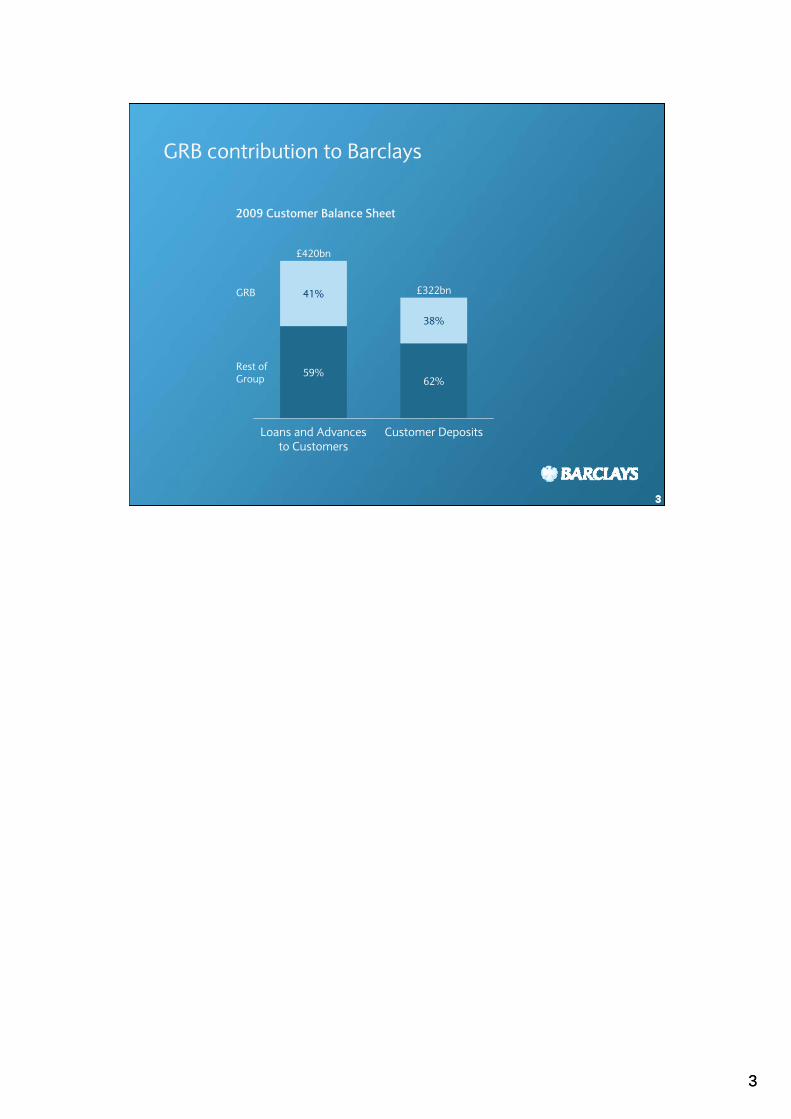
GRB contribution to Barclays
3
2009 Customer Balance Sheet
GRB
62%
Customer DepositsLoans and Advances to Customers
38%
41%
59%
£322bn
£420bn
Rest of Group
44
44
GRB financial goals
4
Profit growth
Improved loan to deposit ratio
Depth, not breadth
Generation of net equity
555
555
GRB Overview and Strategy
Antony Jenkins, CEO Global Retail Banking30 June 2010
66
66
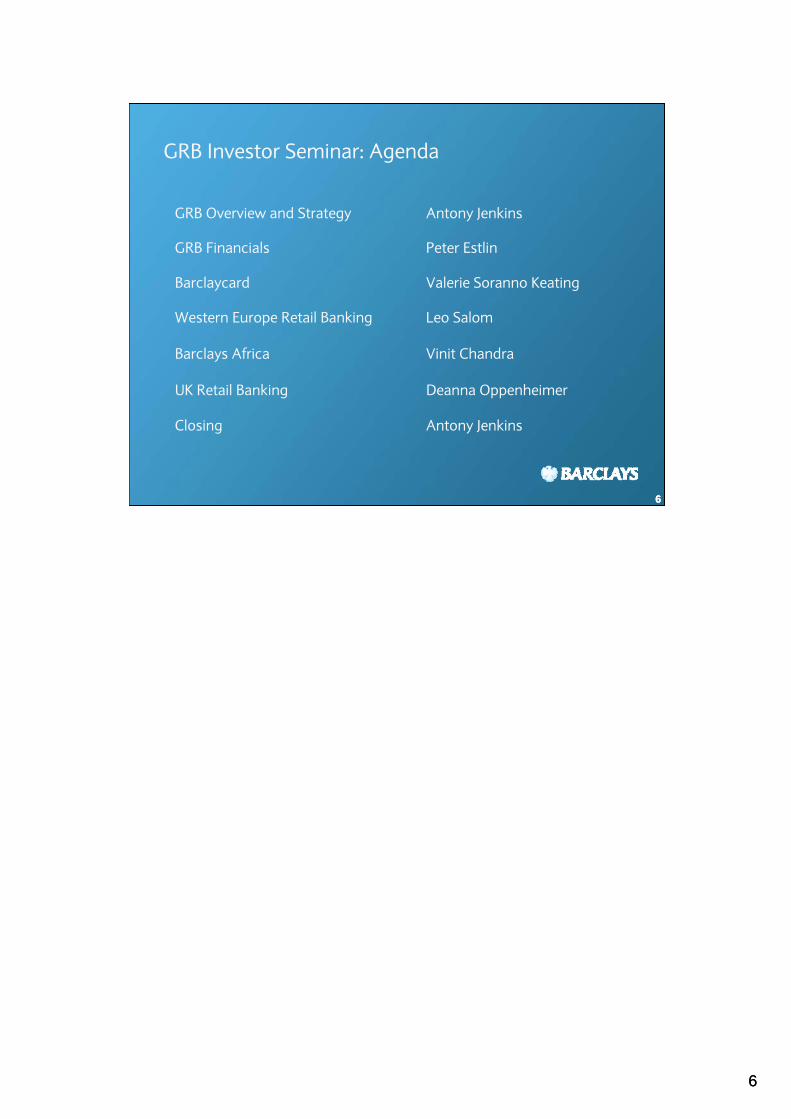
GRB Investor Seminar: Agenda
6
GRB Overview and Strategy Antony Jenkins
GRB Financials Peter Estlin
Barclaycard Valerie Soranno Keating
Western Europe Retail Banking Leo Salom
Barclays Africa Vinit Chandra
UK Retail Banking Deanna Oppenheimer
Closing Antony Jenkins

77
777
88
888
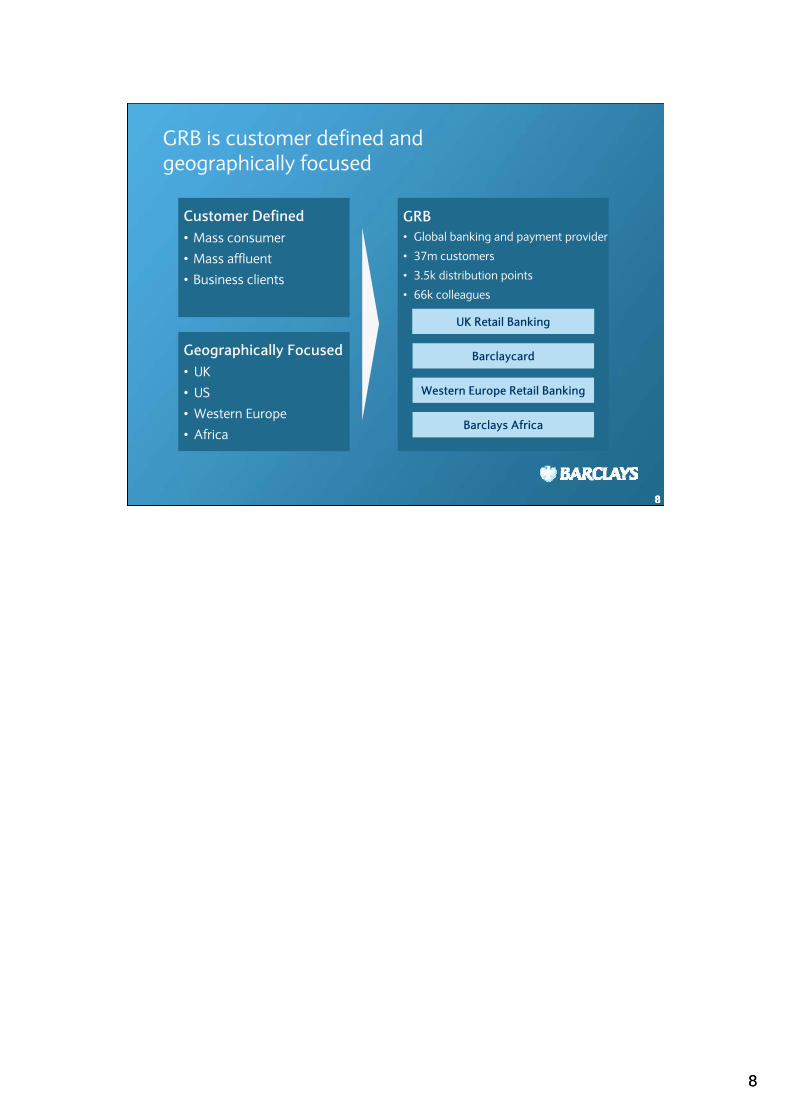
GRB is customer defined and geographically focused
GRB• Global banking and payment provider
• 37m customers
• 3.5k distribution points
• 66k colleagues
UK Retail Banking
Barclaycard
Western Europe Retail Banking
Barclays Africa
Customer Defined• Mass consumer
• Mass affluent
• Business clients
Geographically Focused• UK
• US
• Western Europe
• Africa

99
99
GRB is building on strong foundations
9
Leading edge technology
Upgraded footprint
Well diversified
Innovative products
Strong customer franchise
1010
1010
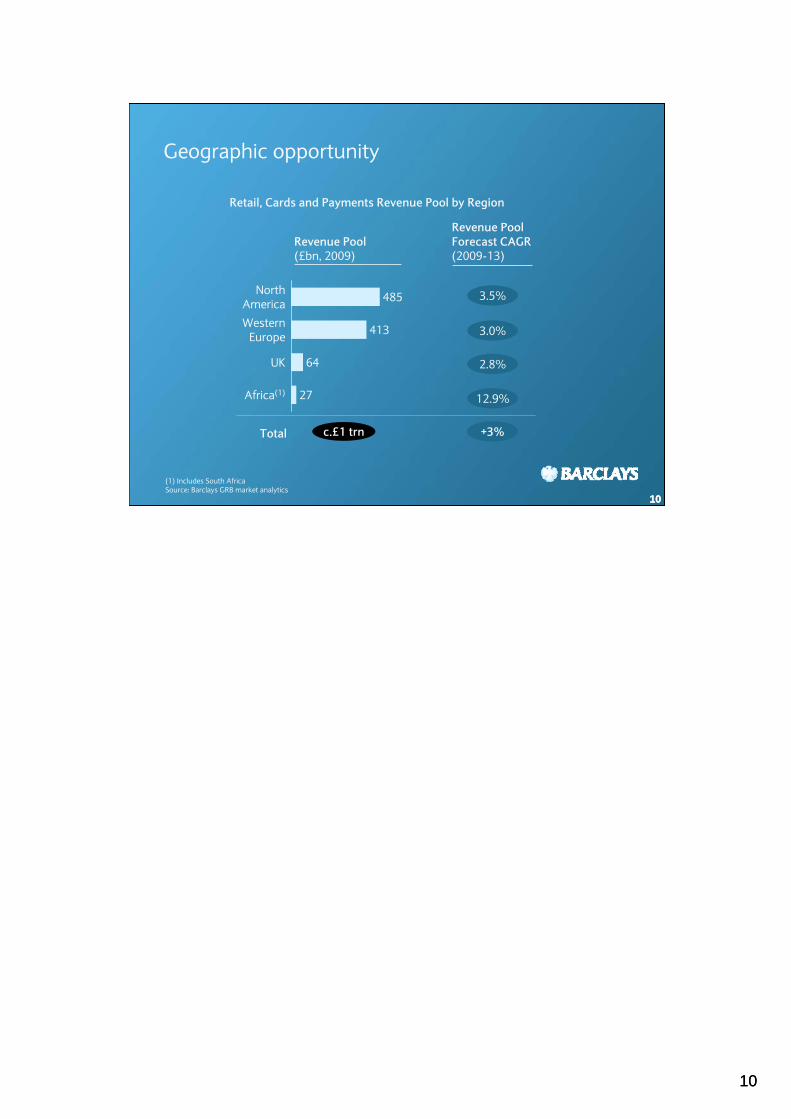
Geographic opportunity
10
Total
Revenue Pool Forecast CAGR(2009-13)
3.5%
3.0%
2.8%
12.9%
+3%
Revenue Pool(£bn, 2009)
(1) Includes South AfricaSource: Barclays GRB market analytics
c.£1 trn
Retail, Cards and Payments Revenue Pool by Region
Africa(1) 27
UK 64
WesternEurope 413
NorthAmerica 485
1111
1111
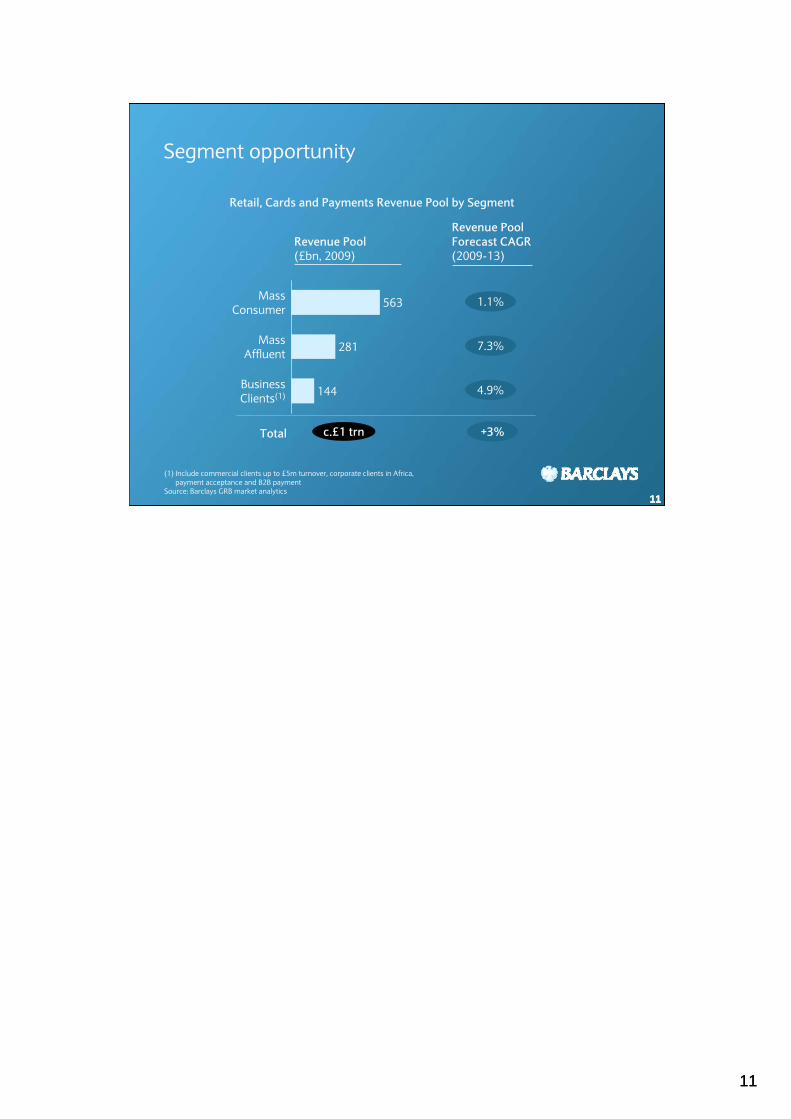
Segment opportunity
11
Total
Revenue Pool Forecast CAGR(2009-13)
1.1%
7.3%
4.9%
Revenue Pool(£bn, 2009)
(1) Include commercial clients up to £5m turnover, corporate clients in Africa, payment acceptance and B2B payment
Source: Barclays GRB market analytics
c.£1 trn
Retail, Cards and Payments Revenue Pool by Segment
144
563
281
MassConsumer
Mass Affluent
BusinessClients(1)
+3%
1212
121212
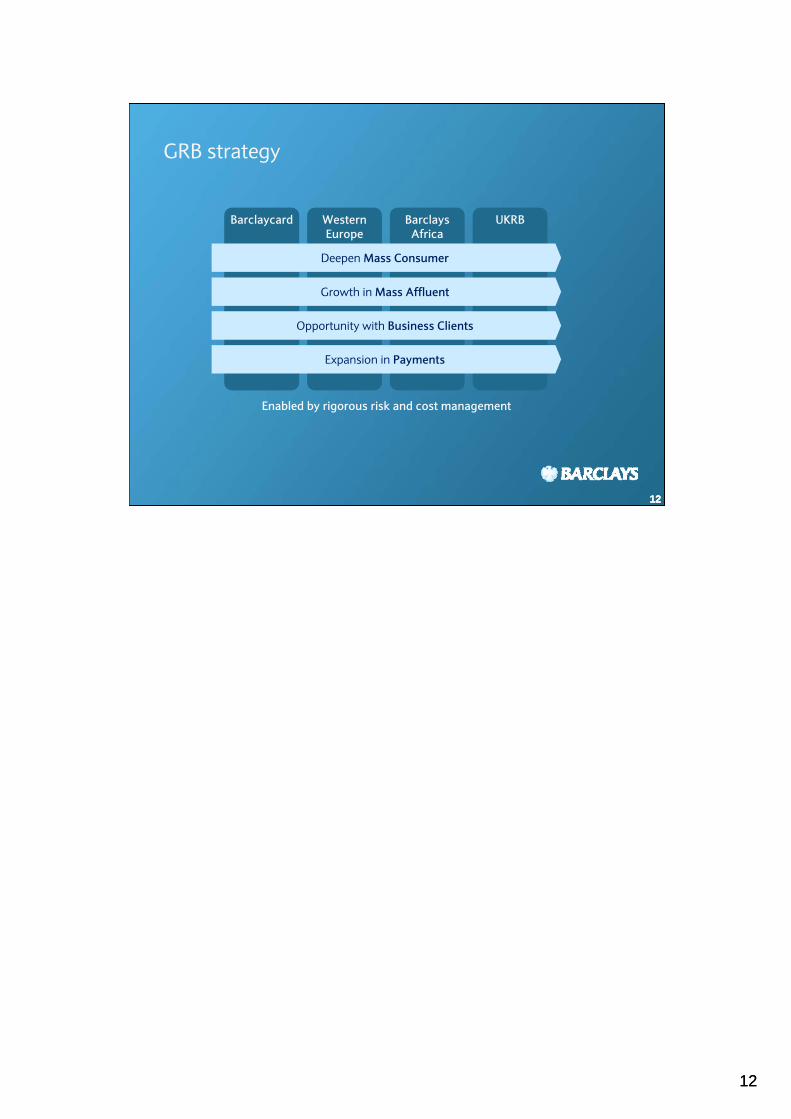
GRB strategy
Barclaycard WesternEurope
BarclaysAfrica
UKRB
Deepen Mass Consumer
Growth in Mass Affluent
Opportunity with Business Clients
Expansion in Payments
Enabled by rigorous risk and cost management
1313
1313
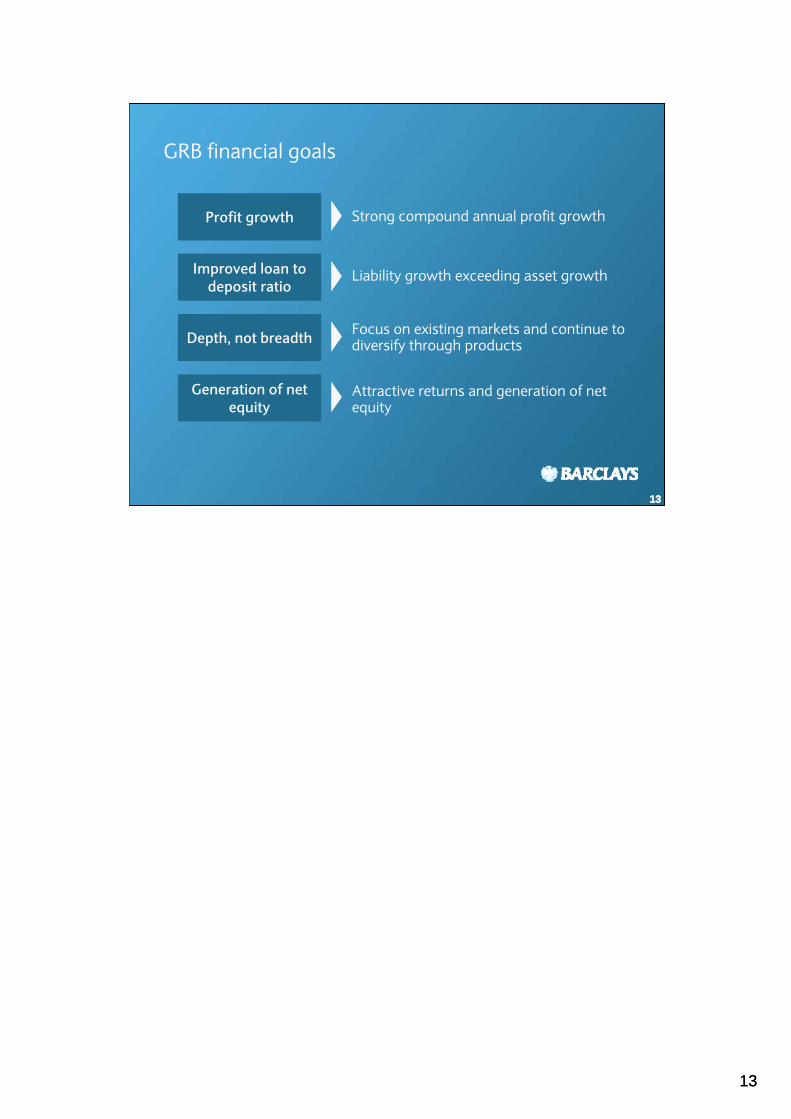
GRB financial goals
13
Strong compound annual profit growth
Focus on existing markets and continue to diversify through products
Attractive returns and generation of net equity
Liability growth exceeding asset growth
Profit growth
Improved loan to deposit ratio
Depth, not breadth
Generation of net equity
1414
1414
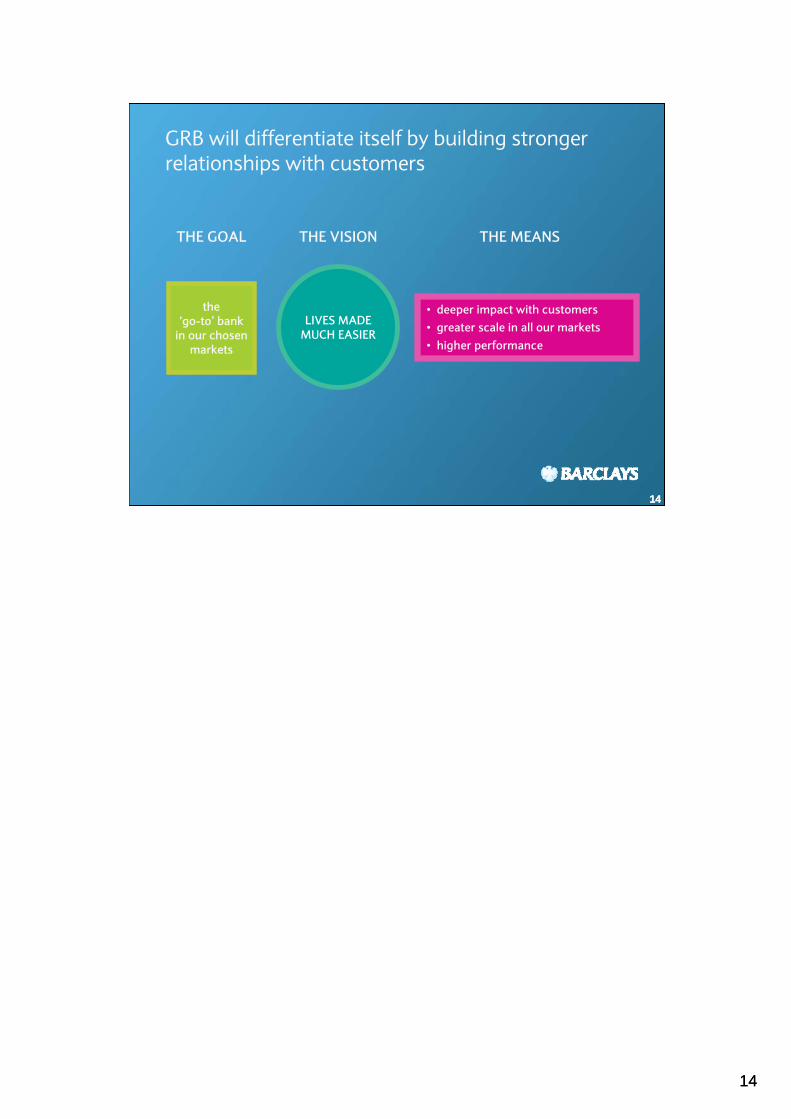
GRB will differentiate itself by building stronger relationships with customers
14
LIVES MADEMUCH EASIER
THE VISIONTHE GOAL
the‘go-to’ bank
in our chosen markets
THE MEANS
• deeper impact with customers• greater scale in all our markets• higher performance
1515
151515
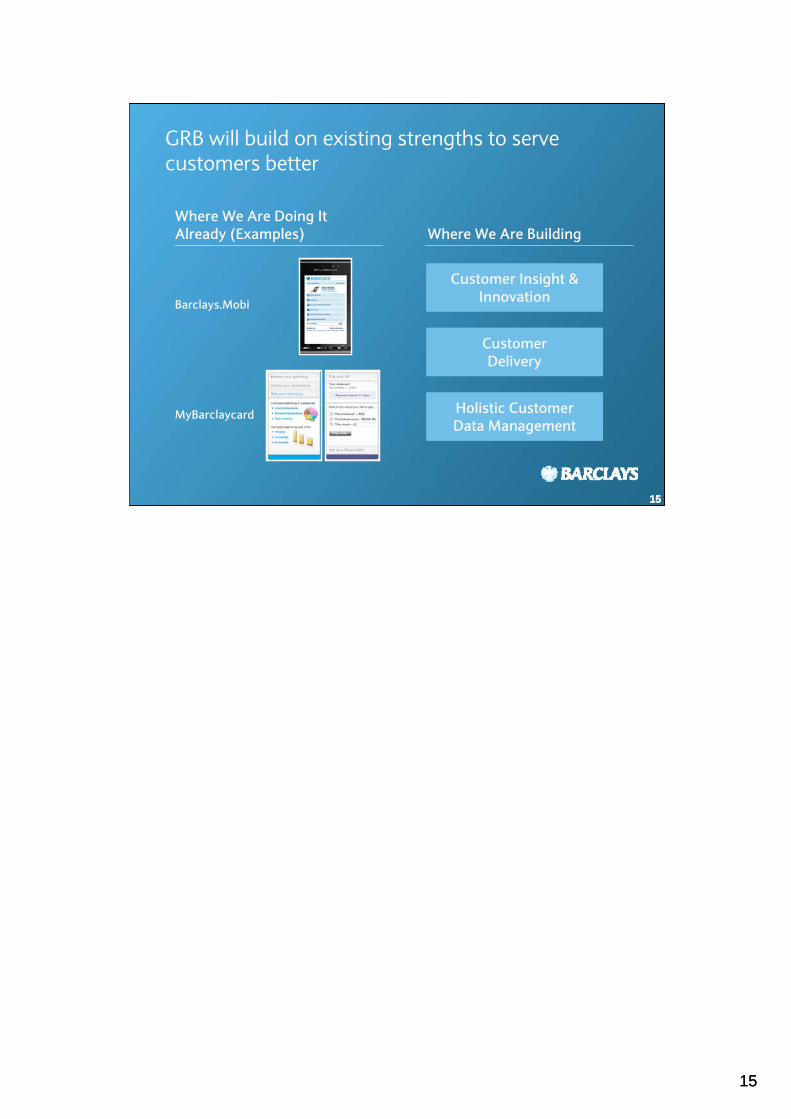
GRB will build on existing strengths to serve customers better
Where We Are Doing It Already (Examples) Where We Are Building
Barclays.Mobi
Customer Insight & Innovation
Customer Delivery
Holistic Customer Data Management
MyBarclaycard
1616
1616
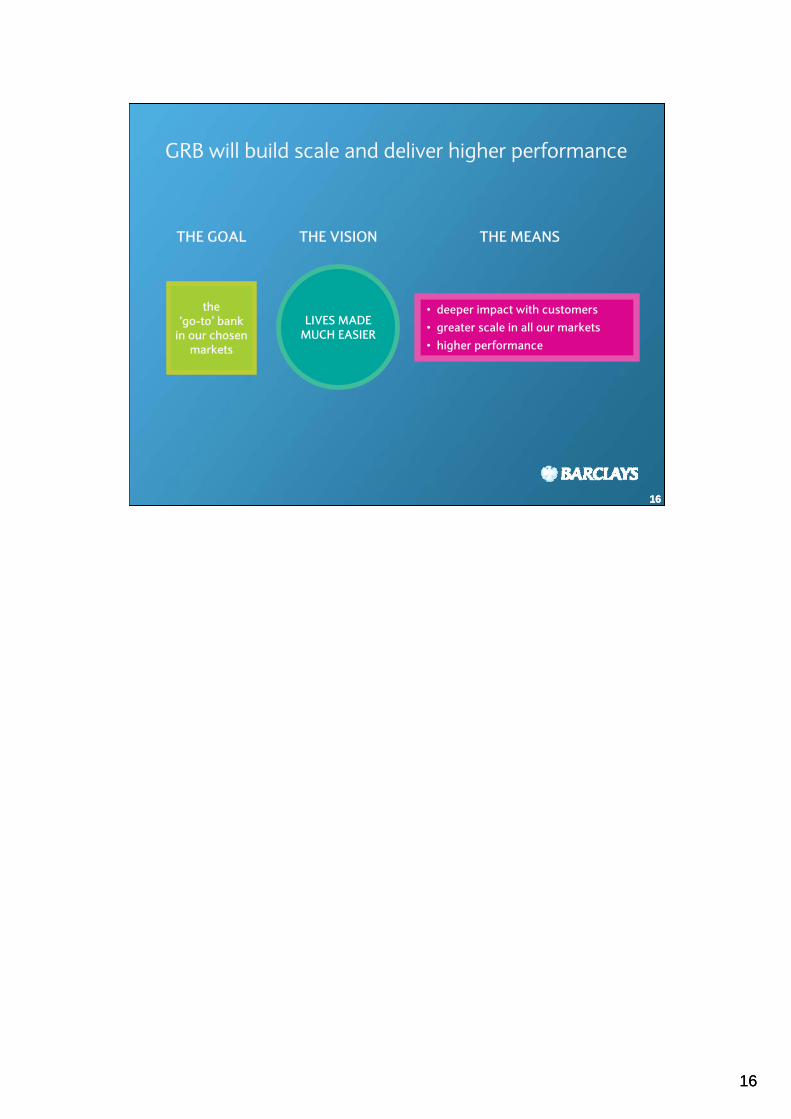
GRB will build scale and deliver higher performance
16
LIVES MADEMUCH EASIER
THE VISIONTHE GOAL
the‘go-to’ bank
in our chosen markets
THE MEANS
• deeper impact with customers• greater scale in all our markets• higher performance
1717
171717
Happy customers
Strong profit growth
Good returns
181818
181818
GRB Financials
Peter Estlin, CFO Global Retail Banking30 June 2010
1919
191919
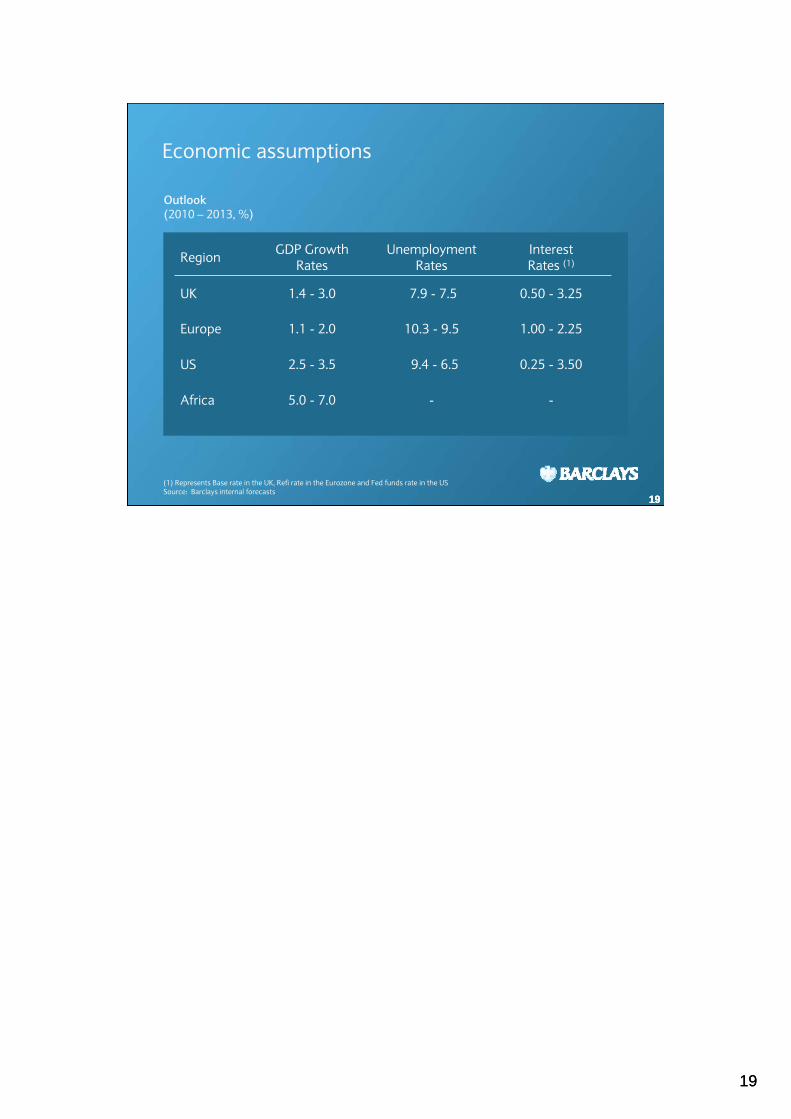
Region GDP GrowthRates
Unemployment Rates
Interest Rates (1)
UK 1.4 - 3.0 7.9 - 7.5 0.50 - 3.25
Europe 1.1 - 2.0 10.3 - 9.5 1.00 - 2.25
US 2.5 - 3.5 9.4 - 6.5 0.25 - 3.50
Africa 5.0 - 7.0 - -
Economic assumptions
Outlook(2010 – 2013, %)
(1) Represents Base rate in the UK, Refi rate in the Eurozone and Fed funds rate in the USSource: Barclays internal forecasts
2020
2020
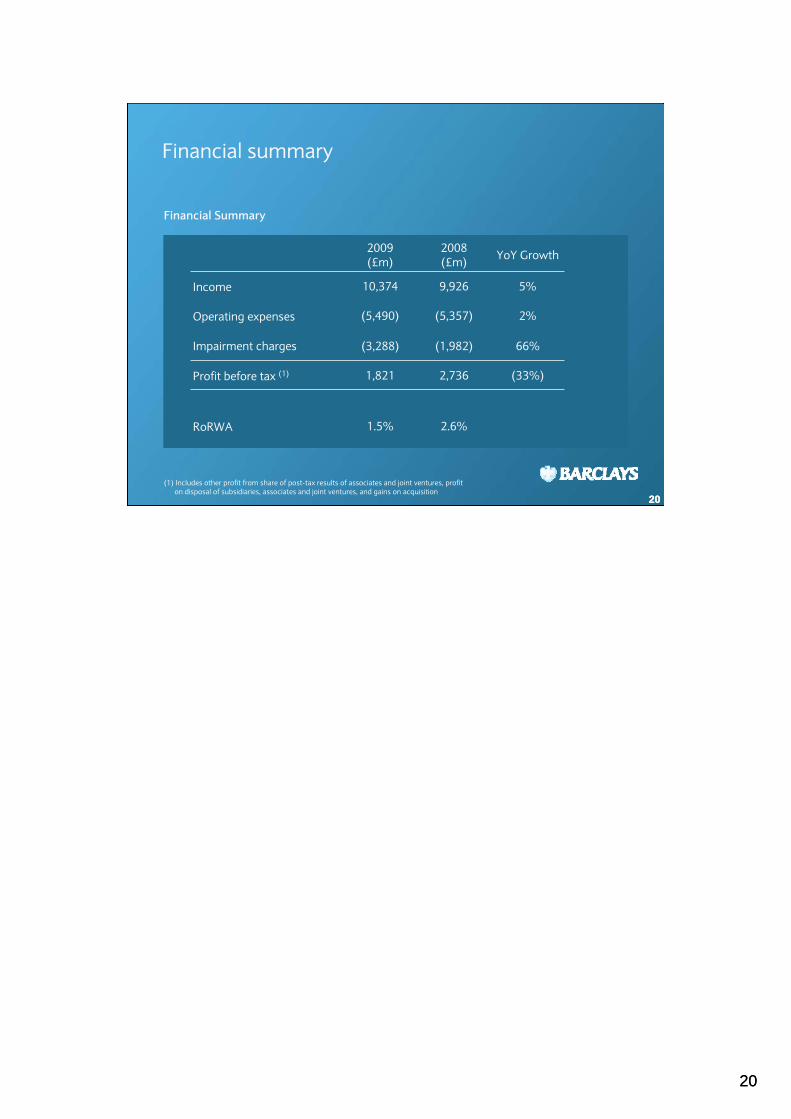
Financial summary
20
2009(£m)
2008(£m) YoY Growth
Income 10,374 9,926 5%
Operating expenses (5,490) (5,357) 2%
Impairment charges (3,288) (1,982) 66%
Profit before tax (1) 1,821 2,736 (33%)
RoRWA 1.5% 2.6%
(1) Includes other profit from share of post-tax results of associates and joint ventures, profit on disposal of subsidiaries, associates and joint ventures, and gains on acquisition
Financial Summary
2121
2121
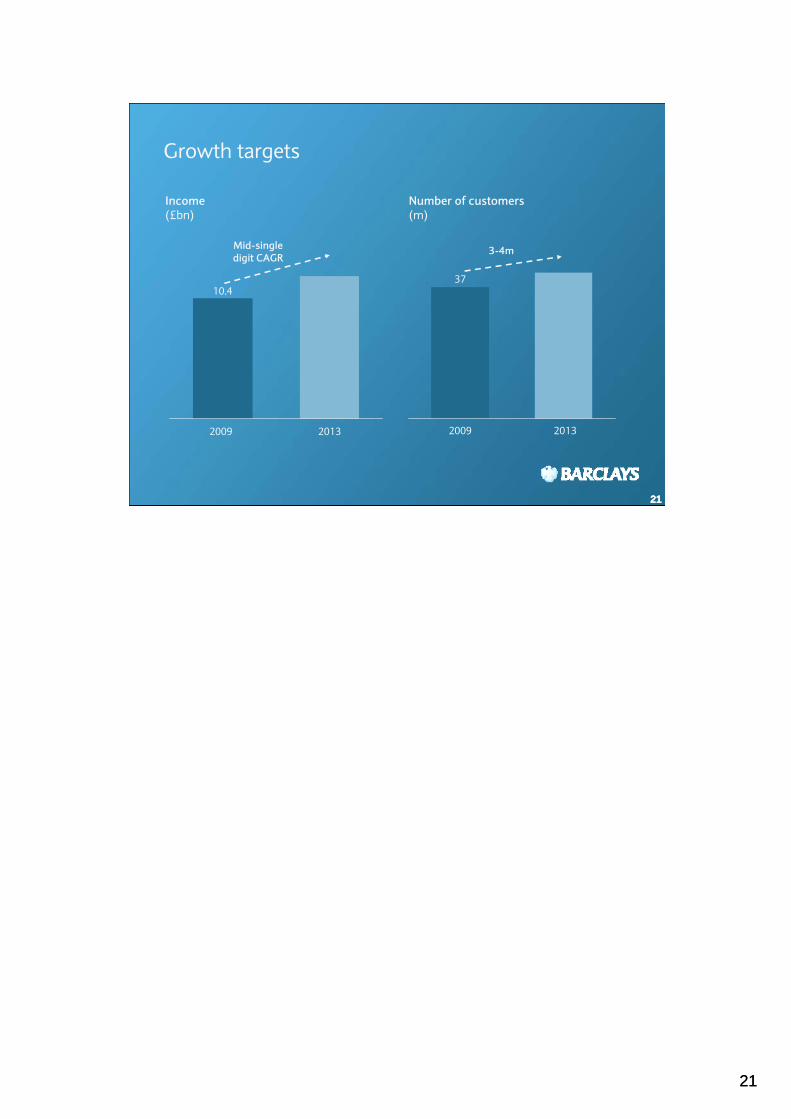
Growth targets
21
Income(£bn)
Number of customers(m)
20132009
10.4
20132009
37
Mid-singledigit CAGR
3-4m
2222
222222
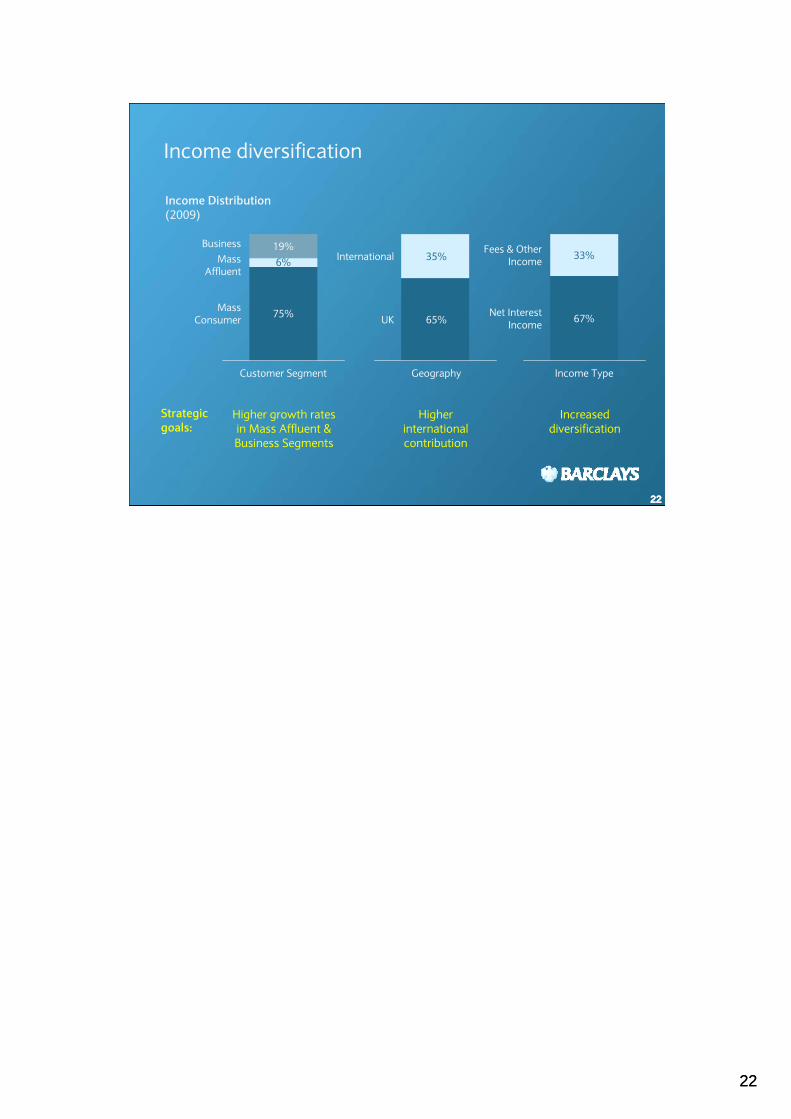
Income diversification
Income Distribution(2009)
Strategic goals:
Customer Segment
BusinessMass
Affluent
MassConsumer
Higher growth rates in Mass Affluent & Business Segments
75%
19%6%
Fees & OtherIncome
Net InterestIncome
Income Type
Increased diversification
67%
33%International
UK
Geography
35%
65%
Higher international contribution
2323
2323
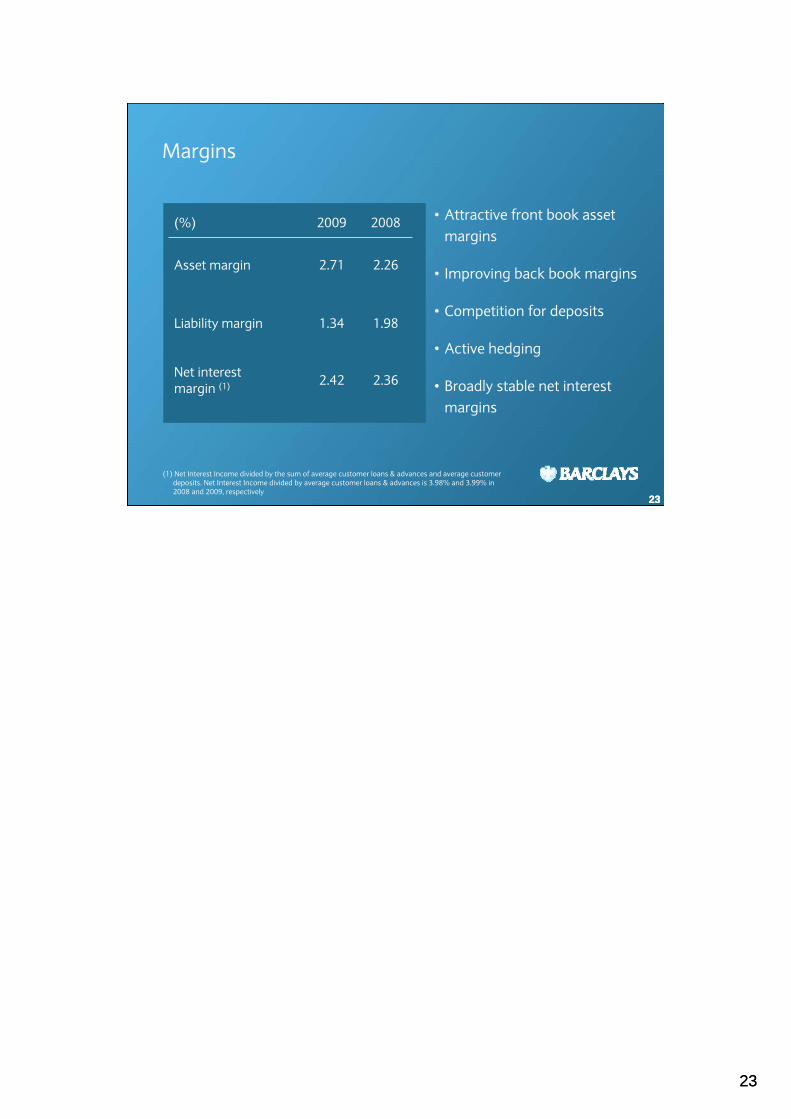
Margins
23
(%) 2009 2008
Asset margin 2.71 2.26
Liability margin 1.34 1.98
Net interestmargin (1) 2.42 2.36
• Attractive front book asset margins
• Improving back book margins
• Competition for deposits
• Active hedging
• Broadly stable net interest margins
(1) Net Interest Income divided by the sum of average customer loans & advances and average customer deposits. Net Interest Income divided by average customer loans & advances is 3.98% and 3.99% in 2008 and 2009, respectively
2424
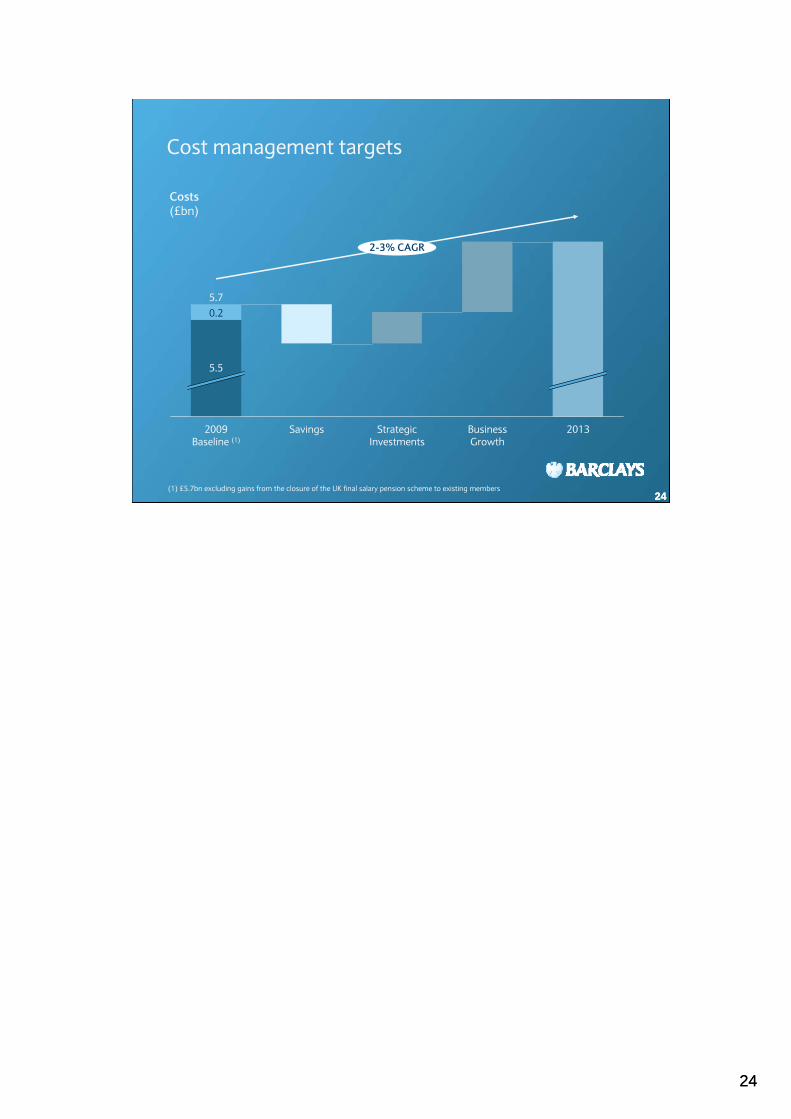
242424(1) £5.7bn excluding gains from the closure of the UK final salary pension scheme to existing members
Cost management targets
Costs(£bn)
0.2
5.5
5.7
2009Baseline (1)
Savings Strategic Investments
BusinessGrowth
2013
2-3% CAGR
2525
252525
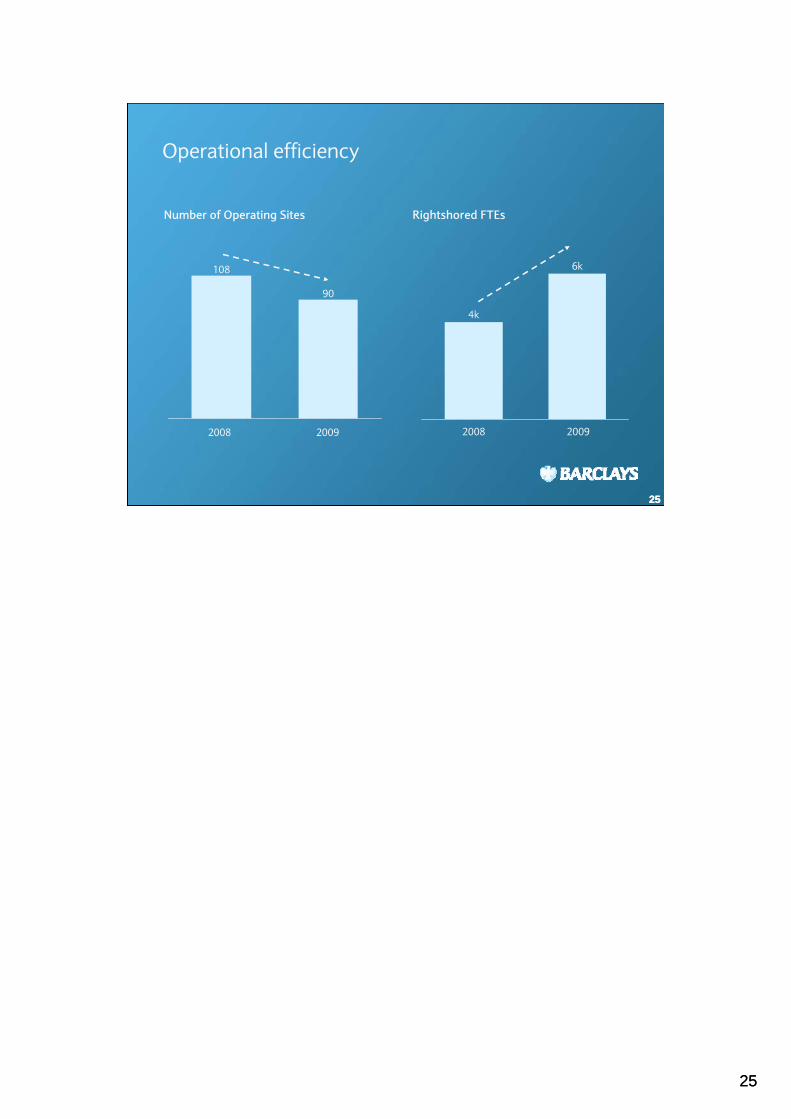
Operational efficiency
Number of Operating Sites Rightshored FTEs
20092008
108
90
20092008
4k
6k

2626
262626(1) £5.7bn excluding gains from the closure of the UK final salary pension scheme to existing members
Cost management targets
Costs(£bn)
0.2
5.5
5.7
2009Baseline (1)
Savings Strategic Investments
BusinessGrowth
2013
2-3% CAGR
2727
272727
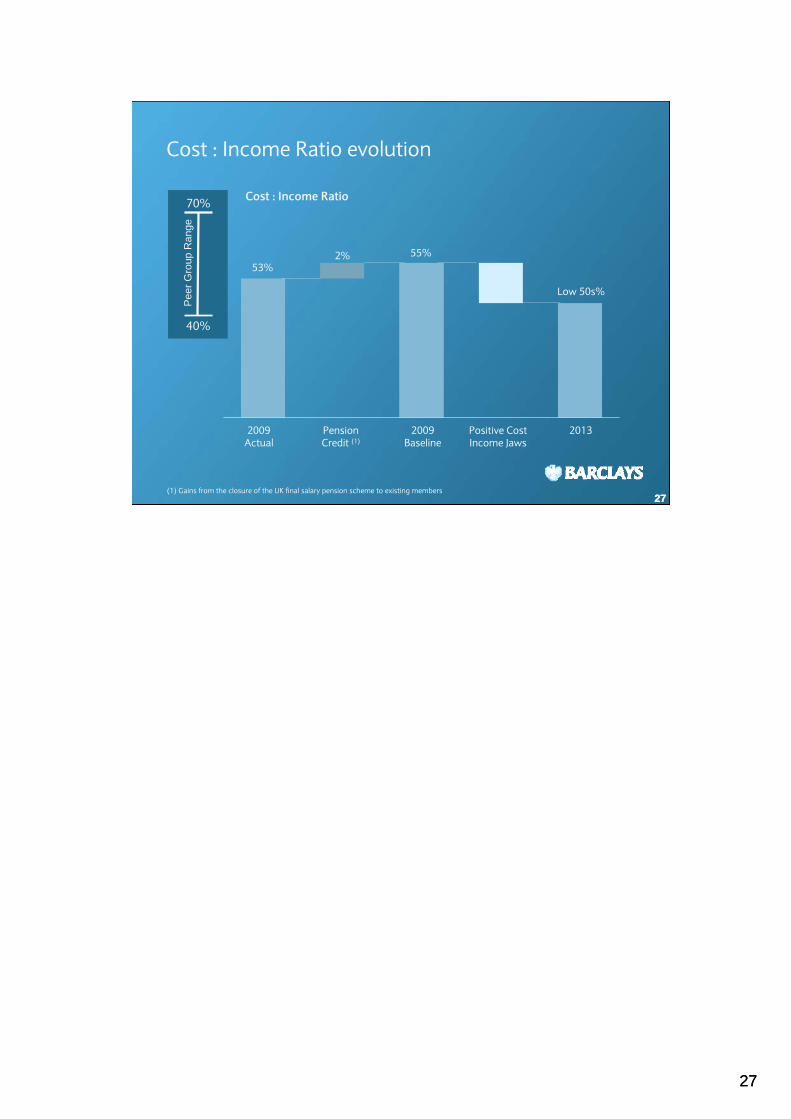
Cost : Income Ratio evolution
Cost : Income RatioP
eer G
roup
Ran
ge
70%
40%
2009Actual
53%
2009Baseline
55%
2013
Low 50s%
Positive Cost Income Jaws
PensionCredit (1)
2%
(1) Gains from the closure of the UK final salary pension scheme to existing members
2828
282828
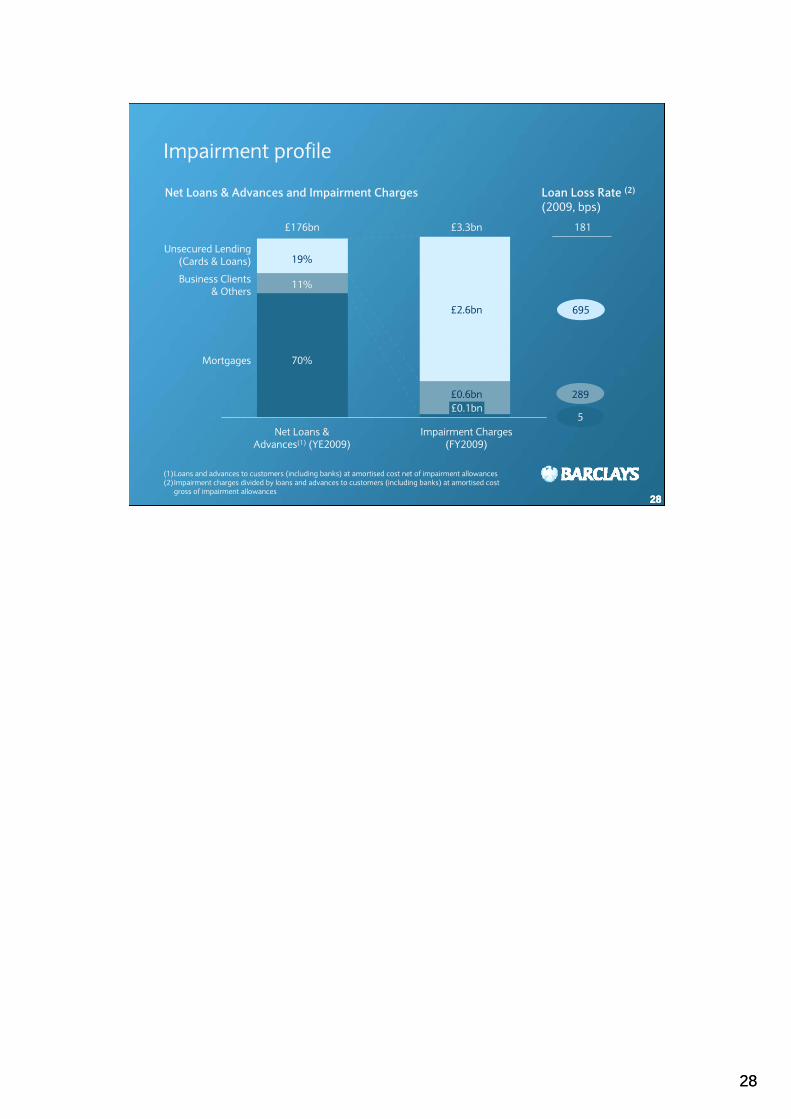
Impairment profile
Net Loans & Advances and Impairment Charges
Mortgages
Net Loans & Advances(1) (YE2009)
70%
Unsecured Lending(Cards & Loans)
Business Clients& Others
(1)Loans and advances to customers (including banks) at amortised cost net of impairment allowances(2)Impairment charges divided by loans and advances to customers (including banks) at amortised cost
gross of impairment allowances
19%
Impairment Charges (FY2009)
Loan Loss Rate (2)
(2009, bps)
181£176bn £3.3bn
11%
£2.6bn
£0.6bn£0.1bn
695
289
5
2929
2929
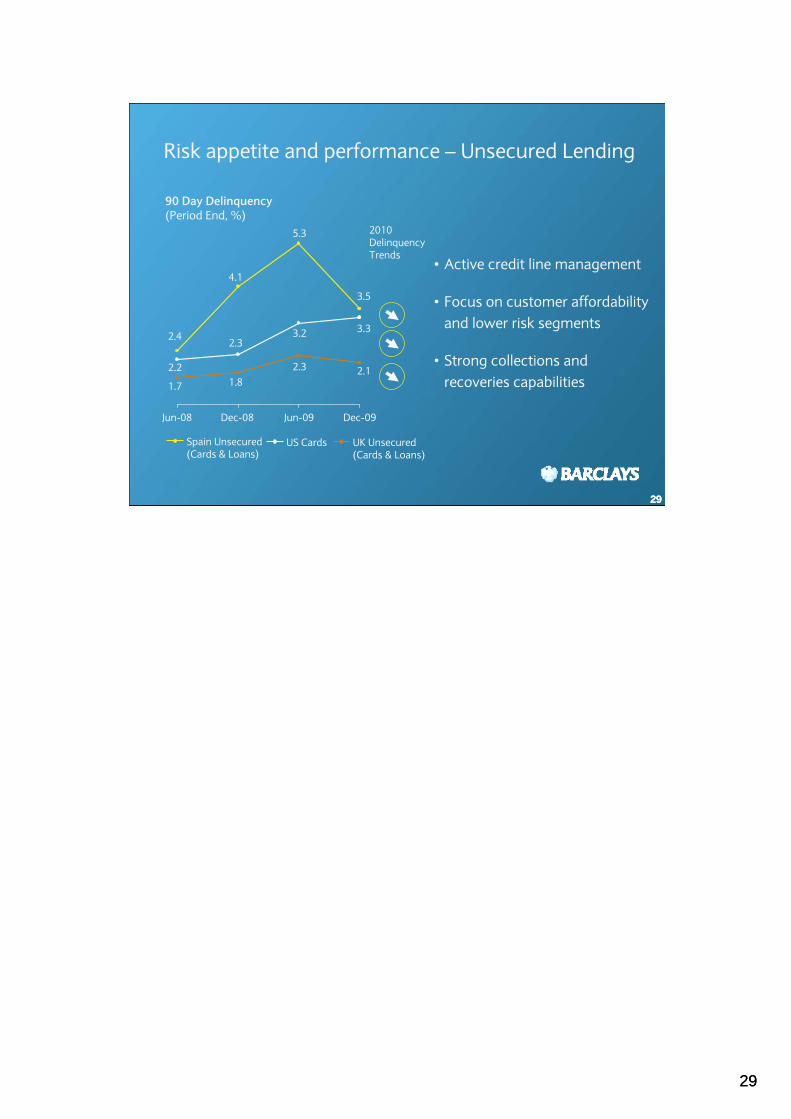
Risk appetite and performance – Unsecured Lending
29
Dec-09
3.5
2.1
3.3
Jun-09
5.3
2.3
3.2
Dec-08
4.1
1.8
2.3
Jun-08
2.4
1.7
2.2
US Cards UK Unsecured(Cards & Loans)
Spain Unsecured(Cards & Loans)
90 Day Delinquency(Period End, %)
• Active credit line management
• Focus on customer affordability and lower risk segments
• Strong collections and recoveries capabilities
2010 Delinquency Trends
3030
3030
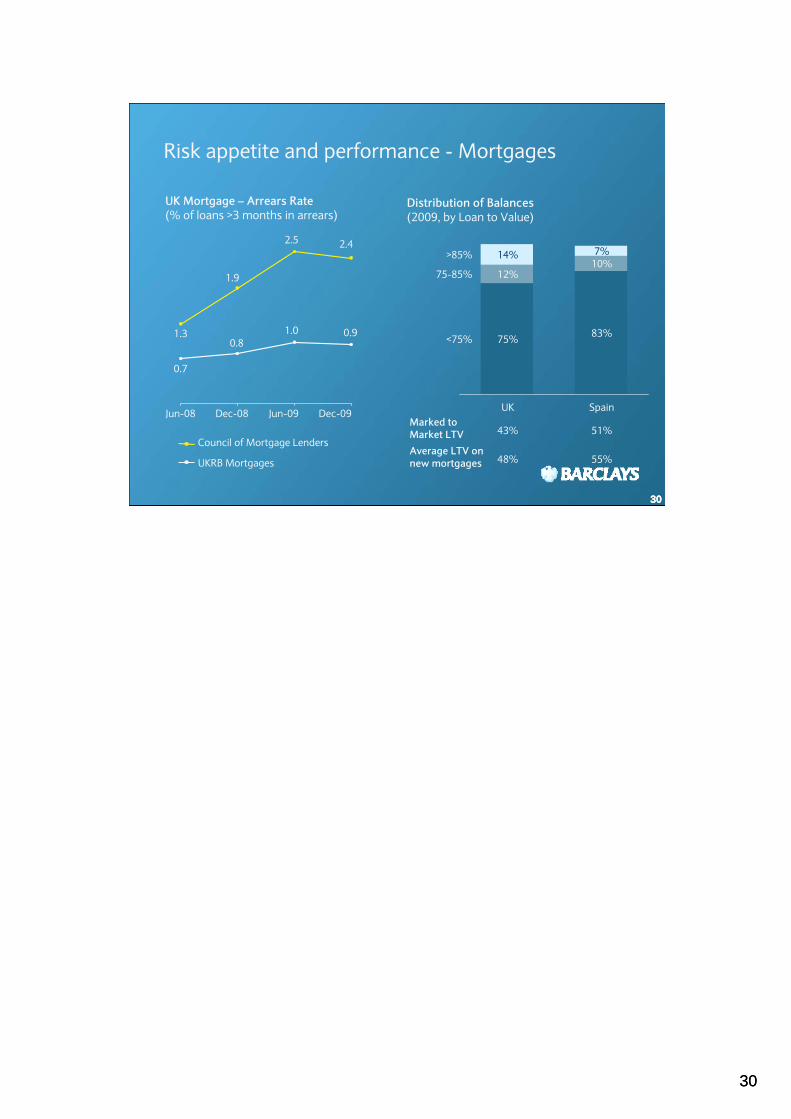
Risk appetite and performance - Mortgages
30
Dec-09
2.4
0.9
Jun-09
2.5
1.30.8
1.0
0.7
Jun-08
1.9
Dec-08
UKRB Mortgages
Council of Mortgage Lenders
UK Mortgage – Arrears Rate(% of loans >3 months in arrears)
43% 51%
48% 55%
Marked to Market LTVAverage LTV onnew mortgages
>85%
<75%
75-85%
Spain
83%
10%7%
UK
75%
12%
14%
Distribution of Balances(2009, by Loan to Value)
3131
313131
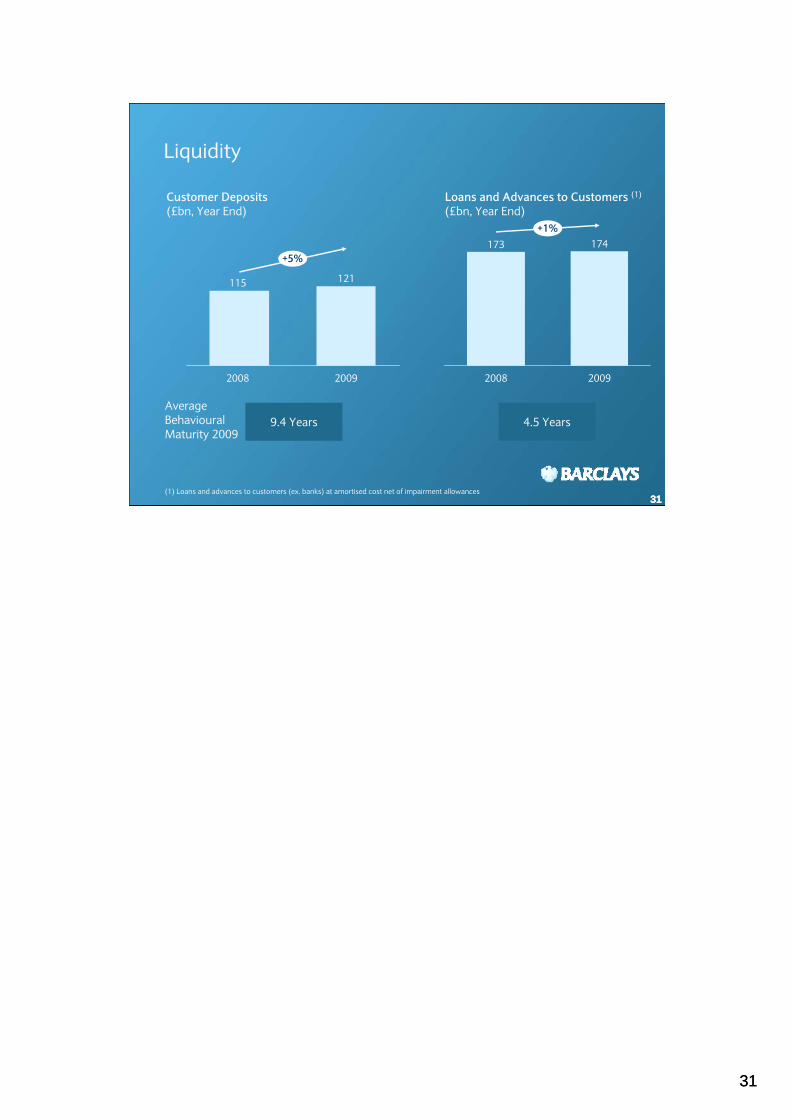
Liquidity
Customer Deposits(£bn, Year End)
Loans and Advances to Customers (1)
(£bn, Year End)
(1) Loans and advances to customers (ex. banks) at amortised cost net of impairment allowances
+5%
2009
121
2008
115
+1%
2009
174
2008
173
AverageBehavioural Maturity 2009
9.4 Years 4.5 Years
3232
323232
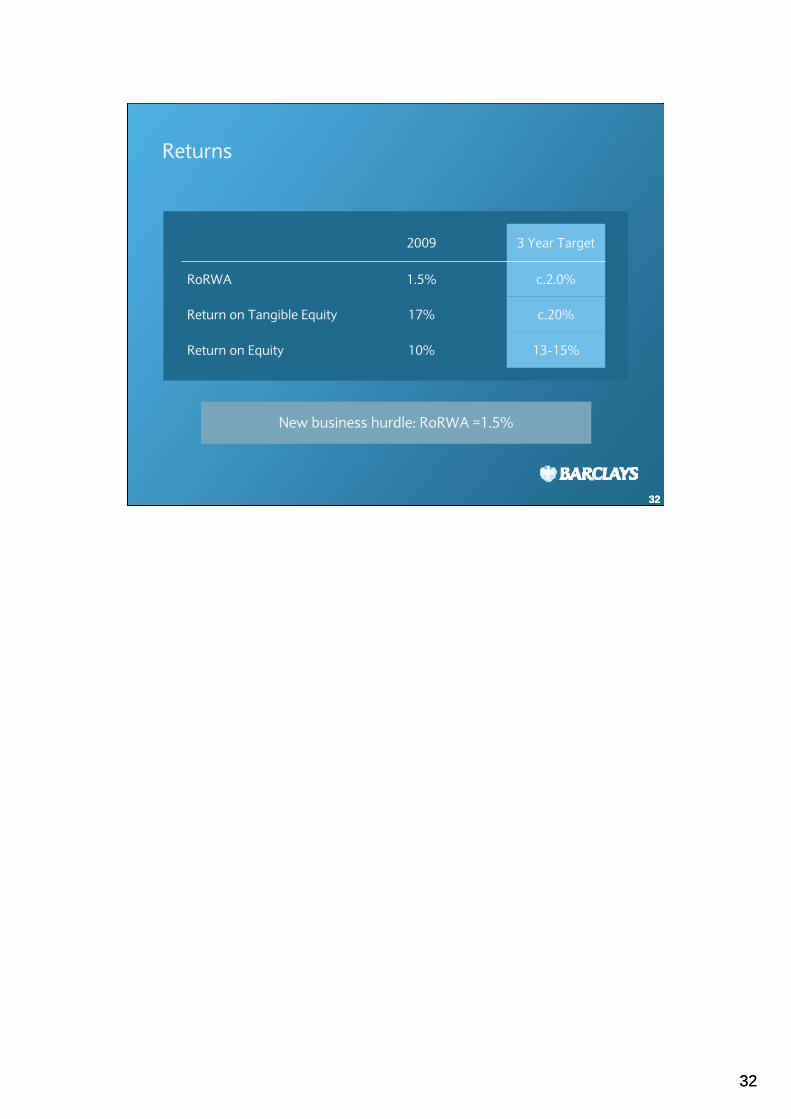
2009 3 Year Target
RoRWA 1.5% c.2.0%
Return on Tangible Equity 17% c.20%
Return on Equity 10% 13-15%
Returns
New business hurdle: RoRWA =1.5%

3333
3333
GRB financial goals
33
Strong compound annual profit growth
Focus on existing markets and continue to diversify through products
Attractive returns and generation of net equity
Liability growth exceeding asset growth
Profit growth
Improved loan to deposit ratio
Depth, not breadth
Generation of net equity

343434
343434
Barclaycard
Valerie Soranno Keating, CEO Barclaycard30 June 2010
3535
353535
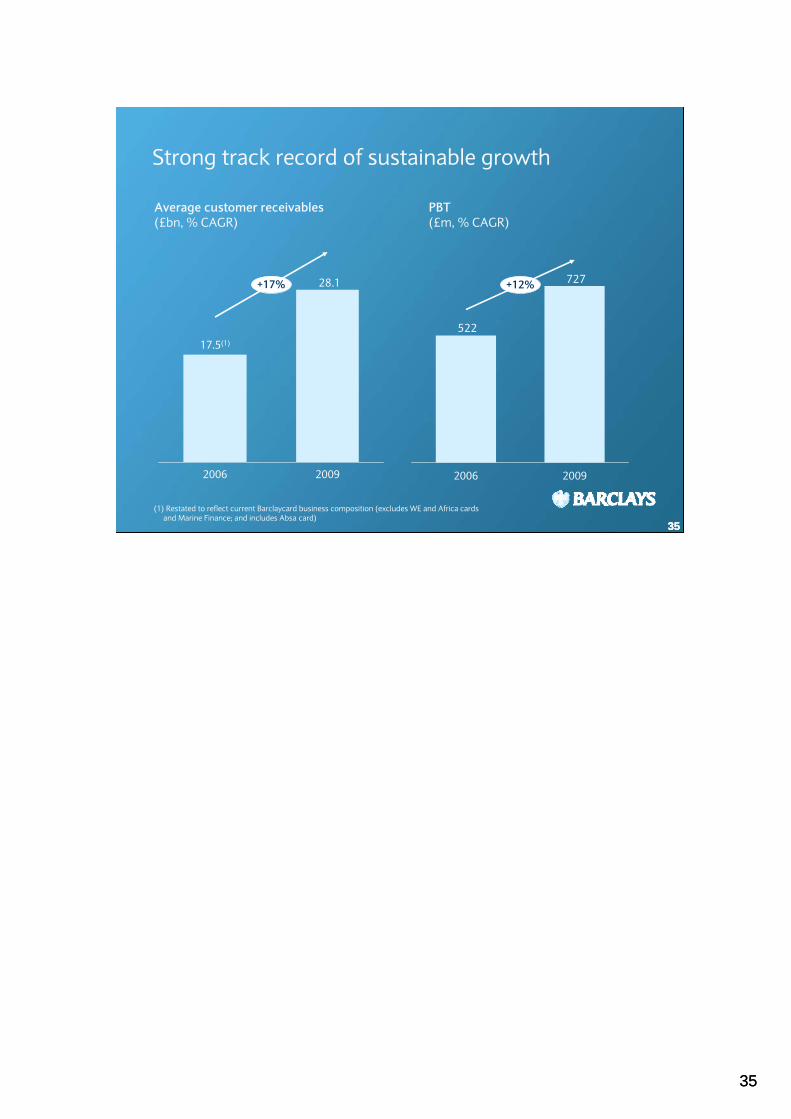
Strong track record of sustainable growth
28.1
17.5(1)
2006 2009
+17%
Average customer receivables(£bn, % CAGR)
PBT(£m, % CAGR)
727
522
2006 2009
+12%
(1) Restated to reflect current Barclaycard business composition (excludes WE and Africa cards and Marine Finance; and includes Absa card)

3636
363636
Strength from a diversified business model
Additional PaymentProducts
International ConsumerCredit Cards
UK ConsumerCredit Cards
Income 2009
37%
22%
41%
3737
373737
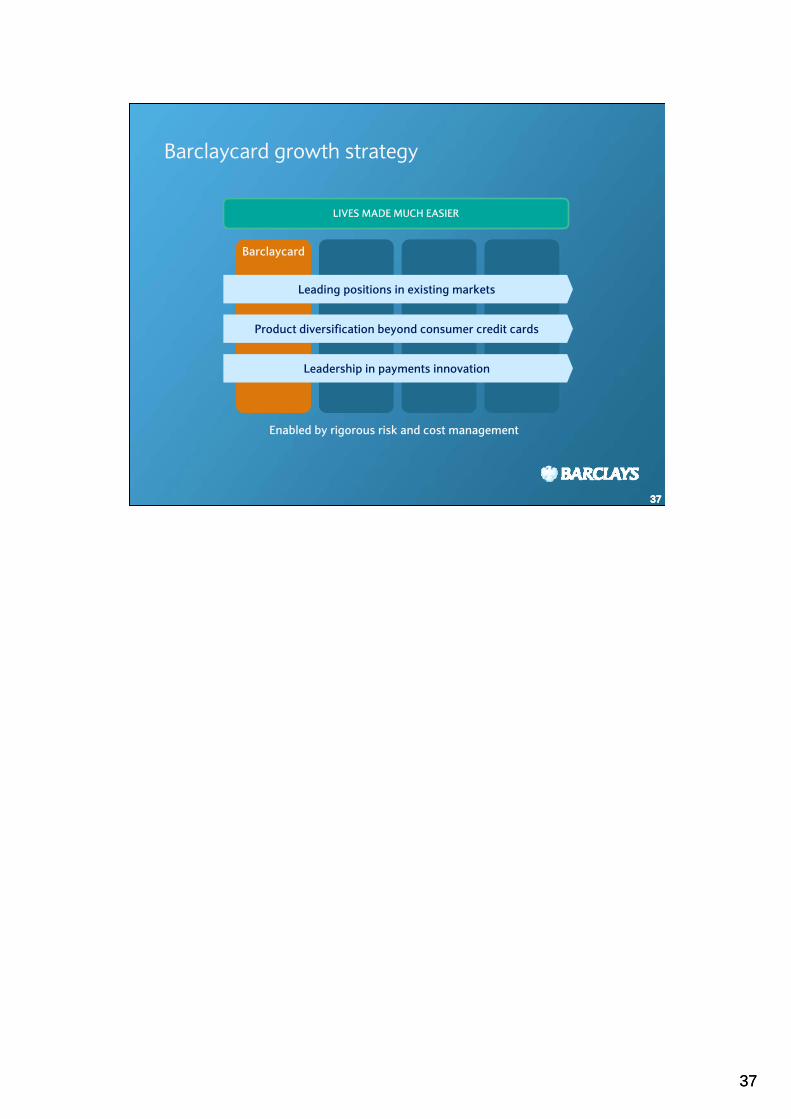
Barclaycard growth strategy
Barclaycard
LIVES MADE MUCH EASIER
Leadership in payments innovation
Product diversification beyond consumer credit cards
Leading positions in existing markets
Enabled by rigorous risk and cost management
3838
383838
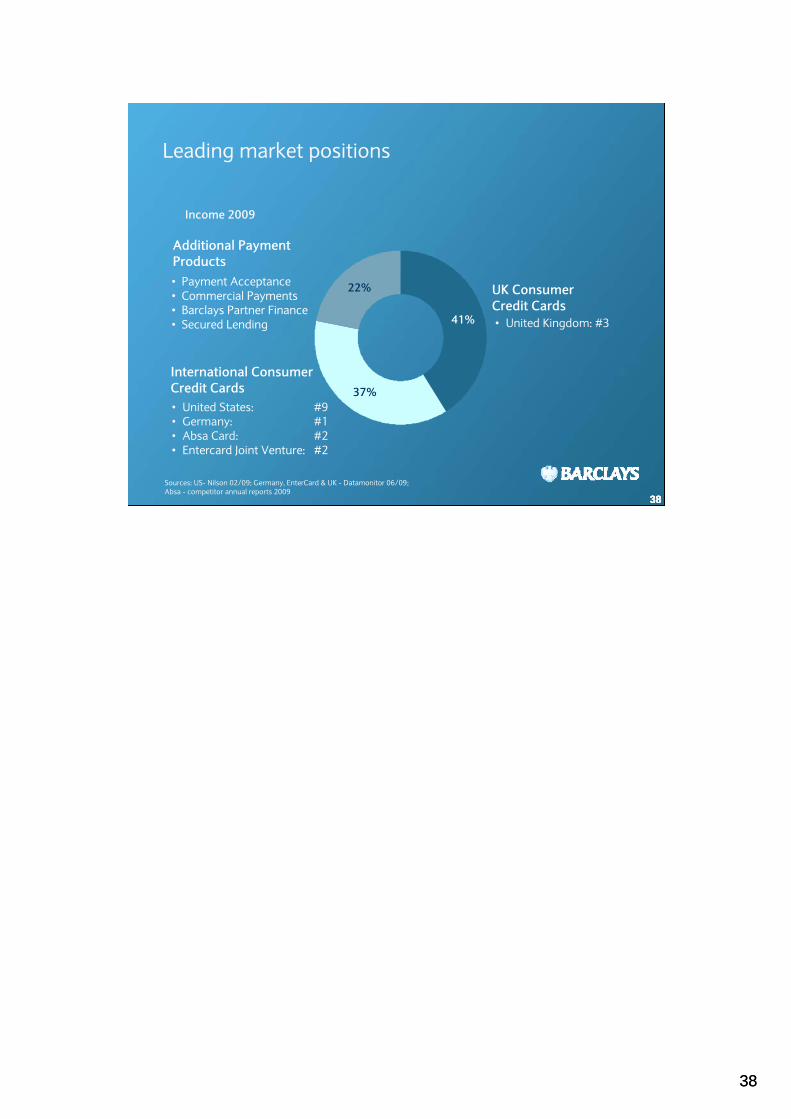
Leading market positions
• United Kingdom: #3
• United States: #9• Germany: #1• Absa Card: #2• Entercard Joint Venture: #2
• Payment Acceptance• Commercial Payments• Barclays Partner Finance• Secured Lending
Income 2009
Sources: US- Nilson 02/09; Germany, EnterCard & UK - Datamonitor 06/09; Absa - competitor annual reports 2009
Additional PaymentProducts
International ConsumerCredit Cards
UK ConsumerCredit Cards
37%
22%
41%
3939
3939
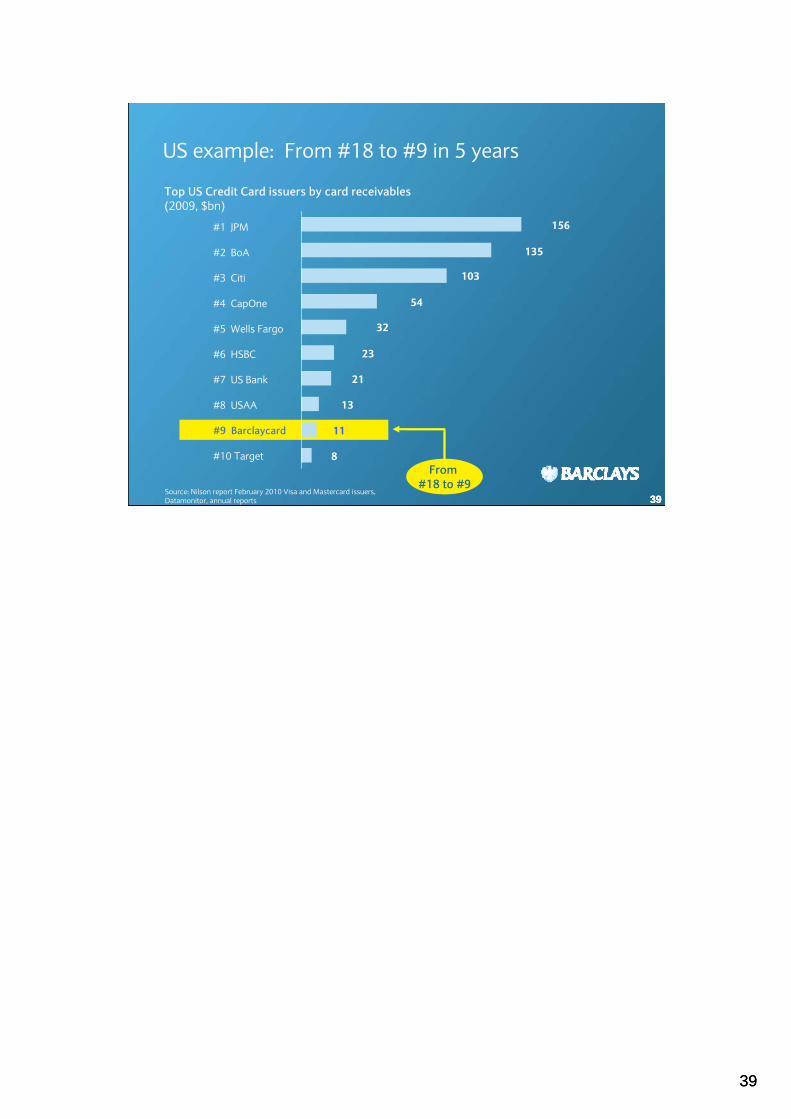
156
135
103
54
32
23
21
13
11
8
39
US example: From #18 to #9 in 5 years
Source: Nilson report February 2010 Visa and Mastercard issuers, Datamonitor, annual reports
#9 Barclaycard
#7 US Bank
#5 Wells Fargo
#4 CapOne
#10 Target
#8 USAA
#6 HSBC
#3 Citi
#2 BoA
#1 JPM
Top US Credit Card issuers by card receivables(2009, $bn)
From #18 to #9
40
40
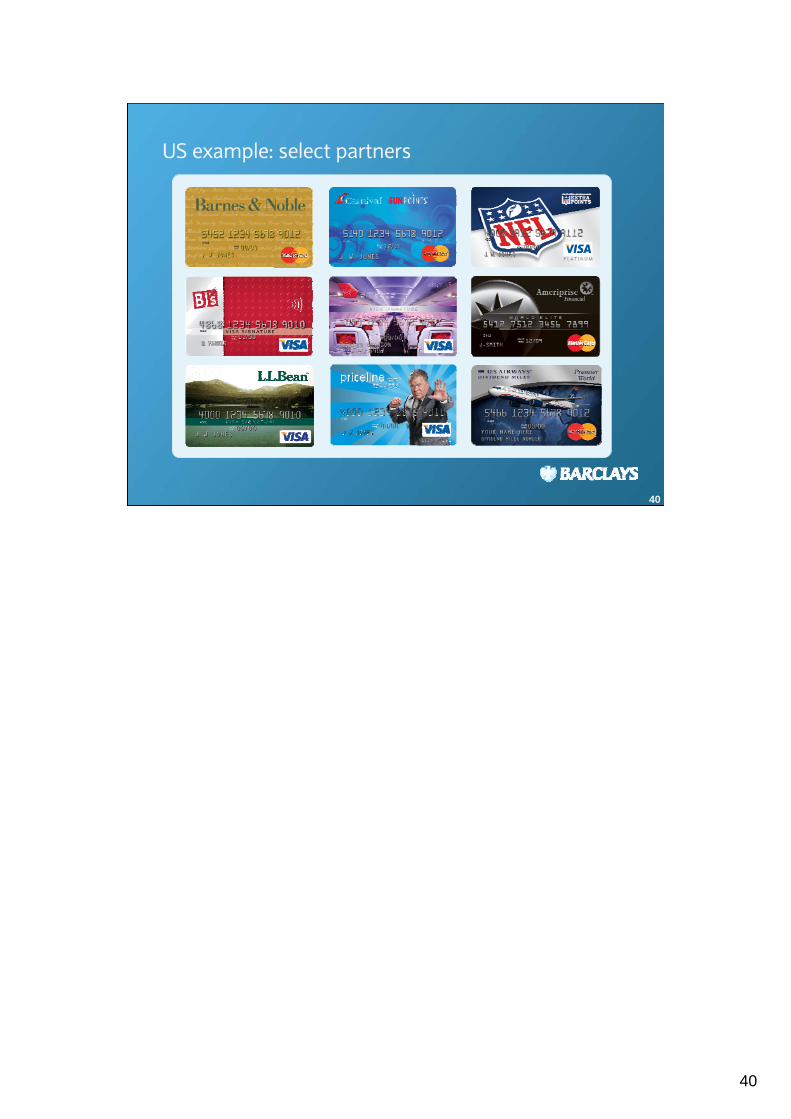
US example: select partners
41
4141
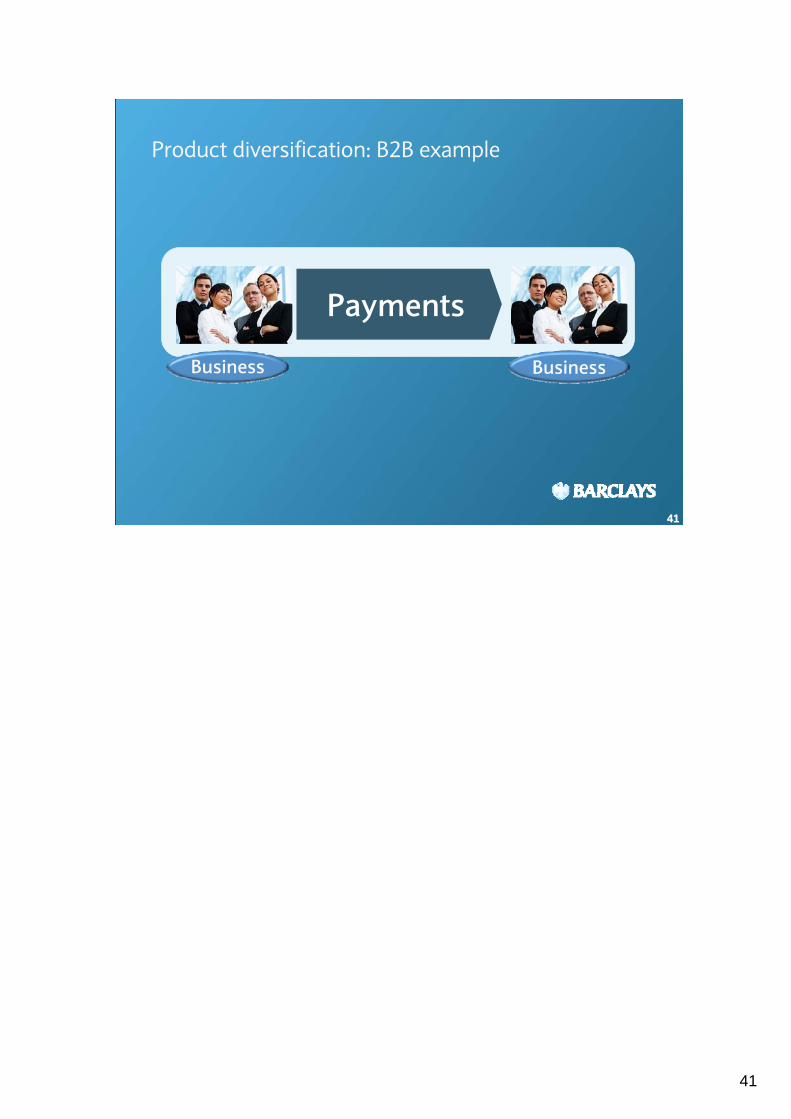
Product diversification: B2B example
Business Business
Payments
4242
424242
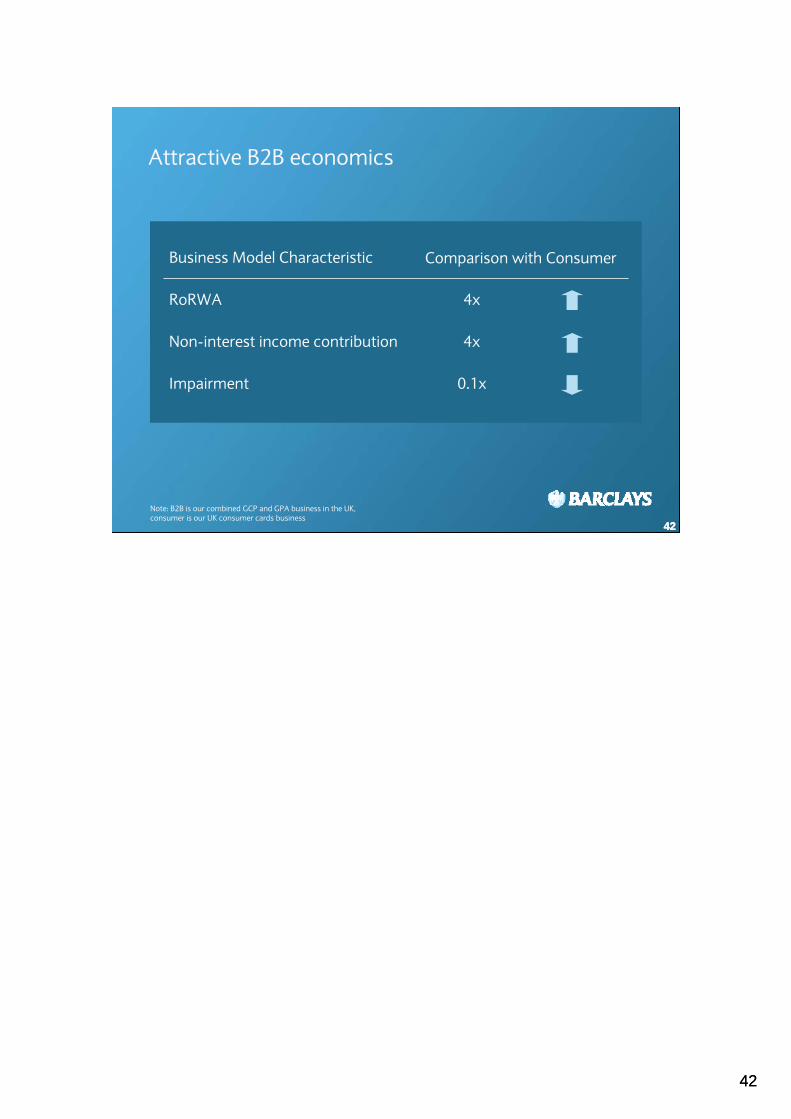
Attractive B2B economics
Note: B2B is our combined GCP and GPA business in the UK, consumer is our UK consumer cards business
Business Model Characteristic Comparison with Consumer
RoRWA 4x
Non-interest income contribution 4x
Impairment 0.1x
4343
434343
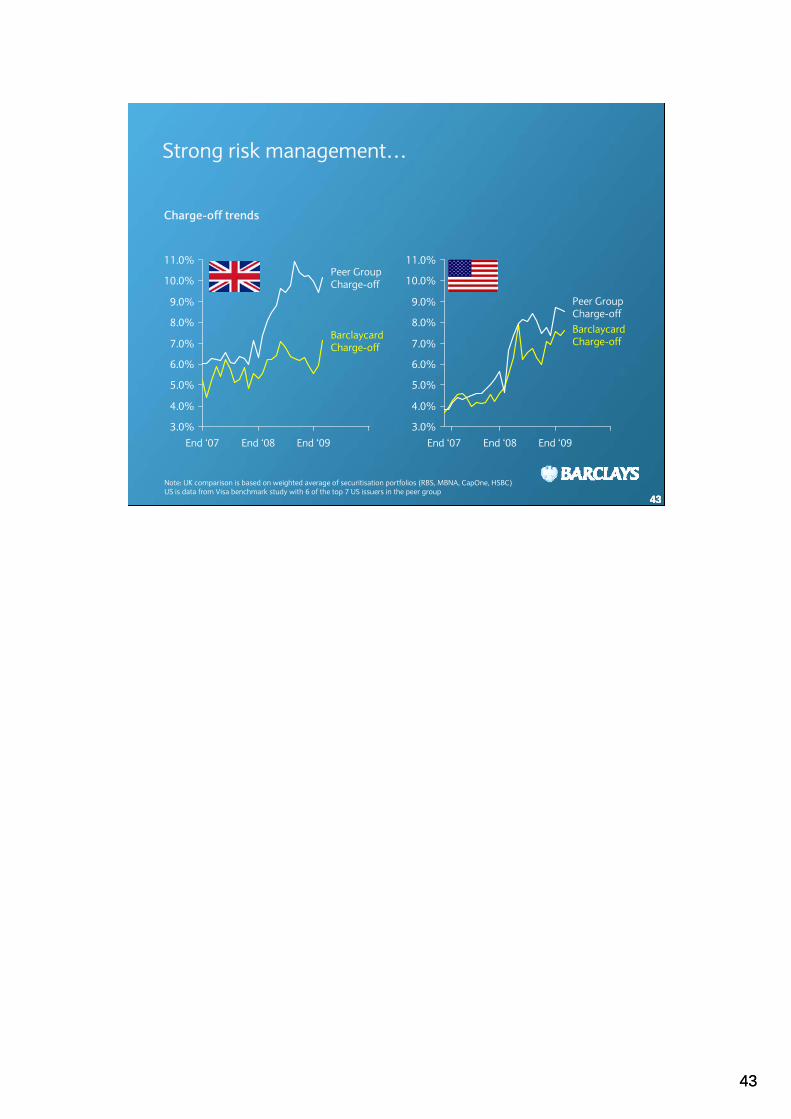
Strong risk management…
3.0%
4.0%
5.0%
6.0%
7.0%
8.0%
9.0%
10.0%
11.0%
End ‘09End ‘08End ‘07
Peer GroupCharge-offBarclaycardCharge-off
3.0%
4.0%
5.0%
6.0%
7.0%
8.0%
9.0%
10.0%
11.0%
End ‘09End ‘08End ‘07
Peer GroupCharge-off
BarclaycardCharge-off
Charge-off trends
Note: UK comparison is based on weighted average of securitisation portfolios (RBS, MBNA, CapOne, HSBC)US is data from Visa benchmark study with 6 of the top 7 US issuers in the peer group

4444
444444
Strong risk management…
1.0%
2.0%
3.0%
4.0%
5.0%
6.0%
7.0%
8.0%
End ‘09End ‘08End ‘07
30-day
90-day
1.0%
2.0%
3.0%
4.0%
5.0%
6.0%
7.0%
8.0%
End ’09End ‘08End ‘07
30-day
90-day
Barclaycard 30 and 90 day delinquency trends (%)
2010Delinquency
Trend
2010Delinquency
Trend
4545
454545
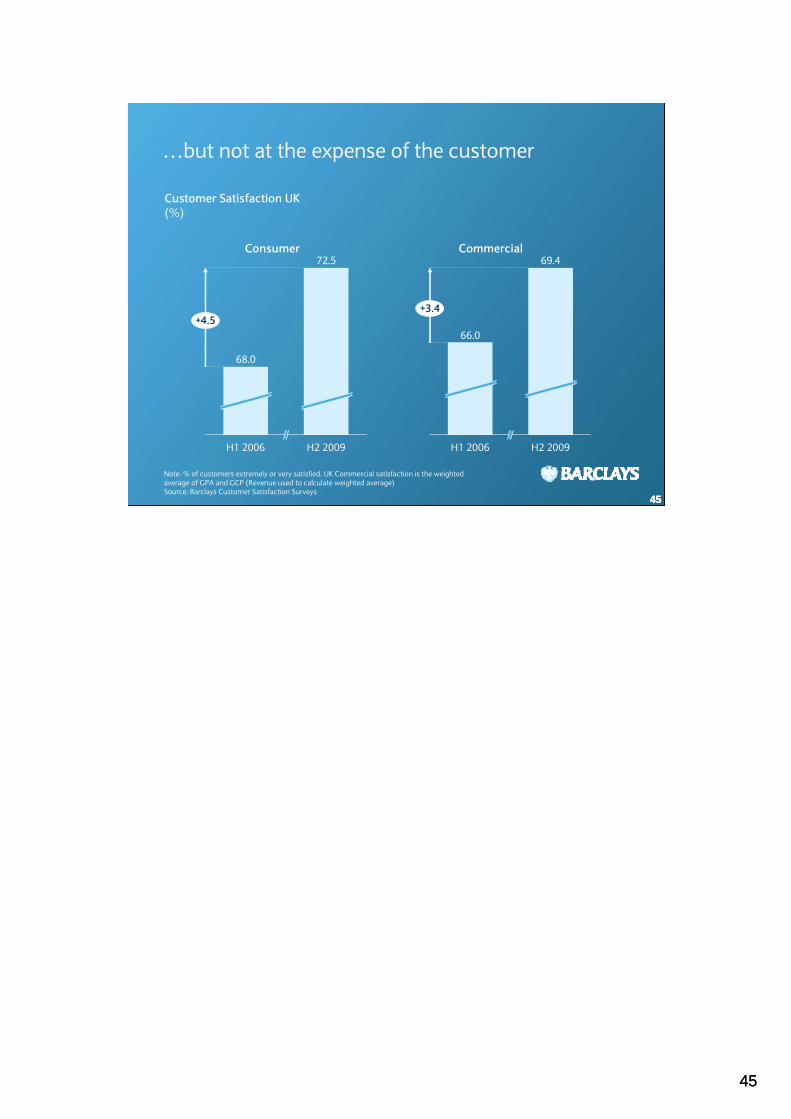
…but not at the expense of the customer
H1 2006
72.5
H2 2009
68.0
+4.5
Customer Satisfaction UK(%)
H1 2006
69.4
H2 2009
66.0
+3.4
Note: % of customers extremely or very satisfied. UK Commercial satisfaction is the weighted average of GPA and GCP (Revenue used to calculate weighted average)Source: Barclays Customer Satisfaction Surveys
Consumer Commercial
4646
4646
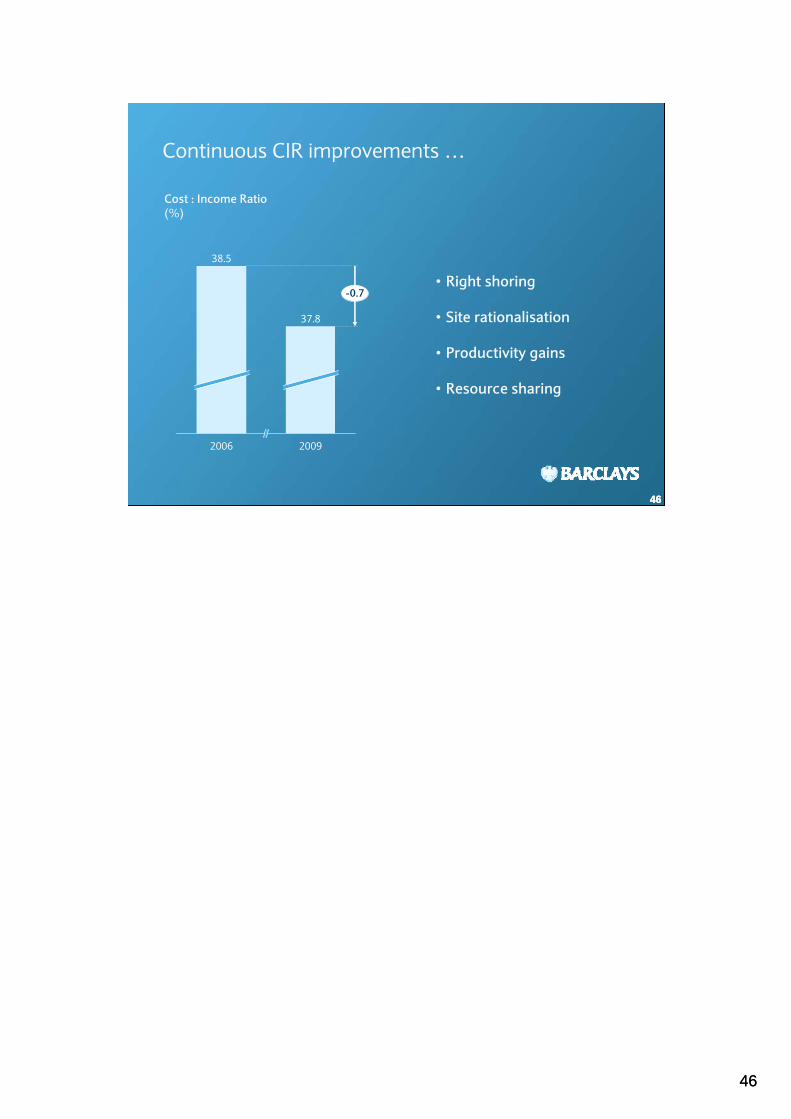
Continuous CIR improvements …
46
2006 2009
37.8
38.5
-0.7• Right shoring
• Site rationalisation
• Productivity gains
• Resource sharing
Cost : Income Ratio(%)
4747
474747
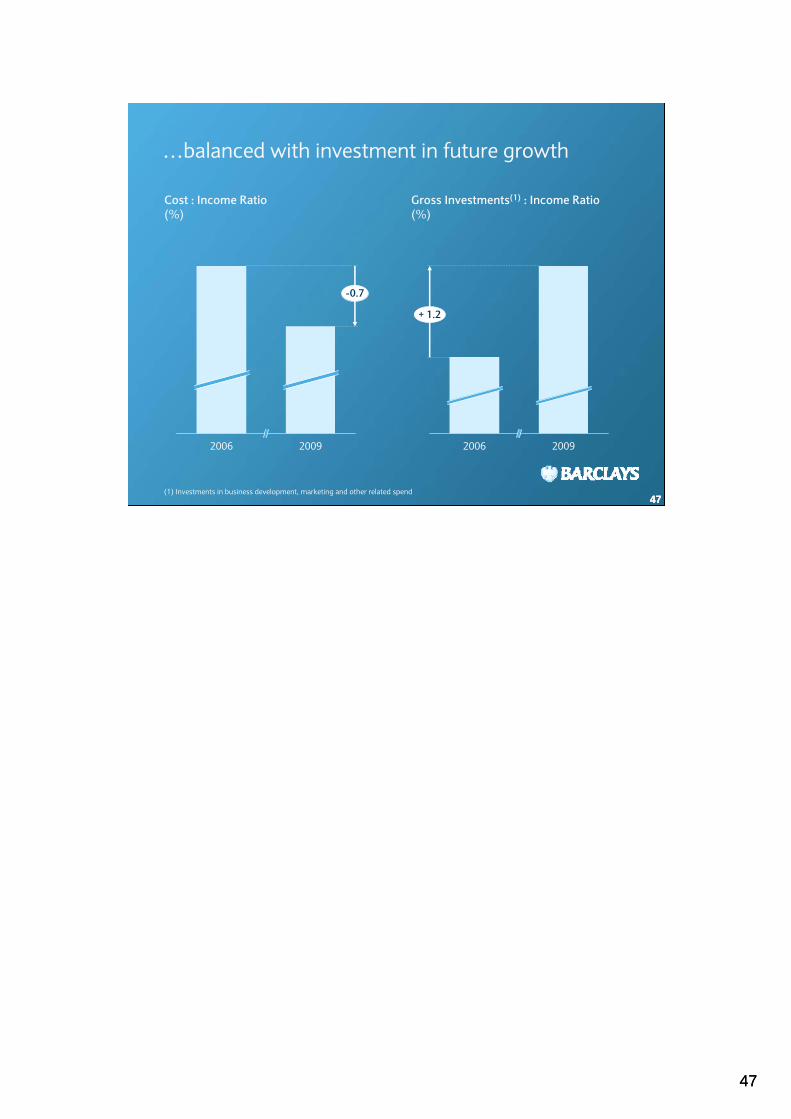
…balanced with investment in future growth
2006 2009
-0.7
2006 2009
+ 1.2
Gross Investments(1) : Income Ratio(%)
Cost : Income Ratio(%)
(1) Investments in business development, marketing and other related spend

48
484848

49
494949

50
505050

51
515151

52
525252
53
535353
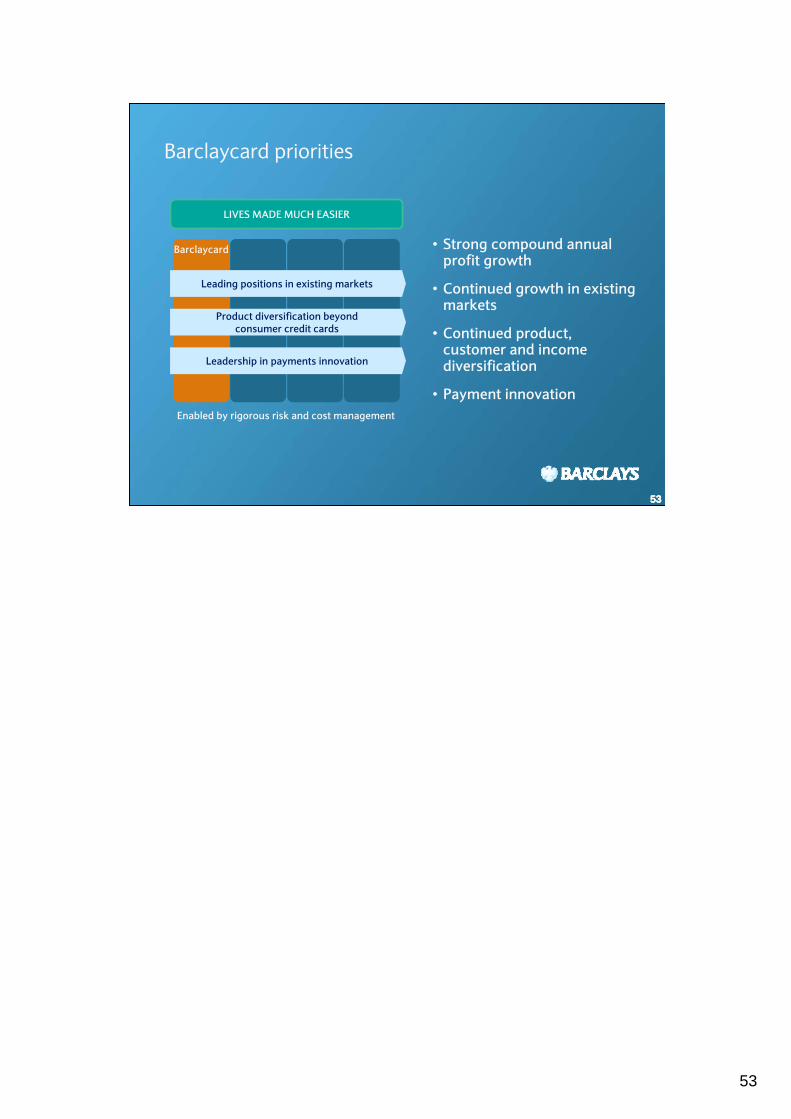
Barclaycard priorities
• Strong compound annual profit growth
• Continued growth in existing markets
• Continued product, customer and income diversification
• Payment innovation
Barclaycard
LIVES MADE MUCH EASIER
Leadership in payments innovation
Product diversification beyondconsumer credit cards
Leading positions in existing markets
Enabled by rigorous risk and cost management
54
545454
Western Europe Retail Banking
Leo Salom, CEO Western Europe Retail Banking30 June 2010
55
5555
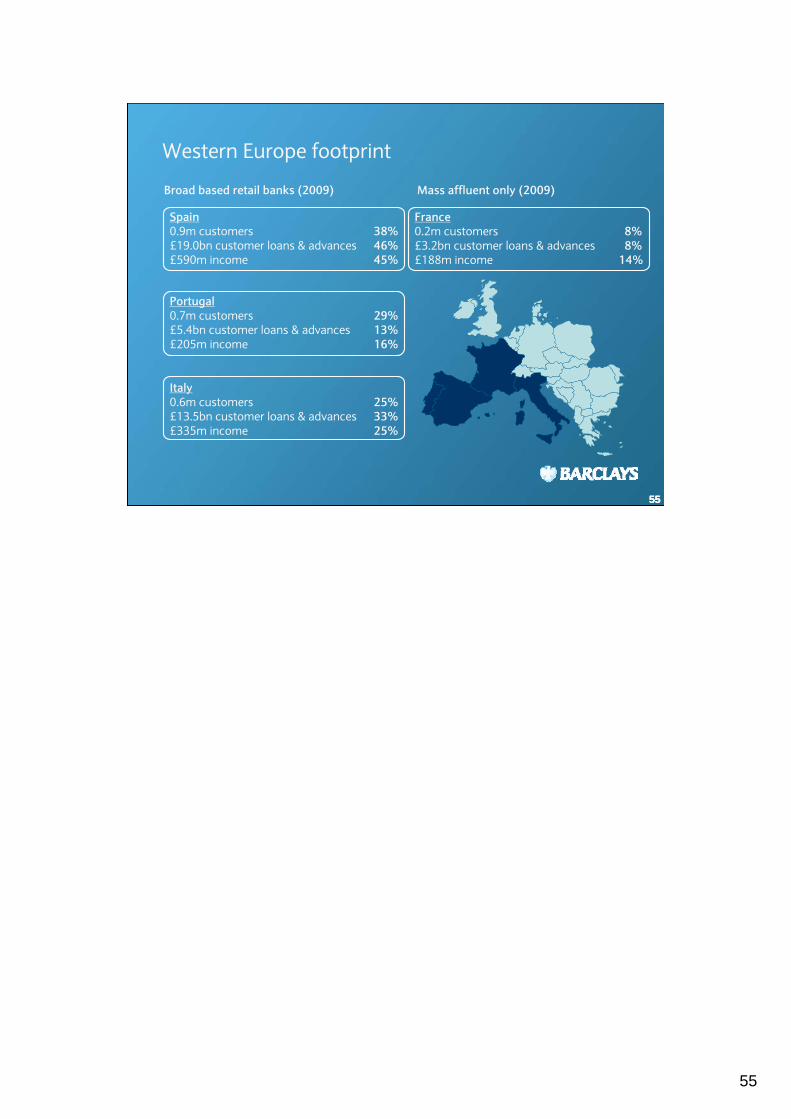
Western Europe footprint
55
France0.2m customers 8%£3.2bn customer loans & advances 8%£188m income 14%
Mass affluent only (2009)
Italy0.6m customers 25%£13.5bn customer loans & advances 33%£335m income 25%
Portugal0.7m customers 29%£5.4bn customer loans & advances 13%£205m income 16%
Spain0.9m customers 38%£19.0bn customer loans & advances 46%£590m income 45%
Broad based retail banks (2009)
56
565656
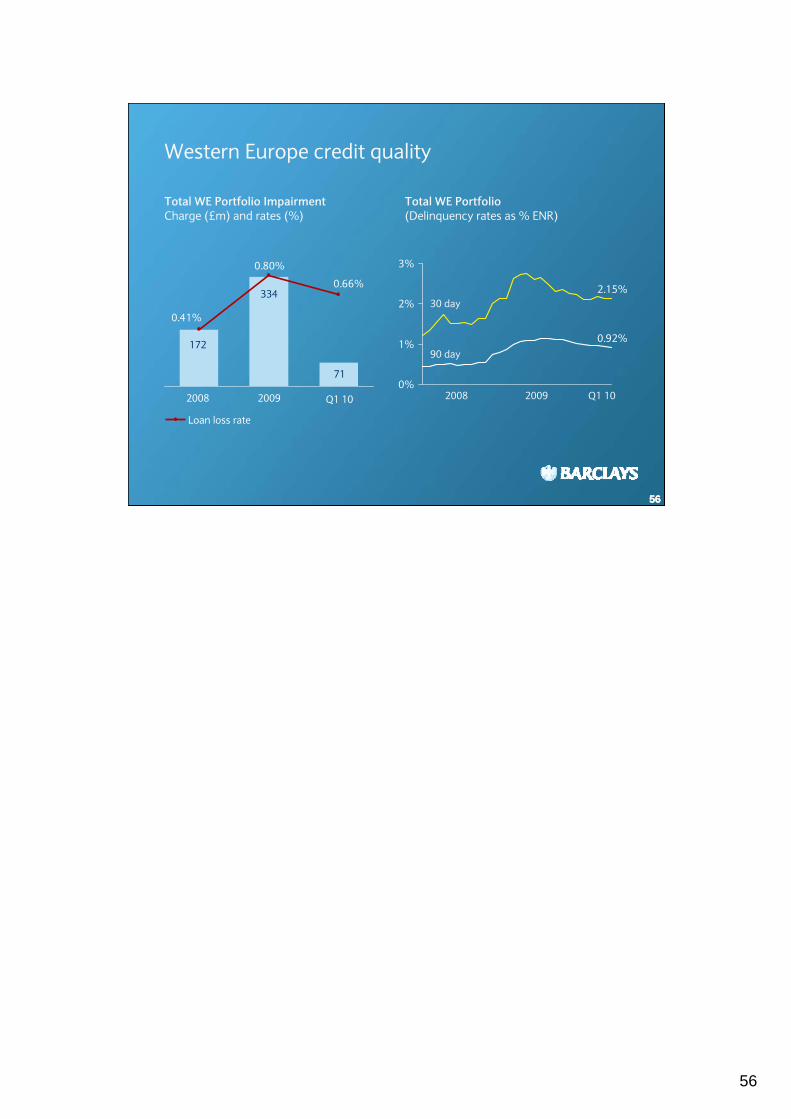
Total WE Portfolio(Delinquency rates as % ENR)
Total WE Portfolio ImpairmentCharge (£m) and rates (%)
Western Europe credit quality
0.66%
0.80%
0.41%
2009
334
2008
172
Loan loss rate
71
Q1 10
2.15%
0.92%
0%
1%
2%
3%
2008 2009 Q1 10
30 day
90 day
57
575757
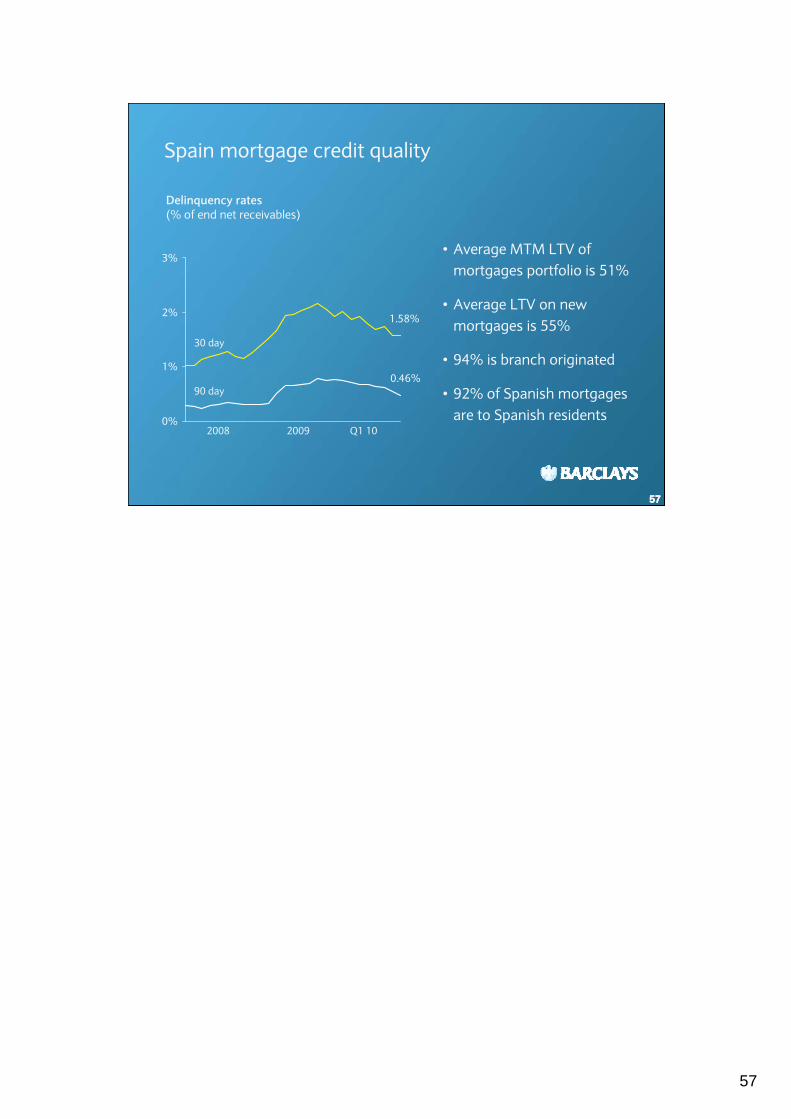
Delinquency rates(% of end net receivables)
• Average MTM LTV of mortgages portfolio is 51%
• Average LTV on new mortgages is 55%
• 94% is branch originated
• 92% of Spanish mortgages are to Spanish residents
Spain mortgage credit quality
1.58%
0.46%
0%
1%
2%
3%
30 day
90 day
2008 2009 Q1 10
58
585858
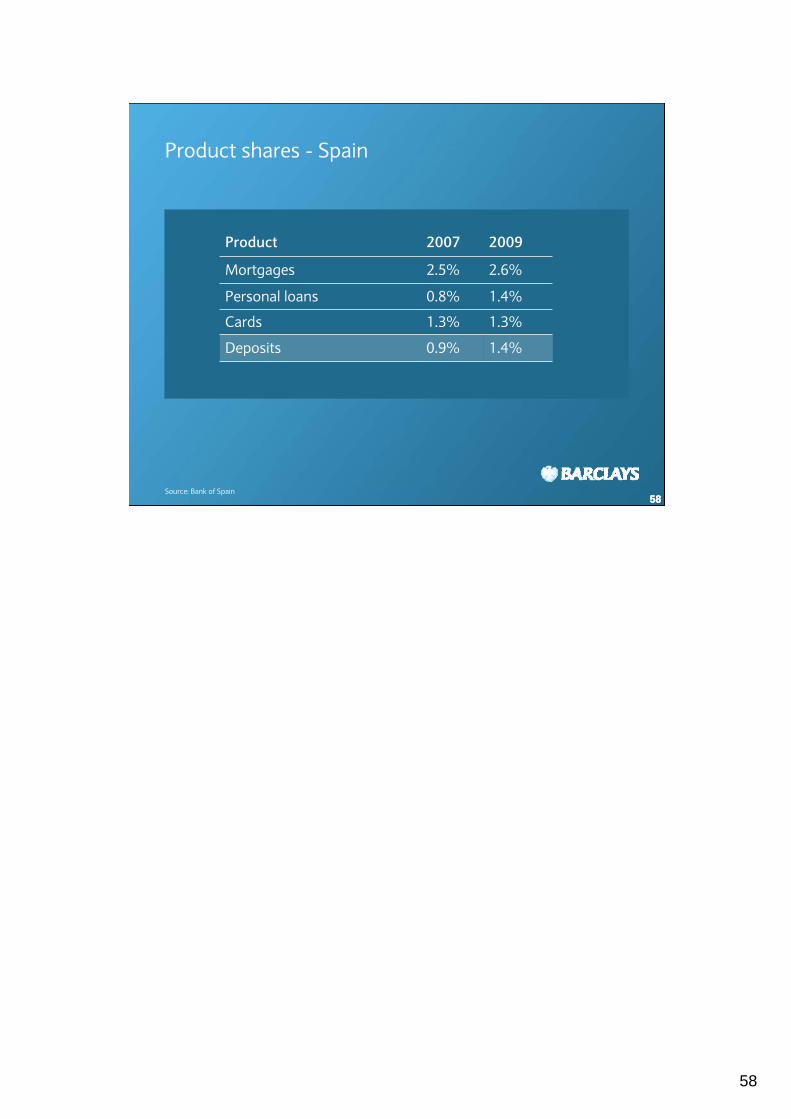
Product shares - Spain
Source: Bank of Spain
Product 2007 2009
Mortgages 2.5% 2.6%
Personal loans 0.8% 1.4%
Cards 1.3% 1.3%
Deposits 0.9% 1.4%
59
595959
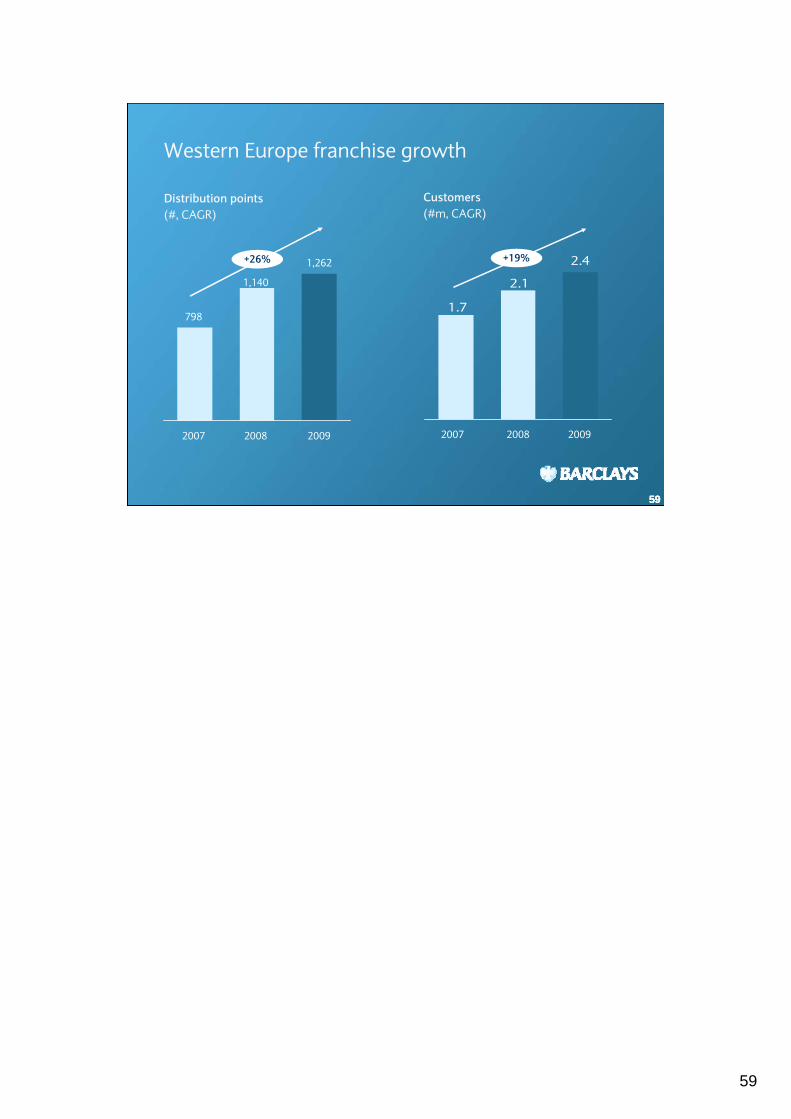
Customers(#m, CAGR)
Distribution points(#, CAGR)
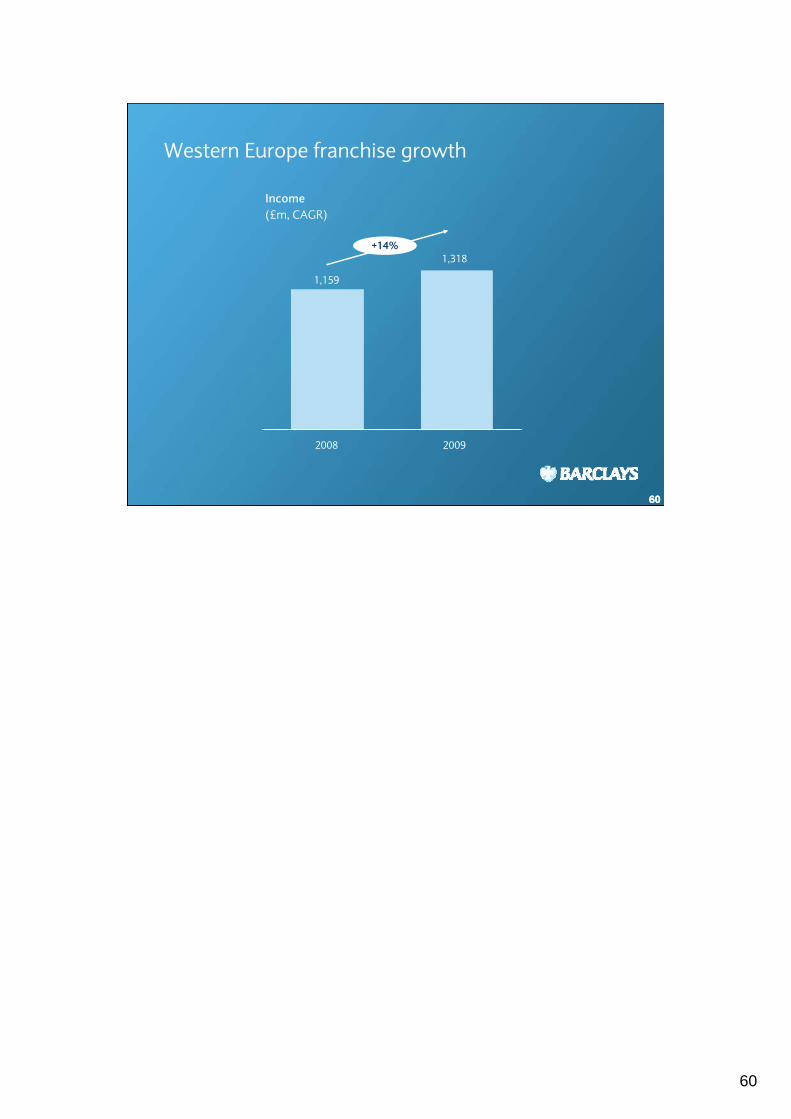
Western Europe franchise growth
2.4
2.1
1.7
2007
+19%
20092008
+26%
2009
1,262
2007
798
2008
1,140
60
606060
Income(£m, CAGR)
Western Europe franchise growth
+14%
2009
1,318
2008
1,159
61
616161
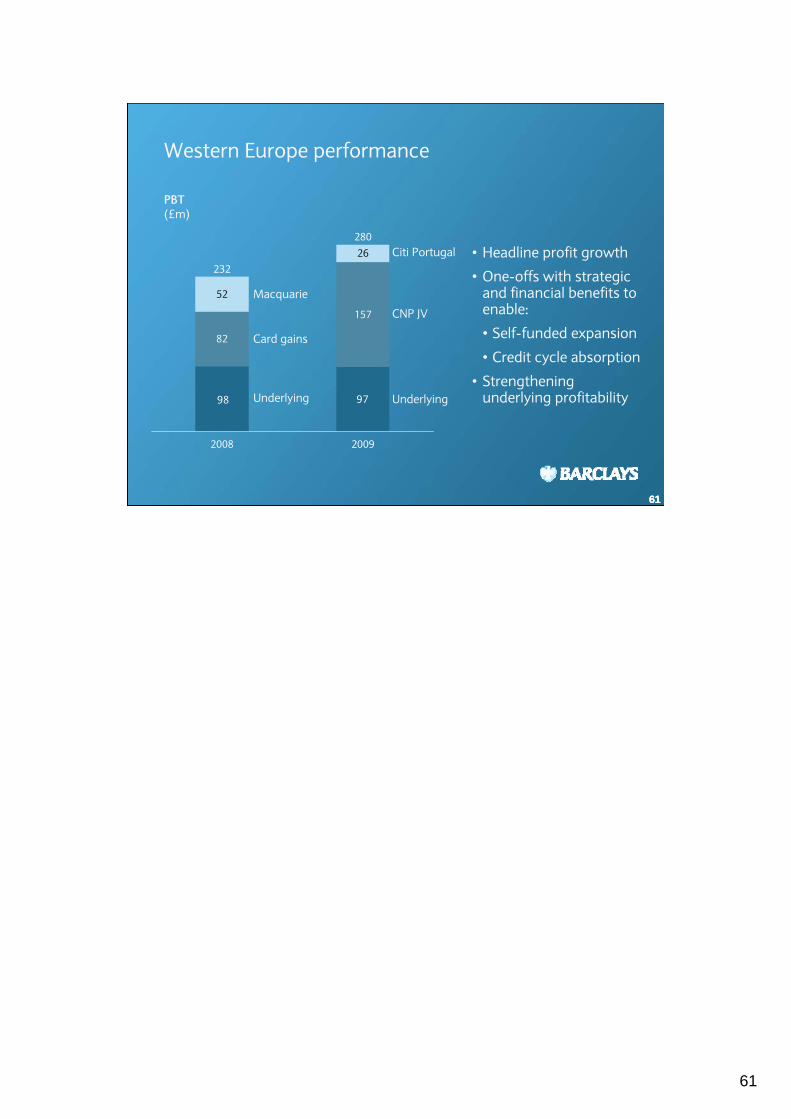
PBT (£m)
• Headline profit growth
• One-offs with strategic and financial benefits to enable:
• Self-funded expansion
• Credit cycle absorption
• Strengthening underlying profitability
Western Europe performance
9798
280
232
2009
157
26
2008
82
52
Card gains
Macquarie
Underlying
CNP JV
Underlying
Citi Portugal
62
626262
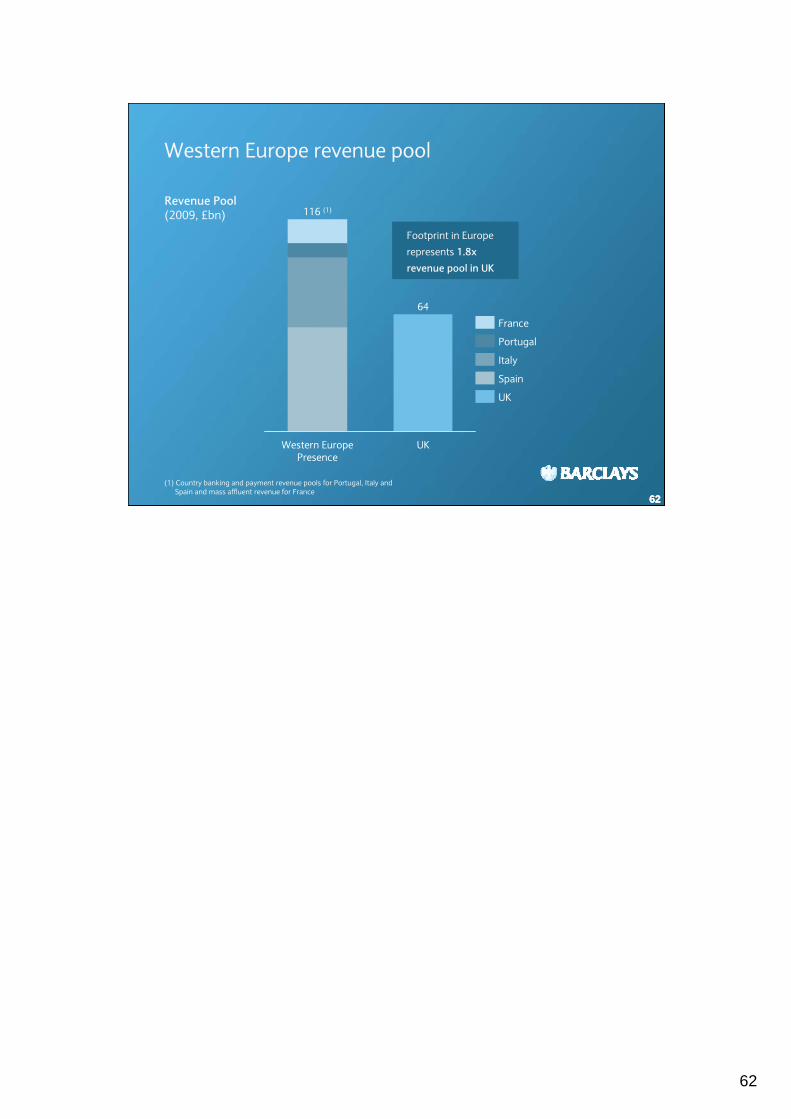
Footprint in Europe
represents 1.8x revenue pool in UK
Western Europe revenue pool
UK
116 (1)
Western EuropePresence
64
UK
France
Portugal
Italy
Spain
Revenue Pool (2009, £bn)
(1) Country banking and payment revenue pools for Portugal, Italy and Spain and mass affluent revenue for France
63
6363
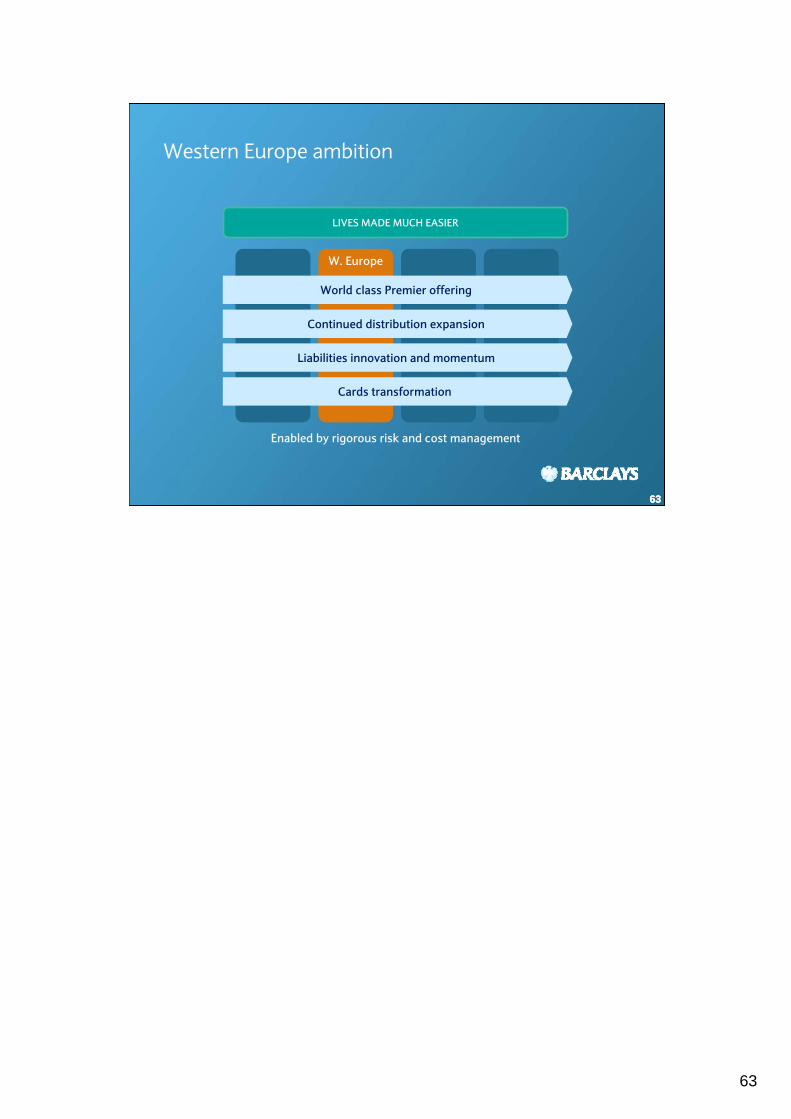
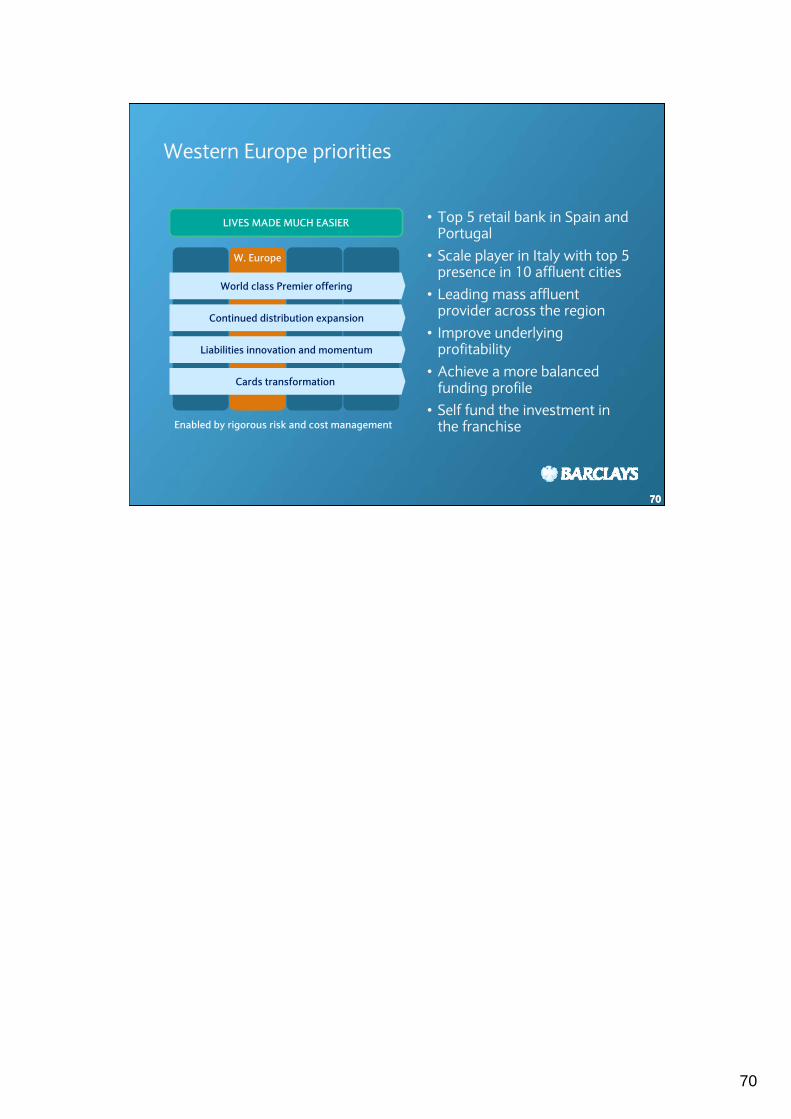
Western Europe ambition
63
W. Europe
LIVES MADE MUCH EASIER
Continued distribution expansion
World class Premier offering
Liabilities innovation and momentum
Cards transformation
Enabled by rigorous risk and cost management
64
646464
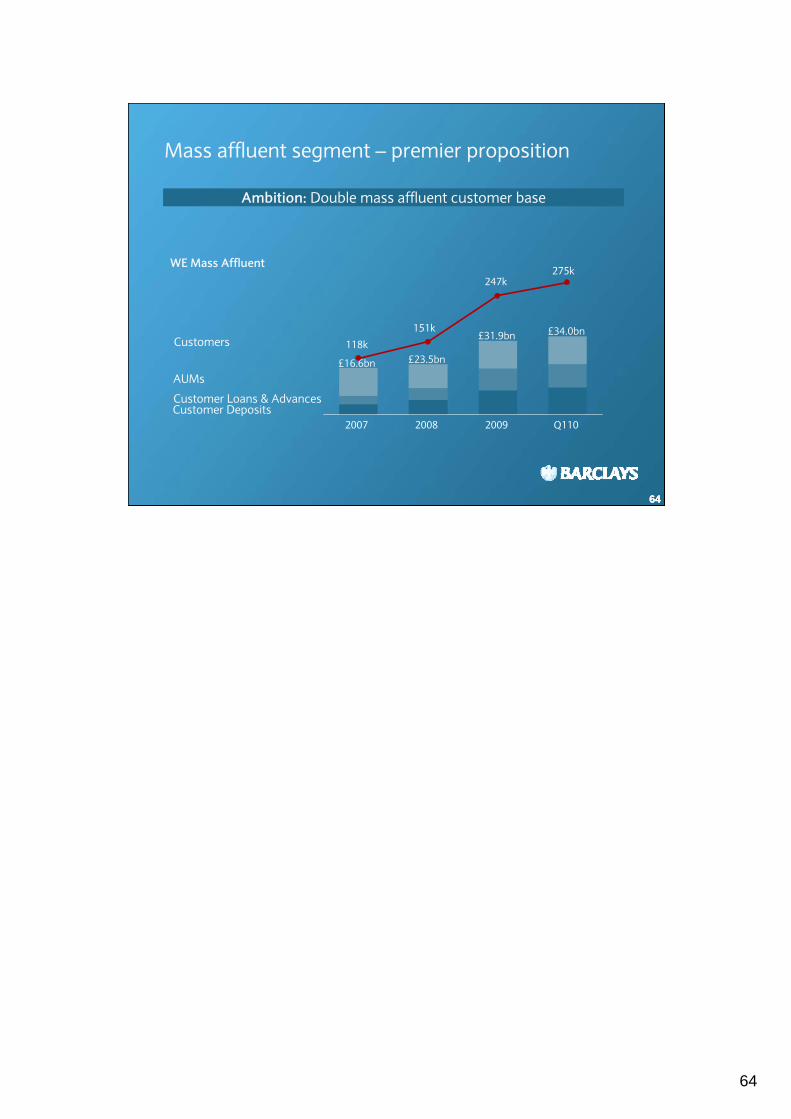
Ambition: Double mass affluent customer base
£16.6bn £23.5bn
£31.9bn £34.0bn
Mass affluent segment – premier proposition
Customers 118k
2008
247k
2009
151k
2007
275k
Q110
AUMs
Customer Loans & AdvancesCustomer Deposits
WE Mass Affluent
65
6565
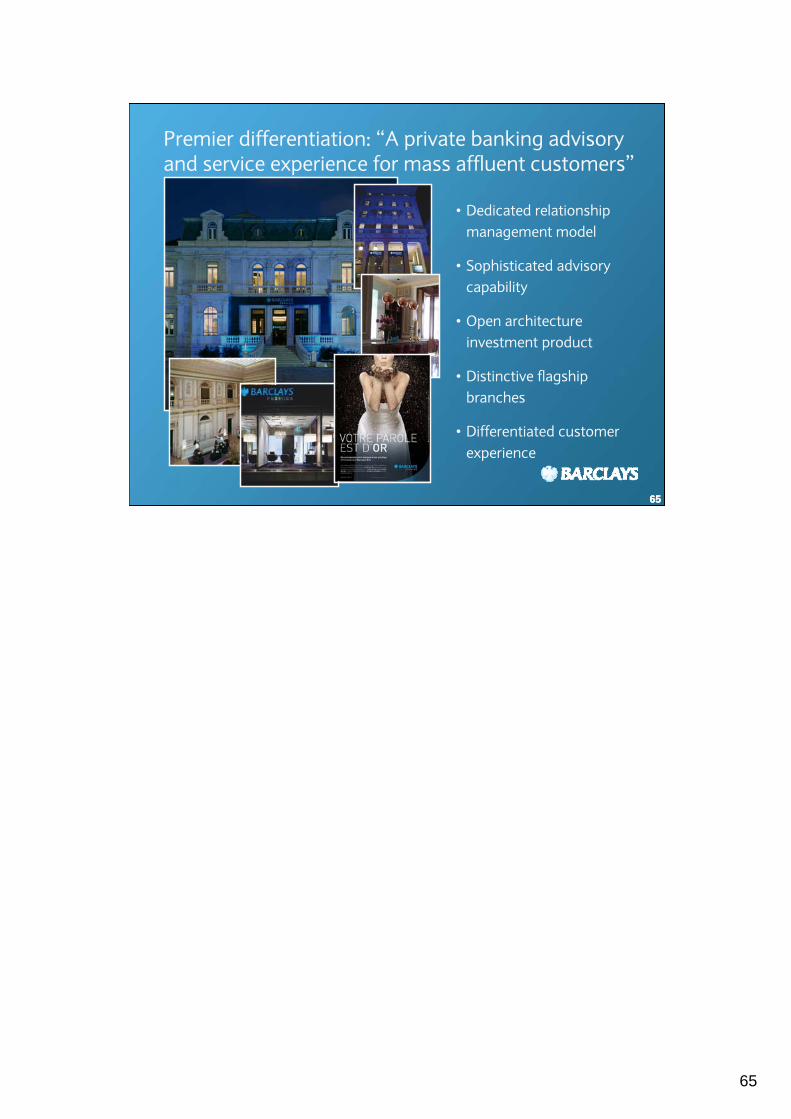
Premier differentiation: “A private banking advisory and service experience for mass affluent customers”
65
• Dedicated relationship management model
• Sophisticated advisory capability
• Open architecture investment product
• Distinctive flagship branches
• Differentiated customer experience
66
666666
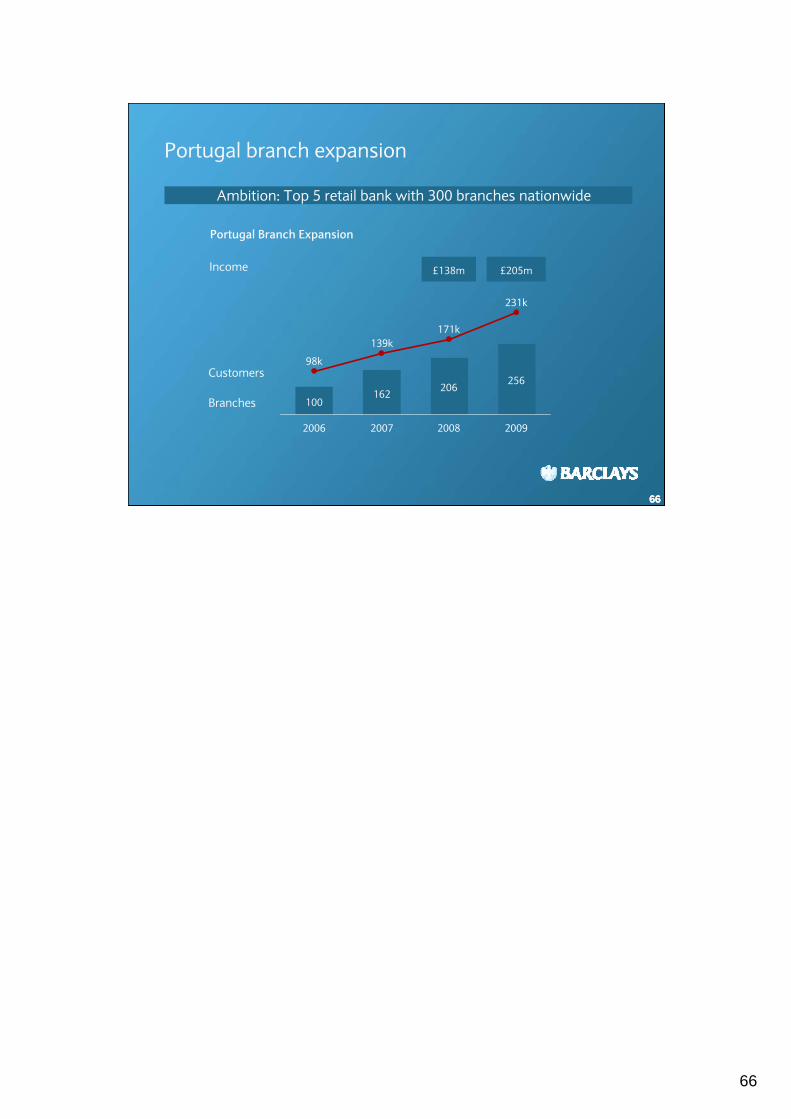
Ambition: Top 5 retail bank with 300 branches nationwide
£138m £205mIncome
Portugal branch expansion
139k
2006
100
98k
20092008
206256
171k
2007
231k
162
Customers
Portugal Branch Expansion
Branches
67
676767
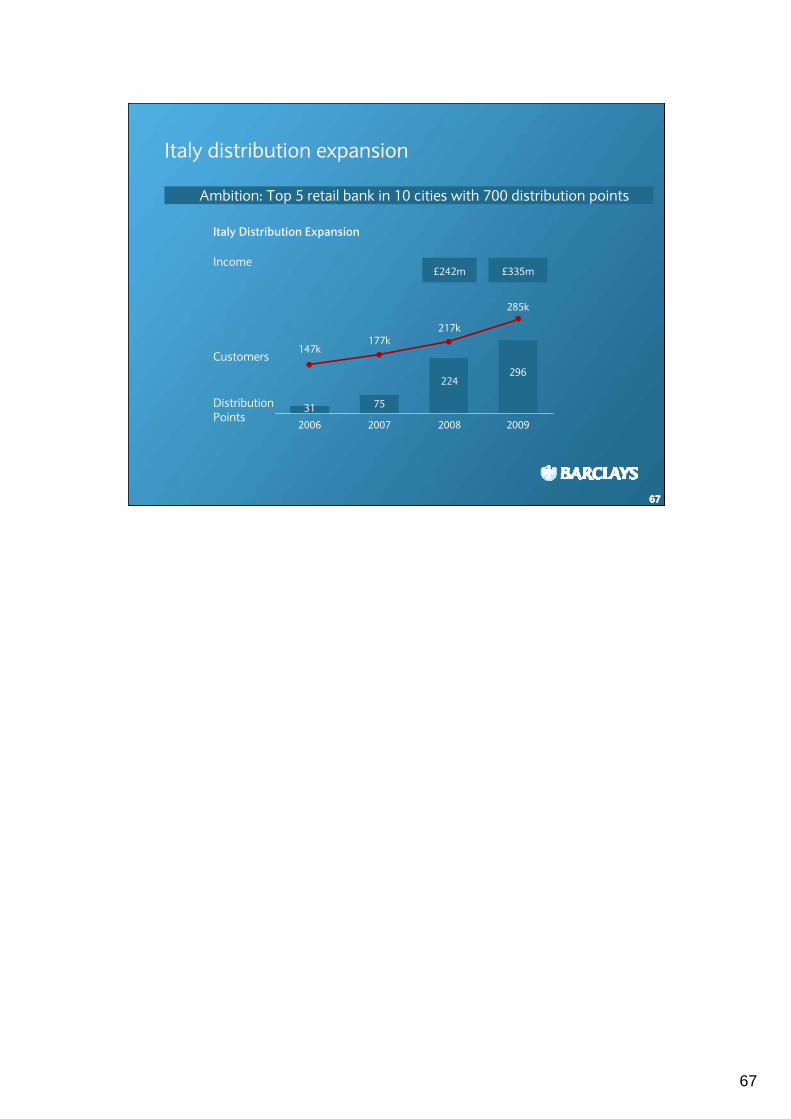
Italy distribution expansion
Ambition: Top 5 retail bank in 10 cities with 700 distribution points
217k
20092008
296
285k
224
2007
75
177k
2006
147k
31
Customers
Distribution Points
£242m £335mIncome
Italy Distribution Expansion
68
686868
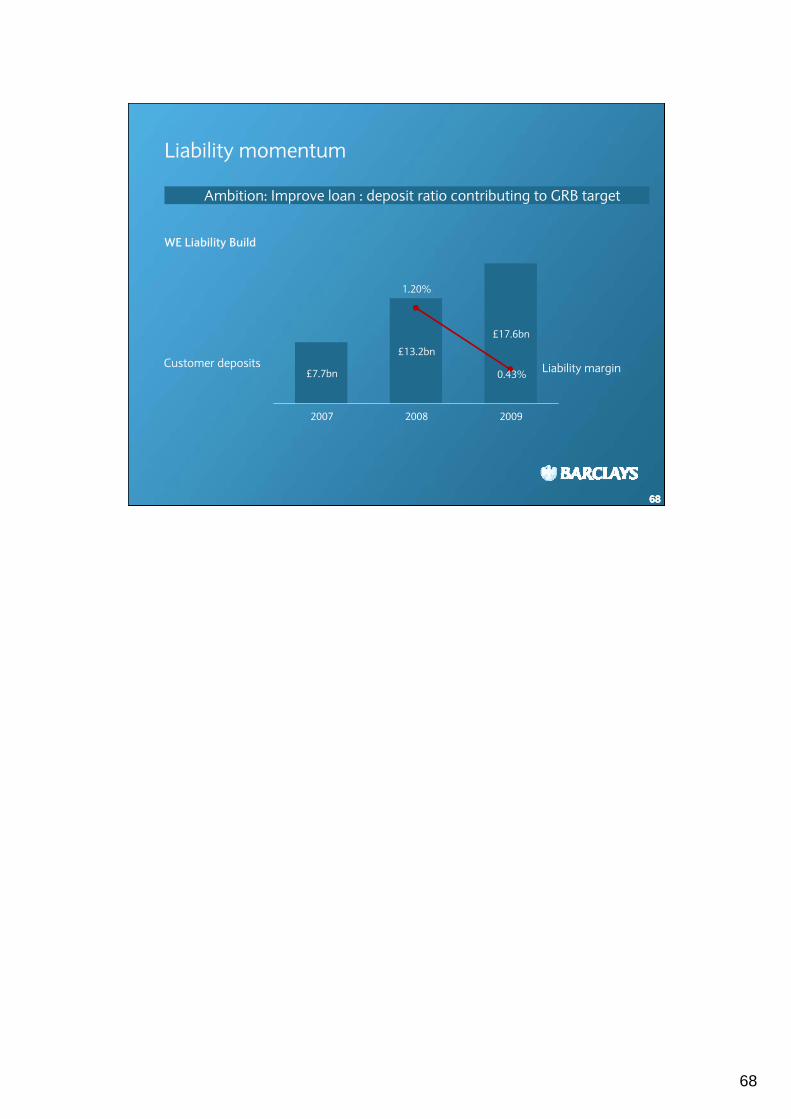
Liability momentum
Ambition: Improve loan : deposit ratio contributing to GRB target
2009
£17.6bn
2008
£13.2bn
2007
£7.7bn Liability marginCustomer deposits0.43%
1.20%
WE Liability Build
69
696969
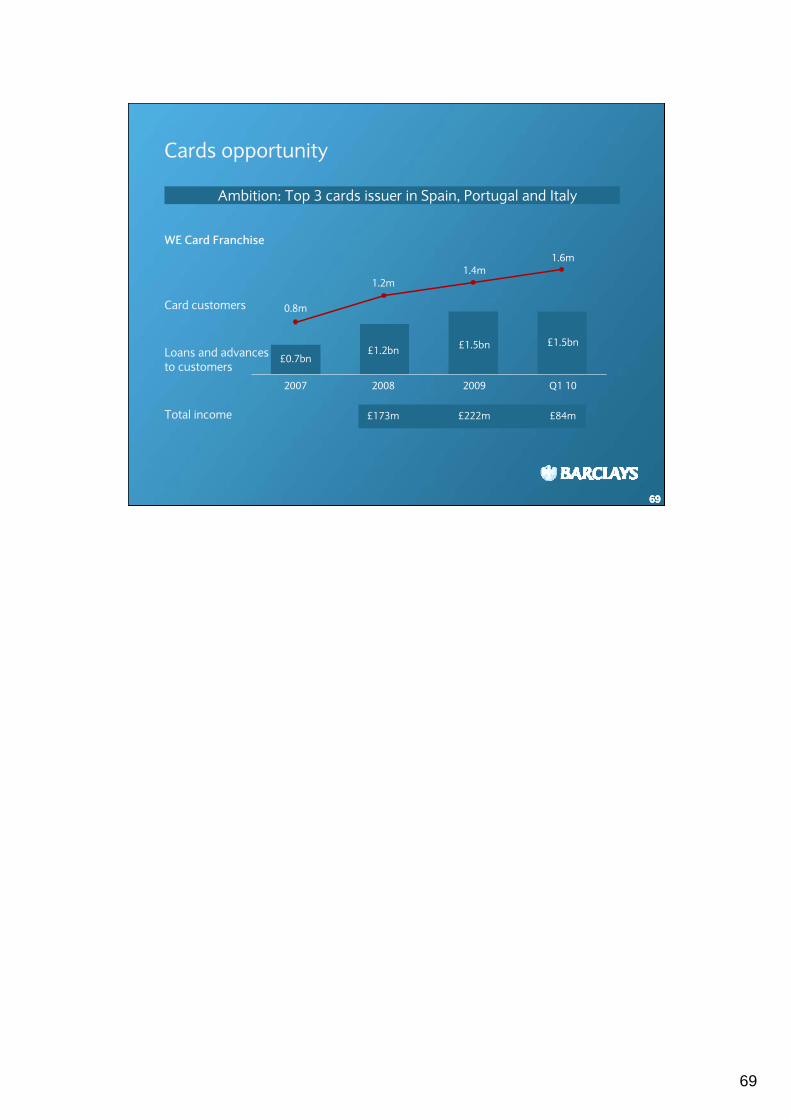
Ambition: Top 3 cards issuer in Spain, Portugal and Italy
Total income
Cards opportunity
1.2m
2007
£0.7bn
0.8m
Q1 102009
£1.5bn £1.5bn
1.4m
2008
1.6m
£1.2bn
Card customers
Loans and advances to customers
£173m £222m £84m
WE Card Franchise
70
707070
Western Europe priorities
• Top 5 retail bank in Spain and Portugal
• Scale player in Italy with top 5 presence in 10 affluent cities
• Leading mass affluent provider across the region
• Improve underlying profitability
• Achieve a more balanced funding profile
• Self fund the investment in the franchise
W. Europe
LIVES MADE MUCH EASIER
Continued distribution expansion
World class Premier offering
Liabilities innovation and momentum
Cards transformation
Enabled by rigorous risk and cost management

7171
717171
Barclays Africa
Vinit Chandra, CEO Barclays Africa30 June 2010
72
727272
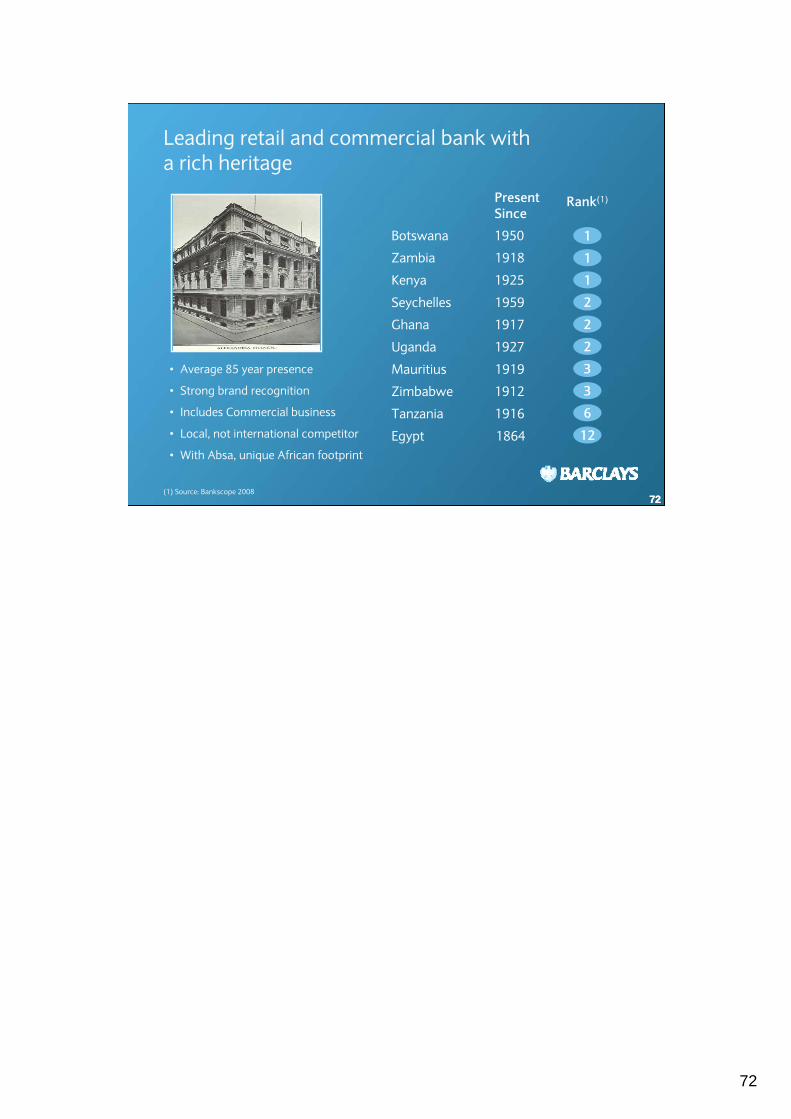
Leading retail and commercial bank with a rich heritage
Botswana 1950
Zambia 1918
Kenya 1925
Seychelles 1959
Ghana 1917
Uganda 1927
Mauritius 1919
Zimbabwe 1912
Tanzania 1916
Egypt 1864
Present Since
Rank(1)
1
1
1
2
2
2
3
3
6
12
• Average 85 year presence
• Strong brand recognition
• Includes Commercial business
• Local, not international competitor
• With Absa, unique African footprint
(1) Source: Bankscope 2008
73
737373
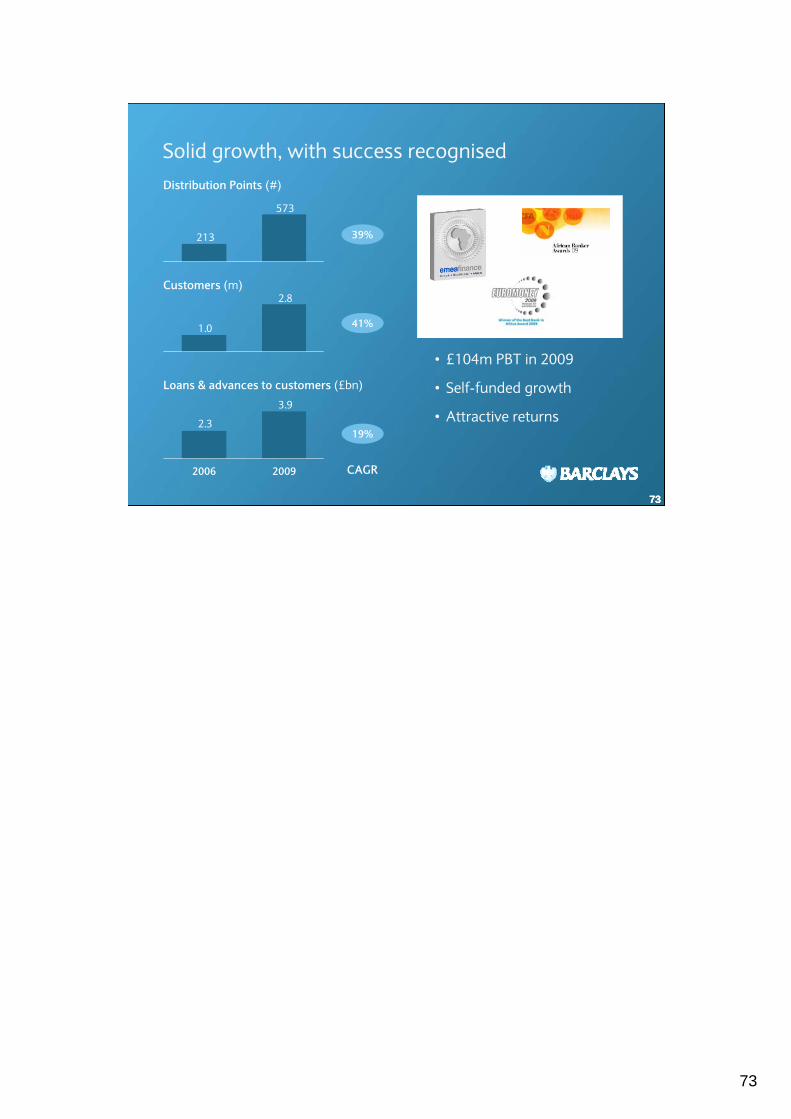
Solid growth, with success recognised
• £104m PBT in 2009
• Self-funded growth
• Attractive returns
Distribution Points (#)
Customers (m)
39%
41%
CAGR
Loans & advances to customers (£bn)
19%
3.9
2.3
20092006
2.8
1.0
573
213
74
747474
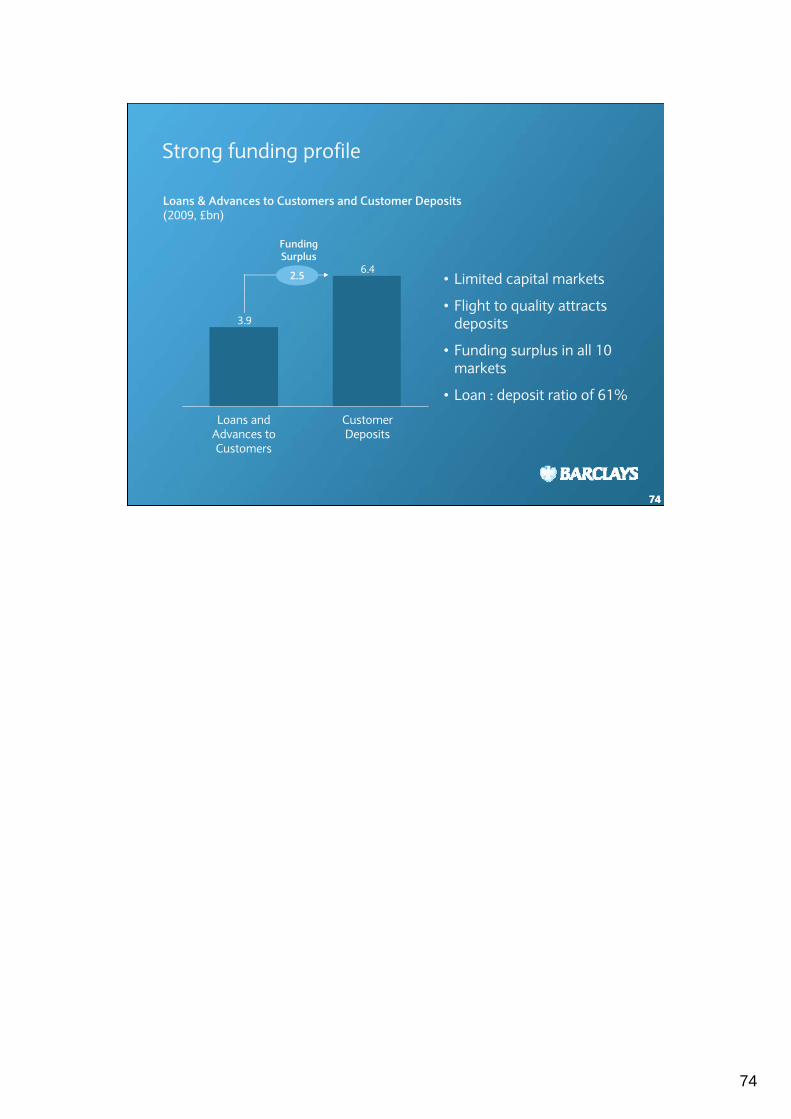
Strong funding profile
• Limited capital markets
• Flight to quality attracts deposits
• Funding surplus in all 10 markets
• Loan : deposit ratio of 61%
Loans & Advances to Customers and Customer Deposits(2009, £bn)
6.4
3.9
Customer Deposits
Loans and Advances to Customers
2.5
Funding Surplus
75
757575
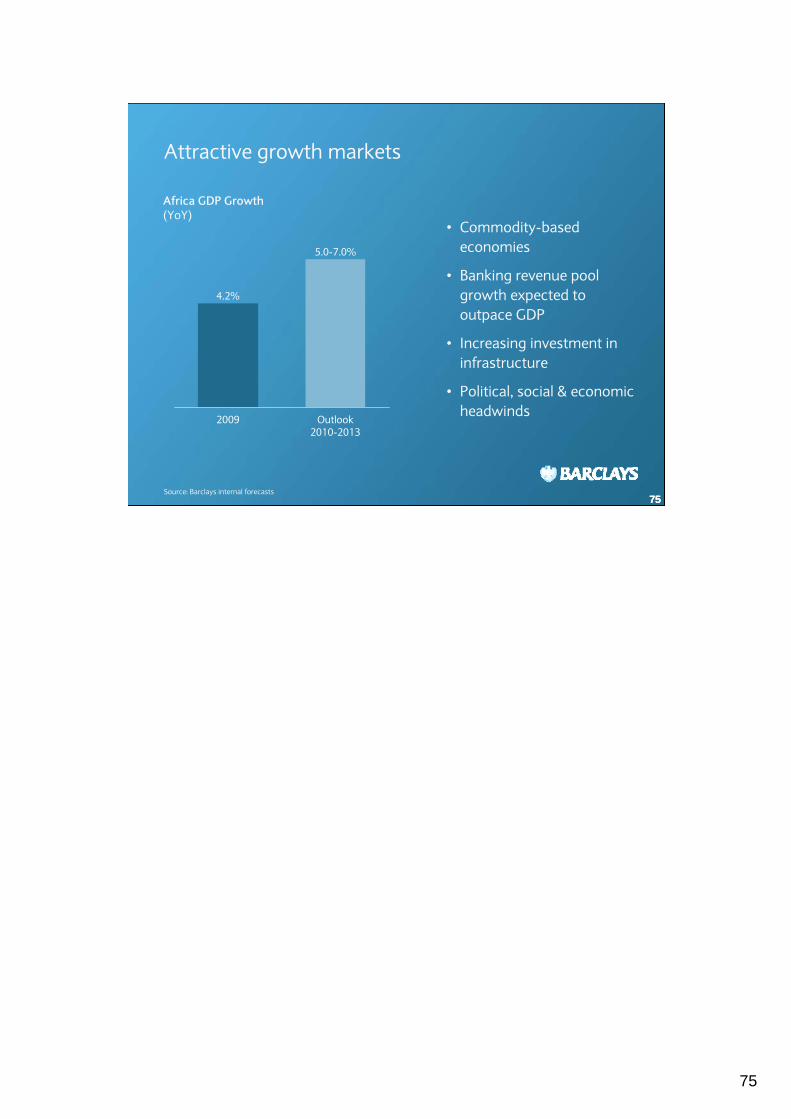
Attractive growth markets
• Commodity-based economies
• Banking revenue pool growth expected to outpace GDP
• Increasing investment in infrastructure
• Political, social & economic headwinds
Source: Barclays internal forecasts
Africa GDP Growth(YoY)
5.0-7.0%
4.2%
2009 Outlook2010-2013
76
7676
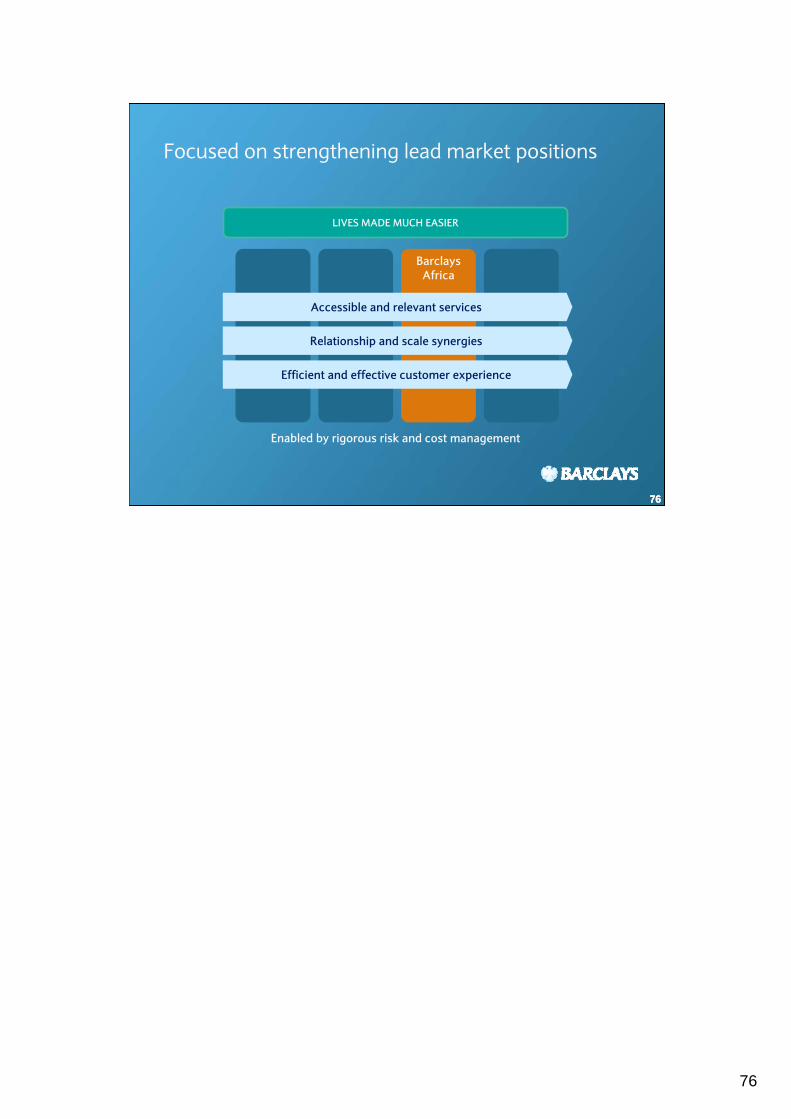
Focused on strengthening lead market positions
76
BarclaysAfrica
LIVES MADE MUCH EASIER
Accessible and relevant services
Efficient and effective customer experience
Relationship and scale synergies
Enabled by rigorous risk and cost management
77
777777
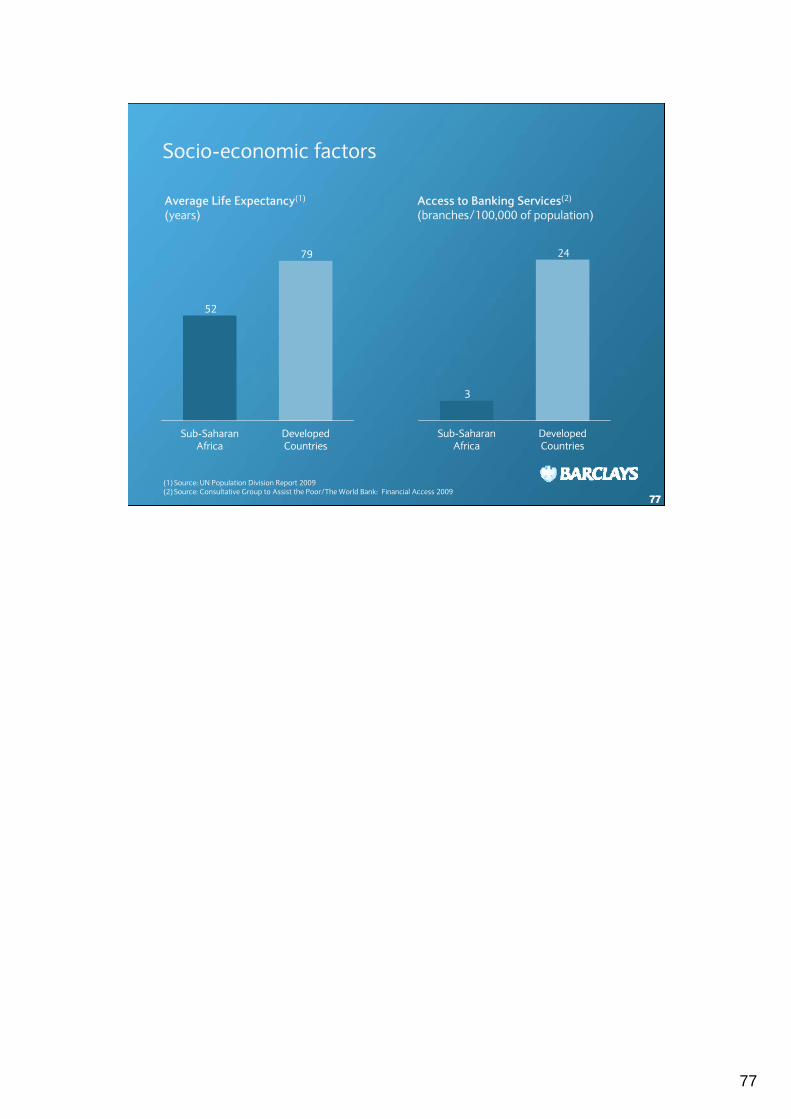
Socio-economic factors
(1) Source: UN Population Division Report 2009(2) Source: Consultative Group to Assist the Poor/The World Bank: Financial Access 2009
Average Life Expectancy(1)
(years)Access to Banking Services(2)
(branches/100,000 of population)
79
52
DevelopedCountries
Sub-SaharanAfrica
24
3
Sub-SaharanAfrica
DevelopedCountries
78
7878
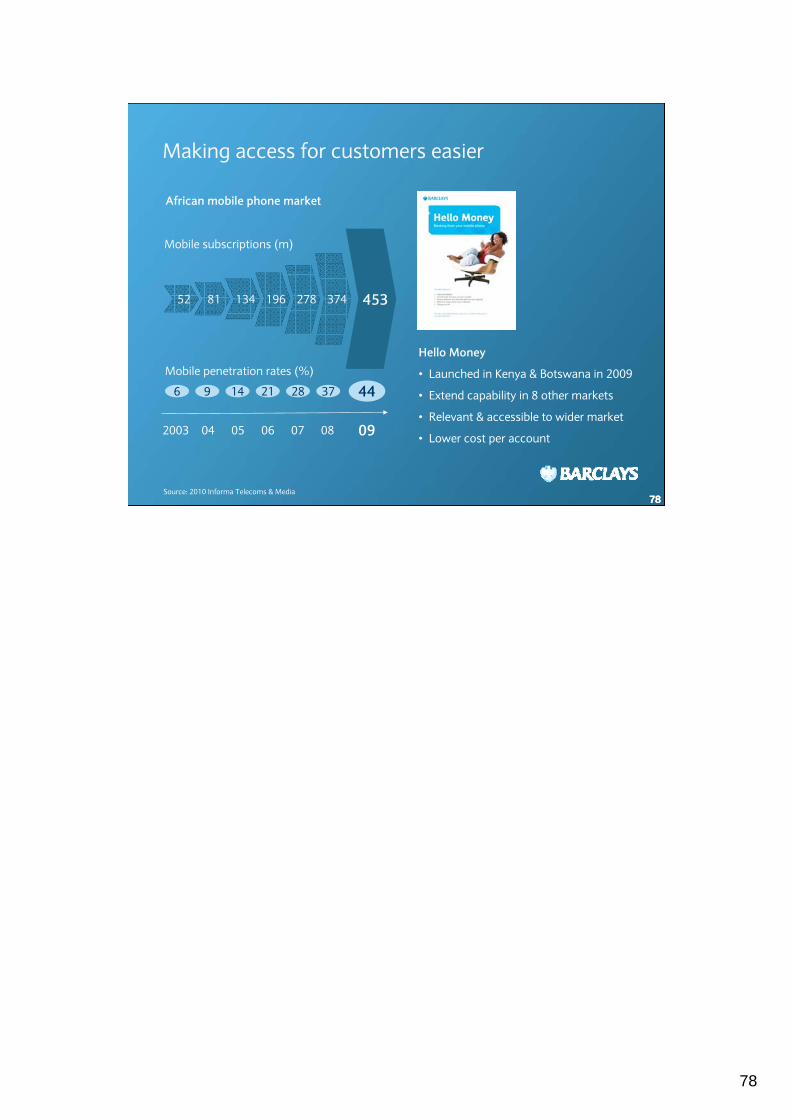
Making access for customers easier
78
African mobile phone market
Source: 2010 Informa Telecoms & Media
Hello Money
• Launched in Kenya & Botswana in 2009
• Extend capability in 8 other markets
• Relevant & accessible to wider market
• Lower cost per account
52 81 134 196 278 374 453
2003 04 05 06 07 08 09
Mobile subscriptions (m)
Mobile penetration rates (%)
6 14 21 28 379 44
79
797979
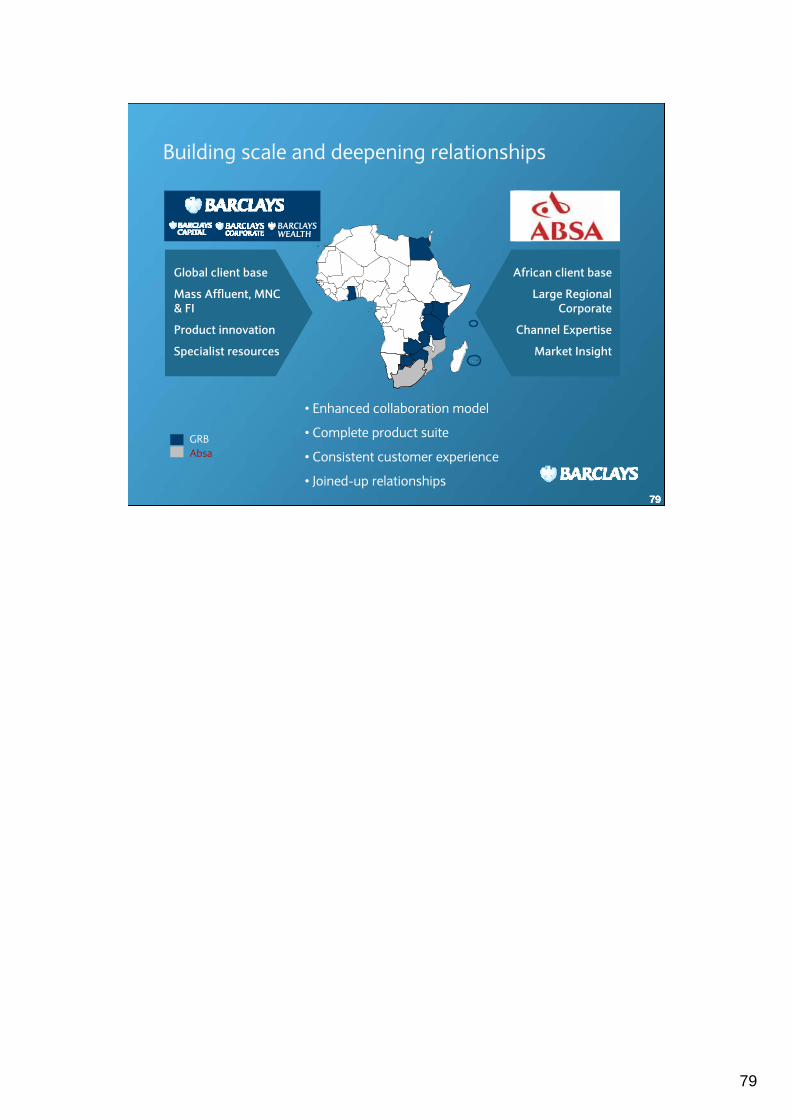
Building scale and deepening relationships
• Enhanced collaboration model
• Complete product suite
• Consistent customer experience
• Joined-up relationships
African client base
Large Regional Corporate
Channel Expertise
Market Insight
Global client base
Mass Affluent, MNC& FI
Product innovation
Specialist resources
AbsaGRB
80
8080
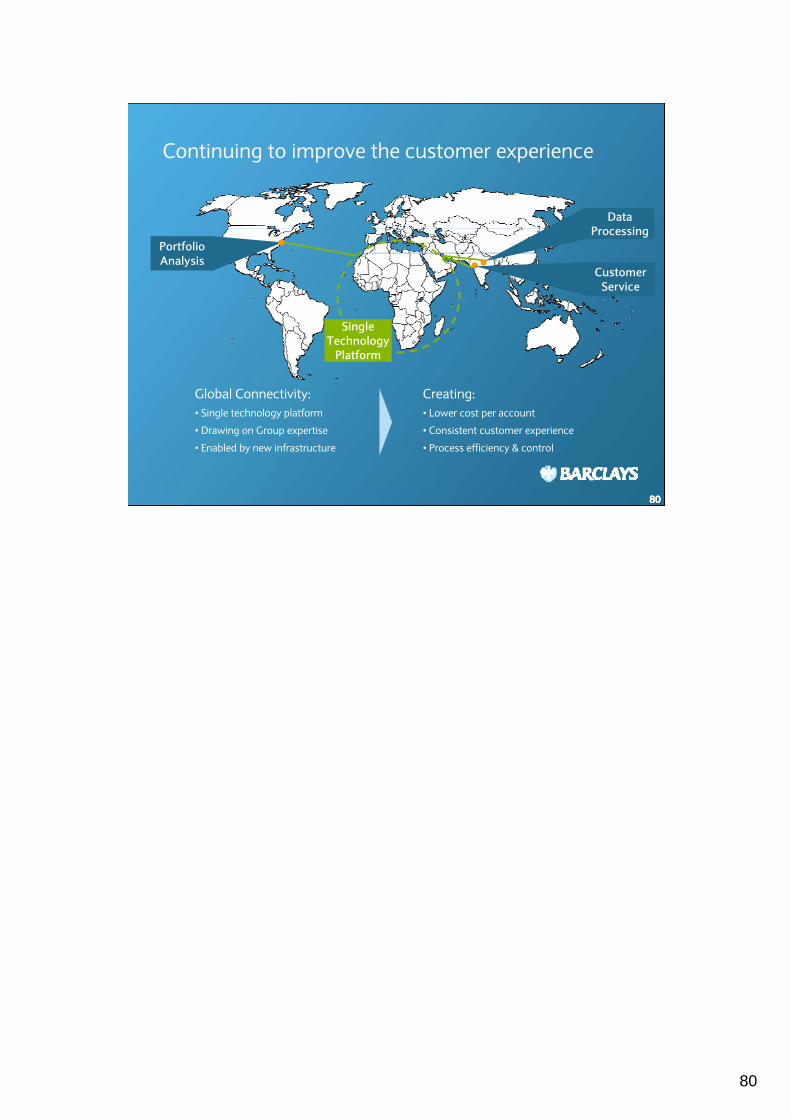
Continuing to improve the customer experience
80
Global Connectivity:• Single technology platform
• Drawing on Group expertise
• Enabled by new infrastructure
Creating:• Lower cost per account
• Consistent customer experience
• Process efficiency & control
Single Technology
Platform
Data Processing
Customer Service
Portfolio Analysis
81
8181
Placing importance on responsible banking
81
• Fair & transparent banking
• Investment in social infrastructure
• Encouraging financial inclusion
Building sustainable markets with long-term growth potential
82
8282
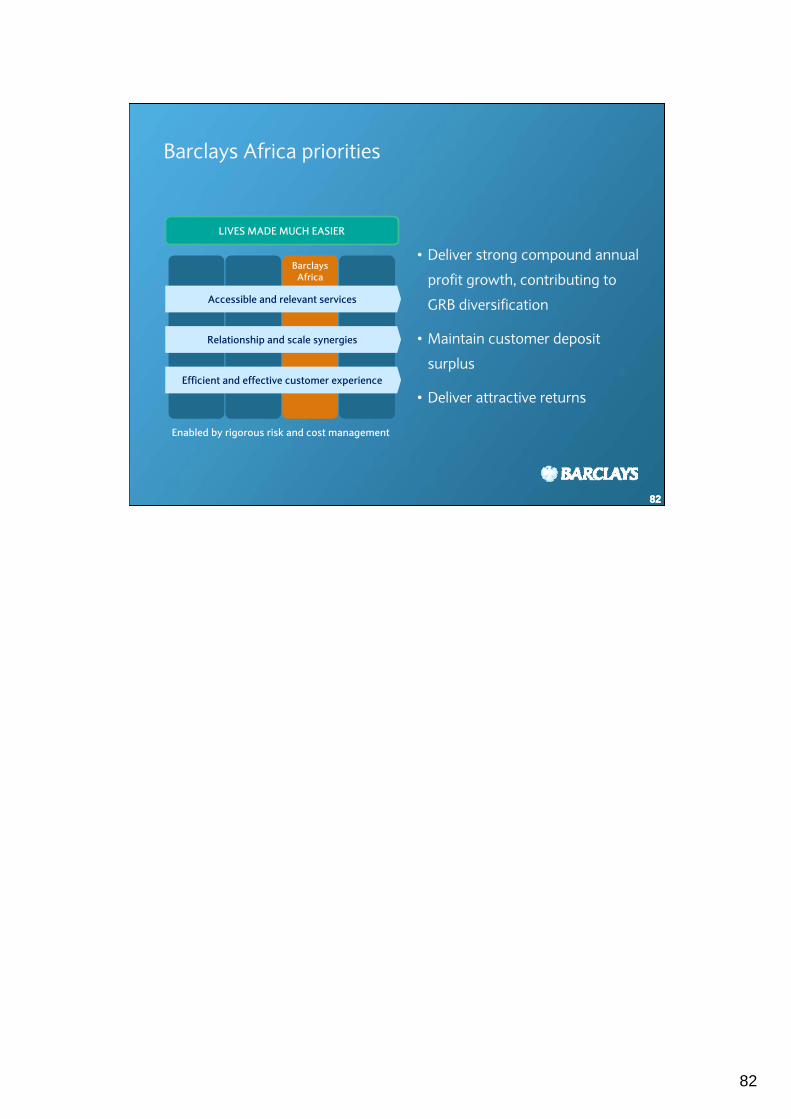
Barclays Africa priorities
82
• Deliver strong compound annual
profit growth, contributing to
GRB diversification
• Maintain customer deposit
surplus
• Deliver attractive returns
BarclaysAfrica
LIVES MADE MUCH EASIER
Accessible and relevant services
Efficient and effective customer experience
Relationship and scale synergies
Enabled by rigorous risk and cost management

8383
838383
UK Retail Banking
Deanna Oppenheimer, CEO UKRB & Vice-Chair GRB30 June 2010
84
8484
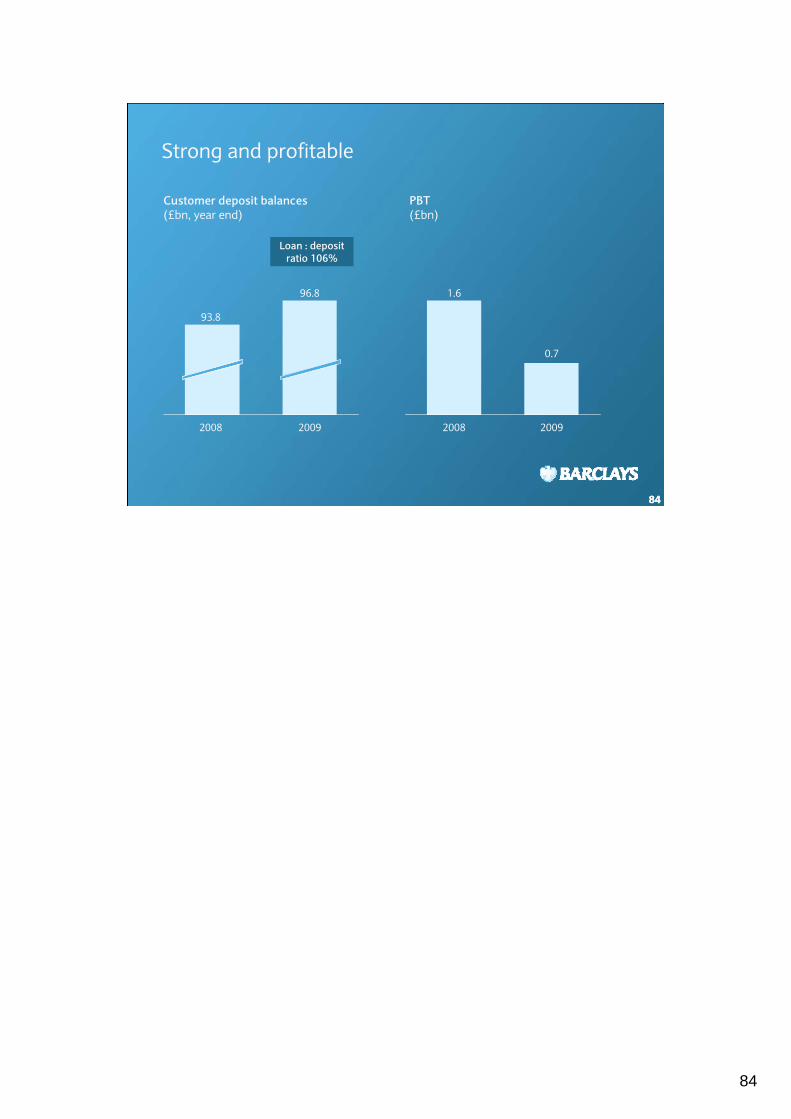
Strong and profitable
84
PBT(£bn)
Customer deposit balances(£bn, year end)
Loan : deposit ratio 106%
93.8
2008 2009
96.8
2009
0.7
2008
1.6
85
8585
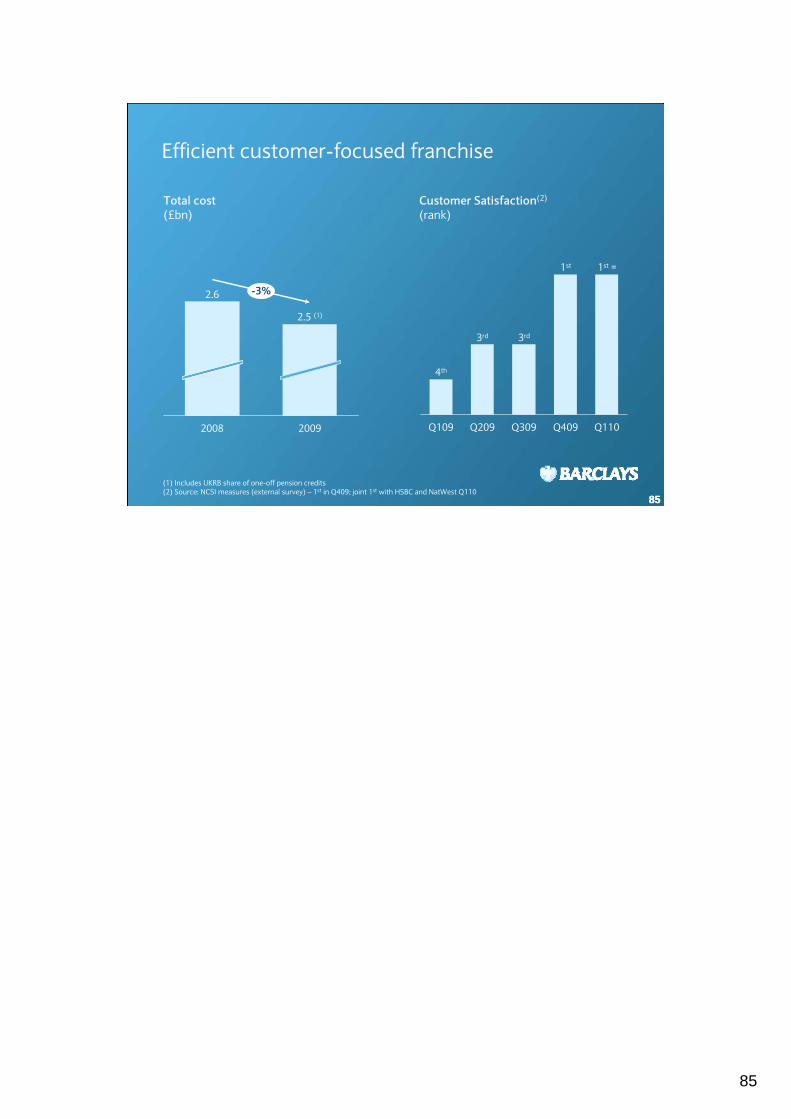
Efficient customer-focused franchise
85
Customer Satisfaction(2)
(rank)Total cost(£bn)
Q110
1st =
Q409
1st
Q309
3rd
Q209
3rd
Q109
4th
(1) Includes UKRB share of one-off pension credits(2) Source: NCSI measures (external survey) – 1st in Q409; joint 1st with HSBC and NatWest Q110
2008 2009
2.6
2.5 (1)
-3%
86
8686
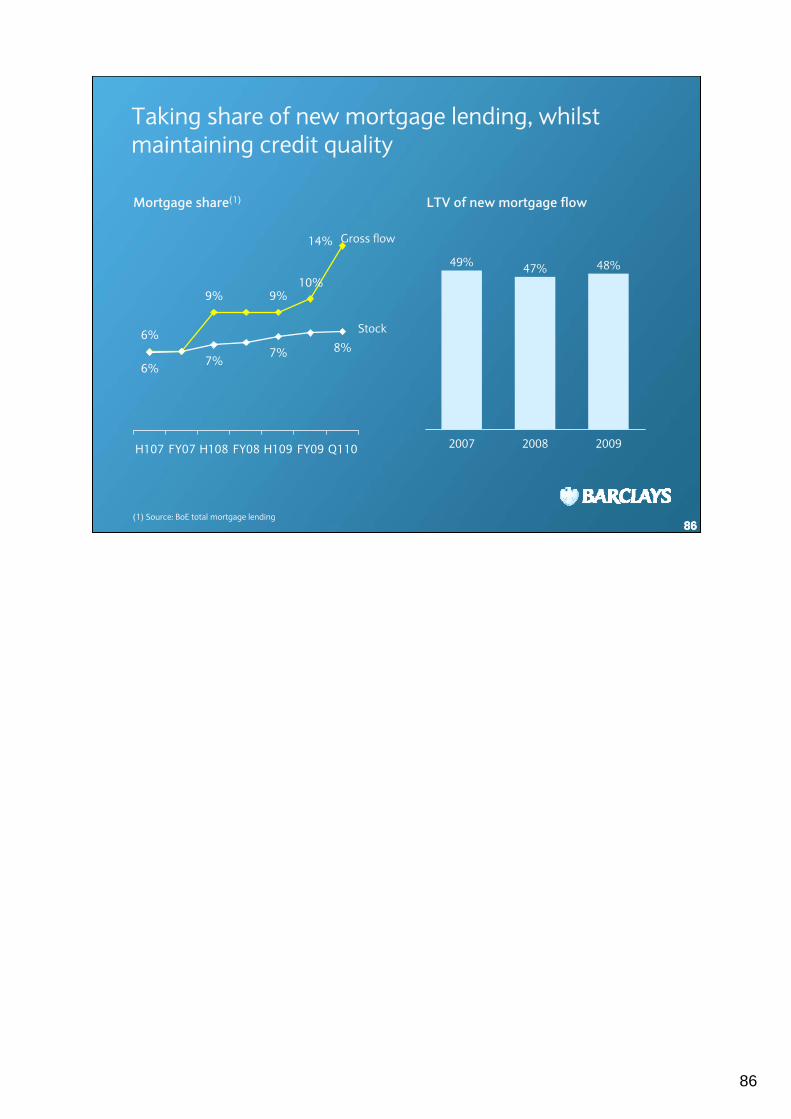
Taking share of new mortgage lending, whilst maintaining credit quality
86
7%7% 8%
14%
6%
9% 9%10%
6%
H107 FY07 H108 FY08 H109 FY09 Q110
Gross flow
Stock
LTV of new mortgage flowMortgage share(1)
48%
20092008
47%
2007
49%
(1) Source: BoE total mortgage lending
87
8787
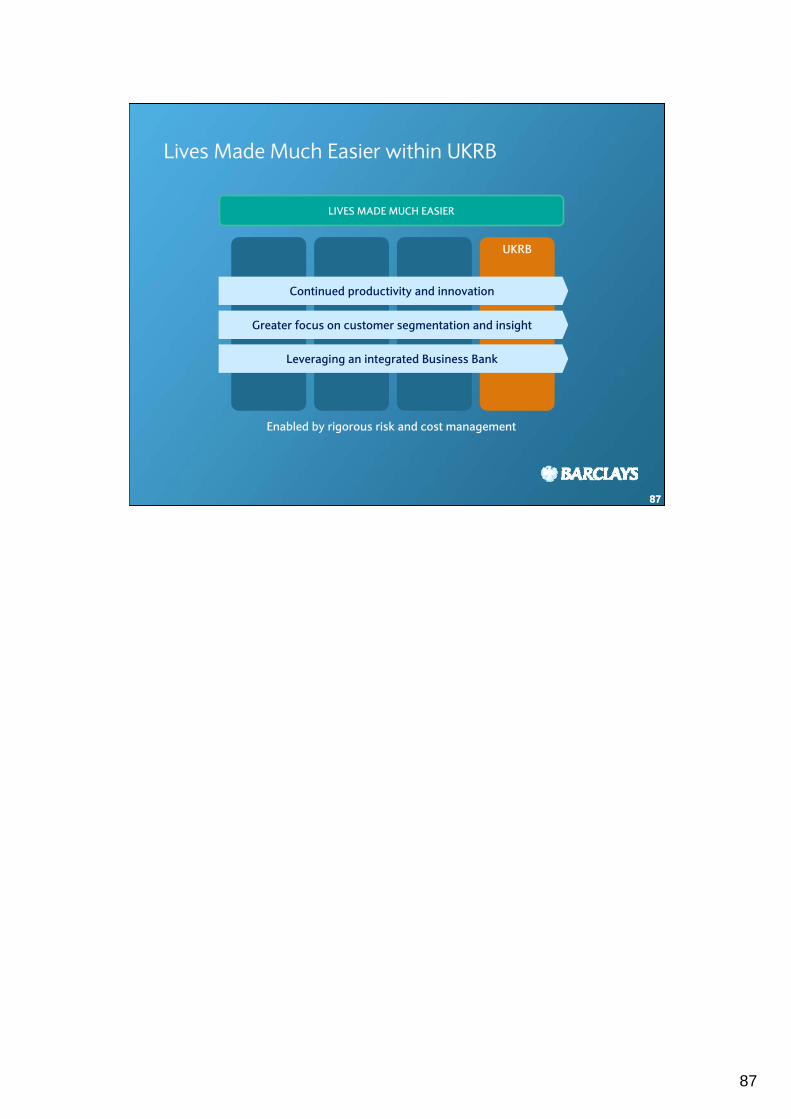
UKRB
LIVES MADE MUCH EASIER
Continued productivity and innovation
Greater focus on customer segmentation and insight
Leveraging an integrated Business Bank
Lives Made Much Easier within UKRB
Enabled by rigorous risk and cost management
88
888888
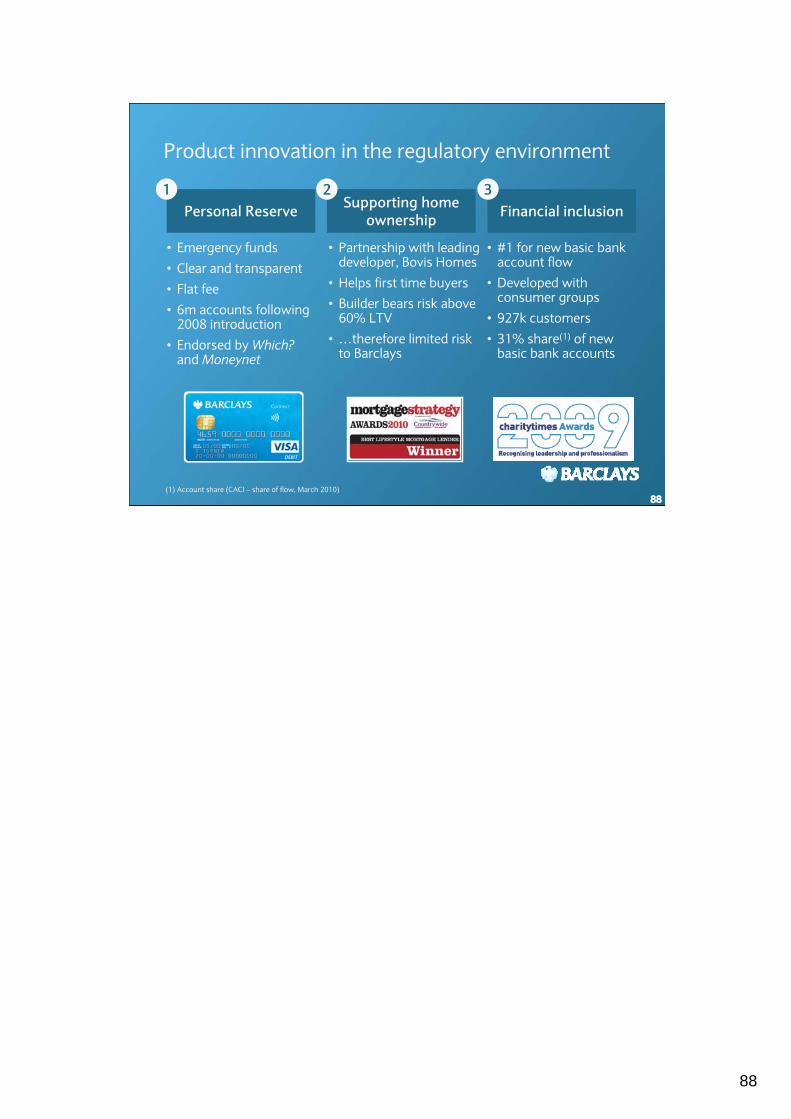
Personal Reserve
• Emergency funds
• Clear and transparent
• Flat fee
• 6m accounts following 2008 introduction
• Endorsed by Which?and Moneynet
1
(1) Account share (CACI – share of flow, March 2010)
Product innovation in the regulatory environment
Financial inclusion
• #1 for new basic bank account flow
• Developed with consumer groups
• 927k customers
• 31% share(1) of new basic bank accounts
3
• Partnership with leading developer, Bovis Homes
• Helps first time buyers
• Builder bears risk above 60% LTV
• …therefore limited risk to Barclays
Supporting home ownership
2
89
8989
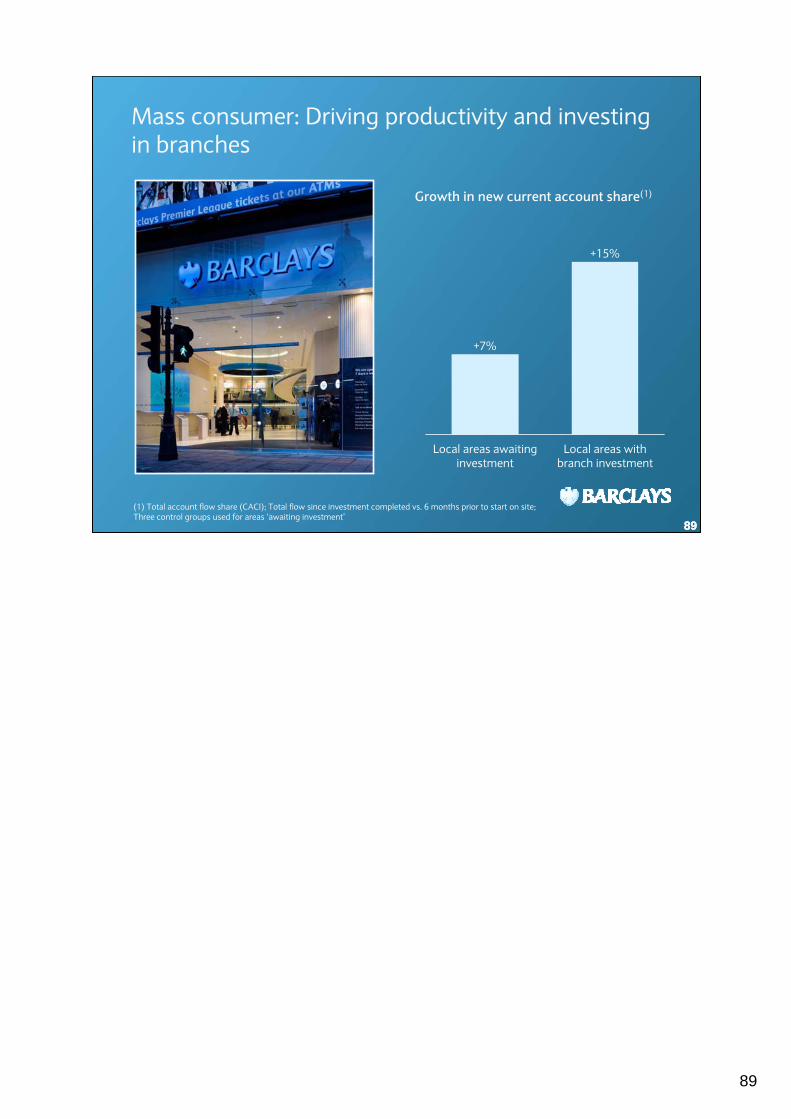
Mass consumer: Driving productivity and investing in branches
89
Growth in new current account share(1)
+7%
+15%
(1) Total account flow share (CACI); Total flow since investment completed vs. 6 months prior to start on site; Three control groups used for areas ‘awaiting investment’
Local areas with branch investment
Local areas awaiting investment
90
90
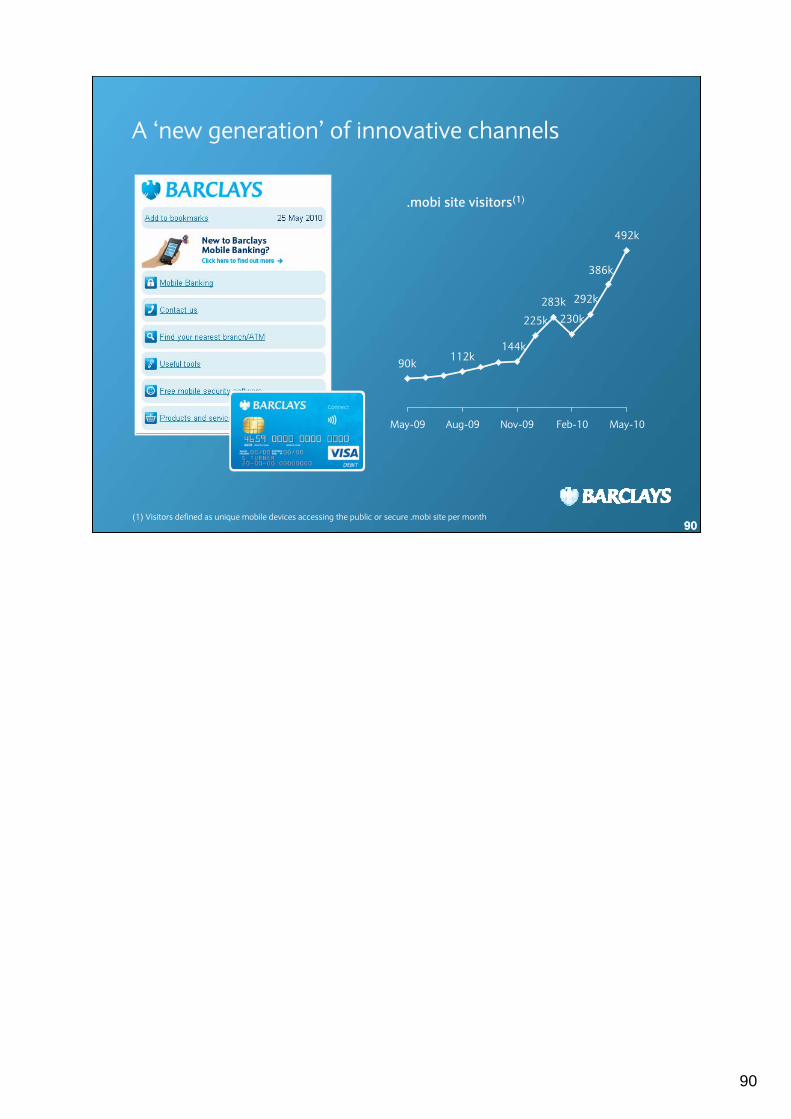
A ‘new generation’ of innovative channels
90
90k112k
225k
283k230k
492k
386k
292k
144k
May-09 Aug-09 Nov-09 Feb-10 May-10
(1) Visitors defined as unique mobile devices accessing the public or secure .mobi site per month
.mobi site visitors(1)
91
9191
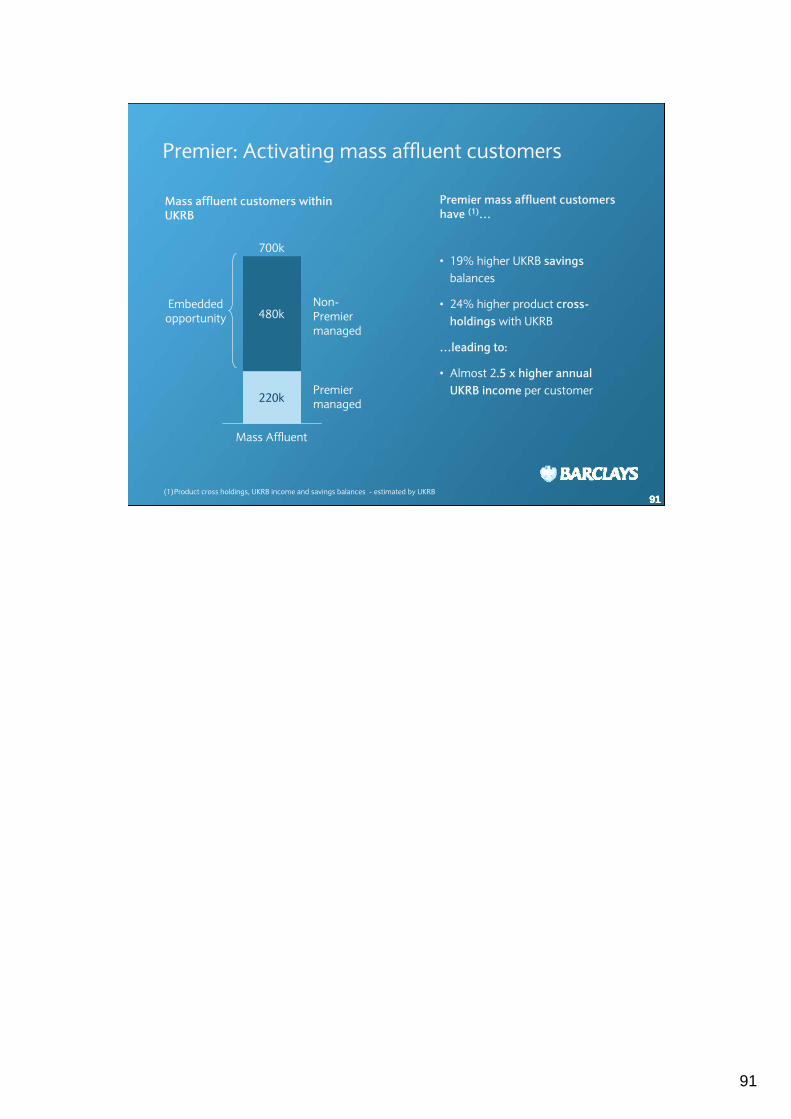
Premier: Activating mass affluent customers
91
Mass affluent customers within UKRB
480k
220k
700k
Mass Affluent
Non-Premier managed
Premier managed
Premier mass affluent customers have (1)…
• 19% higher UKRB savings balances
• 24% higher product cross-holdings with UKRB
…leading to:
• Almost 2.5 x higher annual UKRB income per customer
Embedded opportunity
(1)Product cross holdings, UKRB income and savings balances - estimated by UKRB
92
9292
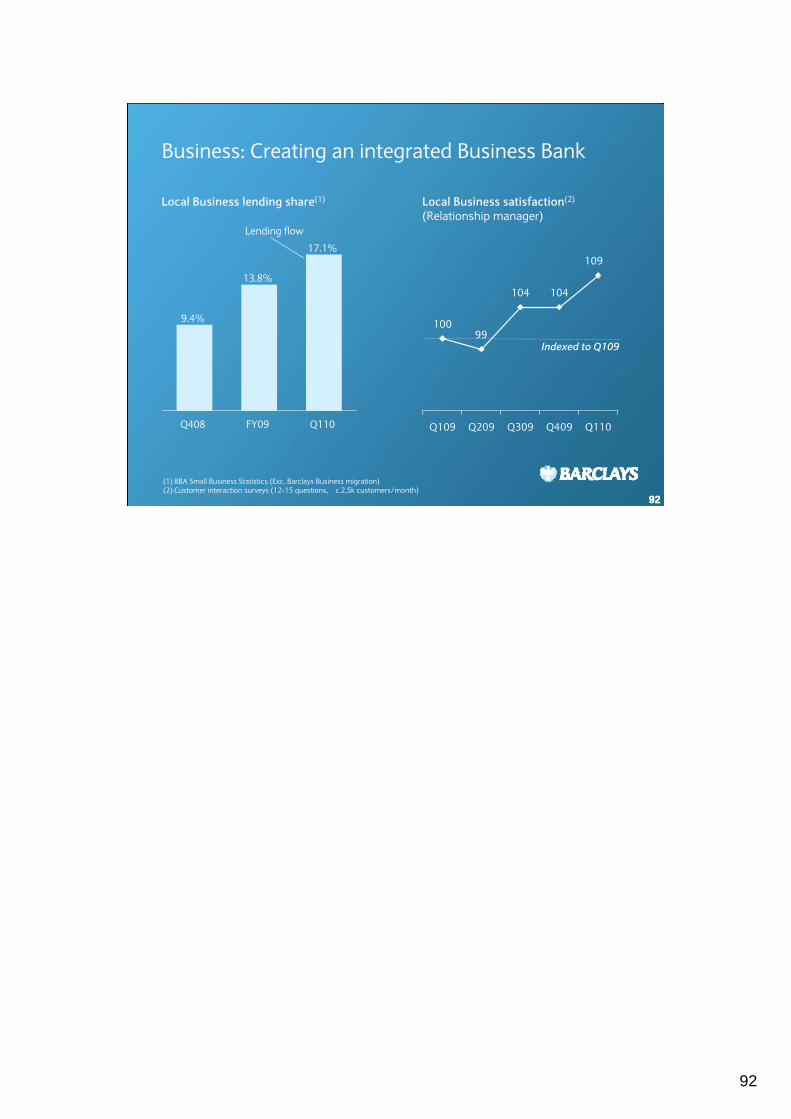
Business: Creating an integrated Business Bank
92
(1) BBA Small Business Statistics (Exc. Barclays Business migration)(2) Customer interaction surveys (12-15 questions, c.2.5k customers/month)
10099
104 104
109
Q109 Q209 Q309 Q409 Q110
Indexed to Q109
Local Business satisfaction(2)
(Relationship manager)Lending flow
Local Business lending share(1)
Q110
17.1%
FY09
13.8%
Q408
9.4%
93
9393
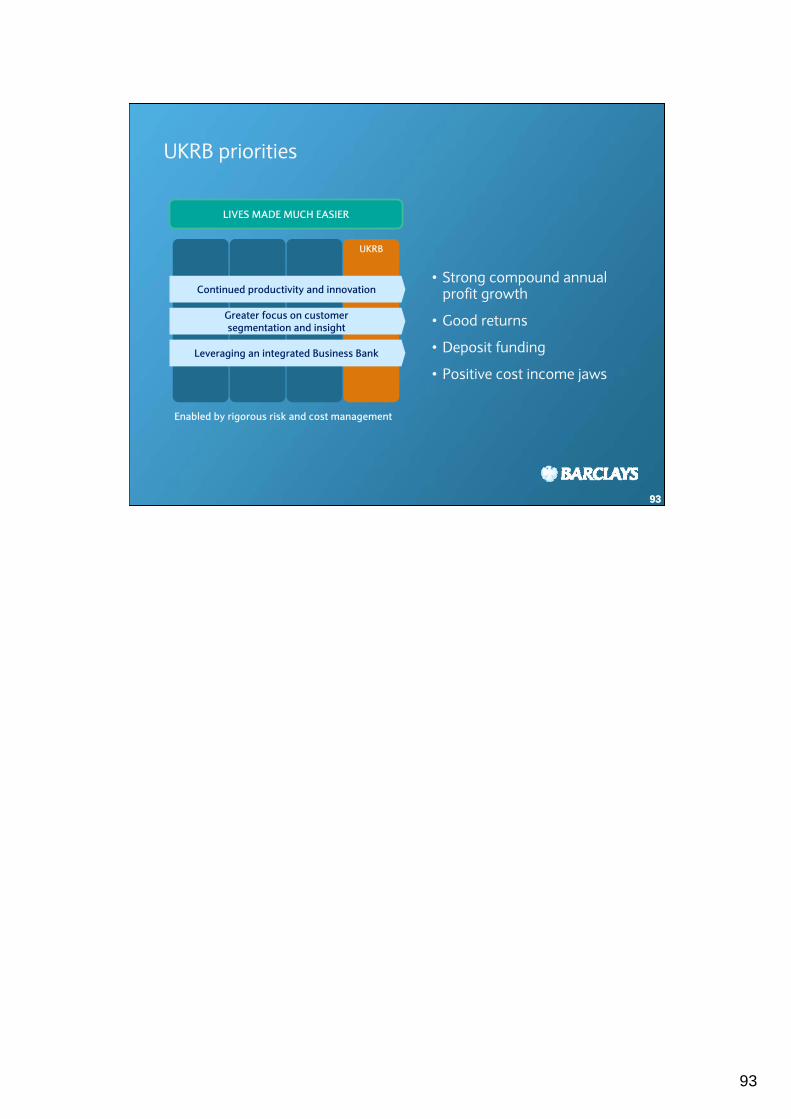
UKRB priorities
• Strong compound annual profit growth
• Good returns
• Deposit funding
• Positive cost income jaws
UKRB
LIVES MADE MUCH EASIER
Continued productivity and innovation
Greater focus on customer segmentation and insight
Leveraging an integrated Business Bank
Enabled by rigorous risk and cost management

9494
949494
UK Retail Banking
Deanna Oppenheimer, CEO UKRB & Vice-Chair GRB30 June 2010

9595
959595
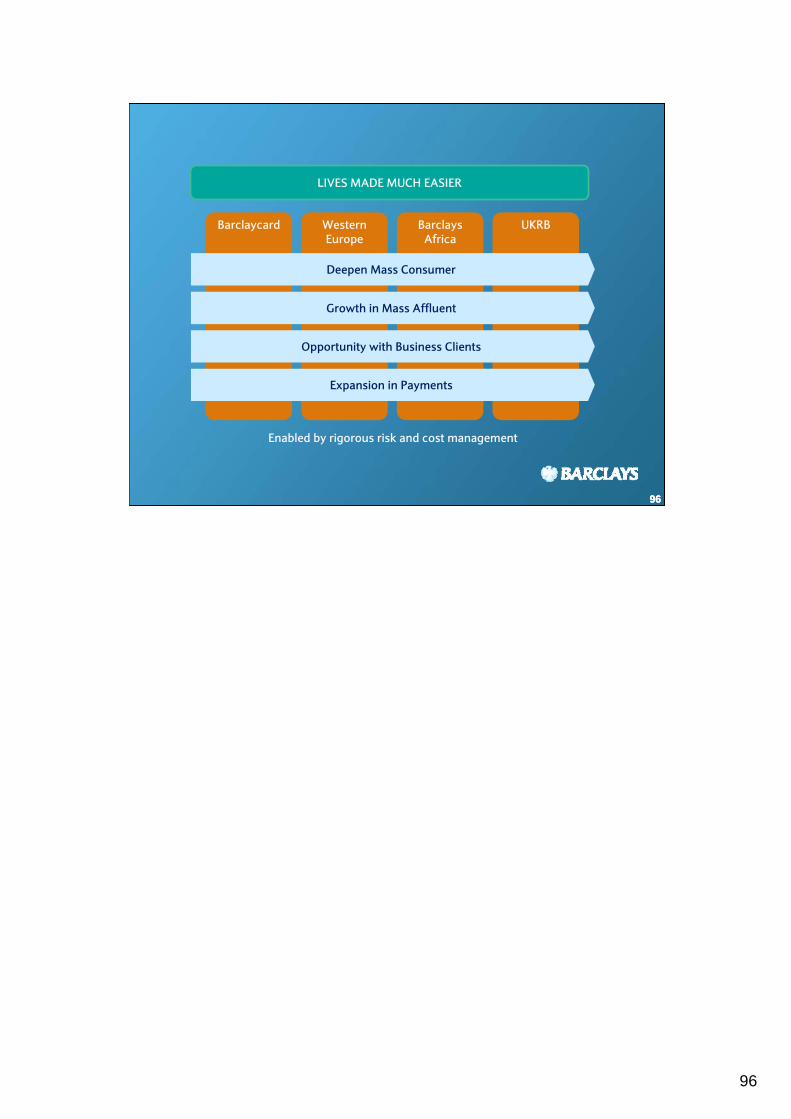
Closing Remarks
Antony Jenkins, CEO Global Retail Banking30 June 2010
96
969696
Barclaycard WesternEurope
BarclaysAfrica
UKRB
Deepen Mass Consumer
Growth in Mass Affluent
Opportunity with Business Clients
Expansion in Payments
Enabled by rigorous risk and cost management
LIVES MADE MUCH EASIER

97
979797
Happy customers
Strong profit growth
Good returns
9898
989898
Global Retail Banking Investor SeminarQ&A
30 June 2010
99
9999
Disclaimer
99
This document contains certain forward-looking statements within the meaning of Section 21E of the US Securities Exchange Actof 1934, as amended, and Section 27A of the US Securities Act of 1933, as amended, with respect to certain of the Group’s plansand its current goals and expectations relating to its future financial condition and performance. Barclays cautions readers that noforward-looking statement is a guarantee of future performance and that actual results could differ materially from thosecontained in the forward-looking statements. These forward-looking statements can be identified by the fact that they do notrelate only to historical or current facts. Forward-looking statements sometimes use words such as “may”, “will”, “seek”,“continue”, “aim”, “anticipate”, “target”, “expect”, “estimate”, “intend”, “plan”, “goal”, “believe” or other words of similarmeaning. Examples of forward-looking statements include, among others, statements regarding the Group’s future financialposition, income growth, assets, impairment charges, business strategy, capital ratios, leverage, payment of dividends, projectedlevels of growth in the banking and financial markets, projected costs, estimates of capital expenditures, and plans and objectivesfor future operations and other statements that are not historical fact. By their nature, forward-looking statements involve riskand uncertainty because they relate to future events and circumstances, including, but not limited to, UK domestic and globaleconomic and business conditions, the effects of continued volatility in credit markets, market related risks such as changes ininterest rates and exchange rates, effects of changes in valuation of credit market exposures, changes in valuation of issued notes,the policies and actions of governmental and regulatory authorities, changes in legislation, the further development of standardsand interpretations under International Financial Reporting Standards (IFRS) applicable to past, current and future periods,evolving practices with regard to the interpretation and application of standards under IFRS, the outcome of pending and futurelitigation, the success of future acquisitions and other strategic transactions and the impact of competition – a number of suchfactors being beyond the Group’s control. As a result, the Group’s actual future results may differ materially from the plans, goals,and expectations set forth in the Group’s forward-looking statements.
Any forward-looking statements made herein speak only as of the date they are made. Except as required by the UK FinancialServices Authority (FSA), the London Stock Exchange or applicable law, Barclays expressly disclaims any obligation or undertakingto release publicly any updates or revisions to any forward-looking statements contained in this announcement to reflect anychange in Barclays expectations with regard thereto or any change in events, conditions or circumstances on which any suchstatement is based. The reader should, however, consult any additional disclosures that Barclays has made or may make indocuments it has filed or may file with the SEC.
Top Related