


Languages
Pages
Legal


Investor presentations:South Africa October 2008

Important information
This presentation has been prepared by British American Tobacco p.l.c. ("British American Tobacco") for information purposes only and does not constitute, or form part of any offer or invitation to acquire, or any solicitation of any offer to acquire any securities of British American Tobacco.The information on which this presentation is based has been obtained from sources which we believe to be reliable as at the date hereof, but we have not independently verified such information and do not guarantee that it is accurate or complete and all information and opinions are subject to update, correction, revision or amendment without notice. No representation or warranty, express or implied, is therefore made by or on behalf of British American Tobacco, its directors or employees or any other person as to, and no reliance for any purposes whatsoever should be placed on, the accuracy, completeness or fairness of the information or opinions contained in this presentation and no responsibility or liability is accepted for any such information or opinions.This presentation includes certain forward-looking statements with respect to British American Tobacco's financial condition, results of operations and business and certain plans and objectives of the British American Tobacco's board of directors with respect thereto. By their nature, forward-looking statements involve risks and uncertainties because they relate to events and depend on circumstances that may or may not occur in the future. Forward-looking statements are not guarantees of future performance and British American Tobacco's actual results of operations, financial condition, liquidity, prospects, growth and strategies and the development of the industry in which the British American Tobacco operates may differ materially from those expressed or implied by the forward-looking statements included in this presentation. Events that may cause actual results to differ from such forward-looking statements include, but are not limited to fluctuations in the capital markets; fluctuations in interest and exchange rates; increased regulation or regulatory scrutiny; the occurrence of unforeseen disasters or catastrophes; political or economic instability in their principal markets; adverse outcomes in litigation; general local and global economic, political, business and market conditions. Except as required by its legal or regulatory obligations, British American Tobacco does not undertake any obligation to update or revise publicly any forward-looking statement, whether as a result of new information, future events or otherwise.Recipients of this presentation who intend to acquire any interests in securities which British American Tobacco may issue in the future are reminded that any such acquisition should only be made on the basis of the offering document prepared in connection therewith, which may be different from the information and opinions contained in this presentation.
Agenda
Jan du Plessis - Overview and review of the Group since the merger with
Rothmans
Paul Adams- Industry overview, the Group and strategy
John Taylor- BAT South Africa, innovations and Russia
Ben Stevens- The productivity strategy, financials and 2008 performance
Questions and answers
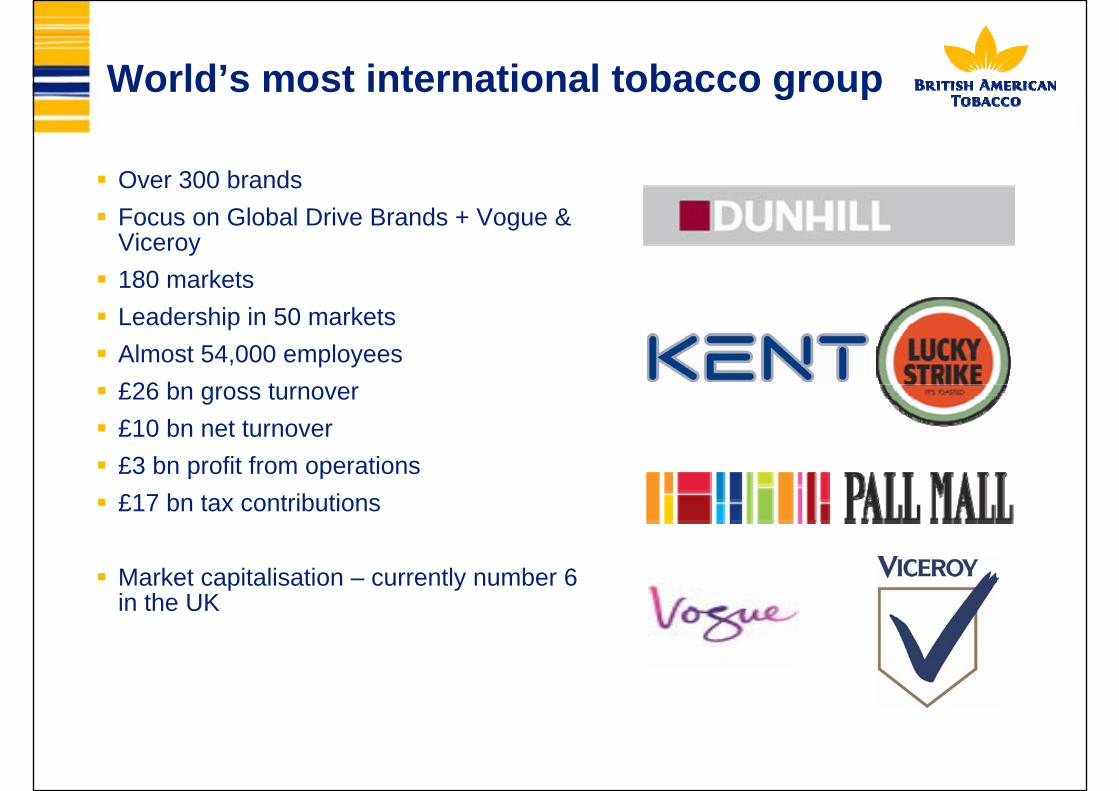
World’s most international tobacco group
Over 300 brandsFocus on Global Drive Brands + Vogue & Viceroy180 marketsLeadership in 50 marketsAlmost 54,000 employees£26 bn gross turnover£10 bn net turnover£3 bn profit from operations£17 bn tax contributions
Market capitalisation – currently number 6 in the UK

2007 statistics
Sales volume: 684 billion cigarettes 47 factories in 40 countries5 Regional Product CentresOver 460,000 tonnes of leaf bought280,000 farmers providing leaf

Our world
•Organised into 5 regions – Europe to split in 2009
•Two key associates: Reynolds American (US) and ITC (India)
42 bn
151 bn
101 bn
245 bn
145 bn

Associates
Reynolds American Inc.- 42% shareholding - Number 2 cigarette manufacturer in US- Brands include, Camel, Kool and Pall Mall- Significant non-combustible business
ITC Ltd.- 32% shareholding- Largest cigarette manufacturer in India- Includes paper and packaging and hotels businesses

Milestones since demerger in 1998
1998: British American Tobacco listed as a standalone tobacco company
1999: Rothmans merger completed2002: Growth, Productivity and Responsibility strategy
and 5 year cost savings programme announced2003: Acquisition of ETI in Italy2004: B&W and RJR form Reynolds American2008: Turkey and Scandinavia deals completed

Earnings per share
52.3 56.9 61.8 66.5 69.276.6
89.398.1
108.5
53.562.0
1999 2000 2001 2002 2003 2004 2005 2006 2007 2007 2008
penc
e
9.6% CAGR
The target of high single figure earnings growth has been delivered
YTD 6 months
Source: Company’s financial results
+16%

Dividends per share
26.2 29.0 32.0 35.2 38.8 41.947.0
55.966.7
18.6 22.1
1999 2000 2001 2002 2003 2004 2005 2006 2007 2007 2008
penc
e
12.4% CAGR
Targeting a 65% payout ratio in 2008
Interimdividend
+19%
Source: Company’s financial results

BAT share price since Jan 2000
Source: Reuters
Daily Relative performance to FTSE100 03/01/2000 - 07/10/2008 (GMT)ValueGBp
.1231
1.5
2
2.5
3
3.5
4
4.5
5
5.5
6
6.5
7
PriceGBp
.12300400
500
600
700
800
900
1,000
1,100
1,200
1,300
1,400
1,500
1,600
1,700
1,800
Q1 Q2 Q3 Q4 Q1 Q2 Q3 Q4 Q1 Q2 Q3 Q4 Q1 Q2 Q3 Q4 Q1 Q2 Q3 Q4 Q1 Q2 Q3 Q4 Q1 Q2 Q3 Q4 Q1 Q2 Q3 Q4 Q1 Q2 Q3 Q42000 2001 2002 2003 2004 2005 2006 2007 2008
BAT share price Relative performance to FTSE 100
Out-performance

Since Jan 2000 28.3%Since Jan 2003 27.7%Since Jan 2005 28.0%Since Jan 2007 24.1%
Total shareholder return per annum
Source: Bloomberg (Based BAT share price at close 3 October 2008)

FMCG Comparator Group
AltadisAltria (Phillip Morris)Anheuser-BuschCadbury SchweppesCampbell SoupCarlsberg Coca ColaColgate-PalmoliveDanoneDiageoGallaher HeinekenHeinzHershey FoodsImperial Tobacco
InBevJohnson & JohnsonKelloggKimberly-ClarkLVMH Möet HennessyNestléPepsicoProcter & GambleReckitt BenckiserReynolds American SAB MillerSara LeeScottish & NewcastleUnilever

Source: Company Annual Report & Accounts 2007
Total Shareholder Return v. FMCG group
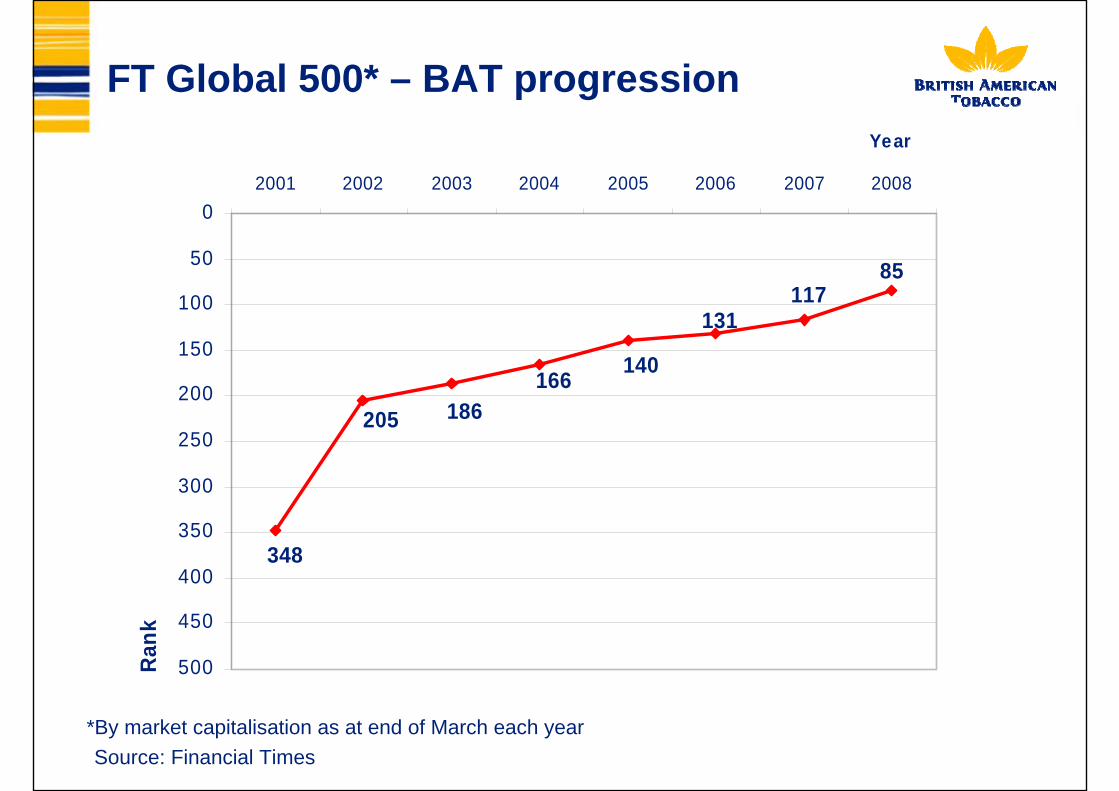
FT Global 500* – BAT progression
*By market capitalisation as at end of March each year
85117
131
140166186205
348
0
50
100
150
200
250
300
350
400
450
500
2001 2002 2003 2004 2005 2006 2007 2008
YearRa
nk
Source: Financial Times

Industry volume (excluding China) continues slow, steady decline
Geographic mix is deteriorating
Relatively few players
There are still opportunities for growth in key segments
Legitimate manufacturers squeezed by governments and illicit trade
The level of regulation will increase
Industry dynamics
Even with these dynamics, the industry profit pool is forecast to grow
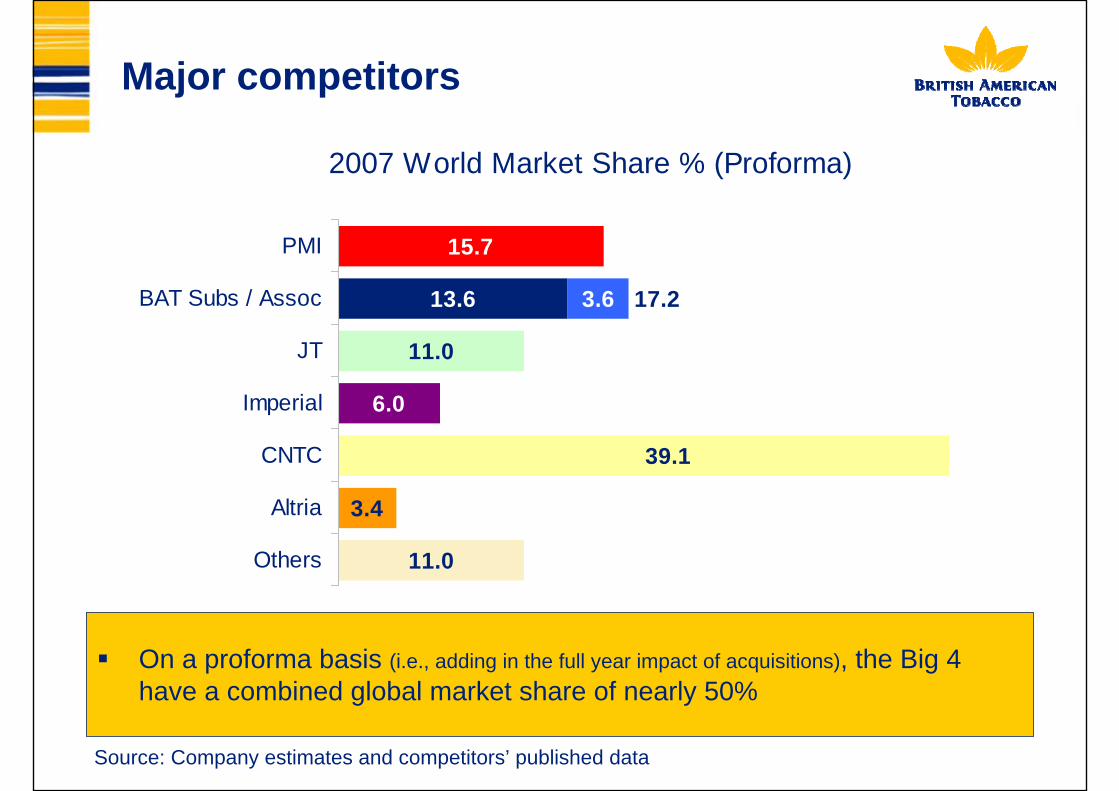
Major competitors
On a proforma basis (i.e., adding in the full year impact of acquisitions), the Big 4 have a combined global market share of nearly 50%
11.0
3.4
6.0
11.0
13.6
15.7
39.1
3.6 17.2
Others
Altria
CNTC
Imperial
JT
BAT Subs / Assoc
PMI
2007 World Market Share % (Proforma)
Source: Company estimates and competitors’ published data

GROWTH PRODUCTIVITY RESPONSIBILITY
WINNING ORGANISATION
VISION
STRATEGY
Great Place to Work Outstanding People
Organic Growth
Mergers & Acquisitions Standards of
Business Conduct
Business Principles
Smart Cost Management
Marketing Efficiency
Capital Effectiveness Sensible RegulationHarm Reduction
ACHIEVELEADERSHIP OF
THE GLOBALTOBACCO INDUSTRY
WINNING ORGANISATION
Great Place to Work- Leadership- Culture
Outstanding People- Talent- Learning
RESPONSIBILITYGROWTH PRODUCTIVITY
Organic Growth
Mergers & Acquisitions
Marketing Efficiency
Standards of Business Conduct
Business Principles
Smart Cost Management
Capital Effectiveness
Sensible Regulation
Harm Reduction
- Supply Chain
- Overheads & Indirects- Innovation
- Key Segments & Brands
- Priority Markets
ACHIEVELEADERSHIP OF
THE GLOBALTOBACCO INDUSTRY
VISION
STRATEGY
Strategy for shareholder value

Global Drive Brands
78 85 93 100113 114 125
146 161
7287
1999
2000
2001
2002
2003
2004
2005
2006
2007
H1 200
7 H1 2
008
Volu
me
(Bill
ions
)
Global drive brands sales volumes have grown consistently
9.5% CAGR
Source: Company’s financial results
+20%

Brand momentum The top-13 international brands
0
50
100
150
200
250
300
350-4.8
-2.4
+4.5 +3.1+8.4 +6.7 +5.0 +2.9 +2.1 +5.0
2007 global volumes and growth v 2006
-7.2+8.4
+3.0
Volume movement in billionsPMI -11JT +9BAT +22
International volumes, excluding the USA
Source: Company estimates and data published by competitors

Global Drive Brands: volume growth index
Base 100: 1997Advertising Principles International Marketing Standards
80
100
120
140
160
180
200
1997 1998 1999 2000 2001 2002 2003 2004 2005 2006 2007
British American Tobacco
Japan Tobacco
Philip Morris
Source: Company estimates and competitors’ published data

Key consumer segments (top 22 markets)Designated Global Drive and/ or
"Flagship" Brands
35.042.139.6
2007 2012 2017
International Brands*54.1 56.3
48.7
2007 2012 2017
% S
hare
of T
22 m
arke
ts
Premium
32.4 34.233.3
2007 2012 2017
% S
hare
of T
22m
arke
ts
Lights
51.3 52.153.0
2007 2012 2017%
Sha
re o
f T22
mar
kets
GDB and/or “Flagship” brands, International brands and the Premium segment are all forecast to grow. The Lights segment is expected to fall as a proportion of the total market.
* Includes Designated GDB/Flagship Brands %
Sha
re o
f T22
mar
kets
Source: Company’s internal estimates and forecasts

Priority markets
Eastern EuropeFar EastNorth AfricaMiddle East

Growth summary
We have delivered growth- Improvements in key Industry segments
- Spectacular GDB volume growth
- Value added deals
Going forward -- we are well positioned for further growth- Real momentum in the business
Regulation
Engage with stakeholders to:
- compete in the legal market;
- differentiate and innovate with our product category (including harm reduced products);
- maintain channels of communication;
- ensure there are opportunities for consumers to smoke;
- enjoy free trade; and
- combat illicit trade.

Winning organisation strategy
Ensure we have the right people and the right working environment to deliver our Vision.
Great Place to Work
Outstanding People
A loose federation An integrated global enterprise
From To

High single figure EPS growth model*
Volume growth of 1 to 1½%Drive brands to grow at high single figures
Net turnover growth of 3 to 3½%Implies volume growth and pricing
Profit from ops growth of 6%Implies significant cost savings
EPS growth of around 8%Implies balance sheet & below the line efficiencies
* Based on internal estimates over the medium to long term

The business model
Earnings growth
Cost savings
Bad stuff Invest in long term

Earnings per share growth
11%9%
4%
10%
17%
10% 11%
16%
8%
2000 2001 2002 2003 2004 2005 2006 2007 2008
% G
row
th
YTD 6months
Source: Company’s financial results

In previous economic downturns…
Tobacco is not recession proof…… but recession resistantOur geographic diversity mitigates riskConsumers are loyal to their brandsSwitching where they buy not what they buyHigh unemployment may lead to changing behaviourBalanced portfolio covering consumer price points

An enterprise which has:
A leading portfolio of sustainable brands -- having a strong brand in each segment which the consumer perceives to be of greater value thancompetition
A highly effective, flexible and efficient operation that leverages the synergies of being part of a global group
An agile, learning, innovative organisation that has outstanding leaders and that re-invents and improves itself
Recognition that it acts responsibly and has a sustainable business
Delivered on shareholders’ expectations of high single-digit earnings growth over the medium to long term
Achieved leadership of the global tobacco industry and created long term shareholder value
Common vision of success

Agenda
11
22
33
SA Market Context
BATSA – Progress to date
Learning from other markets

PopulationTotal: 49 mn18-65: 27 mn Growth Rate: 0.6%
IndustryAdult Smokers 18-65 years
All Products: 27.7% (7.5 mn)Cigarettes: 23.6% (6.4 mn)
4 International Players (c. 98% of vol)Retail Universe: c. 140,000 outletsExcise Rate: 52%R 9 bn+ in taxes to governmentIndustry creates c. 53,000 jobs
EconomyMacro Economic Stability Servicing EconomyShielded by ResourcesSlowed GDP GrowthInflation Peaking
South Africa at a glance
Source: BER; Estimated Sales; Nielsen

Emerging consumer class...
0
1
2
3
4
5
6
7
8
9
'96 '97 '98 '99 '00 '01 '02 '03 '04 '05 '06 '07
Final household consumption expReal disposable income
Growing per capita income
0
1000
2000
3000
4000
5000
6000
7000
'96 '97 '98 '99 '00 '01 '02 '03 '04 '05 '06 '07
GDP per Capita (US$)
Disposable income and expenditure growth
Growing middle class
Increased demand for branded consumer products
Source: Business Monitor International; Bureau of Economic Research

Local portfolio positioning
VFM
Premium
Premium + 1.5%
16%
2.7%
81%
64%
97%
Low 6.3%
Popular 73%97%
40%
Note: SA Local Price Card; Source: Estimated Sales, Nielsen

1.2% 1.4% 1.8%
4.1%
1.8% 1.8% 1.8% 2.0%
4.7%3.9% 3.5%
2005 2006 2007 2008YTD
07Q1 07Q2 07Q3 07Q4 08Q1 08Q2 08Q3
4.7% 5.0% 5.5% 5.7% 5.0% 5.3% 5.7% 6.1% 5.9% 5.6% 5.3%
2005 2006 2007 2008YTD
07Q1 07Q2 07Q3 07Q4 08Q1 08Q2 08Q3
Competitors struggling in changing market dynamics
Source: Estimated Sales; Nielsen

Agenda
11
22
33
SA Environment
BATSA – Progress to date
Learning from other markets
0
50
100
150
200
250
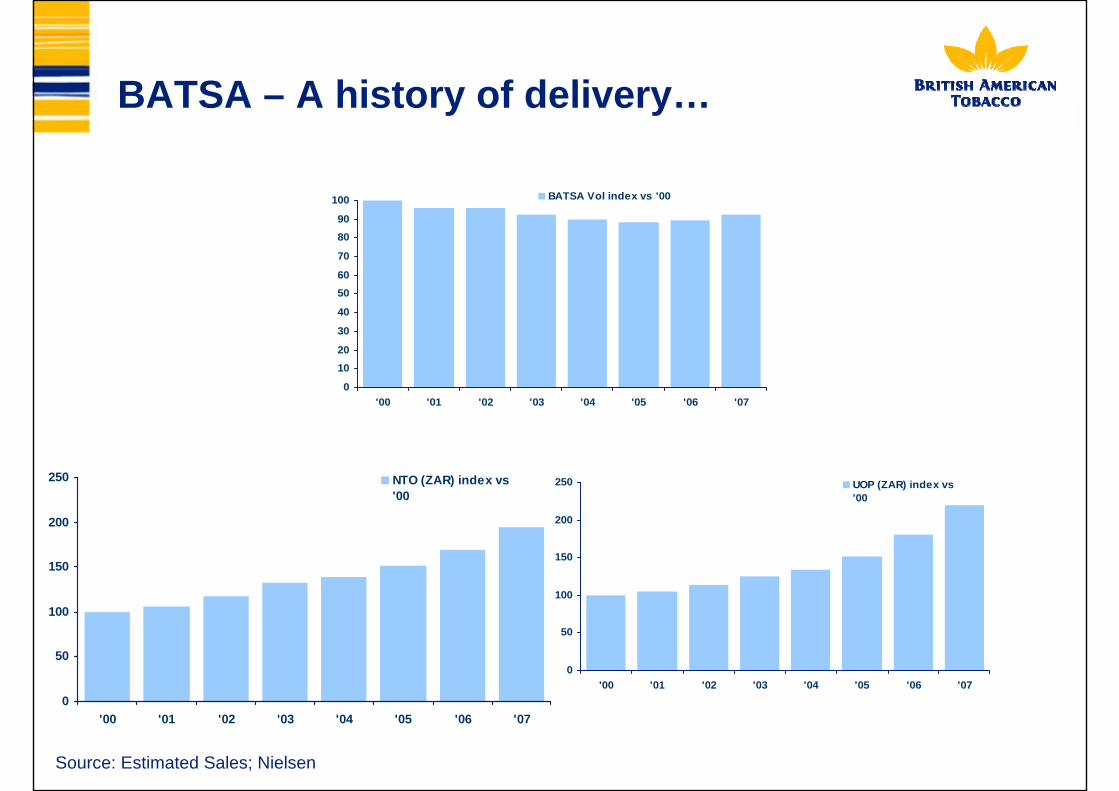
'00 '01 '02 '03 '04 '05 '06 '07
NTO (ZAR) index vs'00
BATSA – A history of delivery…
0
1020
30
40
5060
70
8090
100
'00 '01 '02 '03 '04 '05 '06 '07
BATSA Vol index vs '00
0
50
100
150
200
250
'00 '01 '02 '03 '04 '05 '06 '07
UOP (ZAR) index vs'00
Source: Estimated Sales; Nielsen

Embracing innovation
Our challenge is to deliver sustainable NTO growth…
Innovation allows us a platform to do so.
Innovation:- Creates excitement- Provides a competitive advantage- Delivers value to the consumer- Justifies higher pricing

BATSA … driving innovation harder

RetailProduction Sales & Distribution
Wholesalers
Cash & Carry
RetailProductionProduction Sales & DistributionSales & Distribution
Wholesalers
Cash & Carry
RetailProduction Sales & Distribution
TM Rep
RetailProductionProduction Sales & DistributionSales & Distribution
TM Rep
No commercial relationship with retailReduced flexibility and agility
Source: Team Shosholoza
We challenge even our own success models
Indirect Sales Model Direct Sales Model
Speed to MarketTargeted distributionOwning the commercial relationship with retail

Focus on International and Premiumbrands, Lights and ASU30 (adult smokers under the age of 30)
Global Drive Brands -Dunhill-Kent
International Brands-Peter Stuyvesant-Rothmans
Inspiring consumers

Changing with the timesGrowing in the lights segment
Peter Stuyvesant undoubtedly no 1
39.0%40.3%
41.1%41.9%
43.4%44.5% 43.8% 43.8%
44.9%
2000 2001 2002 2003 2004 2005 2006 2007 2008

Agenda
11
22
33
SA Environment
BATSA – Progress to date
Learning from other markets

A Strategy for Value Creation…

2 key value creation opportunities
Consumer saliency to Premium, Lights & International
The ability to drive Innovation hard…..both to build market share and as a value-generator

Attractive segment dynamics
7%
42%
13%
24%
14%
5%14%
41%43%
12%
15%26%
19%
16%9%
0%
20%
40%
60%
80%
100%
2004 2005 2006 2007 2008 2009
NF Low VFM Medium Premium
0%
10%
20%
30%
40%
50%
60%
70%
80%
2004 2005 2006 2007 2004 2005 2006 2007 2004 2005 2006 2007
Share of Market Share Of ASU30
Premium
LightsInternational
Brands
Price Segment Dynamics
Emerging Segments
Nielsen Retail Audit

2004 2005 2006 2007 2008
2.0%
98.1%
27.5%
72.5%
35.9%
64.1%
45.3%
54.7%
53.0%
47.0%
0%
10%
20%
30%
40%
50%
60%
70%
80%
90%
100%
Innovations Others
New product development / Innovation as a value New product development / Innovation as a value driverdriver
Derived Value Share2008
Vogue Collections: Ephemere (Feb)Yava Export (Jan)
2007
Dunhill Top Leaf (Jan)Vogue Collections: B&W (Feb)Kent Nanotek (Apr)Pall Mall SS Aromatic & TT (Jun & Oct)Dunhill Tribute (July)Dunhill FC (Nov)
2006
Vogue Arome 2&3 (Mar & Jul)Viceroy Filters (Mar)Pall Mall SS Menthol (Apr)
2005
Vogue Arome 1 (Feb)Kent Mintek (Apr)Pall Mall SS Lights, Ultra (Aug) Viceroy Special (Jun)
2004
Kent 3-tek launch Dunhill KS launch (Oct)

850
690
550
440370330
310280230
1201000
100
200
300
400
500
600
700
800
900
'98 '99 '00 '01 '02 '03 '04 '05 '06 '07 '08 LE
NTO index vs '98
-10%
0%
13%17% 17%
26%
'98 '99 '00 '01 '02 '03 '04 '05 '06 '07 '08 LE
UOP
OpMargin (Market View)
36%34%31%29%26%
41%41%44%48%
54%
20%
25%
30%
35%
40%
45%
50%
55%
60%
JAN 2004 MAR 2005 MAR 2006 APR 2007
PMI Prem ShareBAT Prem Share
26.8%
23%
27.2%
26.6%
28%
26.8%
0%
5%
10%
15%
20%
25%
30%
35%
JAN '04 AUG '04 MAR '05 OCT '05 MAY '06 NOV '06 MAY '07 NOV '07
BAT MS PMI MS GLH MS JTI MS
T30 SOM
Creating accelerated value and enhancing sustainability…
JUN ’08JAN’04
**
5%0% +0.4%
** Nielsen data National Russia (Jan 2004 – Jun’ 2008)QPR 2 2008Please note : All figures are for consolidated (commercial and ops) excluding Belarus and internal Export business to ensure like for like comparison at budget rate ([email protected], 2008- @51)
BAT VOLUME
'97 '98 '99 '00 '01 '02 '03 '04 '05 '06 '07 '08
4+2 Other
* Volumes with Captain Black included
JUN’08

Summary
Our business in South Africa is GREAT!!
Growing consumer class with $$ looking for more
The innovations journey is the road to take
We are on the way…..taking learnings from where we have a proven track record.

Productivity initiatives 2003 – 2007
Cumulative savings, £m
2003 2004 2005 2006 2007
Overheads & indirects 64 153 256 355 455 Supply chain 27 120 226 374 551Total 91 273 482 729 1,006
Factory Footprint 2003 2004 2005 2006 2007
Cigarette factories 72 67 64 52 47
Countries 61 58 55 45 40
Annualised savings of £1bn by 2007Source: Company data

Productivity savings goal: 2008 – 2012
Productivity savings a significant driver of profit growthSome drop through to the bottom lineBalance reinvested in the businessTarget of a further £800m by 2012
- Savings from supply chain, overheads & indirects- Supply chain efficiencies
- Back office integration
- Management structures
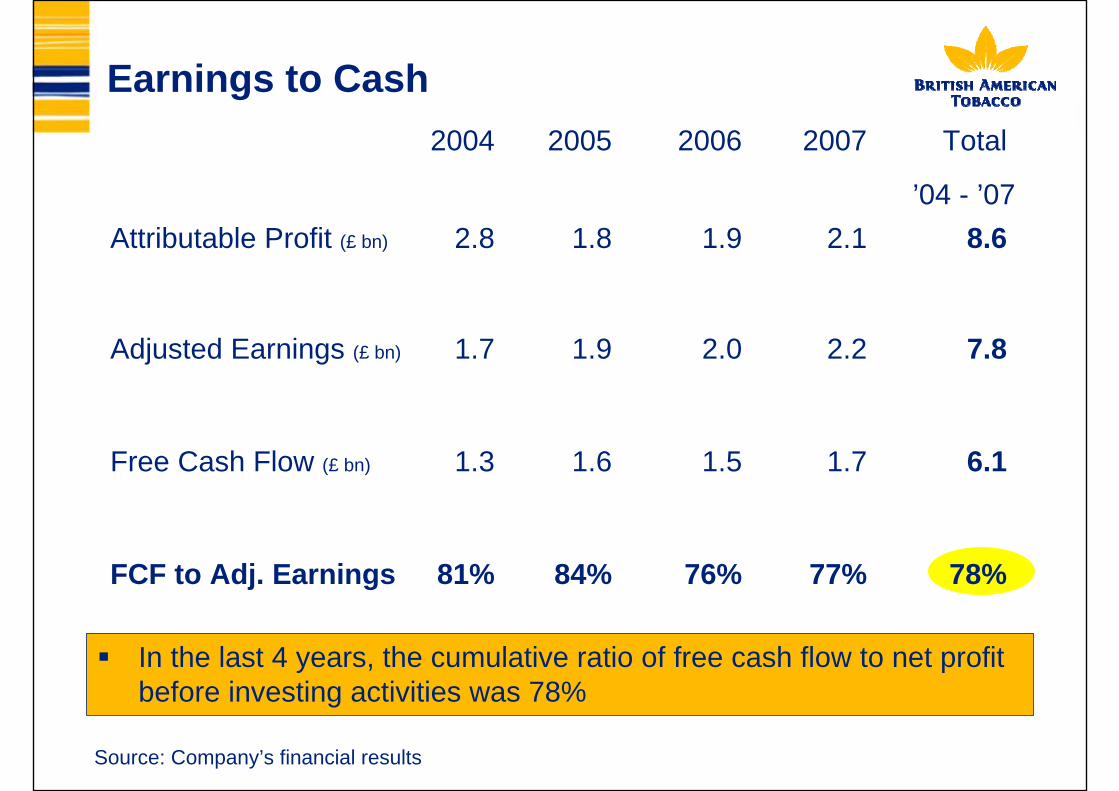
Earnings to Cash
In the last 4 years, the cumulative ratio of free cash flow to net profit before investing activities was 78%
2004 2005 2006 2007 Total
’04 - ’07Attributable Profit (£ bn) 2.8 1.8 1.9 2.1 8.6
Adjusted Earnings (£ bn) 1.7 1.9 2.0 2.2 7.8
Free Cash Flow (£ bn) 1.3 1.6 1.5 1.7 6.1
FCF to Adj. Earnings 81% 84% 76% 77% 78%
Source: Company’s financial results

Use of funds
In the last five years, £7.7bn has been returned to shareholders through dividends and share buy backs – and we are now returning all the free cash flow.
£ bn 2003 2004 2005 2006 2007 Total ’02 - ’07
Free Cash Flow (1.6) 1.3) 1.6) 1.5) 1.7) 7.7)Dividends Paid (0.8) (0.8) (0.9) (1.0) (1.2) (4.7)Share buy-back (0.7) (0.5) (0.5) (0.5) (0.8) (3.0)Sub Total 0.1) (0.1) 0.2) 0.0) (0.3) 0.0)Other net flows (1.9) 0.2) (0.1) 0.0) 0.2) (1.6)Net cash flows (1.8) 0.1) 0.1) 0.0) (0.1) (1.7)

Financial policies
Board commitment to investment grade ratingsLiquidity: to maintain minimum of £1bn in cash and committed facilitiesMaturity profile has an average maturity of 5 yearsGross interest cover targeted between 5 and 9 times Dividend policy is to distribute 65% of long term sustainable earnings from 2008Share repurchase programme target was £750m in 2007 but currently scaled back to £400m

£1.75bn committed Group revolving credit facility
Strong cash flows and cash balances
Smooth maturity profile
Almost all debt is unsecured with a limited use of leasing
Credit ratings
Financing plan / liquidity
Moody’s S&P FitchLong term rating Baa1 BBB+ BBB+Short term rating P-2 A-2 F2Outlook Stable Stable Stable

Volume and revenue: first half 2008
-6%
4%
14%
Volumes 2% 3% -4% 5% 1% 1%
Revenue (const) 8% 6% -1% 12% 3% 6%
Revenue (curr) 21% 10% 12% 12% 17% 15%
Europe AsiaPac LatAm AME AmPac Total
Source: Company data
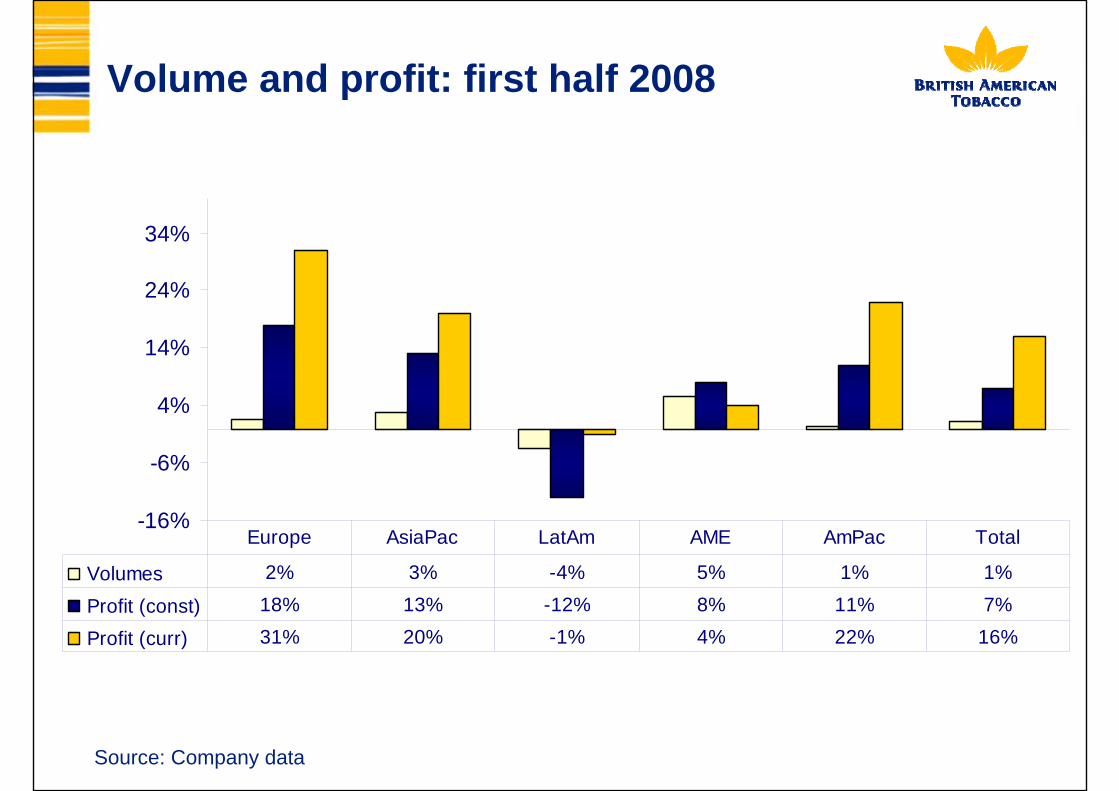
Volume and profit: first half 2008
-16%
-6%
4%
14%
24%
34%
Volumes 2% 3% -4% 5% 1% 1%
Profit (const) 18% 13% -12% 8% 11% 7%
Profit (curr) 31% 20% -1% 4% 22% 16%
Europe AsiaPac LatAm AME AmPac Total
Source: Company data

Margins: profit per 1000 cigarettes
H1 2008H1 2007
£3.53
£4.51
£5.21 £5.33
£9.56
£4.61£4.55
£5.26 £5.34 £5.28
£11.62
£5.26
£0
£12
Europe Asia-Pac Lat Am AME Am-Pac Group
Source: Company’s interim report 2008

Operating margin
23.6%
36.0%
40.9%
37.5%
40.3%
32.2%
25.7%
39.2%
36.1%34.7%
42.2%
32.2%
0.0%
45.0%
Europe Asia-Pac Lat Am AME Am-Pac Group
Source: Company’s interim report 2008
H1 2008H1 2007

Drivers of adjusted EPS growth
Pence %EPS H1 2007 53.5.Profit performance 3.5. 6.5.Net finance costs (1.1) (2.0)AssociatesTaxationMinoritiesShare buy-backExchangeEPS H1 2008
0.3.0.7.0.1.0.9.4.1.
62.0.
0.5.1.3.0.3.1.7.7.6.
15.9.
Source: Company data

Distributing 65% of sustainable net earnings as dividends (with balance of free cash flow for strategic acquisitions or share buy-backs, subject
to maintaining an acceptable credit rating)
Future expectations
Top Line Growth• Volume growth• Pricing• Mix Improvements
Productivity Savings• Overheads• Indirects• Supply Chain
Operating Profit growth of 6% p.a. on averageFinancial Efficiencies• Share buy backs• Others
High single digit earnings growth
* Based on internal estimates over the medium to long term

In summary:
Significant global business
Geographically diversified to mitigate risk
Leadership position in more than 50 markets
Clearly articulated strategy that works
Powerful brand portfolio
Innovative business developing new propositions
Improving margins through brand mix and productivity strategies
Highly cash generative with a strong balance sheet
Track record of consistent performance
Focused on delivering great shareholder value

Investor queries should be addressed to the Investor Relations Department in London. Please do not contact the local offices in South Africa.
Ralph Edmondson +44 207 845 1180
Rachael Brierley +44 207 845 1519
Top Related