


Languages
Pages
Legal


Investment AB KinnevikSkeppsbron 18
P.O. Box 2094SE-103 13 Stockholm Sweden
www.kinnevik.se
(Publ) Reg no 556047-9742Phone +46 8 562 000 00
Fax +46 8 20 37 74
Highlights-
---
20000
30000
40000
50000
60000
70000
Q1
10
Q4
09
Q3
09
Q2
09
Q1
09
Q4
08
Q3
08
Q2
08
Q1
08
Q2
10Q
3 10
Q4
10
Q1
11Q
2 11
Q3
11
Q4
11
Q1
12Q
2 12
Q3
12
Q4
12
Kinnevik’s net asset value 2007-2012Pro forma adjusted for the acquisition of Emesco during Q3 2009. Figures in SEK m.
YEAR-END RELEASE 2012
-
Financial results for the fourth quarter
-
-
Financial results for 2012
The figures in this report refer to the fourth quarter and full year 2012 exclu-ding discontinued operations unless otherwise stated. The figures shown within brackets refer to the comparable periods in 2011.

6
5
4
3
2
1
Telecom & Services 61% (70%)
Online 25% (12%)
Media 7% (8%)
Paper & Packaging 5% (8%)
Agriculture & Renewable energy 1% (2%)
Microfinancing 1% (1%)
Kinnevik’s business sectors The figures shown within brackets refer to the comparable period previous year.
Total return
The Kinnevik share’s average annual total returnPast 30 years 1) 20%
Past 10 years 23%
Past 5 years 1%
Past 12 months 5%
1) Based on the assumption that shareholders have retained their allotment of shares in Tele2, MTG, Transcom and CDON.
Kinnevik’s growth drivers
-
--
-
-
-
Proportional part ofChange compared to
Jan-Dec 2011
Jan-Dec 2012 (SEK m) revenue EBIT revenue EBITTelecom & Services 27 394 4 500 7% -15%
Online 5 888 -1 362 121% N/A
Media 4 374 514 -1% 1 115%
Paper & Packaging 4 596 331 5% -30%
Microfinancing 258 92 -8% 4%
Agriculture and Renewable energy 325 1 90% N/A
Total sum of Kinnevik’s proportional part of revenue and operating result 42 835 4 076 14% -27%
-
Kinnevik’s proportional part of revenue and operating result in its holdings

Events during the fourth quarter
-
-
-
-
-
-
-
-
Dividend and capital structure
-
Kinnevik’s part of dividends proposed to be paid from listed holdings
Amount (SEK m)
Millicom USD 2.64 per share 6511)
Tele2 SEK 7.10 per share 962
MTG SEK 10.00 per share 135
BillerudKorsnäs SEK 2.00 per share 104
Total expected dividends to be received from listed holdings 1 852
Of which ordinary dividends
Proposed dividend to Kinnevik’s shareholders SEK 6.50 per share 1 803
1) Based on an exchange rate of 6.52 SEK/USD.
-

Book and fair value of assets
31 Dec 2012 Book value Fair value Fair value Total return
SEK million
Equity interest
(%)
Voting interest
(%)2012
31 Dec2012
31 Dec2011
31 Dec 2012 Telecom & Services
Millicom 38.0 38.0 21 283 21 283 26 088 -13%
Tele2 30.5 47.7 15 867 15 867 18 129 -3%
Transcom 33.0 39.7 230 230 189 22%
Total Telecom & Services 37 380 37 380 44 406 -11%
Online
Zalando (directly and indirectly through Rocket) 35 26 8 526 8 526 1 558
Rocket Internet with other portfolio companies 1) 4 776 4 776 5 073
Avito (directly and through Vosvik) 39 2) 22 923 923 336
CDON 25.1 25.1 664 664 629 6%
Other Online investments 172 229 204
Total Online 15 061 15 118 7 800 59%
Media
MTG 20.3 49.8 3 042 3 042 4 436 -29%
Metro 99 3) 99 3) 993 993 277
Metro subordinated debentures, interest bearing - - 287
Interest bearing net cash, Metro 187 187 -
Total Media 4 222 4 222 5 000 -26%
Paper & Packaging
BillerudKorsnäs 4) 5) 25.1 25.1 3 161 3 161 10 449
Interest bearing net debt relating to Korsnäs - - -5 212
Total Paper & Packaging 3 161 3 161 5 237 38%
Microfinancing
Bayport 43 3) 43 3) 586 586 405
Seamless 5) 11.8 11.8 65 65 0 185%
Other Microfinancing investments 72 88 41
Total Microfinancing 723 739 446 5%
Agriculture & Renewable energy
Black Earth Farming 24.9 24.9 456 456 427 -36%
Rolnyvik 100 100 184 250 250
Vireo 78 78 77 134 58
Other agriculture investments 4 4 -
Total Agriculture & Renewable energy 721 844 735 -24%
Other interest bearing net debt -3 008 -3 008 -1 605
Debt, unpaid investments -110 -110 -490
Other assets and liabilities 423 423 310
Total equity/net asset value 58 573 58 769 61 839
Net asset value per share 212.02 223.10
Closing price, class B share 135.30 133.80 5%
1) For split, please see page 6.2) After full dilution.3) After warrants have been utilised. 4) As per December 2011, consensus among analysts covering Kinnevik and including 5% of the shares in Bergvik Skog and 75% of the shares in Latgran Biofuels
AB.5) As per December 2012, including subscribed and paid but not yet received shares.

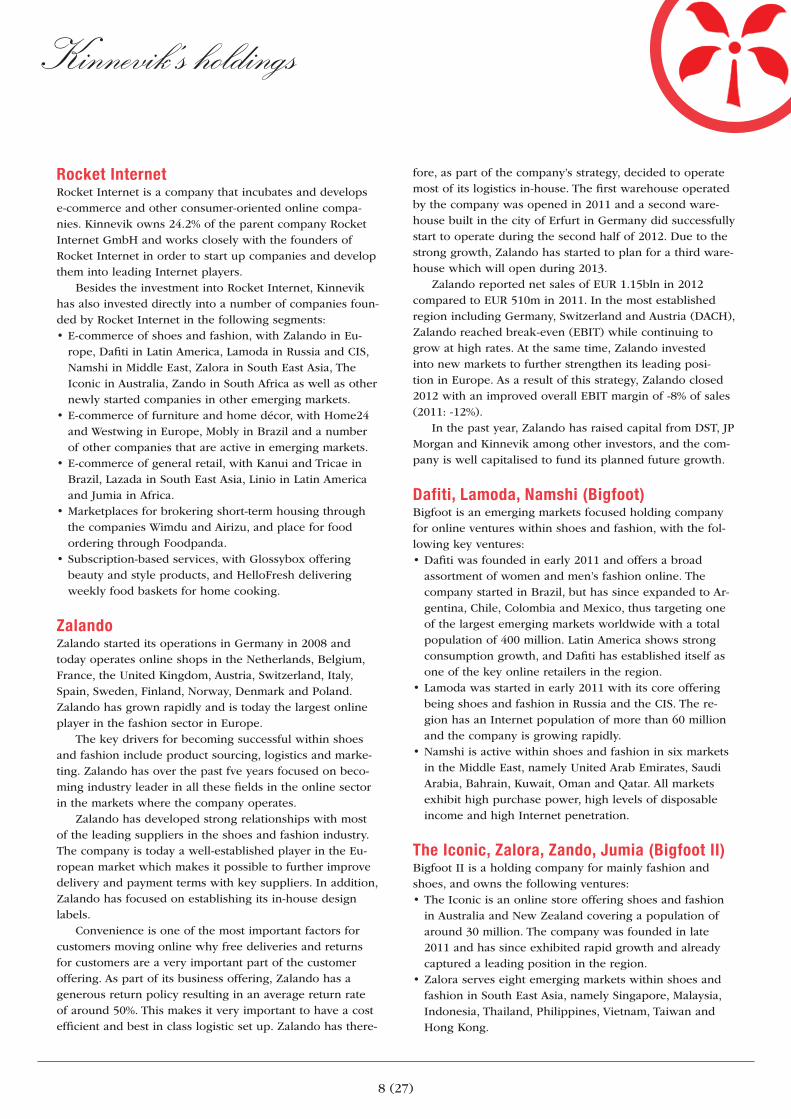
Kinnevik’s holdings
Telecom & ServicesInvestment (SEK m) Ownership Estimated fair value
Millicom 38.0% 21 283
Tele2 30.5% 15 867
Transcom 33.0% 230
Total 37 380
Return Telecom & Services 1 year 5 yearsAverage yearly internal rate of return (IRR) -11% 2%
-
--
-
-
--
MillicomJan-Dec Oct-Dec
Key data (USD m) 2012 2011 2012 2011Revenue 4 814 4 530 1 266 1 177
EBITDA 2 065 2 087 528 536
Operating profit, EBIT 1 104 1 257 266 333
Net profit 504 1 129 68 234
Number of mobile subscribers (million) 47.2 43.1
-
-
Tele2Jan-Dec Oct-Dec
Key data (SEK m) 2012 2011 2012 2011Revenue 43 726 41 001 11 275 10 852
EBITDA 10 960 11 212 2 672 2 873
Operating profit, EBIT 5 653 7 050 1 524 1 663
Net profit 3 264 4 751 565 1 310
Number of subscribers (million) 38.2 34.2
-
--
-

Kinnevik’s holdings
Investments and valuation
--
-
-
Return Online 1 year 5 yearsAverage yearly internal rate of return (IRR) 59% 38%
-
-
--
-
Fair value as per 31 December 2012
Investment (SEK m)
Direct equity
interest
Indirect equity
interest 1) Total
Accumula-ted invested
amount Direct
ownershipIndirectly
held 1) Total
Zalando GmbH 26% 9% 35% 4 685 6 279 2 247 8 526 Bigfoot I (Dafiti, Lamoda, partly Namshi) 30% 9% 39% 1 536 1 479 74 1 553 Bigfoot II (The Iconic, Zalora, partly Zando and Jumia) 32% 12% 44% 760 708 5 713
Home24 24% 12% 36% 791 754 18 772
Wimdu 29% 12% 41% 361 345 34 379
BigCommerce (Lazada, Linio, partly Namshi) 12% 17% 29% 289 286 16 302
Other Rocket portfolio companies 2) mixed mixed mixed 643 759 298 1 057
Total Rocket Internet with portfolio companies 9 065 10 610 2 692 13 302
Avito 22% 17% 39% 336 520 403 923
Other portfolio companies mixed mixed mixed 412 229 - 229
Total unlisted online investments 9 813 11 359 3 095 14 454
CDON Group 25,1% - 25,1% 517 3) 664 - 664
Total online investments 10 330 12 023 3 095 15 118
1) Held via Rocket Internet GmbH and Vosvik AB (Avito).2) Invested amount includes net invested amount in Rocket Internet GmbH (negative after dividends received in 2012). Fair value includes cash balance
in Rocket Internet GmbH.3) The value of dividends received from MTG when shares distributed and share purchases made thereafter.
Online

Kinnevik’s holdings
-
Company Valuation methodRocket Internet GmbH Portfolio companies valued as per below,
cash balance and other assets as per Rocket financial statements.
Zalando Latest transaction value (EUR 2.8 bln for entire company), which as per 31 Dec 2012 is in line with peer group valuation based on sales multiples. The peer group includes, among others, Asos, Amazon and CDON Group.
Bigfoot I, Bigfoot II, Home24, Wimdu, BigCommerce, Avito
Peer group valuation based on historic sales mulitples. Direct and indi-rect shareholding valued in accordance with liquidation preferential rights.
Other portfolio companies Fair value corresponds to cost.
-
-
-
Proportional part of revenue, EBIT and cash balances in unlisted online holdings
-
-
-
Kinnevik’s proportional part of revenue, EBIT and cash balance within its unlisted online holdings
SEK million Q1 Q2 Q3 Q4 FY2011 Q1 Q2 Q3 Q4 FY2012
Revenue 278 379 440 649 1 746 817 1 047 1 195 1 690 4 748Q on Q growth 37% 16% 48% 26% 28% 14% 41%Y on Y growth 194% 176% 172% 160% 172%
EBIT -364 -232 -325 -437 -316 -1 309
Accum. invested amount (net of dividends received) 9 813
Fair value as per 31 Dec 2012 14 454
Net proportional part of cash balance 31 Dec 2012 2 712
Kinnevik’s holdings
Rocket Internet
-
-
-
Zalando
--
-
-
-
-
-
-
Dafiti, Lamoda, Namshi (Bigfoot)
-
-
-
The Iconic, Zalora, Zando, Jumia (Bigfoot II)

Kinnevik’s holdings
-
Home24-
Wimdu
-
-
Lazada, Linio (BigCommerce)-
-
-
Avito
-
-
CDON Group
Jan-Dec Oct-Dec
Key data (SEK m) 2012 2011 2012 2011
Revenue 4 462 3 404 1 573 1 316
Operating profit/loss, EBIT -174 129 -111 71
Net profit/loss -152 83 -90 48
-

Kinnevik’s holdings
MediaInvestment (SEK m) Ownership Estimated fair valueModern Times Group MTG 20.3% 3 042
Metro 99%1) 1 180
Total 4 222
1) Fully diluted.
Return Media 1 year 5 yearsAverage yearly internal rate of return (IRR) -26% -11%
-
-
Modern Times Group MTGJan-Dec Oct-Dec
Key data (SEK m) 2012 2011 2012 2011Revenue 13 336 13 473 3 620 3 711
Operating profit/loss, EBIT 2 124 -615 476 -2 515
Net profit/loss 1 594 -1 289 378 -2 564
-
--
Metro
-
Readership and Advertising Market
-
Operations
Jan-Dec Oct-DecEUR m 2012 2011 2012 2011RevenueEurope 107.2 122.4 26.7 35.6
Emerging Markets 79.8 68.4 23.5 19.9
Head Quarters 6.9 6.1 1.8 2.5
Total 193.9 196.9 52.0 58.0
Operating profit, EBIT
Europe 9.5 16.3 4.0 7.0
Emerging Markets 9.3 11.7 3.8 3.4
Share of Associates Income 1.3 -0.2 0.8 -0.0
Head Quarters -10.5 -15.3 -2.8 -2.7
Total 9.6 12.5 5.8 7.7
-
Kinnevik’s holdings
-
Paper & Packaging
Investment (SEK m) Ownership Invested amount
Estimated fair value
BillerudKorsnäs 25.1% 2 867 1) 3 161
1) Value of shares received at the sale of Korsnäs plus the participation in the new share issue in December 2012.
Return Paper & Packaging 1 year 5 yearsAverage yearly internal rate of return (IRR) 38% 12%
BillerudKorsnäs-
Jan-Dec Oct-DecKey data (SEK m) 2012 2011 2012 2011Revenue 10 427 9 343 3 068 2 086
Operating profit/loss, EBIT 489 978 25 75
Net profit/loss 677 683 361 45
-
Microfinancing
Investment (SEK m) Ownership Invested amount
Estimated fair value
Bayport 43% 1) 445 586
Seamless 11.8% 35 65
Milvik 58% 18 18
Microvest II fund participation 45 42
Other 28 28
Total 571 739
1) After warrants have been utilised.
Return Microfinancing 1 year 5 yearsAverage yearly internal rate of return (IRR) 5% 16%
--
-
-
-
-

Kinnevik’s holdings
Agriculture & Renewable energy
Investment (SEK m) Ownership Invested amount
Estimated fair value
Black Earth Farming, Russia 24.9% 791 456
Rolnyvik, Poland 100% 174 250
Vireo Energy 78% 135 134
Other 5 4
Total 1 105 844
Return Agriculture & Renewable energy 1 year 5 yearsAverage yearly internal rate of return (IRR) -24% -20%
--
-
Black Earth Farming
Jan-Sept Full YearKey data (USD m) 2012 2011 2011Revenue 110.5 39.4 77.6
Operating profit/loss, EBIT 10.6 -14.0 -25.2
Net loss -2.5 -29.8 -41.7
-
Rolnyvik
Vireo Energy
-

Financial overview
Financial overview
Consolidated earnings for the fourth quarter
-
-
Consolidated earnings for the year
-
The Group’s cash flow and investments
-
-
The Group’s liquidity and financing
-
-
Taxes
--
-

-
-
-
-
-
Parent Company and other
Risk Management
-
-
-
-
Accounting principles
-
Related party transaction
Kinnevik Annual General Meeting 2013
Nomination Committee for the 2013 Annual General Meeting
-
-
Financial reports
--

Review Report
Introduction-
-
Scope of review
-
Conclusion
-
-
For further information, please visit www.kinnevik.se or contact:
Kinnevik was founded in 1936 and thus embodies more than seventy-five years of entrepreneurship under the same group of principal owners. Kinnevik’s objective is to increase shareholder value, primarily through net asset value growth. The company’s holdings of growth companies are focused around the following business sectors; Telecom & Services, Online, Media, Paper & Packaging, Microfinancing, and Agriculture & Renewa-ble energy.
Kinnevik has a long history of investing in emerging markets which has resulted in a considerable exposure to consumer sectors in these markets. Kinnevik plays an active role on the Boards of its holdings.
The Kinnevik class A and class B shares are listed on NASDAQ OMX Stockholm’s list for Large Cap companies within the financial and real estate sector. The ticker co-des are KINV A and KINV B.
16 (27)
CONDENSED CONSOLIDATED INCOME STATEMENT (SEK m)
Note2012
Full year2011
Full year
2012 1 Oct- 31 Dec
2011 1 Oct- 31 Dec
CONTINUING OPERATIONS
Revenue 1 591 330 530 97
Cost of goods sold and services -957 -232 -334 -69
Gross profit/loss 634 98 196 28
Selling, administration, research and development costs -771 -245 -254 -87
Other operating income 92 23 57 6
Other operating expenses -53 -1 -9 0
Operating profit/loss -98 -125 -10 -53
Share of profit/loss of associates accounted for using the equity method
10 - 10 -
Dividends received 2,7 4 263 4 947 1 430 767
Change in fair value of financial assets 2 -6 910 1 074 -2 693 4 292
Interest income and other financial income 55 67 20 19
Interest expenses and other financial expenses -255 -168 -66 -46
Profit/loss after financial items -2 935 5 795 -1 309 4 979
Taxes -56 58 -12 29
NET PROFIT/LOSS FROM CONTINUING OPERATIONS -2 991 5 853 -1 321 5 008
Net profit from discontinued operations 4 3 473 702 2 955 128
NET PROFIT/LOSS FOR THE PERIOD 482 6 555 1 634 5 136
Of which attributable to:
Equity holders of the Parent Company
Net profit/loss from continuing operations -2 984 5 857 -1 323 5 009
Net profit/loss from discontinued operations 3 462 696 2 952 127
Non-controlling interest
Net profit/loss from continuing operations -7 -4 2 -1
Net profit/loss from discontinued operations 11 6 3 1
Earnings per share
Earnings per share before dilution, SEK 1.72 23.64 5.88 18.53
Earnings per share after dilution, SEK 1.72 23.62 5.88 18.51
From continuing operations:
Earnings per share before dilution, SEK -10.77 21.13 -4.77 18.07
Earnings per share after dilution, SEK -10.77 21.11 -4.77 18.05
Average number of shares before dilution 277 183 276 277 173 242 277 183 276 277 183 276
Average number of shares after dilution 277 483 454 277 396 143 277 505 356 277 442 627

17 (27)
CONSOLIDATED STATEMENT OF COMPREHENSIVE INCOME (SEK m)
2012 Full year
2011 Full year
2012 1 Oct- 31 Dec
2011 1 Oct- 31 Dec
Net profit/loss for the period 482 6 555 1 634 5 136
Other comprehensive income for the period
Translation differences -31 -3 32 -10
Cash flow hedging 5 -82 - -3
Actuarial profit/loss - -14 - -14
Tax attributable to other comprehensive income -1 25 - 4
Total other comprehensive income for the period -27 -74 32 -23
Total comprehensive income for the period 455 6 481 1 666 5 113
Total comprehensive income for the period attributable to:
Equity holders of the Parent Company 453 6 478 1 656 5 114
Non-controlling interest 2 3 10 -1

18 (27)
CONDENSED CONSOLIDATED CASH-FLOW STATEMENT (SEK m)
Note2012
Full year2011
Full year
2012 1 Oct- 31 Dec
2011 1 Oct- 31 Dec
CONTINUING OPERATIONS
Operating profit/loss -98 -125 -10 -63
Adjustment for non-cash items 114 53 47 12
Taxes paid -88 -1 -11 5
Cash flow from operations before change in working capital -72 -73 26 -46
Change in working capital -150 11 -48 30
Cash flow from operations -222 -62 -22 -16
Acquisition of subsidiaries 6 -532 -148 -5 -
Sale of subsidiaries 106 - 8 -
Investments in tangible and biological fixed assets -92 -37 -34 -29
Investments in intangible fixed assets -13 -5 -2 -1
Investments in shares and other securities 6 -7 462 -2 632 -2 656 -748
Sales of shares and other securities 572 28 3 -
Dividends received 7 4 264 4 947 1 431 767
Changes in loan receivables 219 -26 9 -35
Interest received 55 26 30 19
Cash flow from investing activities -2 883 2 153 -1 216 -27
Change in interest-bearing liabilities 1 093 -389 -1 646 186
Interest paid -255 -100 -115 -27
Contribution from holders of non-controlling interest 32 - 17 -
Dividend paid to equity holders of the Parent company -1 524 -1 247 - -
Dividend paid to holders of non-controlling interest -4 -4 -4 -4
Cash flow from financing activities -658 -1 740 -1 748 155
CASH FLOW FOR THE PERIOD FROM CONTINUING OPERA-TIONS -3 763 351 -2 986 112
Cash flow for the period from discontinued operations4 4 035 -319 2 989 -189
CASH FLOW FOR THE PERIOD272 32 3 -77
Exchange rate differences in liquid funds0 0 0 0
Cash and short-term investments, opening balance 182 150 451 259
Cash and short-term investments, closing balance 454 182 454 182
.

19 (27)
CONDENSED CONSOLIDATED BALANCE SHEET (SEK m)
ASSETS Note2012
31 Dec2011
31 DecFixed assets
Intangible fixed assets 1 044 957
Tangible and biological fixed assets 281 6 526
Financial assets accounted to fair value through profit and loss 3 59 953 58 615
- whereof interest-bearing 28 227
Financial assets held to maturity - 263
Investments in companies accounted for using the equity method 79 242
Deferred tax assets 18 -
61 375 66 603
Current assets
Inventories 64 2 180
Trade receivables 372 771
Tax receivables 36 25
Other current assets 331 307
Short-term investments 1 0
Cash and cash equivalents 453 182
1 257 3 465
TOTAL ASSETS 62 632 70 068
SHAREHOLDERS’ EQUITY AND LIABILITIES
Shareholders’ equity
Equity attributable to equity holders of the Parent Company 58 573 59 637
Equity attributable to non-controlling interest 67 50
58 640 59 687
Long-term liabilities
Interest-bearing loans 1 174 4 936
Provisions for pensions 37 534
Other provisions 4 9
Deferred tax liability 0 1 060
Other liabilities 14 12
1 229 6 551
Short-term liabilities
Interest-bearing loans 2 111 1 741
Provisions 4 19
Trade payables 156 999
Income tax payable 59 10
Other payables 433 1 061
2 763 3 830
TOTAL SHAREHOLDERS’ EQUITY AND LIABILITIES 62 632 70 068

20 (27)
CONDENSED REPORT OF CHANGES IN EQUITY FOR THE GROUP (SEK m)
2012 Full year
2011 Full year
2012 1 Oct- 31 Dec
2011 1 Oct- 31 Dec
Equity, opening balance 59 687 54 425 57 004 54 576
Total comprehensive income for the period 455 6 481 1 666 5 113
Acquisitions from non-controlling interest -25 - - -
Business combination, non-controlling interest 59 22 3 -
Contribution from non-controlling interest 32 2 20 -
Dividend paid to owners of non-controlling interest -4 -4 -4 -4
Sale of shares, non-controlling interest -47 - -47 -
Dividend paid to shareholders of the Parent company -1 524 -1 247 - -
Effect of employee share saving programme 7 8 -2 2
Equity, closing amount 58 640 59 687 58 640 59 687
Equity attributable to the shareholders of the Parent Company
58 573 59 637 58 573 59 637
Equity attributable to non-controlling interest 67 50 67 50
KEY RATIOS2012
Full year2011
Full yearDebt/equity ratio 0.06 0.12
Equity ratio 94% 85%
Net debt 2 840 6 539
DEFINITIONS OF KEY RATIOS
Debt/equity ratio Interest-bearing liabilities including interest-bearing provisions divided by share-holders’ equity.
Equity ratio Shareholders’ equity including non-controlling interest as percentage of total assets.
Net debt Interest-bearing liabilities including interest-bearing provisions less the sum of inte-rest-bearing receivables, short-term investments and cash and cash equivalents.
Operating margin Operating profit after depreciation divided by revenue.

21 (27)
NOTES TO THE GROUP’S FINANCIAL STATEMENTS (SEK m)Note 1 Condensed segment reporting
Kinnevik is a diversified company whose business consists of managing a portfolio of investments and to conduct operations through subsidiaries. The Kinnevik Group’s accounting is distributed on the following three accounting segments: Metro - following the acquisition of Metro on 29 March 2012, Metro is an accounting segment from the second quarter 2012. Other operating subsidiaries - Rolnyvik, Vireo Energy, Relevant Traffic (disposed in the fourth quarter 2012), Duego Technologies, Saltside, Milvik and G3 Good Governance Group.Parent Company & other - all other companies and financial assets (including change in fair value of financial assets).This distribution coincides with the internal structure for controlling and monitoring used by Kinnevik’s management.
1 Jan-31 Dec 2012 Metro
Other operating
subsidiaries
Parent company &
otherTotal
Group
Revenue 1 234 349 8 1 591
Operating costs -1 151 -440 -127 -1 718
Depreciation -18 -11 -3 -32
Other operating income and expenses 4 57 61
Operating profit/loss 69 -45 -122 -98
Share of profit/loss of associates accounted for using the equity method 10 10
Dividends received 4 263 4 263
Change in fair value of financial assets -6 910 -6 910
Financial net -55 -8 -137 -200
Profit/loss after financial items 24 -53 -2 906 -2 935
Investments in subsidiaries and financial fixed assets 845 110 7 063 8 018
Investments in tangible, biological and intangible fixed assets 17 82 6 105
Impairment of goodwill -22 -22
1 Jan-31 Dec 2011
Other operating
subsidiaries
Parent company &
otherTotal
GroupRevenue 318 12 330
Operating costs -332 -121 -453
Depreciation -22 -2 -24
Other operating income and expenses 15 7 22
Operating profit/loss -21 -104 -125
Dividends received 4 947 4 947
Change in fair value of financial assets 1 074 1 074
Financial net 0 -101 -101
Profit/loss after financial items -21 5 816 5 795
Investments in subsidiaries and financial fixed assets 143 3 127 3 270
Investments in tangible, biological and intangible fixed assets 39 2 41

22 (27)
1 Oct-31 Dec 2012 Metro
Other operating
subsidiaries
Parent company &
otherTotal
GroupRevenue 437 91 2 530
Operating costs -392 -167 -44 -603
Depreciation -3 -3 -1 -7
Other operating income and expenses 2 68 0 70
Operating profit/loss 44 -11 -43 -10
Share of profit/loss of associates accounted for using the equity method 10 10
Dividends received 1 430 1 430
Change in fair value of financial assets -4 -2 689 -2 693
Financial net -8 -8 -30 -46
Profit/loss after financial items 42 -19 -1332 -1309
Investments in subsidiaries and financial fixed assets 19 5 2 627 2 651
Investments in tangible, biological and intan-gible fixed assets 10 22 4 36
Impairment of goodwill -4 -4
1 Oct-31 Dec 2012
Other operating
subsidiaries
Parent company &
otherTotal
GroupRevenue 93 4 97
Operating costs -100 -53 -153
Depreciation -3 0 -3
Other operating income and expenses 5 1 6
Operating profit/loss -5 -48 -53
Dividends received 767 767
Change in fair value of financial assets 4 292 4 292
Financial net -2 -25 -27
Profit/loss after financial items -7 4 986 4 979
Investments in subsidiaries and financial fixed assets 1 238 1 238
Investments in tangible, biological and intan-gible fixed assets 30 30

23 (27)
Note 2 Change in fair value of financial assets and dividends received
2012 Full year
2011 Full year
2012 1 Oct- 31 Dec
2011 1 Oct- 31 Dec
Listed holdings
Millicom -3 399 2 965 -1 029 956
Tele2 -501 2 873 -257 1 071
Transcom 41 -314 -20 -109
CDON 35 108 -17 209
Groupon, direct ownership -627 747 - 747
MTG -1 272 -1 472 -875 716
Metro 1) 39 -382 0 -92
BillerudKorsnäs 294 - 294 -
Seamless 30 - -4 -
Black Earth Farming -104 -396 -54 -110
Total listed holdings -5 464 4 129 -1 962 3 388
Unlisted holdings
Online 2 752 1 811 689 1 646
Media 0 - -3 -
Microfinancing 65 73 13 25
Agriculture 0 8 0 0
Total unlisted holdings 2 817 1 892 699 1 671
Total -2 647 6 021 -1 263 5 059
Note 3 Financial assets accounted at fair value through profit and loss
31 Dec 2012Class
A sharesClass
B shares2012
31 Dec 2011
31 DecListed holdings
Millicom 37 835 438 21 283 26 088
Tele2 18 507 492 116 988 645 15 867 18 129
Transcom 247 164 416 163 806 836 230 189
CDON 16 639 607 664 629
Groupon, direct ownership - 1 197
MTG 5 119 491 8 384 365 3 042 4 436
Metro 1) - 277
BillerudKorsnäs 51 827 388 3 161 -
Seamless 3 898 371 65 -
Black Earth Farming 51 811 828 456 427
Total listed holdings 44 768 51 372
Unlisted holdings
Online 14 404 5 895
Media 84 -
Microfinancing 657 440
Paper & Packaging - 656
Agriculture 3 3
Parent Company & other 37 249
Total unlisted holdings 15 185 7 243
Total 59 953 58 615
1) Metro became a subsidiary to Kinnevik on 29 March 2012. The change in fair value for 2012 relates to the period from 1 January until the bid was published on 6 February.

24 (27)
Note 4 Discontinued operations
On 20 June 2012, Kinnevik announced that an agreement had been reached with Billerud regarding a merger between Kors-näs and Billerud. The transaction was completed on 29 November 2012. In consideration, Kinnevik received a cash payment of SEK 2,752m (before transaction costs); 25% of the shares in the new company BillerudKorsnäs (with a market value of SEK 2,367m on the closing day); and a SEK 500m promissory note (which was used to participate in BillerudKorsnäs’s rights issue in December 2012). BillerudKorsnäs also assumed net debt of SEK 5,576m as part of the transaction. All in all, Korsnäs was valued at SEK 11,195m on the closing day.
The divestment of Korsnäs - including 75% of the shares in Latgran Biofuels and 5% of the shares in Bergvik Skog - has been reported separately as discontinued operations in the income statement, with retrospective adjustment of previous peri-ods, as per IFRS 5-Non-current assets held for sale and discontinued operations.
Financial statements
Income statement for discontinued operations
2012 Full year
2011 Full year
2012 1 Oct- 31 Dec
2011 1 Oct- 31 Dec
Revenue 8 206 8 475 1 462 2 089
Operating costs -6 788 -7 031 -1 282 -1 860
Depreciation -584 -623 -106 -159
Other operating income and expenses 46 130 5 64
Operating profit/loss 880 951 79 134
Dividends received 4 4 0 0
Sale of shares in discontinued operations 2 901 - 2 901 -
Change in fair value of financial assets -49 97 -60 69
Financial net -89 -158 44 -41
Profit/loss after financial items 3 647 894 2 964 162
Taxes -174 -192 -9 -34
Net profit for the period 3 473 702 2 955 128
Cash flow statement for discontinued operations
2012 Full year
2011 Full year
2012 1 Oct- 31 Dec
2011 1 Oct- 31 Dec
Cash flow from operations 1 676 843 275 220
Cash flow from investing activities -653 -855 -210 -362
Cash flow from financing activities 611 -307 523 -47
Cash flow for the period 1 634 -319 588 -189
Gross payment from Billerud 5 331 - 5 331 -
Repayment of Kinnevik’s loans from Korsnäs -2 579 - -2 579 -
Cash consideration 2 752 - 2 752 -
Transaction costs -27 - -27 -
Cash in Korsnäs at closing -324 - -324 -
Cash flow from discontinued operations 4 035 -319 2 989 -189

25 (27)
Note 5 Business combination
On 6 February 2012 Kinnevik made a public offer for all shares and other financial instruments in Metro, which resulted in Kinnevik becoming the principal owner of Metro on 29 March owning 97.1% of the capital on a fully diluted basis. After further share purchases, Kinnevik owned 99.0% of the capital as per 31 December 2012. Kinnevik is consolidating Metro from 31 March 2012, which is the first date on which Metro prepared consolidated financial statements following the acquisition. The acquisition value for all of Metro including Kinnevik’s earlier holdings, as well as non-controlling interests has according to the acquisition assessment been calculated at SEK 1,419m including debentures of SEK 492m.
The provisional fair value of the identifiable assets and liabilities of Metro as at the date of acquisition was:
Fair value recogni-sed on acquisition
Intangible fixed assets 462Tangible and biological fixed assets 44
Financial assets accounted to fair value through profit and loss 86
Investments in companies accounted for using the equity method 40Trade and other receivables 482Cash and cash equivalents 388Total assets 1 502
Equity attributable to non-controlling interest -17Interest bearing-loans -546Trade payables and other liabilities -484Total liabilities -1 047
Total identifiable net assets at fair value 455Goodwill arising on acquisition 472Purchase consideration for shares and warrants 927
Analysis of the purchase consideration:
Cash consideration 573Fair value previously held interest 315Fair value minority interest 39Purchase consideration for shares and warrants 927
Analysis of cash flow on acquisition:
Net cash acquired with the subsidiary 388Cash paid for shares and warrants -573Net cash outflow from acquisition of shares and warrants -185Cash paid for debentures -219Acquisition of additional shares and warrants -34Total cash flow from acquisition of Metro -438
From the date of acquisition, Metro has contributed SEK 1.234m of revenue and SEK 24m in operating profit to Kinnevik. If the business combination had taken place at the beginning of the year, the revenue from Metro would have been SEK 1,541m and the operating profit SEK 73m.
The transaction costs of approximately SEK 16m have been expensed and are included in the administrative expenses in the income statement and are part of operating cash flow in the statement of cash flow.

26 (27)
Note 6 Investments in shares and securities
SEKm2012
Full year2011
Full year
2012 1 Oct- 31 Dec
2011 1 Oct- 31 Dec
SubsidiariesMetro (net of acquired cash balance) 438 - 0 -
G3 Group (net of acquired cash balance) 89 143 - -
Other subsidiaries 5 5 5
Total subsidiaries 532 148 5 -
Other shares and securities
Telecom & Services
Transcom - 170 - 170
Online
Zalando 3 658 828 2 489 -
Bigfoot I 1 003 359 - 117
Bigfoot II 532 228 - 205
Home24 428 363 - 270
Wimdu 86 275 - 89
BigCommerce 289 - - -
Rocket Internet GmbH 472 - - -
Rocket Internet’s other portfolio companies 159 620 7 362
Avito 50 62 - -
CDON - 101 - -
Other online investments 67 97 5 16
Total Online 6 744 2 933 2 500 1 059
Media 19 - 19 -
Microfinancing
Bayport 116 - - -
Seamless 35 - 19 -
Other microfinancing 36 19 4 9
Total Microfinancing 187 19 23 9
Agriculture
Black Earth Farming 132 - 124 -
Total Agriculture 132 - 124 -
Total investments other shares and securities 7 082 3 122 2 666 1 238
of which paid during the period 6 972 2 632 2 656 748
Paid on investments made in earlier periods 490 - - -
Cash flow from investments in other shares and securities 7 462 2 632 2 656 748
Note 7 Dividends received
1 Jan-31 Dec 20122012
Full year2011
Full year
2012 1 Oct- 31 Dec
2011 1 Oct- 31 Dec
Millicom 1 407 1 187 751 767
Tele2 1 761 3 659 - -
MTG 122 101 - -
Rocket Internet 974 - 680 -
Total dividends received 4 264 4 947 1 431 767
Of which ordinary dividends 1 659 1 334 - -

27 (27)
CONDENSED PARENT COMPANY INCOME STATEMENT (SEK m)
2012 Full year
2011 Full year
2012 1 Oct- 31 Dec
2011 1 Oct- 31 Dec
Revenue 20 18 6 4
Administration costs -121 -121 -41 -52
Other operating income 0 2 0 1
Operating loss -101 -101 -35 -47
Dividends received 3 900 3 640 144 17
Result from financial assets -10 -661 -121 -128
Net interest income/expense 327 345 72 83
Profit/loss after financial items 4 116 3 223 60 -75
Group contributions -300 -234 -300 -234
Profit/loss before taxes 3 816 2 989 -240 -309
Taxes -24 -8 -6 47
Net profit/loss for the period 3 792 2 981 -246 -262
CONDENSED PARENT COMPANY BALANCE SHEET (SEK m)2012
31 Dec2011
31 DecASSETS
Tangible fixed assets 3 2
Financial fixed assets 51 707 42 581
Short-term receivables 287 569
Cash and cash equivalents 12 1
TOTAL ASSETS 52 009 43 153
SHAREHOLDERS’ EQUITY AND LIABILITIES
Equity 40 986 38 712
Provisions 30 32
Long-term liabilities 1 175 1 828
Short-term liabilities 9 818 2 581
TOTAL SHAREHOLDERS’ EQUITY AND LIABILITIES 52 009 43 153
The Parent Company’s liquidity, including short-term investments and unutilized credit facilities, totalled SEK 4,587m at 31 December 2012 and SEK 4,437m at 31 December 2011. The Parent Company’s interest bearing external liabilities amounted to SEK 3,257m (2,173) on the same dates.
Investments in tangible fixed assets amounted to SEK 2m (1) during the period.As of 31 December 2012 the number of shares in Investment AB Kinnevik amounted to 277,583,190 shares of which
48,665,324 are class A shares with ten votes each, 228,653,284 are class B shares with one vote each and 264,582 are class C treasury shares with one vote each. In June, 135,332 class C shares were converted to class B shares to be deli-vered to the participants in the Long Term Incentive Plan for 2009. The total number of votes in the Company amounted at 31 December 2012 to 715,571,106 (715,171,192 excluding 264,582 class C and 135,332 class B treasury shares). The Board has authorization to repurchase a maximum of 10% of all shares in the Company. The Board has not used the aut-horization during 2012. There are no convertibles or warrants in issue.
Top Related