


Languages
Pages
Legal


© 2014. Md. Golam Kibria, Md. Enamul Kabir & S. M. Mahbubul Islam Boby. This is a research/review paper, distributed under the terms of the Creative Commons Attribution-Noncommercial 3.0 Unported License http://creativecommons.org/licenses/by-nc/3.0/), permitting all non commercial use, distribution, and reproduction inany medium, provided the original work is properly cited.
Global Journal of Researches in Engineering: G Industrial Engineering Volume 14 Issue 2 Version 1.0 Year 2014 Type: Double Blind Peer Reviewed International Research Journal Publisher: Global Journals Inc. (USA) Online ISSN: 2249-4596 & Print ISSN: 0975-5861
Investigation of Sigma Level at the Stage of Testing Cement after Packing and Improving it using FMEA Approach
By Md. Golam Kibria, Md. Enamul Kabir & S. M. Mahbubul Islam Boby Khulna University of Engineering &Technology (KUET), Bangladesh
Abstract- Sophisticated customer demands and advanced technology have changed the way of conducting business. Financial condition of a manufacturing company largely depends on the defect rate of a product. Understanding the key features, obstacles, and shortcomings of the six sigma method allows organizations to better support their strategic directions, and increasing needs for coaching, mentoring, and training. The objectives of this paper are to study and evaluate processes of the case organization, to find out the current sigma level and finally to improve the existing Sigma level through decreasing defects. According to objectives, current sigma level has been calculated, manufacturing process analyzed and suggestions given for improvement. Especially in analyzing phase different analysis tools like Production Layout, Process Block Diagram, Cause and Effect Diagram, Cheek Sheet, Process control chart are used. FMEA is used as improvement tool. By using this it has been possible to improve productivity by reducing defects rate. This research work has been carried out in a cement manufacturing company to show how to implement Six- Sigma in this type of industry. This research related work does not only apply to cement manufacturing company but also in any other types of organizations. By implementing Six-Sigma a perfect synchronization among cost, quality, production time and control time can be achieved.
Keywords: six-sigma, improvement, process control chart, sigma level, FMEA.
GJRE-G Classification : FOR Code: 290502p
InvestigationofSigmaLevelattheStageofTestingCementafterPackingandImprovingitusingFMEAApproach
Strictly as per the compliance and regulations of:

Investigation of Sigma Level at the Stage of Testing Cement after Packing and Improving it
using FMEA Approach Md. Golam Kibria α, Md. Enamul Kabir σ & S. M. Mahbubul Islam Boby ρ
Abstract- Sophisticated customer demands and advanced technology have changed the way of conducting business. Financial condition of a manufacturing company largely depends on the defect rate of a product. Understanding the key features, obstacles, and shortcomings of the six sigma method allows organizations to better support their strategic directions, and increasing needs for coaching, mentoring, and training. The objectives of this paper are to study and evaluate processes of the case organization, to find out the current sigma level and finally to improve the existing Sigma level through decreasing defects. According to objectives, current sigma level has been calculated, manufacturing process analyzed and suggestions given for improvement. Especially in analyzing phase different analysis tools like Production Layout, Process Block Diagram, Cause and Effect Diagram, Cheek Sheet, Process control chart are used. FMEA is used as improvement tool. By using this it has been possible to improve productivity by reducing defects rate. This research work has been carried out in a cement manufacturing company to show how to implement Six- Sigma in this type of industry. This research related work does not only apply to cement manufacturing company but also in any other types of organizations. By implementing Six-Sigma a perfect synchronization among cost, quality, production time and control time can be achieved.
I. Introduction
ix- Sigma is a statistical measurement of only 3.4 defects per million. Six-Sigma is a management philosophy focused on eliminating mistakes,
waste and rework. It establishes a measurable status to achieve and embodies a strategic problem-solving method to increase customer. Satisfaction and dramatically reduce cost and increase profits. Six-Sigma gives discipline, structure, and a foundation for solid decision making based on simple statistics. The real power of Six Sigma is simple because it combines people power with process power.
Author α:
Lecturer, Department of Industrial Engineering & Management (IEM), Khulna University of Engineering &Technology (KUET), Khulna-9203, Bangladesh. e-mail: [email protected]
Author σ ρ:
Undergraduate student, Department of Industrial Engineering & Management (IEM), Khulna University of Engineering &Technology (KUET), Khulna-9203, Bangladesh.
e-mails: [email protected], [email protected]
The Six Sigma is a financial improvement strategy for an organization and now a day it is being used in many industries. Basically it is a quality improving process of final product by reducing the defects; minimize the variation and improve capability in the manufacturing process. The objective of Six Sigma is to increase the profit margin, improve financial condition through minimizing the defects rate of product. It increases the customer satisfaction, retention and produces the best class product from the best process performance. If an organization is focused on customer satisfaction, then Six Sigma will offer a method and some tools for the identification and improvement of both internal and external process problems to better meet customer needs by identifying the variations in organization’s processes that might influence the customer’s point of view, negatively.
II. Literature Review
Though Fredrick Taylor, Walter Shewhart and Henry Ford played a great role in the evolution of six-sigma in the early twentieth century, it is Bill Smith, Vice President of Motorola Corporation, who is considered as the Father of Six-sigma. Fredrick Taylor came up with the methodology of breaking systems into subsystems in order to increase the efficiency of manufacturing process. Henry Ford followed his four principles, namely continuous flow, interchangeable parts, division of labor and reduction of wasted effort, in order to end up in an affordable priced automobile. The development of control charts by Walter Shewhart laid the base for statistical methods to measure the variability and quality of various processes.
Later during the 1950s, the Japanese Manufacturing sector revolutionized their quality and competitiveness in the world based on the works of Dr. W. Edwards Deming, Dr. Armand Feigenbaum, and Dr. Joseph M Juran. Dr. W. Edwards Deming developed the improvementcycle of ‘Plan-Do- Check-Act’, better known as the PDCA cycle. Dr. Joseph M Juran gave to the world his ‘Quality Trilogy’ and it was Dr. Armand Feigenbaum who initiated the concepts of ‘Total Quality Control’ (TQC). Between 1960 and 1980, the Japanese understood that everyone in an organization is important to maintain quality and so training programs were
S
© 2014 Global Journals Inc. (US)
Globa
l Jo
urna
l of
Resea
rche
s in E
nginee
ring
()
GVolum
e X
IV
Issu
e II V
ersion
I
43
Year
2014
Keywords: six-sigma, improvement, process control chart, sigma level, FMEA.
conducted for almost all employees not considering the department they belong to. Any organization that is dynamically working to build the theme of six-sigma and to put into practice, the concepts of six-sigma, in its daily management activities, with noteworthy improvements in the process performance and customer satisfaction is considered as a six –sigma organization [3].
M. Sokovićet al. undertook papers to identify areas in the process where extra expenses exist, identify the biggest impact on production expenses, introduce appropriate measurement system, improve process and reduce expenses on production times, and implement improvements [4]. Gustav Nyren represented the variables influencing the chosen characteristics variable and then optimized the process in a robust and repeatable way [5].John Racine focuses on what six-sigma is today and what its roots are both in Japan and in the west and what six-sigma offers the world today [6]. Zenon Chaczkoet al. introduced a process for the module level integration of computer based systems which is based on the Six-sigma Process Improvement Model, where the goal of the process is to improve the overall quality of the system under development [7]. Philip Stephen highlighted a distinct methodology for integrating lean manufacturing and six-sigma philosophies in manufacturing facilities [8]. Thomas Pyzdek focuses that helps the user identify worthy papers and move them steadily to successful completion, the user identify poorly conceived papers before devoting any time or resources to them, the user identify stalled papers and provide them with the attention they need to move forward again, the user decide when it’s time to pull the plug on dead papers before they consume too much time and resources and provide a record for the user that helps improve the paper selection, management and results tracking process.
III. Methodology
The preface of implementing Six-sigma is very complicated job with several steps, which relates to observe carefully, and concentrating deeply in all of the processes. Data was collected through interviews, discussions and questionnaire. All data were useful here for better understanding the production system. The collected data then interpreted into suitable format for the concerned study. The methodology, which is used in this study, enables to collect valid and reliable information and to analyze those data to conclude with a correct decision. Defects were observed and their root causes were investigated. After getting the existing scenario of the organization, the current sigma level was calculated and then the way to improve this level was analyzed.
IV. Data Analysis and Results
a) Process Measurement In this measurement stage, different variables
are identified to measure. As it has been trying to improve the sigma level of the organization, initially the present sigma level has been measured by using an Excel based sigma calculator.
Sigma level is a procedure to know the existing condition of a production shop. The calculation of sigma level is based on the number of defects per million opportunities (DPMO).
In order to calculate DPMO, three distinct pieces of information are required:
i. The number of units produced.
ii. The number of defect opportunities per unit. iii. The number of defects.
The actual formula is:
DPMO= (Number
of
defects ∗1000000 )((Number
of
defects
opportunities
per
unit)∗number
of
units)
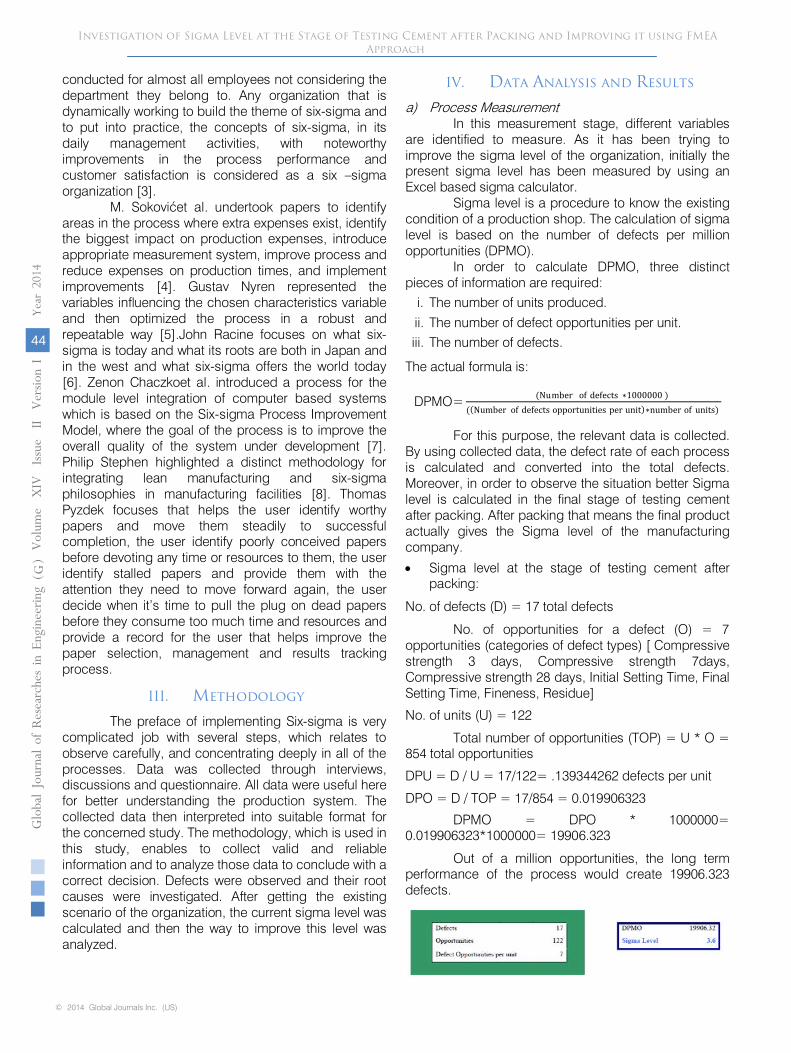
For this purpose, the relevant data is collected. By using collected data, the defect rate of each process is calculated and converted into the total defects. Moreover, in order to observe the situation better Sigma level is calculated in the final stage of testing cement after packing. After packing that means the final product actually gives the Sigma level of the manufacturing company. • Sigma level at the stage of testing cement after
packing: No. of defects (D) = 17 total defects
No. of opportunities for a defect (O) = 7 opportunities (categories of defect types) [ Compressive strength 3 days, Compressive strength 7days, Compressive strength 28 days, Initial Setting Time, Final Setting Time, Fineness, Residue]
No. of units (U) = 122
Total number of opportunities (TOP) = U * O =
854 total opportunities DPU = D / U = 17/122= .139344262 defects per unit
DPO = D / TOP = 17/854 = 0.019906323
DPMO = DPO * 1000000= 0.019906323*1000000= 19906.323
Out of a million opportunities, the long term performance of the process would create 19906.323 defects.
© 2014 Global Journals Inc. (US)
Globa
l Jo
urna
l of
Resea
rche
s in E
nginee
ring
()
GVolum
e X
IV
Issu
e II V
ersion
I
Year
2014
44
Investigation of Sigma Level at the Stage of Testing Cement after Packing and Improving it using FMEA Approach

After plotting the required information into sigma level calculator, the calculator shows that the Sigma level at the stage of testing cement after packing is 3.6. Hence, to improve this level, different quality improvement tools have to be employed and the organization has to be set a milestone to achieve.
b)
Process Analysis
It is a very important stage to consider because lack of proper analysis may lead to the process to a wrong way, which will deviate, from the main function of
improvement. In this stage, different basic tools of quality are preferably used to analyze the real condition of the processes.
i.
Process Block Diagram
To find out the existing problem of a complete production process, it is more preferable to represent the operation sequence by process flow diagram. For this purpose, the operation sequence is analyzed and obtained a chart shown in following figure.
Figure 1 :
Process Block Diagram of the Cement Industry
© 2014 Global Journals Inc. (US)
Globa
l Jo
urna
l of
Resea
rche
s in E
nginee
ring
()
GVolum
e X
IV
Issu
e II V
ersion
I
45
Year
2014
ii. Cause and Effect DiagramTo analyze a problem cause & effect diagram is
one of the best tools. After obtaining process flow
diagram, the next step is to find the root cause and sub-cause of the existing process. The required cause & effect diagram is shown in the Figure 4.2
Figure 2 : Cause and Effect Diagram of Case Organization
© 2014 Global Journals Inc. (US)
Investigation of Sigma Level at the Stage of Testing Cement after Packing and Improving it using FMEA Approach

iii.
Cheek Sheet
A
check sheet is very useful in data collection activity. It is more effective to identify defects. Here
defects are seen in a tabular form in time basis. The required Cheek Sheets are given in Table 1, 2, 3 and 4.
© 2014 Global Journals Inc. (US)
Globa
l Jo
urna
l of
Resea
rche
s in E
nginee
ring
()
GVolum
e X
IV
Issu
e II V
ersion
I
Year
2014
46
Check sheet for month August 2013Table 1 :
Check sheet for month September 2013Table 2 :
Check sheet for month October 2013Table 3 :
Check sheet for month November 2013Table 4 :
Investigation of Sigma Level at the Stage of Testing Cement after Packing and Improving it using FMEA Approach

iv.
Process Control Chart
A control chart is a graphical and analytic tool for monitoring process variation. The natural variation in a process can be quantified using a set of control limits. Control limits help distinguish common-cause variation from special-cause variation. Typically, action is taken to eliminate special-cause variation and bring the process back in control.
Process has seven constraints
(Fineness, Residue, Initial setting time, Final setting time, Compressive strength 3 days, Compressive strength 7 days & Compressive strength 28 days). Seven control charts have been drawn by taking each constraint. All control charts have two axis, in X-axis days are plotted & Y-axis constrains (each control chart has individual constrain) are plotted.
Figure 3 :
Control chart for Fineness
350
355
360
365
370
375
380
0 20 40 60 80 100 120
UCL= 370
LCL= 360
Fine
ness
m2 /K
g
© 2014 Global Journals Inc. (US)
Globa
l Jo
urna
l of
Resea
rche
s in E
nginee
ring
()
GVolum
e X
IV
Issu
e II V
ersion
I
47
Year
2014
Figure 4 : Control chart for Residue
Figure 5 :
00.20.40.60.8
11.21.41.61.8
2
0 20 40 60 80 100 120
UCL= 1.0 %
LCL= 0.0
160165170175180185190195200
0 20 40 60 80 100 120
UCL= 190 min
LCL= 180 min
Perc
ent (
%)
Initi
al s
ettin
g tim
e ( m
in)
Control chart for initial setting time
Investigation of Sigma Level at the Stage of Testing Cement after Packing and Improving it using FMEA Approach

Figure 6 :
360
370
380
390
400
410
420
0 20 40 60 80 100 120
UCL= 400 min
LCL= 380 min
Fina
l set
ting
time
( min
)
© 2014 Global Journals Inc. (US)
Globa
l Jo
urna
l of
Resea
rche
s in E
nginee
ring
()
GVolum
e X
IV
Issu
e II V
ersion
I
Year
2014
48
Control chart for final setting time
Figure 7 :
1414.5
1515.5
1616.5
1717.5
18
0 20 40 60 80 100 120
UCL= 16.2 MPa
LCL= 15 MPa
Com
pres
sive
Stre
ngth
(MPa
)
Control chart for Compressive Strength (3 Days)
Figure 8 : Control chart for Compressive Strength (7 Days)
Figure 9 :
18
19
20
21
22
23
24
25
0 20 40 60 80 100 120
UCL= 22 MPa
LCL= 20 MPa
26
28
30
32
34
36
0 20 40 60 80 100 120
UCL= 33 MPa
LCL= 30 MPa
Com
pres
sive
Stre
ngth
(MPa
)C
ompr
essi
ve S
treng
th (M
Pa)
Control chart for Compressive Strength (28 Days)
Investigation of Sigma Level at the Stage of Testing Cement after Packing and Improving it using FMEA Approach

Figure 8 :
Control
chart for Compressive Strength (7 Days)
Figure 9 :
18
19
20
21
22
23
24
25
0 20 40 60 80 100 120
UCL= 22 MPa
LCL= 20 MPa
26
28
30
32
34
36
0 20 40 60 80 100 120
UCL= 33 MPa
LCL= 30 MPa
C
ompr
essi
ve S
treng
th (M
Pa)
C
ompr
essi
ve S
treng
th (M
Pa)
© 2014 Global Journals Inc. (US)
Globa
l Jo
urna
l of
Resea
rche
s in E
nginee
ring
()
GVolum
e X
IV
Issu
e II V
ersion
I
49
Year
2014
Control chart for Compressive Strength (28 Days)
c) Process ImprovementIn this stage, improvement strategies are
developed for achieving the desired goal. According to the analysis, perfect measures should be taken to progress the current situation. As the major concern to improve sigma level here in the case organization to improve the productivity, it is highly needed to diagnose the critical issues. For this reason FMEA (Failure Mode and Effect Analysis is used to improve the current situation of the production shop.
i. FMEA (Failure Mode and Effect Analysis)A failure modes and effects analysis (FMEA) is
a procedure in product development and operations management for analysis of potential failure modes within a system for classification by the severity and likelihood of the failures. A successful FMEA activity helps a team to identify potential failure modes based on past experience with similar products or processes, enabling the team to design those failures out of the system with the minimum of effort and resource expenditure, thereby reducing development time and costs. In FMEA, failures are prioritized according to how serious their consequences are, how frequently they occur and how easily they can be detected. A FMEA also documents current knowledge and actions about the risks of failures for use in continuous improvement.
FMEA is used during the design stage with an aim to avoid future failures. Later it is used for process control, before and during ongoing operation of the process. Ideally, FMEA begins during the earliest conceptual stages of design and continues throughout the life of the product or service. And for the Case Organization FMEA chart (Table-8) is given below according to the following three tables- Table 5, 6 and 7.
Investigation of Sigma Level at the Stage of Testing Cement after Packing and Improving it using FMEA Approach
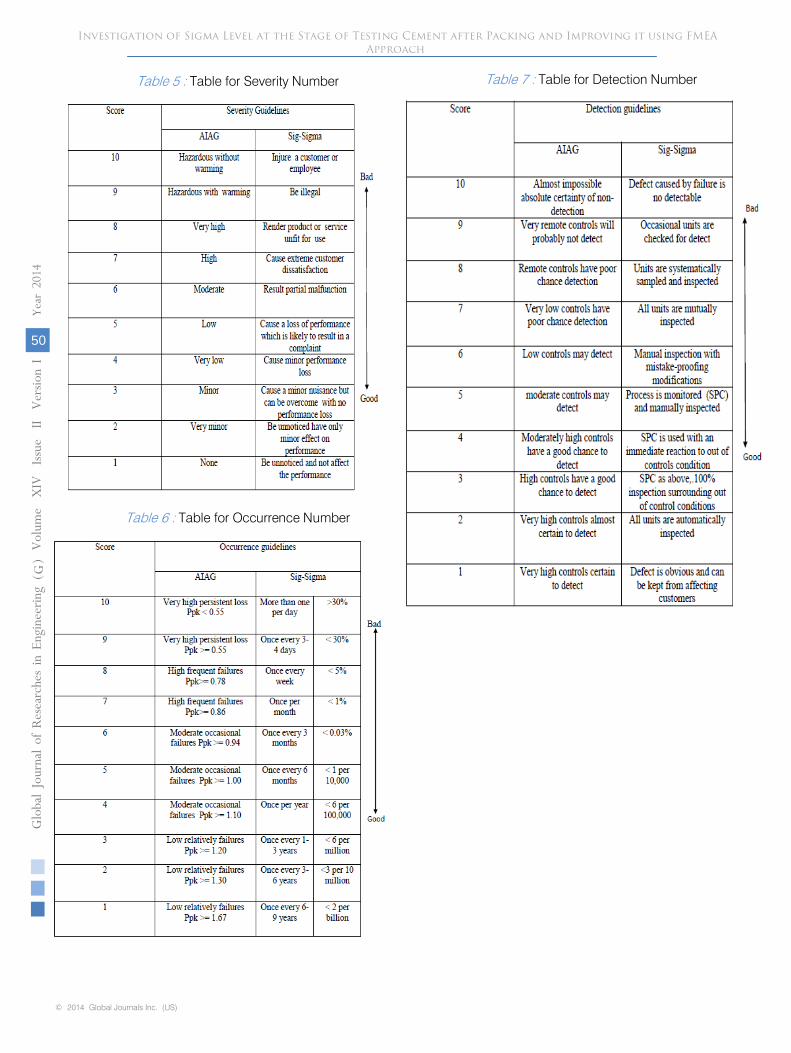
Table 5 : Table for Severity Number
Table 6 : Table for Occurrence Number
© 2014 Global Journals Inc. (US)
Globa
l Jo
urna
l of
Resea
rche
s in E
nginee
ring
()
GVolum
e X
IV
Issu
e II V
ersion
I
Year
2014
50
Table 7 : Table for Detection Number
Investigation of Sigma Level at the Stage of Testing Cement after Packing and Improving it using FMEA Approach

Table 8 : FMEA (Failure Mode and Effect Analysis) Chart
© 2014 Global Journals Inc. (US)
Globa
l Jo
urna
l of
Resea
rche
s in E
nginee
ring
()
GVolum
e X
IV
Issu
e II V
ersion
I
51
Year
2014
Row
Num
ber Process
StepsPotential Failure Mode
Potential Effects of
Failure
Seve
rity
(1-1
0)
Potential Cause(s) of
Failure
Occ
urre
nce
(1-1
0)
Current Controls
Det
ectio
n (1
-10)
Risk Priority
Number (RPN)
Recom ended Action
1 Cargo Production rate
Production rate
7 Low waterlevel, if Mongla
port is busy
5 Use smallcargos, by
road.
7 245 Increase depth of water level;
Raise the facilities of
Mongla port.2 Hopper Suddenly
block raw material supply path
Raw materials
supplyrate to silo
8 Small size ofoutlet
5 By decreasing supply flow
6 240 Give the desired size at
outlet of hopper
3 Conveyer Belt
Tear and wear
Production system stops
9 Long time running;
Absence of proper
lubrication at head and tail
pulley
5 Repair 6 270 Weekly inspection;
Proper lubrication
system
4 RawMaterial
Weighing Scale
Raw materials
not in correct
proportion
Defective cement
8 Problem in feed rate
4 Desired feed rate provides
2 64 Continuous inspection tocontrol the
proper feed rate
5 Ball Mill Linear and grindingmedia;
feed rate
Defective cement
8 Long time running
8 Repair when fineparticles are in low
rate
5 320 Continuous inspection and
change grinding media
andlinear when
needed6 Bucket
ElevatorProblem in motor or
chain
No cement will flowfrom ball
mill
5 Long time running andproblem in lubrication
5 Repairs motor; provide proper
lubrication system
7 175 Continuous inspection oflubrication;
replace motor ifrunning for long
time7 Separator Rotor
speed; aircirculation
flow
Fine and coarse cement
not separated
5 If anything collapse at air
circulation path; problem in air blower
7 Repairs 5 175 Continuous inspection and
if needed replace air
blower8 Vibrating
springElasticity of spring
decreases
Fine particle will not flow to cement silo
properly
5 Continuous running
5 Repairs 6 150 Continuous inspection and
if needed replace spring
9 Packing Machine
Problem in sensor
Defective packing
7 Long time running; andPLC problem
4 Replace;Check the
PLC system
2 56 Continuous inspection
2
Investigation of Sigma Level at the Stage of Testing Cement after Packing and Improving it using FMEA Approach
If the recommended actions are followed then the risk priority number will be decreased at desired level as a result defective product will be decreased and hence the sigma level will be improved.
V. Discussions
There were some uncertainties in the validity and reliability of the sampled data that are used in previous to analyze and improving sigma level of the cement manufacturing process. During the study not all, the information has collected instantly, but some previous records have also used for better understanding. The Sigma Level calculated for the case organization at the final stage of finished product is 3.6. From the Six-Sigma value chart it can be concluded that the case organization is an average industry. Analyzing tools is used and it finds out where the maximum and serious defects were in different sections. Then the Cause and Effect diagram determine the root causes of the problems. The check sheet represents defects at daily basis, which helps to find out in which day there were defects. Seven control charts are drawn to specify the process in control or not. The main reason for defective cement is then Compressive Strength. In addition, according to defects then Fineness, Setting time, Residue, Limestone, Slag and Fly ash. By using FMEA (Failure Mode and Effect Analysis), Risk Priority Number (RPN) at different stages of the manufacturing process were determined. From this case study the highest RPN was 320 (Ball Mill) and the lowest RPN was 56 (Packing Machine) in out of 1000. As the RPN increases, it indicates more risks and defects.
VI. Recommendations
There are several approaches to choose from, when the goal is to increase the sigma level of a cement manufacturing company. The techniques used in this paper have been limited due to insufficient time and resources. In this paper only Process block diagram, Cause and Effect diagram, Cheek sheet, process control chart are used for process analysis. FMEA isused as process improvement neglecting other improvement tool like 5S, Kaizen and Supermarket. An important suggestion for future work is to test if the findings are applicable to other steps of manufacturing and machines within the factory. Moreover, to take customers opinion about the product, this will help to identify the problems and can be solved easily.
References Références Referencias
3. Siddhartan Ramamoorthy, 2003, ‘Lean Six Sigma Applications In Aircraft Assembly’, B.E, Mechanical Engineering, University of Madras, India.
4. Soković, M., Pavletić, D., and Krulčić, E., Six Sigma process improvements in automotive parts production, Journal of Achievements in Materials and Manufacturing Engineering, Vol. 19 No. 1, pp 96-102 (2006).
5. Nyrén G., A Six Sigma paper at Ericsson Network Technologies, Master’s Research paper, MSc Programmes in Engineering, Luleå University of Technology (2007).
6. Racine J., A Directed Research Paper of the Evolution of Six Sigma, Master’s Research paper, MBA Program, Strayer University (2005).
7. Chaczko Z., Rahali E., and Tariq R., The Apllication of Six Sigma to Integration of Computer Based Systems, World Academy of Science, Engineering and Technology 34, pp 332- 337 (2007).
8. Stephen, P., Application of DMAIC to Integrate Lean Manufacturing and Six Sigma, Master’s Research paper , MSc in Industrial and Systems Engineering, Virginia Polytechnic Institute and State University, (2004).
Appendix
MCML’S Quality Policy:Residue-<1.00 %Blaine-360-370 m2/KgIST (Initial setting time) –180-190 minFST (Final setting time)–380-400 minCompressive strength (3 days) –15-16.20 MPaCompressive strength (7 days) –20-22 MPaCompressive strength (28 days) – 30-33 MPa
© 2014 Global Journals Inc. (US)
Globa
l Jo
urna
l of
Resea
rche
s in E
nginee
ring
()
GVolum
e X
IV
I ssu
e II V
ersion
I
Year
2014
52
1. Stevenson WJ,2005, ‘Competitiveness, Strategy and Productivity’, Richard T. Hercher, Jr, Wanda J, Zeman, ‘Operations Management’ 8th edition, McGraw-Hill/Irwin, a business unit of the McGraw-Hill companies, Inc, 1221 avenue of the Americas, New York, NY,10020,p (47-53).
2. Park, SH, 2003, ‘Six Sigma for Quality and Productivity Promotion’, Asian Productivity Organization, Japan.
Investigation of Sigma Level at the Stage of Testing Cement after Packing and Improving it using FMEA Approach
9. Abid, M.A., Rehman, A.U., and Anees, M, 2010, “How to minimize the defect rate of final product in textile plant by the implementation of DMAIC tool of six-sigma”, a program of “Master of Industrial Engineering-Quality and Environmental Management”, University of BORAS, School of Engineering.

© 2014 Global Journals Inc. (US)
Globa
l Jo
urna
l of
Resea
rche
s in E
nginee
ring
()
GVolum
e X
IV
Issu
e II V
ersion
I
53
Year
2014
Investigation of Sigma Level at the Stage of Testing Cement after Packing and Improving it using FMEA Approach

© 2014 Global Journals Inc. (US)
Globa
l Jo
urna
l of
Resea
rche
s in E
nginee
ring
()
GVolum
e X
IV
I ssu
e II V
ersion
I
Year
2014
54
Investigation of Sigma Level at the Stage of Testing Cement after Packing and Improving it using FMEA Approach

© 2014 Global Journals Inc. (US)
Globa
l Jo
urna
l of
Resea
rche
s in E
nginee
ring
()
GVolum
e X
IV
Issu
e II V
ersion
I
55
Year
2014
Investigation of Sigma Level at the Stage of Testing Cement after Packing and Improving it using FMEA Approach

© 2014 Global Journals Inc. (US)
Globa
l Jo
urna
l of
Resea
rche
s in E
nginee
ring
()
GVolum
e X
IV
I ssu
e II V
ersion
I
Year
2014
56
Investigation of Sigma Level at the Stage of Testing Cement after Packing and Improving it using FMEA Approach
Global Journals Inc. (US) Guidelines Handbook 2014
www.GlobalJournals.org
Top Related