


Languages
Pages
Legal


Inversions and Ground Pesticide Applications
Mandy Bish, Ph.D.Kevin Bradley, Ph.D.University of MissouriApril 2019

Inversions are NOT new, so:what’s the deal with inversions +
synthetic auxin herbicides?
1. Sensitive plants are really sensitive; it takes a very small amount moving in the air to cause damage: https://www.youtube.com/watch?v=JXGc-XQDdSg
2. Synthetic auxins are prone to volatility and can return to the air after reaching the target, possibly during an inversion.
3. Longer work days. We spray later in the evening because of increased work loads and in order to avoid high winds.

So… What is a Temperature Inversion?
Weather event that occurs when air temperatures near the earth’s surface are cooler than air temperatures higher in the atmosphere.
How Do They Contribute to Off-Target Movement?
Cause stable air masses to form. Herbicides and other particles disperse more slowly, if at all, when trapped in the stable air mass.
What’s the Evidence Inversions Contributed…
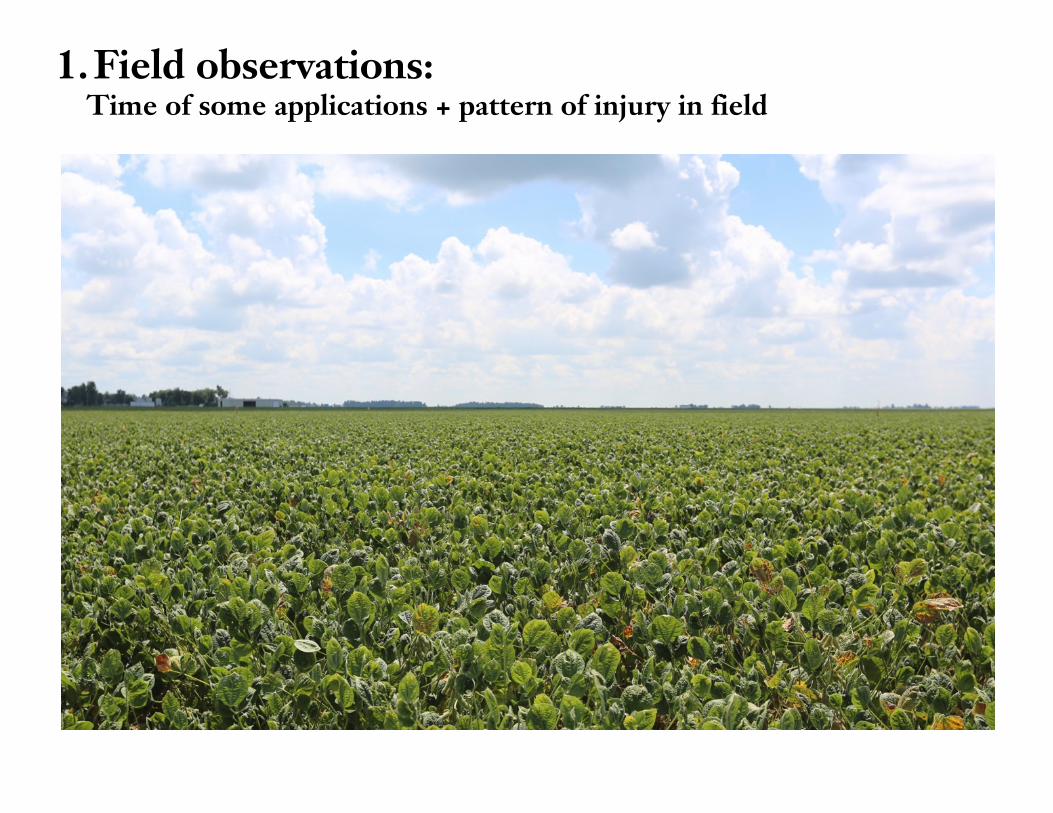
1.Field observations:Time of some applications + pattern of injury in field

2. Research observations:Dicamba is detected at higher levels when applied during an inversion
(Farrell et al. 2019, manuscript in prep)
Hours After Treatment
0.5 to 8 8 to 16 16 to 24 24 to 48 48 to 72
Dic
amba
Con
cent
ratio
n (n
g m
-3)
0
10
20
30
40
Evening (Stable) Applications Daytime (Unstable) Applications
A
B B B B
CC C
D D
Evening, inverted conditionsDaytime, non-inverted conditions
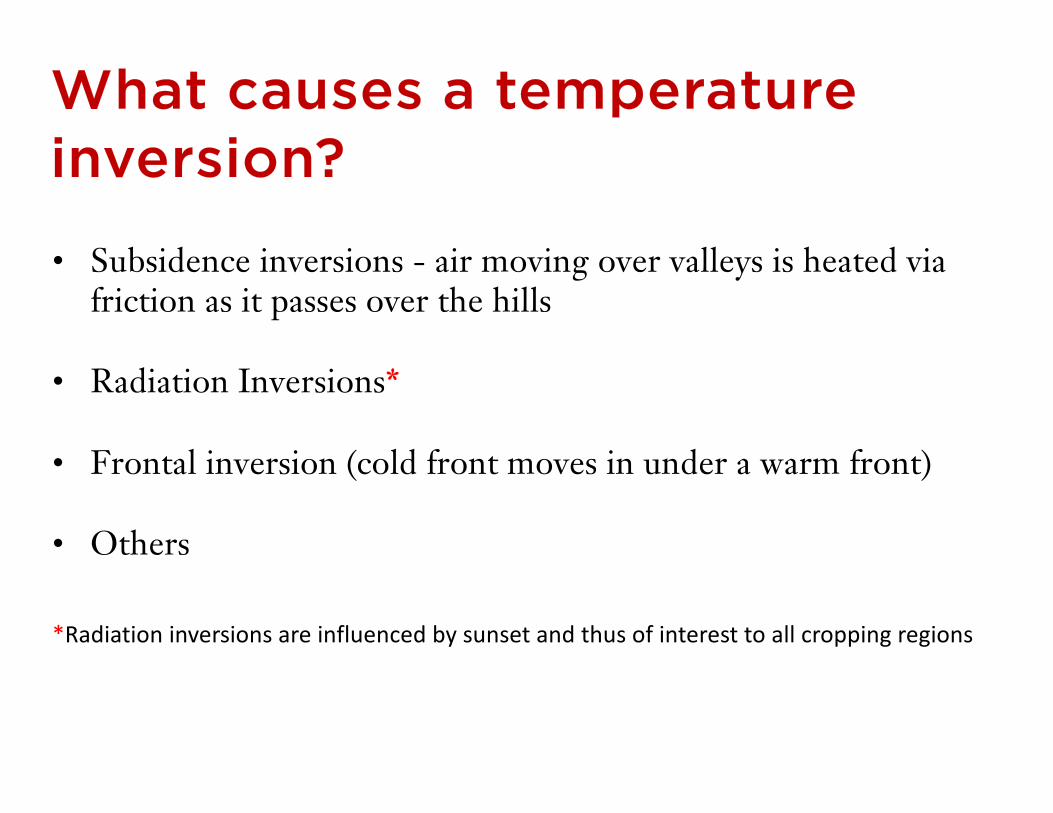
What causes a temperature inversion?
• Subsidence inversions - air moving over valleys is heated via friction as it passes over the hills
• Radiation Inversions*
• Frontal inversion (cold front moves in under a warm front)
• Others
*Radiation inversions are influenced by sunset and thus of interest to all cropping regions

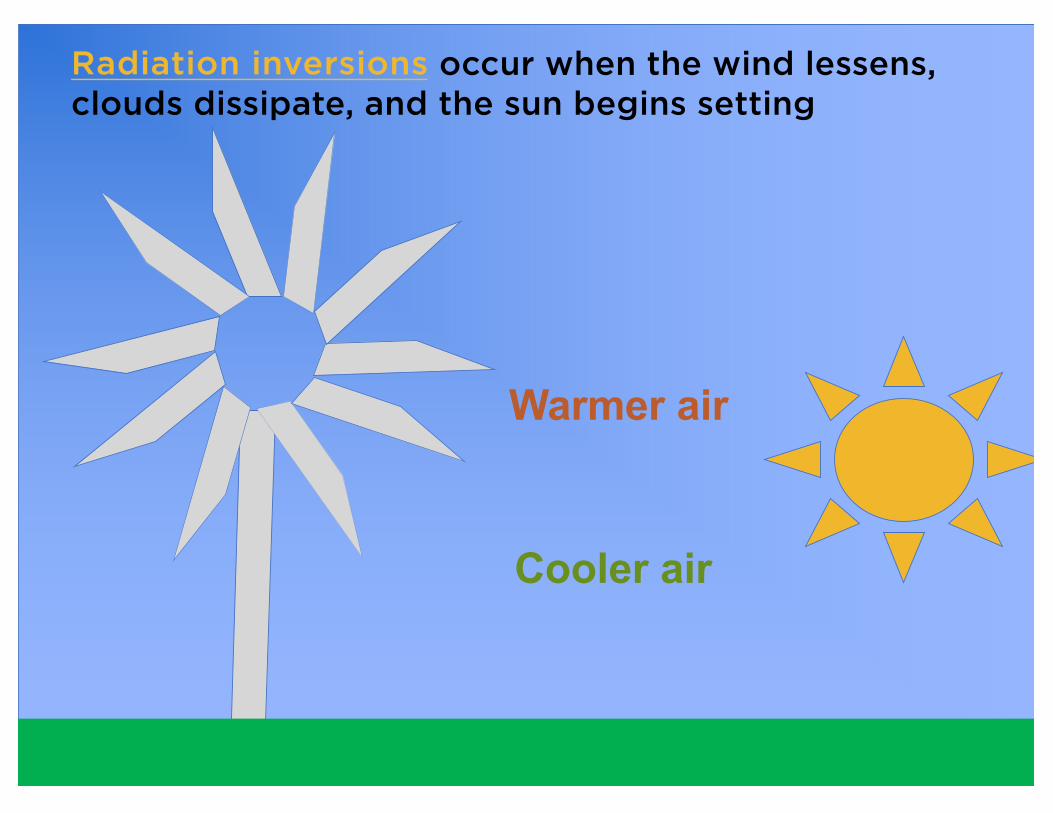
Warmer air
Cooler air
Wind, clouds, and sun are indicative of unstable, non-inverted air temperatures
Warmer air
Cooler air
Radiation inversions occur when the wind lessens, clouds dissipate, and the sun begins setting

Monitoring Inversions in Missouri
18”
66”
120”
Pat Guinan, University of MissouriAssociate Extension Professor of Climatology
Figure 1: Missouri soybean production by county. Map of harvested soybean area based on
Missouri Agriculture Statistics Service. The indicate sites that were utilized for inversion
monitoring over the three-year study.
Area in soybean production (ha)
>40,400
30,300 – 40,400
20,200 – 30,300
10,100 – 20,200
4,000 – 10,100
<4,000
N
100 km
2015 to 2017 – Albany, Columbia, and Hayward, MO
Num
ber
of In
vers
ions
05
1015
2025
MayApril June July
201520162017
Num
ber o
f Inv
ersi
ons
05
1015
2025
MayApril June July
201520162017
Albany Columbia
Num
ber
of In
vers
ions
05
1015
2025
MayApril June July
201520162017
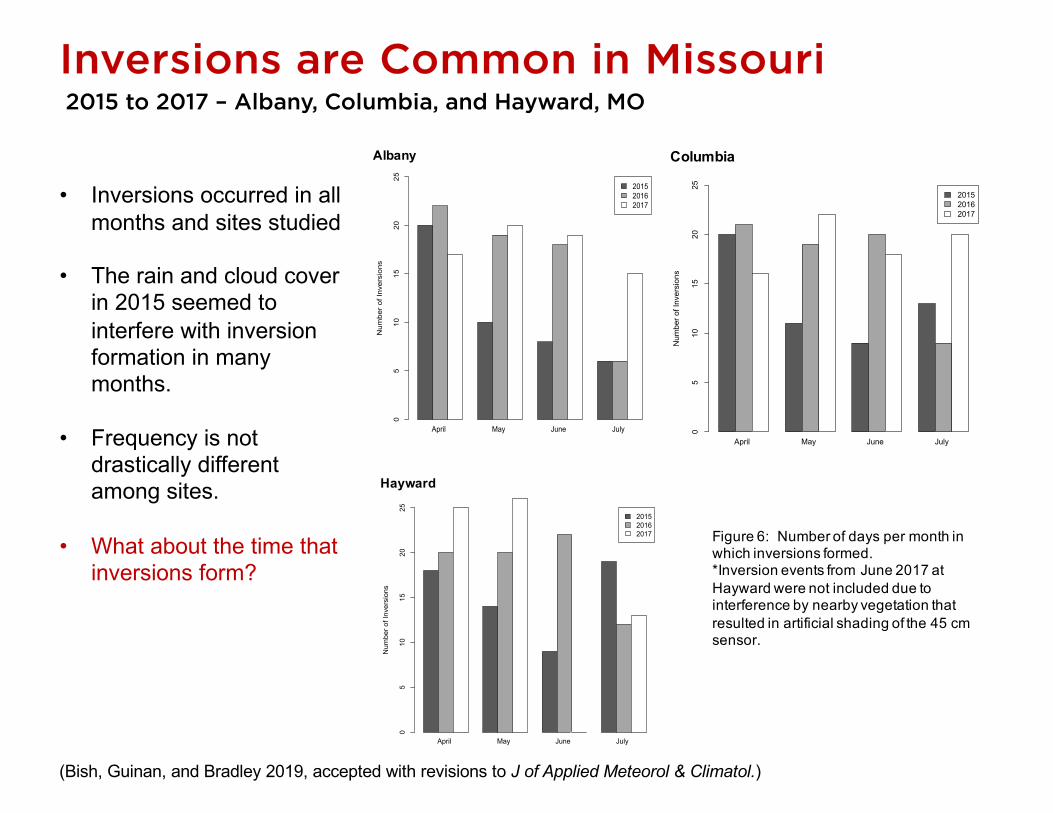
Hayward Figure 6: Number of days per month in which inversions formed. *Inversion events from June 2017 at Hayward were not included due to interference by nearby vegetation that resulted in artificial shading of the 45 cm sensor.
Inversions are Common in Missouri2015 to 2017 – Albany, Columbia, and Hayward, MO
Num
ber
of In
vers
ions
05
1015
2025
MayApril June July
201520162017
Num
ber o
f Inv
ersi
ons
05
1015
2025
MayApril June July
201520162017
Albany Columbia
Num
ber
of In
vers
ions
05
1015
2025
MayApril June July
201520162017
Hayward Figure 6: Number of days per month in which inversions formed. *Inversion events from June 2017 at Hayward were not included due to interference by nearby vegetation that resulted in artificial shading of the 45 cm sensor.
Num
ber
of In
vers
ions
05
1015
2025
MayApril June July
201520162017
Num
ber o
f Inv
ersi
ons
05
1015
2025
MayApril June July
201520162017
Albany Columbia
Num
ber
of In
vers
ions
05
1015
2025
MayApril June July
201520162017
Hayward Figure 6: Number of days per month in which inversions formed. *Inversion events from June 2017 at Hayward were not included due to interference by nearby vegetation that resulted in artificial shading of the 45 cm sensor.
• Inversions occurred in all months and sites studied
• The rain and cloud cover in 2015 seemed to interfere with inversion formation in many months.
• Frequency is not drastically different among sites.
• What about the time that inversions form?
(Bish, Guinan, and Bradley 2019, accepted with revisions to J of Applied Meteorol & Climatol.)

Appendix B Table 1. Three-year trend for time that inversions began forming (2015-2017)
Start Time (hh:mm)
Month n† Mean† Median Mode Earliest Latest
Albany
April 64 18:55 + 2:33 18:10 18:20 0:40 23:35May 70 19:15 + 2:05 18:50 18:15 0:00 23:35June 66 19:11 + 1:32 18:55 18:10 0:05 23:10July 33 20:47 + 2:21 20:05 19:30 0:00 22:40
Columbia
April 58 18:01 + 1:03 18:00 18:00 15:50 23:25May 52 18:27 + 1:03 18:25 18:45 0:15 19:25June 48 18:32 + 0:38 18:35 18:55 1:00 21:00July 42 19:00 + 0:37 19:10 19:15 17:45 20:40
Hayward
April 64 17:30 + 1:43 17:20 17:45 2:45 21:30May 60 17:17 + 1:10 17:30 18:30 14:20 18:55June‡ 32 18:01 + 0:53 18:20 18:30 3:30 19:05July 33 18:10 + 1:03 18:28 18:00 13:50 20:40
What Times did Inversions Form?2015 to 2017 – Albany, Columbia, and Hayward, MO
• Inversions formed earlier at Hayward than the other sites.
• Inversions typically formed between 5:20 and 8:05 PM depending on month and site.
(Bish, Guinan, and Bradley 2019, accepted with revisions to J of Applied Meteorol & Climatol.)
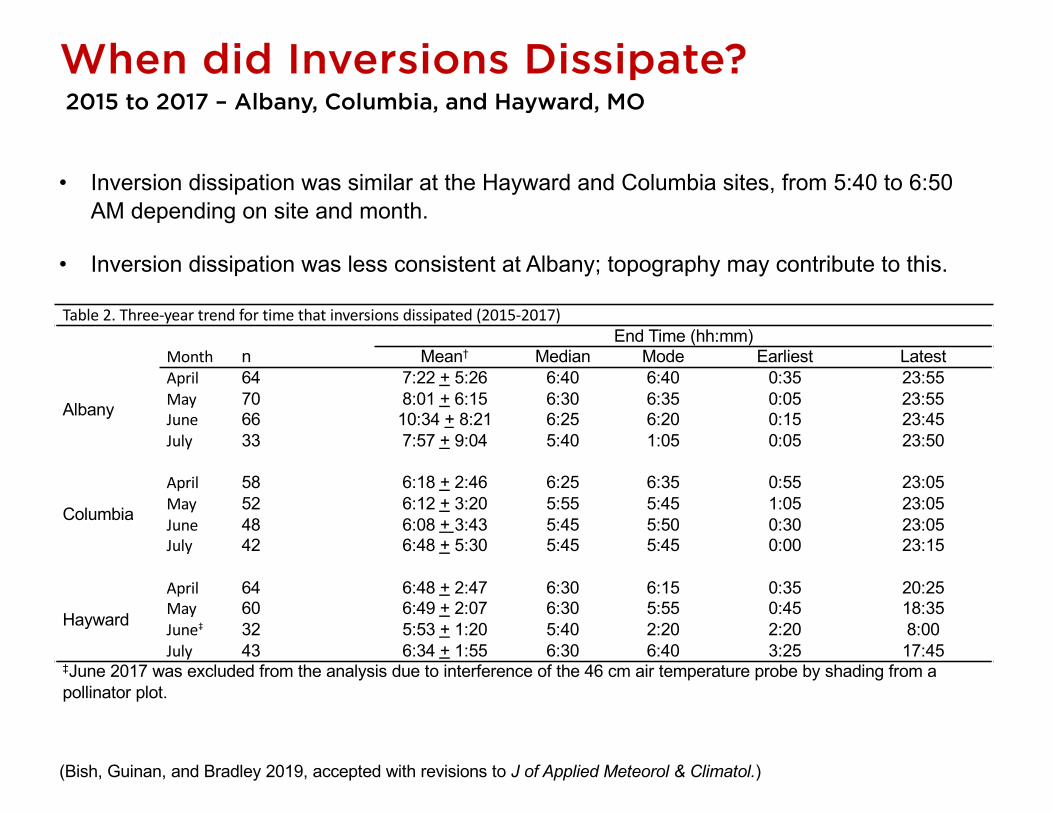
When did Inversions Dissipate?2015 to 2017 – Albany, Columbia, and Hayward, MO
• Inversion dissipation was similar at the Hayward and Columbia sites, from 5:40 to 6:50 AM depending on site and month.
• Inversion dissipation was less consistent at Albany; topography may contribute to this.
(Bish, Guinan, and Bradley 2019, accepted with revisions to J of Applied Meteorol & Climatol.)
Table 2. Three-year trend for time that inversions dissipated (2015-2017)End Time (hh:mm)
Month n Mean† Median Mode Earliest Latest
Albany
April 64 7:22 + 5:26 6:40 6:40 0:35 23:55May 70 8:01 + 6:15 6:30 6:35 0:05 23:55June 66 10:34 + 8:21 6:25 6:20 0:15 23:45July 33 7:57 + 9:04 5:40 1:05 0:05 23:50
Columbia
April 58 6:18 + 2:46 6:25 6:35 0:55 23:05May 52 6:12 + 3:20 5:55 5:45 1:05 23:05June 48 6:08 + 3:43 5:45 5:50 0:30 23:05July 42 6:48 + 5:30 5:45 5:45 0:00 23:15
Hayward
April 64 6:48 + 2:47 6:30 6:15 0:35 20:25May 60 6:49 + 2:07 6:30 5:55 0:45 18:35June‡ 32 5:53 + 1:20 5:40 2:20 2:20 8:00July 43 6:34 + 1:55 6:30 6:40 3:25 17:45
‡June 2017 was excluded from the analysis due to interference of the 46 cm air temperature probe by shading from a pollinator plot.

Figure 8: Boxplot showing typical duration of inversions at each location over the course of the growing season from 2015 to 2017. Vertical black line in each box represents median duration time. Mean inversion duration is represented by a black diamond; boxes represent the interquartile range (IQR), with the left and right edges representing the lower (25%) and upper (75%) quartiles respectively. Horizontal lines represent the reasonable extreme distances of the data from the IQR (1.5 x IQR). Circles represent outliers.
Albany Columbia Hayward
0 6 12 18 0 6 12 18 0 6 12 18
July
June
May
April
Duration (hours)
Length of Inversion (hours)
How Long do Inversions Last?2015 to 2017 – Albany, Columbia, and Hayward, MO
The wider the box = the more variation.The black diamond = the average inversion duration.(Bish, Guinan, and Bradley 2019, accepted with revisions to J of Applied Meteorol & Climatol.)

Expanding the Monitoring Network
In Collaboration with:Bryan Young, Purdue UniversityLarry Steckel, University of TennesseeKarla Gage, Southern Illinois UniversityJason Norsworthy, University of ArkansasDan Reynolds, Mississippi State UniversityPat Guinan, University of Missouri

Monitoring Inversions in 2018
• Inversions were common at all sites tested.
• Inversions defined as 120” air temperature > 18” air temperature.
0
10
20
30
40
50
60
70
80
90
100
AR Crawfor
dsvill
e
AR Mari
anna
IN Hill
IN Bott
om
IL Carb
onda
leTN
Hill
TN Bott
om
MO Albany
MO Cha
rlesto
n
MO Colu
mbia
MO Gree
n Ridg
e
MO Hay
ward
MO Lamar
MO Linn
eus
MO Mars
hall
MO Mon
roe C
ity
MO Mou
ntain
Grove
MO Vanda
lia
Perc
ent o
f Eve
ning
s W
hen
an In
vers
ion
Form
ed
Solid bars = June; Checkered bars = July
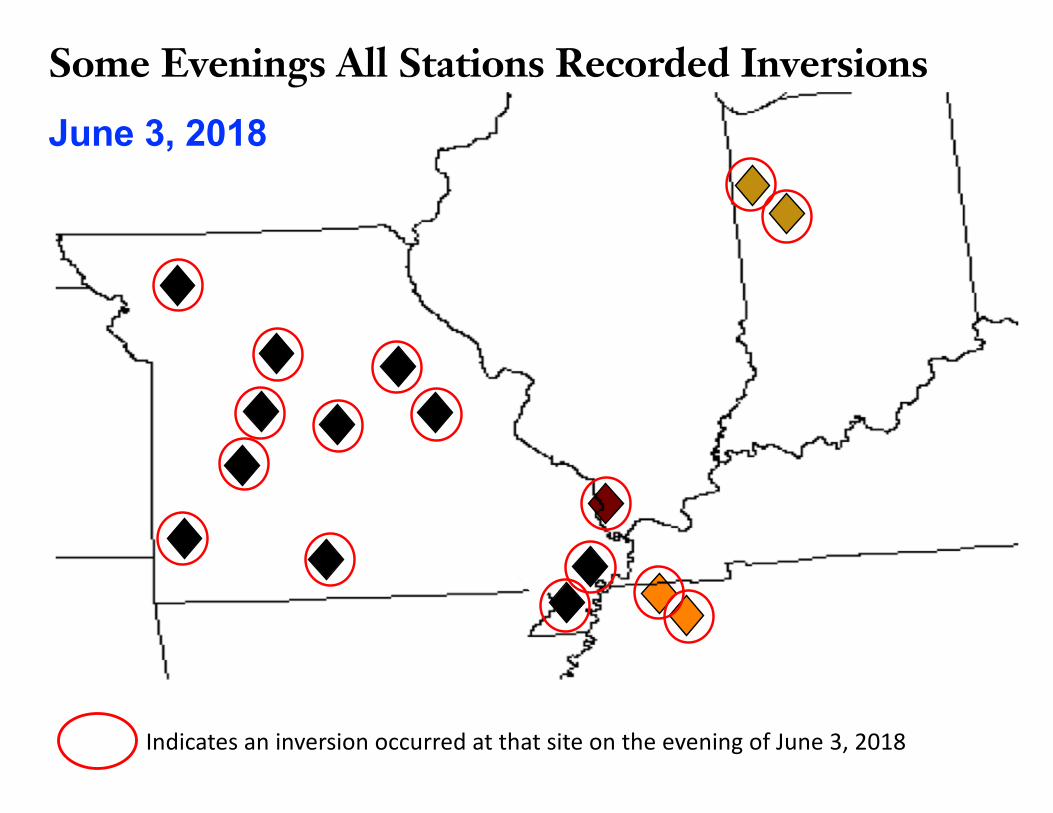
June 3, 2018
Some Evenings All Stations Recorded Inversions
Indicates an inversion occurred at that site on the evening of June 3, 2018
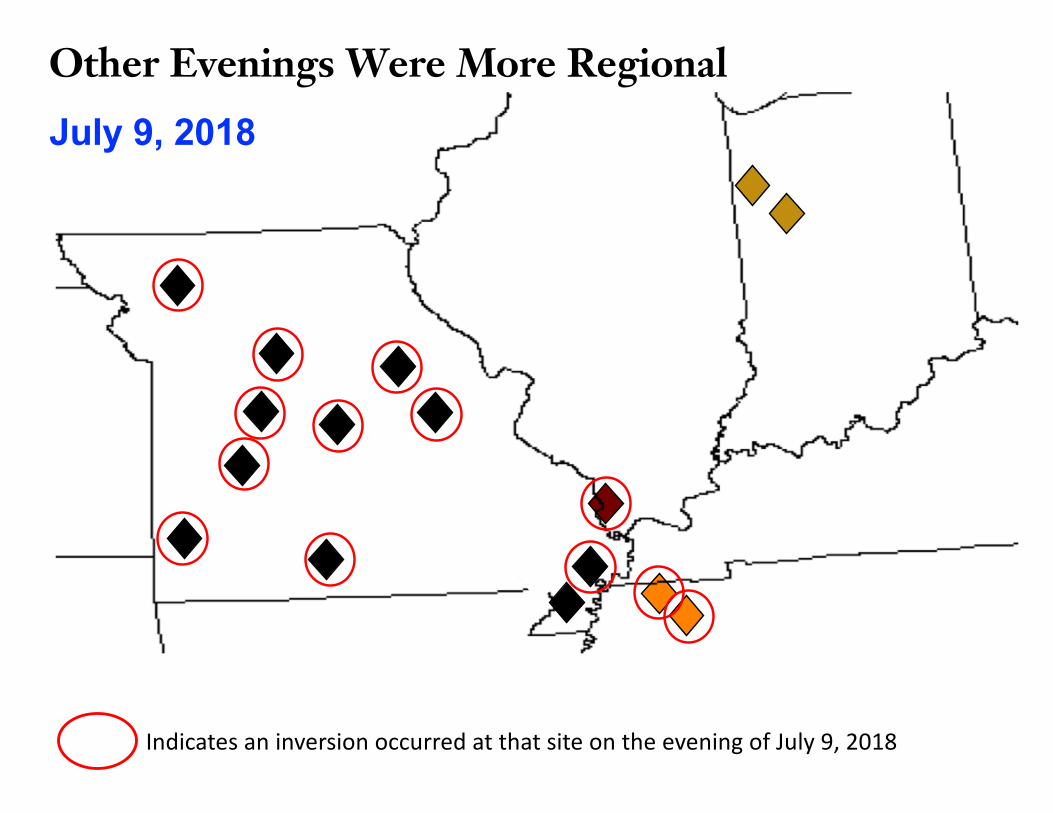
July 9, 2018
Other Evenings Were More Regional
Indicates an inversion occurred at that site on the evening of July 9, 2018

June 22, 2018
Some Evenings Had More Localized Events
Indicates an inversion occurred at that site on the evening of June 22, 2018
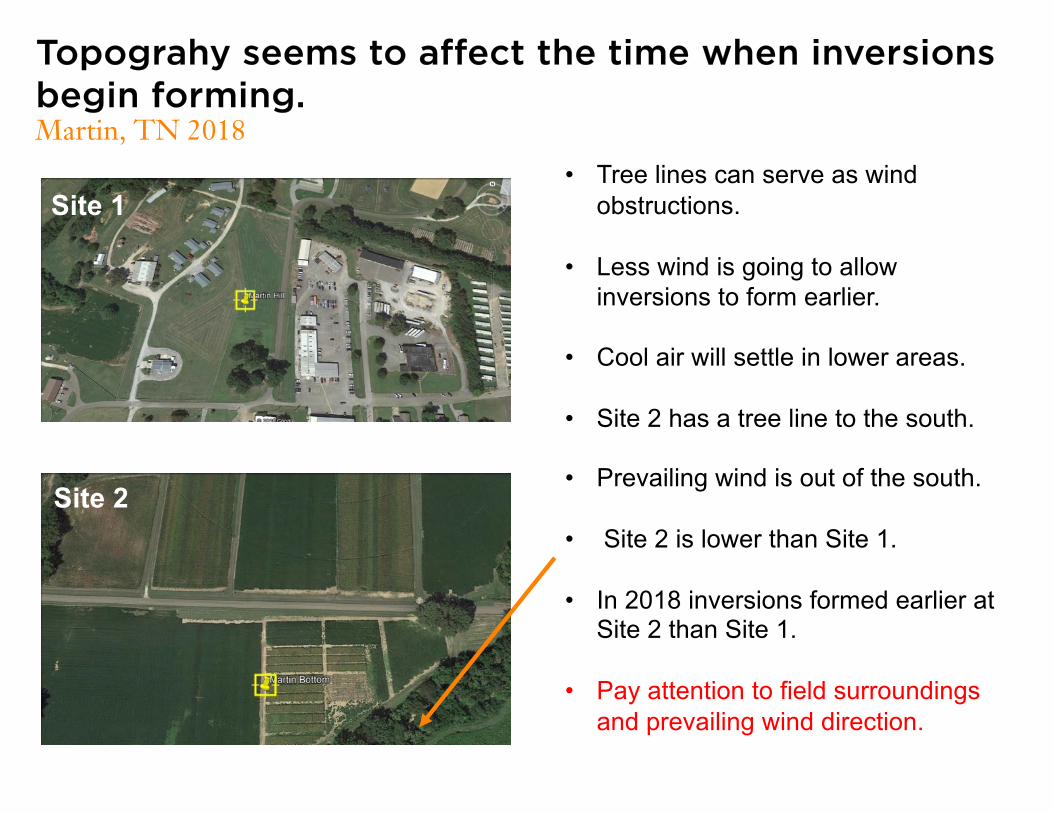
Topograhy seems to affect the time when inversions begin forming.Martin, TN 2018
Site 1
Site 2
• Tree lines can serve as wind obstructions.
• Less wind is going to allow inversions to form earlier.
• Cool air will settle in lower areas.
• Site 2 has a tree line to the south.
• Prevailing wind is out of the south.
• Site 2 is lower than Site 1.
• In 2018 inversions formed earlier at Site 2 than Site 1.
• Pay attention to field surroundings and prevailing wind direction.
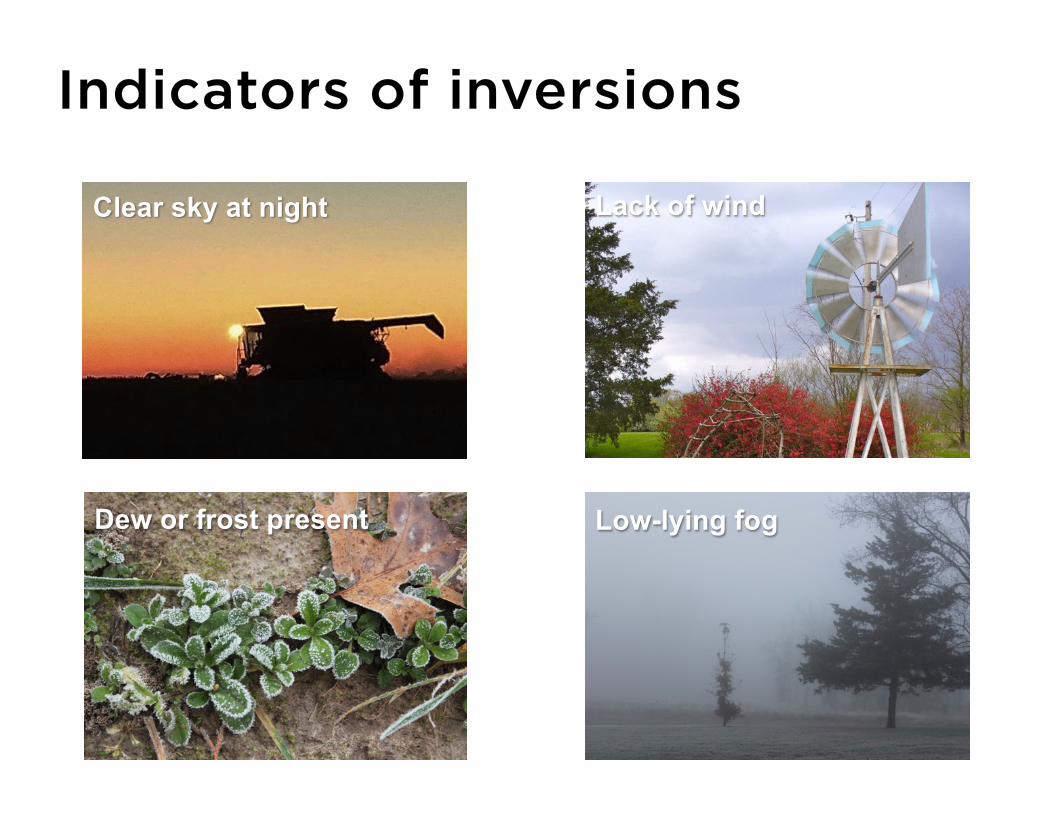
Indicators of inversions
Low-lying fogDew or frost present
Lack of windClear sky at night
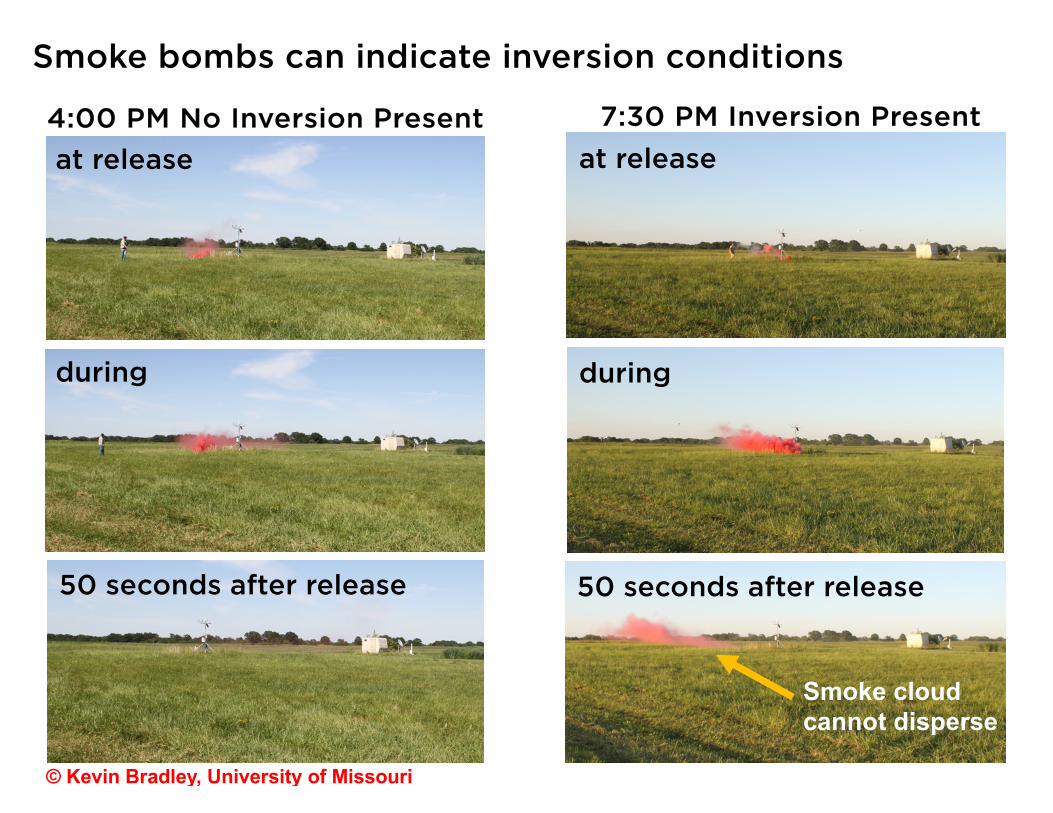
at release
Smoke bombs can indicate inversion conditions
during
50 seconds after release
4:00 PM No Inversion Present 7:30 PM Inversion Present
at release
during
50 seconds after release
Smoke cloud cannot disperse
© Kevin Bradley, University of Missouri
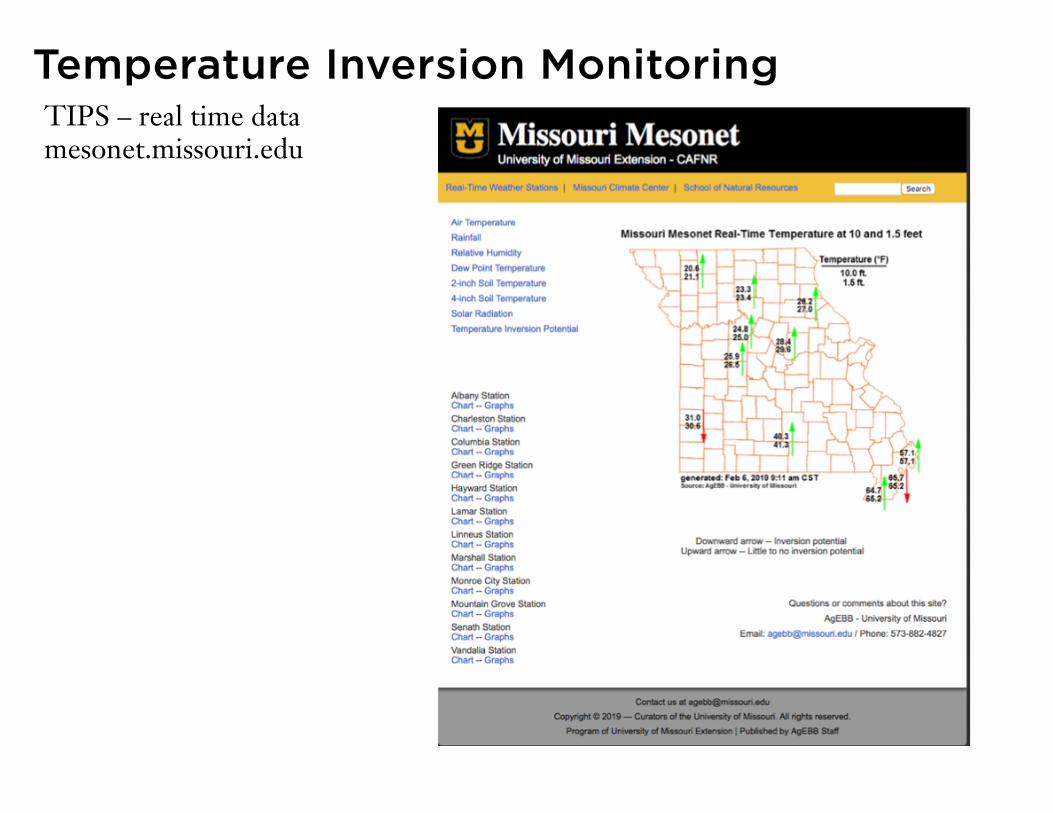
Temperature Inversion Monitoring TIPS – real time datamesonet.missouri.edu
We still do not know with certainty what temperature difference is needed to allow for herbicide suspension in the air.
It is possible that any temperature difference is sufficient to cause a stable air mass that will trap too much dicamba.
Arkansas, southeast Missouri, and western Tennessee typically have less wind and more stable atmosphere than other regions.
These same regions also have more reported injury than other areas.
Results from our research suggests that as temperature difference increases by 1℃, the amount of dicamba in the air increases by 1.3 ng/m3.
What is a meaningful inversion?
Temperature Inversions - Summary
1. Pay attention to the forecast – a week in which meteorologist are calling for clear skies at night is a week that is likely going to have multiple inversions.
2. Each field is not the same—the label says 2 hours before sunset, but if the wind dies before that time point an inversion is likely forming.
3. We are not there with apps yet. It is extremely difficult to build an inversion monitoring app for air temperatures so close to the ground.
4. Think back to the smoke bomb—if that cloud of red was a cloud of dicamba or 2,4-D droplets… …and it was an entire field that had been sprayed.
5. We still do not have a great understanding of the relationship between applications made during the day and inversions forming at night.
Acknowledgements
• Larry Steckel, Bryan Young, Karla Gage, Jason Norsworthy
Dan Reynolds, Shea Farrell, John Travlos
• United Soybean Board
• Missouri Soybean Merchandising Counsel
573-882-9878
Kevin [email protected]
573-882-4039
Questions?
@ShowMeWeeds
Mizzou Weed Science
ID Weeds Mobile App
Herb Injury Mobile App
Top Related