


Languages
Pages
Legal


INUIT HEALTH SURVEY 2007–2008 INUVIALUIT SETTLEMENT REGION
FUNDED AND SUPPORTED BY

IPY – INUIT HEALTH SURVEY Centre for Indigenous Peoples' Nutrition and Environment
McGill University, Macdonald Campus, 21,111 Lakeshore Road, Ste‐Anne‐de‐Bellevue, QC, H9X 3V9
If you have any questions, please contact Crystal Lennie at 867.777.7025
— irc.inuvialuit.com —
— www.inuithealthsurvey.ca —

2007–2008 INUIT HEALTH SURVEY • INUVIALUIT SETTLEMENT REGION
2
May 2010
Revised and Reprinted July 2010
Prepared by Prof. G.M. Egeland
International Polar Year Inuit Health Survey: Health in Transition and Resiliency
with the
Inuvialuit Settlement Region Steering Committee and contributions from CINE staff members and graduate students
Centre for Indigenous Peoples’ Nutrition and Environment School of Dietetics and Human Nutrition Macdonald Campus of McGill University
21,111 Lakeshore Rd., Ste‐Anne‐de‐Bellevue, QC H9X 3V9
Inuvialuit Settlement Region (ISR) Steering Committee Member Organizations:
Inuvialuit Regional Corporation Aklavik Community Corporation Inuvik Community Corporation
Paulatuk Community Corporation Sachs Harbour Community Corporation Tuktoyaktuk Community Corporation Ulukhaktok Community Corporation
Beaufort Delta Health and Social Services Institute for Circumpolar Health Research
Government of the Northwest Territories, Department of Health and Social Services University of Toronto McGill University
Advisor to Inuvialuit Settlement Region Steering Committee: Aurora Research Institute
INUVIALUIT SETTLEMENT REGION • INUIT HEALTH SURVEY 2007–2008
31
» Any animal can be infected, so raw and poorly cooked meat, as well as exposure to cat feces, can be sources of infection.
» Freezing at very low temperatures for a long time may kill the parasite, but is not a guarantee.
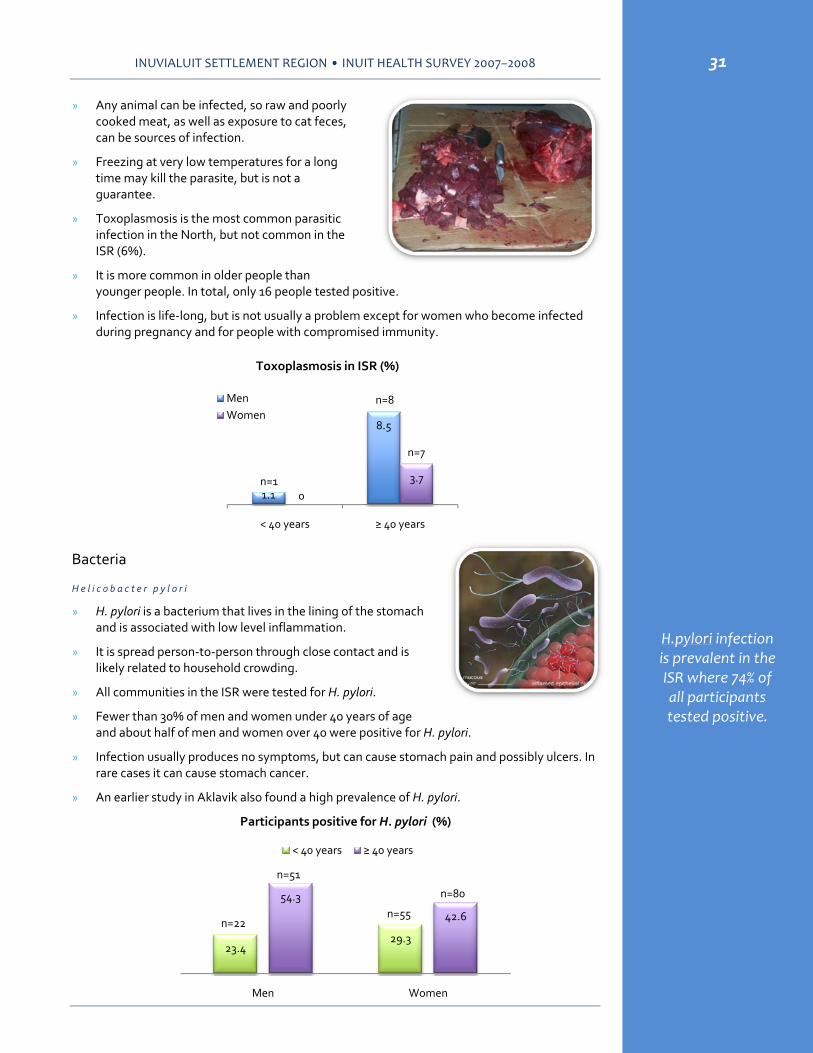
» Toxoplasmosis is the most common parasitic infection in the North, but not common in the ISR (6%).
» It is more common in older people than younger people. In total, only 16 people tested positive.
» Infection is life‐long, but is not usually a problem except for women who become infected during pregnancy and for people with compromised immunity.
Bacteria
H e l i c o b a c t e r p y l o r i
» H. pylori is a bacterium that lives in the lining of the stomach and is associated with low level inflammation.
» It is spread person‐to‐person through close contact and is likely related to household crowding.
» All communities in the ISR were tested for H. pylori.
» Fewer than 30% of men and women under 40 years of age and about half of men and women over 40 were positive for H. pylori.
» Infection usually produces no symptoms, but can cause stomach pain and possibly ulcers. In rare cases it can cause stomach cancer.
» An earlier study in Aklavik also found a high prevalence of H. pylori.
1.1
8.5
0
3.7
< 40 years ≥ 40 years
Toxoplasmosis in ISR (%)
MenWomen
n=1
n=8
n=7
H.pylori infection is prevalent in the ISR where 74% of all participants tested positive.
23.429.3
54.3
42.6
Men Women
Participants positive for H. pylori (%)
< 40 years ≥ 40 years
n=22
n=51
n=55
n=80

INUVIALUIT SETTLEMENT REGION • INUIT HEALTH SURVEY 2007–2008
3
Acknowledgements e would like to thank all Inuvialuit adults whose participation in the Inuit Health Survey in 2008 contributed to its great success. We would also like to thank the
community corporations and community health centres for their support in making the survey possible.
We extend a special thank you to the ISR steering committee, which was made up of individuals representing the community corporations of Aklavik, Inuvik, Paulatuk, Sachs Harbour, Tuktoyaktuk, and Ulukhaktok, the Inuvialuit Regional Corporation, University of Toronto and McGill University. Their support and guidance throughout all phases of the project was indispensable and appreciated. Specifically, we would like to mention Crystal Lennie, Carol Arey, Gayle Gruben, Ethel Gruben, Donna Keogak, Fred Bennet, Robert Gruben, Joshua Oliktoak and Kue Young.
We would also like to acknowledge the advice that was provided by Jane Smith from Beaufort Delta Health and Social Services, Susan Chatwood from the Institute for Circumpolar Health Research, Alana Mero from the Aurora Research Institute and KamiKandola, Chief Medical Officer of the Government of NWT.
We thank Brian Ward of McGill University for his expert guidance with the parasitic diseases module and Hope Weiler of McGill University for her expertise in vitamin D.
For providing photo documentation for this report we would like to thank Stephanie McDonald. For layout and design, we would like to thank Rajiv Rawat.
Also, a big thank you to CINE staff members and students, Zhirong Cao, Louise Johnson‐Down, Donna Leggee, Helga Saudny, Nelofar Sheikh, Yella Zahirovich‐Jovich, Jennifer Jamieson and Amy Pronovost for the excellent support provided in preparing the document.
We also acknowledge and thank Eric Loring of the Inuit Tapiriit Kanatami (ITK), who also serves as Governing Board Member of CINE. ITK remains a constant source of guidance and has been very helpful with results communication and knowledge translation.
W

2007–2008 INUIT HEALTH SURVEY • INUVIALUIT SETTLEMENT REGION
30
PARASITIC DISEASES AND BACTERIA
» Blood samples from participants were tested to determine exposure to several parasites and to the bacteria called Helicobacter pylori.
» It is important to remember that a positive test indicates exposure at some time during the person’s life, and does not necessarily mean an active infection.
Parasitic Diseases
E c h i n o c o c c o s i s
» Caused by Echinococcus sp., a tape worm. The form found in northern communities exists in wolves, moose and caribou.
» Eating meat from infected animals or contact with dog feces are the routes for human infection.
» The infection is very rare. Only two people had a positive test.
T r i c h i n o s i s
» Is caused by Trichinella nativa, a parasitic worm found in most bears and in 15‐20% of walruses in northern communities.
» This parasite can survive prolonged freezing.
» The primary cause of infection is eating raw or poorly cooked meat from an infected animal.
» Again, the infection is very rare. Only two individuals tested positive for Trichinella exposure.
T o x o c a r i a s i s
» In northern communities, people are exposed to a form of Toxocara, a parasitic worm that exists in dogs.
» This form is spread by contact with dog feces, especially from puppies.
» Toxocariasis is very rare. Only two people had positive tests.
T o x o p l a s m o s i s
» Caused by Toxoplasma gondii, one of the most successful parasites in the world. There are more than 2 billion people infected globally.
Parasitic diseases are rare in the ISR.

2007–2008 INUIT HEALTH SURVEY • INUVIALUIT SETTLEMENT REGION
4
Table of Contents Acknowledgements .................................................................................................................... 3
Table of Contents ....................................................................................................................... 4
Executive Summary .................................................................................................................... 6
Overview .................................................................................................................................... 9
Results from Home‐Based Questionnaires ................................................................................ 10 Home Environment .................................................................................................................................................................. 10 Homelessness and Crowding .................................................................................................................................................... 10 Language ................................................................................................................................................................................. 11 Smoking in Households ............................................................................................................................................................ 11 Food Security ........................................................................................................................................................................... 11 Country Food and Food Sharing Networks ................................................................................................................................ 12 Availability of Country Food ...................................................................................................................................................... 12 Cost of Living ............................................................................................................................................................................ 13 References ................................................................................................................................................................................ 14
Results from Individual Questionnaires ..................................................................................... 15 Overview .................................................................................................................................................................................. 15 Dental Health ........................................................................................................................................................................... 15 Reported Family Health History ................................................................................................................................................ 16
Heart Attack ......................................................................................................................................................................... 16 Stroke ................................................................................................................................................................................... 16 Diabetes ............................................................................................................................................................................... 16 High Blood Pressure .............................................................................................................................................................. 16 Cancer .................................................................................................................................................................................. 16 High Cholesterol ................................................................................................................................................................... 17
Participants’ Medical Information ............................................................................................................................................. 17 Diabetes ............................................................................................................................................................................... 17 Cancer .................................................................................................................................................................................. 17 High Blood Pressure .............................................................................................................................................................. 17 High Cholesterol ................................................................................................................................................................... 18 Reproductive Health ............................................................................................................................................................. 18 Physical Activity .................................................................................................................................................................... 19 Smoking Habits .................................................................................................................................................................... 19
Social Demographic Information ............................................................................................................................................. 20 Marital Status ...................................................................................................................................................................... 20 Education ............................................................................................................................................................................ 20 Personal Income .................................................................................................................................................................. 20 Employment ......................................................................................................................................................................... 21
References ................................................................................................................................................................................ 21
INUVIALUIT SETTLEMENT REGION • INUIT HEALTH SURVEY 2007–2008
29
Sun Exposure
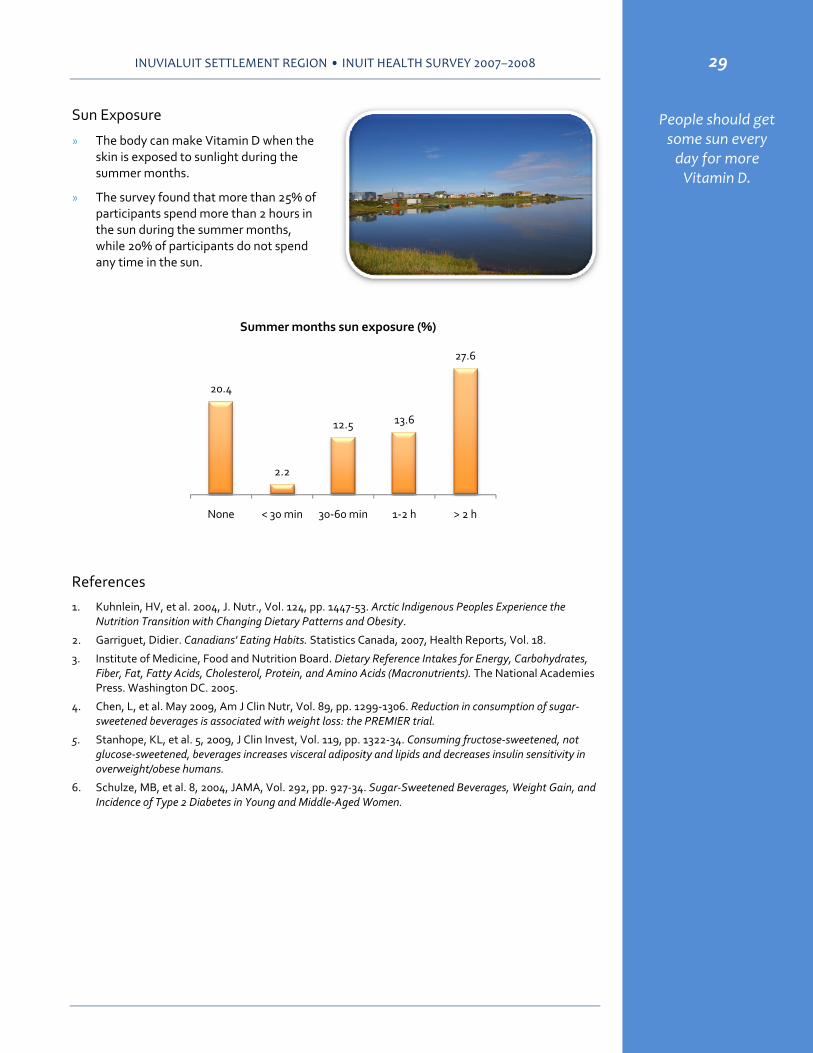
» The body can make Vitamin D when the skin is exposed to sunlight during the summer months.
» The survey found that more than 25% of participants spend more than 2 hours in the sun during the summer months, while 20% of participants do not spend any time in the sun.
References 1. Kuhnlein, HV, et al. 2004, J. Nutr., Vol. 124, pp. 1447‐53. Arctic Indigenous Peoples Experience the
Nutrition Transition with Changing Dietary Patterns and Obesity.
2. Garriguet, Didier. Canadians' Eating Habits. Statistics Canada, 2007, Health Reports, Vol. 18.
3. Institute of Medicine, Food and Nutrition Board. Dietary Reference Intakes for Energy, Carbohydrates, Fiber, Fat, Fatty Acids, Cholesterol, Protein, and Amino Acids (Macronutrients). The National Academies Press. Washington DC. 2005.
4. Chen, L, et al. May 2009, Am J Clin Nutr, Vol. 89, pp. 1299‐1306. Reduction in consumption of sugar‐sweetened beverages is associated with weight loss: the PREMIER trial.
5. Stanhope, KL, et al. 5, 2009, J Clin Invest, Vol. 119, pp. 1322‐34. Consuming fructose‐sweetened, not glucose‐sweetened, beverages increases visceral adiposity and lipids and decreases insulin sensitivity in overweight/obese humans.
6. Schulze, MB, et al. 8, 2004, JAMA, Vol. 292, pp. 927‐34. Sugar‐Sweetened Beverages, Weight Gain, and Incidence of Type 2 Diabetes in Young and Middle‐Aged Women.
People should get some sun every day for more Vitamin D.
20.4
2.2
12.5 13.6
27.6
None < 30 min 30‐60 min 1‐2 h > 2 h
Summer months sun exposure (%)

INUVIALUIT SETTLEMENT REGION • INUIT HEALTH SURVEY 2007–2008
5
Clinical Findings ........................................................................................................................ 22 Healthy Body Weight ............................................................................................................................................................... 22 Waist Circumference ................................................................................................................................................................ 22 Standing Height ....................................................................................................................................................................... 22 Sitting Height .......................................................................................................................................................................... 22 Blood Lipids .............................................................................................................................................................................. 23 Participants’ Lipid Levels........................................................................................................................................................... 23 Blood Pressure .......................................................................................................................................................................... 23 Type 2 Diabetes Mellitus .......................................................................................................................................................... 24 References ............................................................................................................................................................................... 24
What Adults Ate ....................................................................................................................... 25 Country Food ........................................................................................................................................................................... 25 Market Food ............................................................................................................................................................................ 26 Calories, Fat, Protein, and Carbohydrates ................................................................................................................................. 27 Folate ....................................................................................................................................................................................... 27 Iron Status and Anemia ............................................................................................................................................................. 27 Vitamin D ................................................................................................................................................................................ 28 Sun Exposure ........................................................................................................................................................................... 29 References ............................................................................................................................................................................... 29
Parasitic Diseases and Bacteria ................................................................................................. 30 Parasitic Diseases ..................................................................................................................................................................... 30 Bacteria .................................................................................................................................................................................... 31
2007–2008 INUIT HEALTH SURVEY • INUVIALUIT SETTLEMENT REGION
28
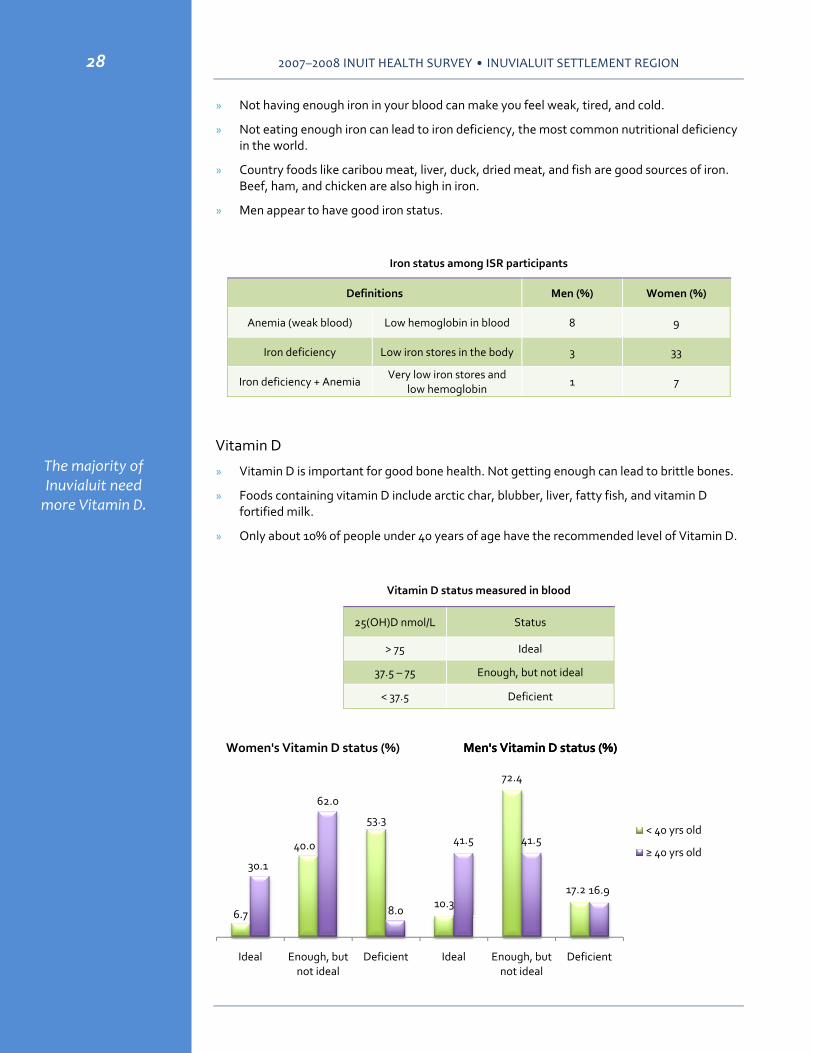
» Not having enough iron in your blood can make you feel weak, tired, and cold.
» Not eating enough iron can lead to iron deficiency, the most common nutritional deficiency in the world.
» Country foods like caribou meat, liver, duck, dried meat, and fish are good sources of iron. Beef, ham, and chicken are also high in iron.
» Men appear to have good iron status.
Iron status among ISR participants
Definitions Men (%) Women (%)
Anemia (weak blood) Low hemoglobin in blood 8 9
Iron deficiency Low iron stores in the body 3 33
Iron deficiency + Anemia Very low iron stores and
low hemoglobin 1 7
Vitamin D
» Vitamin D is important for good bone health. Not getting enough can lead to brittle bones.
» Foods containing vitamin D include arctic char, blubber, liver, fatty fish, and vitamin D fortified milk.
» Only about 10% of people under 40 years of age have the recommended level of Vitamin D.
Vitamin D status measured in blood
25(OH)D nmol/L Status
> 75 Ideal
37.5 – 75 Enough, but not ideal
< 37.5 Deficient
The majority of Inuvialuit need more Vitamin D.
6.7
40.0
53.3
10.3
72.4
17.2
30.1
62.0
8.0
41.5 41.5
16.9
Ideal Enough, but not ideal
Deficient Ideal Enough, but not ideal
Deficient
< 40 yrs old
≥ 40 yrs old
Men's Vitamin D status (%)Women's Vitamin D status (%) Men's Vitamin D status (%)

2007–2008 INUIT HEALTH SURVEY • INUVIALUIT SETTLEMENT REGION
6
Executive Summary his report provides a summary of the results from the Inuit Health Survey: Health in Transition and Resiliency conducted in the Inuvialuit Settlement Region in 2008.
BAC KGROUND Inuvialuit have expressed a desire to have health information that is of practical relevance so that informed decisions can be made in the face of the rapid changes that are affecting all dimensions of life in Arctic communities. In response to these concerns, a multifaceted participatory health research project for those 18 years of age and above was developed and undertaken in 6 communities in the Inuvialuit Settlement Region in 2008. The goal of the survey was to obtain an overview of the health status and living conditions of Inuvialuit living in the Inuvialuit Settlement Region.
FUND I N G Funding for this project was received from the Government of Canada’s Program for International Polar Year, Canadian Institutes for Health Research, Health Canada, University of Toronto, Inuvialuit Regional Corporation, Indian and Northern Affairs, and ArcticNet.
E TH I C S APPRO VA L All work was approved by McGill’s Institutional Review Board, the Aurora Research Institute and community corporations through community‐university agreements.
RE SU L T S » A total of 288 households and 362 individuals participated.
H om e E n v i r o n m e n t
» Almost half of the participants lived in private households. Many homes were in need of major repairs and families with children experienced overcrowding.
L a n g u a g e
» English was reported as the dominant language spoken in Inuvialuit homes, which reflects the effect of Residential Schools.
Sm o k i n g
» The majority of homes in the ISR had smokers.
F o o d I n s e c u r i t y
» Food insecurity was a problem in homes in ISR communities. Unemployment, low income and high food costs were the main reasons for food insecurity.
C o u n t r y F o o d s a n d F o o d S h a r i n g
» Participants preferred to eat country food but the high cost of obtaining it makes it difficult.
T

INUVIALUIT SETTLEMENT REGION • INUIT HEALTH SURVEY 2007–2008
27
Calories, Fat, Protein, and Carbohydrates
» Men consumed more Calories than women, and younger adults consumed more Calories than older adults.
» Average Caloric intake was higher among Inuvialuit compared with the rest of Canadians in the 2004 Canadian Community Health Survey (CCHS) (2).
» Men consumed more Calories as protein and fat than women.
» Women consumed more Calories as carbohydrates than men.
Acceptable intake ranges for carbohydrate, protein, and fat (3)
Carbohydrate Protein Fat
45 – 65 % 10 – 35% 20 – 35%
Folate
» Folate is important for healthy pregnancies.
» Folate in red blood cells showed adequate levels for women of reproductive age.
Iron Status and Anemia
» Iron has many functions in our body.
» One important function is transporting the oxygen we breath in throughout the body.
3394
2536
2331
2108
Men < 40 years old (n=26)
Men ≥ 40 years old (n=57)
Women < 40 years old (n=76)
Women ≥ 40 years old (n=99)
Average Caloric intake
Protein23%
Fat35%
Men (n=86)
Carbohydrates42%
Protein20%
Fat33%
Women (n=181)
Carbohydrates47%
Iron deficiency is more common among women, especially young
women.

INUVIALUIT SETTLEMENT REGION • INUIT HEALTH SURVEY 2007–2008
7
» Food sharing networks were strong in communities and more than two‐thirds of households shared their country food with others in their community.
C o s t o f L i v i n g
» Participants spent more money on food and shelter than other Canadian households.
HEA L TH
S e l f ‐ r e p o r t e d H e a l t h
» Over 70% of participants reported their health to be good, very good or excellent.
F am i l y H e a l t h H i s t o r y
» Heart disease, diabetes, high blood pressure, cancer, and high cholesterol were common health problems among parents and siblings of participants.
P a r t i c i p a n t s ’ H e a l t h H i s t o r y
» Very few participants reported being told by a health professional that they had heart disease; but diabetes, cancer, high blood pressure and high cholesterol were common health problems.
P h y s i c a l A c t i v i t y
» Participants walked on average 20 minutes per day on the 5 days in the week prior to the survey.
Sm o k i n g
» At the time of the survey, smoking was very common among participants.
E d u c a t i o n
» More than 30% of participants completed secondary school.
P e r s o n a l I n c o m e a n d Em p l o ym e n t
» The main source of income was work related and almost half of the participants had full‐time employment.
C L I N I C A L F I N D I N G S
We i g h t
» The majority of participants were classified as overweight and obese.
» The majority of men and women had an “at‐risk” waist circumference.
B l o o d L i p i d s
» Many participants had healthy lipid levels.
B l o o d P r e s s u r e
» The majority of participants had normal blood pressure.
T y p e 2 D i a b e t e s M e l l i t u s ( H o n e y ‐ S w e e t )
» 10.6% of participants had a fasting glucose level that was too high and 5.6% had a 2‐hour OGTT glucose level that was too high, suggesting either pre‐diabetes or diabetes.

2007–2008 INUIT HEALTH SURVEY • INUVIALUIT SETTLEMENT REGION
26
Country food consumption the day before each participant was interviewed for the survey:
• The average proportion of total Calories that came from country food was higher among older participants than younger participants.
• Country food intake has decreased in the past decade (1).
Market Food
» Foods such as chips, pop, sweet drinks (made from crystals), and chocolate bars/candy are high in “empty Calories” – this means they are not healthy foods to eat on a daily basis. Many adults consumed these foods on the day before the interview.
» The most commonly consumed market food was regular pop ‐ almost 80% of adults reported drinking pop in the month prior to the interview.
» Milk has more nutrients than sugary drinks, but was consumed less often and in smaller quantities than sugary drinks.
» One quarter to one third of total Calories consumed came from high sugar foods and drinks.
7.7
21.1
5.9
18.0
Men < 40 years old (n=26)
Men ≥ 40 years old (n=57)
Women < 40 years old (n=76)
Women ≥ 40 years old (n=99)
% Calories from country food on the day before the interview
29 2930
25
Men < 40 years old (n=26)
Men ≥ 40 years old (n=57)
Women < 40 years old (n=76)
Women ≥ 40 years old (n=99)
% Calories from foods with more than 25% of energy as sugar on the day before the interview
Many studies have shown that higher intakes of sugar, especially the sugar from soft
drinks, are associated with an increased risk of obesity (too much body fat), heart disease, and
diabetes (2,4,5,6)
Participants reported drinking 2 – 4 cans of soft drinks per day. One can contains 9 teaspoons of sugar.

2007–2008 INUIT HEALTH SURVEY • INUVIALUIT SETTLEMENT REGION
8
NUTR I T I O N
C o u n t r y F o o d
» Older participants (≥ 40 years of age) ate more country food than younger participants (< 40 years of age).
Ma r k e t F o o d
» Almost 80% of adults reported drinking 2 ‐ 4 cans of soft drink per day in the month prior to the survey.
V i t a m i n D
» The majority of Inuvialuit need more Vitamin D.
I r o n S t a t u s a n d A n em i a
» Iron deficiency is more common among women, especially younger women.
P a r a s i t i c D i s e a s e s
» Parasitic diseases are rare in the ISR. Very few people tested positive for Echinococcosis, Trichinosis, Toxocariasis or Toxoplasmosis.
B a c t e r i a
» The majority of participants tested positive for Helicobacter pylori.
INUVIALUIT SETTLEMENT REGION • INUIT HEALTH SURVEY 2007–2008
25
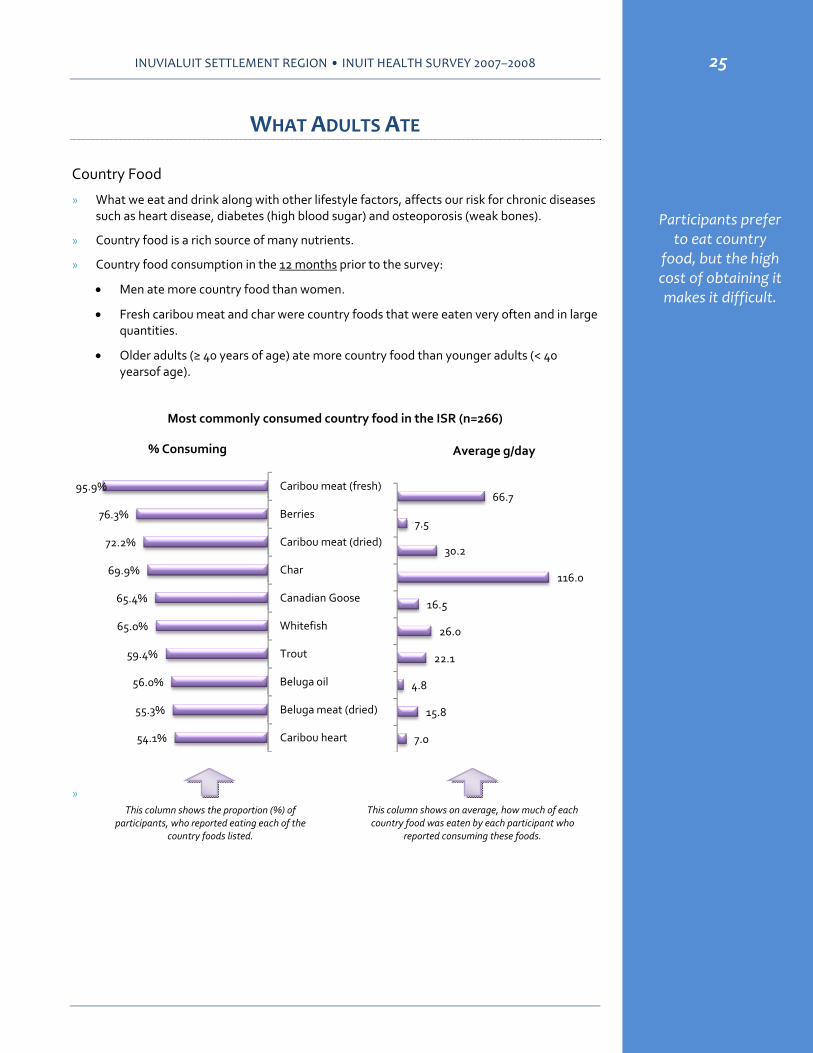
WHAT ADULTS ATE
Country Food
» What we eat and drink along with other lifestyle factors, affects our risk for chronic diseases such as heart disease, diabetes (high blood sugar) and osteoporosis (weak bones).
» Country food is a rich source of many nutrients.
» Country food consumption in the 12 months prior to the survey:
• Men ate more country food than women.
• Fresh caribou meat and char were country foods that were eaten very often and in large quantities.
• Older adults (≥ 40 years of age) ate more country food than younger adults (< 40 yearsof age).
Most commonly consumed country food in the ISR (n=266)
»
95.9%
76.3%
72.2%
69.9%
65.4%
65.0%
59.4%
56.0%
55.3%
54.1%
Caribou meat (fresh)
Berries
Caribou meat (dried)
Char
Canadian Goose
Whitefish
Trout
Beluga oil
Beluga meat (dried)
Caribou heart
% Consuming
66.7
7.5
30.2
116.0
16.5
26.0
22.1
4.8
15.8
7.0
Average g/day
This column shows the proportion (%) of participants, who reported eating each of the
country foods listed.
This column shows on average, how much of each country food was eaten by each participant who
reported consuming these foods.
Participants prefer to eat country
food, but the high cost of obtaining it makes it difficult.
INUVIALUIT SETTLEMENT REGION • INUIT HEALTH SURVEY 2007–2008
9
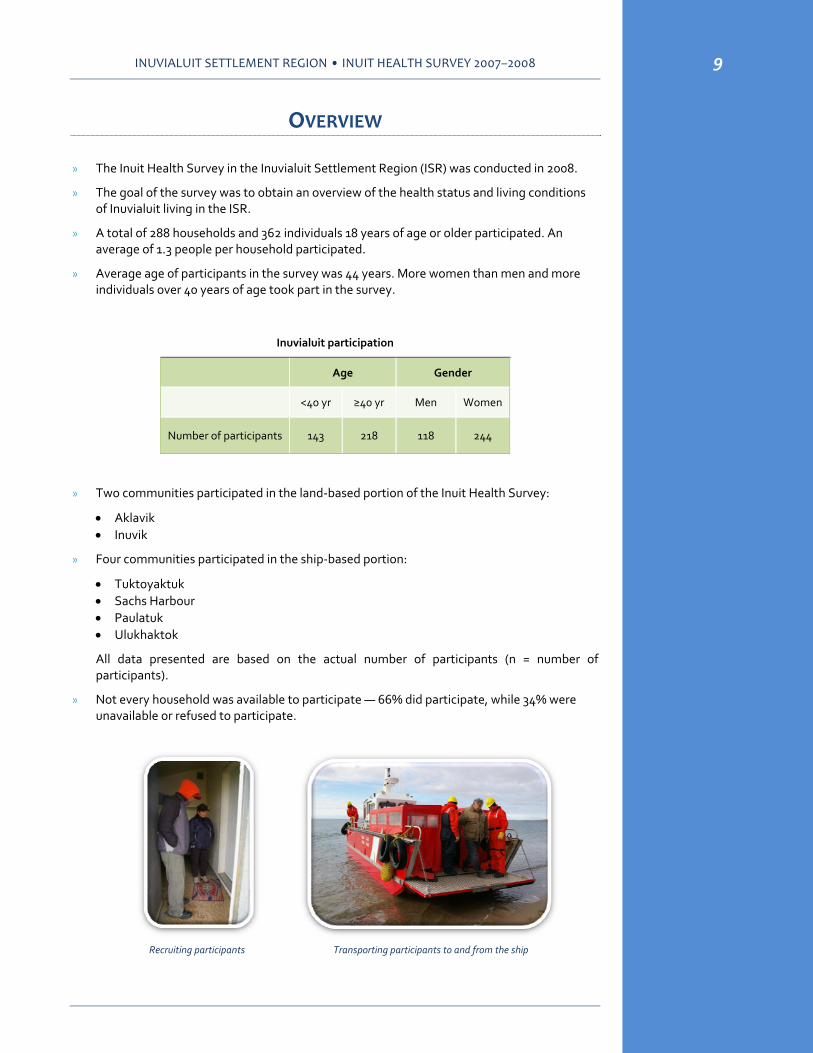
OVERVIEW
» The Inuit Health Survey in the Inuvialuit Settlement Region (ISR) was conducted in 2008.
» The goal of the survey was to obtain an overview of the health status and living conditions of Inuvialuit living in the ISR.
» A total of 288 households and 362 individuals 18 years of age or older participated. An average of 1.3 people per household participated.
» Average age of participants in the survey was 44 years. More women than men and more individuals over 40 years of age took part in the survey.
Inuvialuit participation
Age Gender
<40 yr ≥40 yr Men Women
Number of participants 143 218 118 244
» Two communities participated in the land‐based portion of the Inuit Health Survey:
• Aklavik • Inuvik
» Four communities participated in the ship‐based portion:
• Tuktoyaktuk • Sachs Harbour • Paulatuk • Ulukhaktok
All data presented are based on the actual number of participants (n = number of participants).
» Not every household was available to participate — 66% did participate, while 34% were unavailable or refused to participate.
Recruiting participants Transporting participants to and from the ship

2007–2008 INUIT HEALTH SURVEY • INUVIALUIT SETTLEMENT REGION
24
» Blood pressure was measured 3 times when participants were at rest.
» It is important to keep blood pressure at “normal” levels because with high blood pressure or hypertension the heart has to work harder and your blood vessels take a beating (2).
» Untreated high blood pressure is a risk for heart disease and stroke (2).
Blood pressure Systolic pressure
Diastolic pressure
Normal < 120 < 80
Pre‐hypertension 120 ‐139 80 ‐ 89
Hypertension stage 1 140 ‐ 159 90 ‐ 99
Hypertension stage 2 ≥ 160 ≥ 100
Type 2 Diabetes Mellitus
» When blood sugar is too high, the body cannot use the fuel (food) to function properly, and a person may have pre‐diabetes or diabetes.
» Fasting blood samples were used to test for blood sugar (glucose).
» About one half of the survey participants in the ISR had a second blood sample taken two hours after drinking a flavoured glucose sugar drink. The test is called an oral glucose tolerance test (OGTT) and is a way of seeing how the body handles glucose.
» The survey found that 10.6% of participants in ISR had a fasting glucose level that was too high (> 6 mmol/L) which indicates either pre‐diabetes or diabetes. 5.6% had a 2‐hour OGTT glucose level that was too high (>7.8 mmol/L) which indicates pre‐diabetes or diabetes.
References 1. Health Canada. Canadian Guidelines for Body Weight Classification in Adults, 2003. Minister of Public
Works and Government Services Canada. Ottawa, Ontario.
2. American Heart Organization. Understanding blood pressure readings.www.americanheart.org/presenter.jhtml?identifier=2112 (accessed April 22, 2010).
A survey cannot diagnose diabetes. However, results suggest that 11% of participants have fasting glucose
levels that are too high, suggesting
either pre‐diabetes or diabetes.
63.3n=152
29.6n=71
5.8n=14
1.3n=4
Participants in each blood pressure range (%)
Normal
Pre‐hypertension
Hypertension stage 1
Hypertension stage 2
10.6%5.6%
Fasting glucose > 6 mmol/L Post OGTT glucose > 7.8 mmol/L
Participants with "at risk" glucose levels

2007–2008 INUIT HEALTH SURVEY • INUVIALUIT SETTLEMENT REGION
10
Houses in Inuvik
RESULTS FROM HOME‐BASED QUESTIONNAIRES
Home Environment
» The home environment is important for the health and well‐being of Inuvialuit.
» About half of the participants in the ISR lived in private households.
» 28% of participants lived in homes needing major repairs.
» Mold was reported as a problem in 4% of homes in the ISR.
» 8% of homes had mold and needed major repairs.
Homelessness and Crowding
» During the 12 months prior to the survey, 22% of homes (n=60) provided shelter to homeless persons. An average of 2.3 people stayed a median of 9 weeks.
» The average household consisted of 3.5 people. In other Canadian households the number is 2.5 (1).
» Each home reported having an average of 3 bedrooms. Half of the homes had more than 2 people per bedroom.
» Based on Statistics Canada’s definition of crowding (1), which is having more than one person per room where rooms include kitchen, living room and bedrooms, more than 13% of homes (n=38) were crowded.
» 62% of homes (n=166) had children. Of those, 23% (n=37) were crowded. Crowding was a problem in homes with children.
» In contrast, among the 100 homes without children, the prevalence of crowding was only 1% (n=1).
» According to the 2006 Census, only 3% of non‐Aboriginal people living in Canada lived in a crowded dwelling (1).
48.6 48.9
Public Private
Type of housing (%)
n=139 n=138
Many homes are in need of major
repairs.
Families with children
experience overcrowding in
ISR.

INUVIALUIT SETTLEMENT REGION • INUIT HEALTH SURVEY 2007–2008
23
Blood Lipids
» The type and amount of lipids (fats) circulating in the blood stream provide an indication of a person’s risk for cardiovascular disease.
» Nurses collected fasting blood samples in the morning from participants.
» These samples were used to assess total cholesterol, high density lipoprotein cholesterol (HDL‐chol) which is the healthy cholesterol, and low density lipoprotein cholesterol (LDL‐chol) which is the unhealthy cholesterol.
» 59% of ISR participants had a level of total cholesterol that was too high, 24% had high levels of the unhealthy cholesterol (LDL‐chol), and 32% had low levels of healthy cholesterol (HDL‐chol). Triglyceride levels were too high for 28% of participants.
Participants’ Lipid Levels
Blood Pressure
» Blood pressure is the force needed to deliver blood to all parts of our body. Blood pressure is always given as 2 numbers, systolic pressure and diastolic pressure, a higher number over a lower number.
» Nurses measured the systolic blood pressure (the pressure when your heart contracts = the higher number) and the diastolic blood pressure (the pressure when your heart is at rest = the lower number).
41.5%58.5%
Total cholesterol
Good Too high
72.3%
27.7%
Triglycerides
76.1%
23.9%
LDL‐cholesterol
67.7%
32.3%
HDL‐cholesterol
Good Too low
A survey cannot diagnose
hypertension, but does give a picture of the likely extent of blood pressure problems in the
ISR.

INUVIALUIT SETTLEMENT REGION • INUIT HEALTH SURVEY 2007–2008
11
Language
» English was reported as the dominant language spoken at home. In the ISR, 93% of participants spoke English at home.
» Inuinnaqtun, Siglitin and/or Uummarmiutun were spoken in 12% of homes.
» The high percentage of English spoken at home reflects the impact of Residential Schools (2).
» Traditional languages are now being taught in public schools.
Smoking in Households
» 82% (n=233) of households had smokers, and there were on average two smokers per home.
» Smoking indoors was forbidden in 70% of homes.
FOOD S E CU R I T Y » The food security questionnaire, developed by the United States Department of
Agriculture, was used (3). Indian and Northern Affair Canada (INAC) modified the questionnaire based on discussions with Inuit interviewers (4).
» More than half of the households reported that they had enough food to eat (food secure).
» Severe Food Insecurity is defined as disrupted eating patterns and reduced food intake among adults and or children (3).
» About 13% of households reported severe food insecurity.
» According to the Canadian Community Health Survey (CCHS) 2004, only 2.9% of Canadian households reported moderate or severe food insecurity (4).
» 34% of households with children (n=57) were food insecure.
» Unemployment, low income and high food costs were the main reasons for food insecurity.
13%n=36
33%n=87
54%n=143
Household food security (%)
Severe food insecurityModerate food insecurityFood secure
Food insecurity is a problem in homes
in ISR communities.
2007–2008 INUIT HEALTH SURVEY • INUVIALUIT SETTLEMENT REGION
22
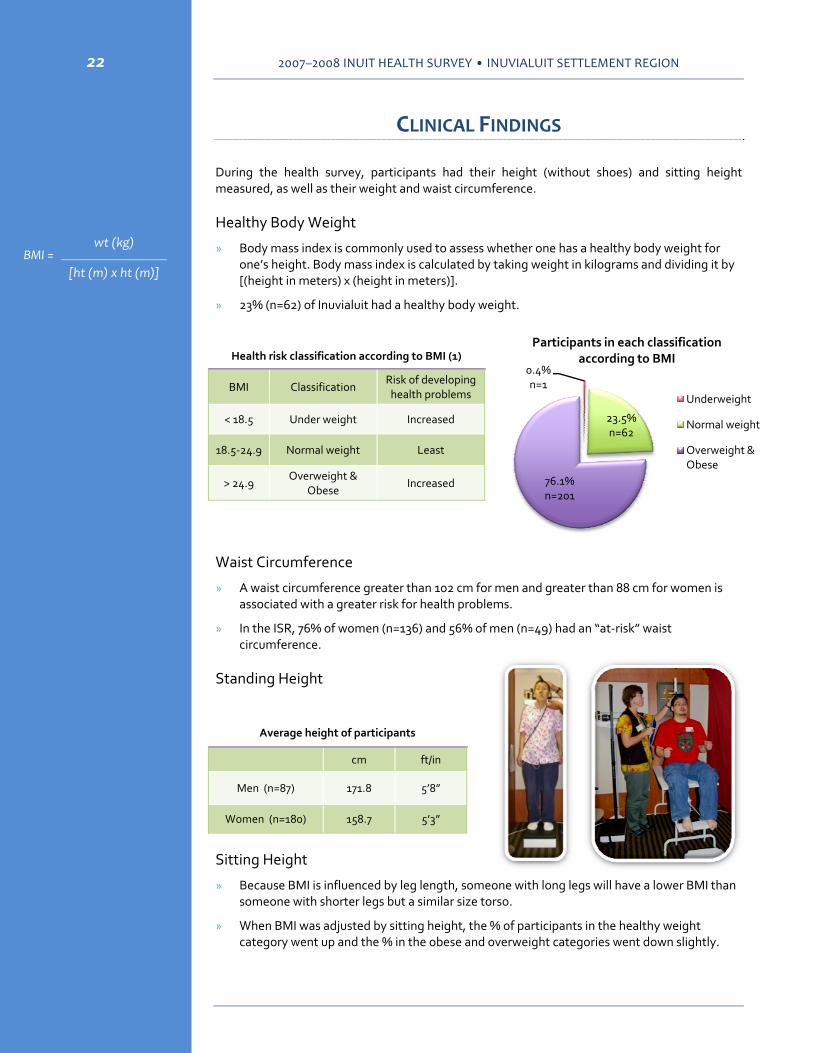
CLINICAL FINDINGS
During the health survey, participants had their height (without shoes) and sitting height measured, as well as their weight and waist circumference.
Healthy Body Weight
» Body mass index is commonly used to assess whether one has a healthy body weight for one’s height. Body mass index is calculated by taking weight in kilograms and dividing it by [(height in meters) x (height in meters)].
» 23% (n=62) of Inuvialuit had a healthy body weight.
Health risk classification according to BMI (1)
BMI Classification Risk of developing health problems
< 18.5 Under weight Increased
18.5‐24.9 Normal weight Least
> 24.9 Overweight &
Obese Increased
Waist Circumference
» A waist circumference greater than 102 cm for men and greater than 88 cm for women is associated with a greater risk for health problems.
» In the ISR, 76% of women (n=136) and 56% of men (n=49) had an “at‐risk” waist circumference.
Standing Height
Average height of participants
cm ft/in
Men (n=87) 171.8 5’8”
Women (n=180) 158.7 5’3”
Sitting Height
» Because BMI is influenced by leg length, someone with long legs will have a lower BMI than someone with shorter legs but a similar size torso.
» When BMI was adjusted by sitting height, the % of participants in the healthy weight category went up and the % in the obese and overweight categories went down slightly.
0.4%n=1
23.5%n=62
76.1%n=201
Participants in each classification according to BMI
Underweight
Normal weight
Overweight & Obese
BMI = wt (kg)
[ht (m) x ht (m)]

2007–2008 INUIT HEALTH SURVEY • INUVIALUIT SETTLEMENT REGION
12
» Historically, food insecurity has been a problem. Although food insecurity in ISR has improved, it is still higher than the Canadian experience.
Country Food and Food Sharing Networks
» More than half of the households said that they had an active hunter in the home and 70% of households with children had an active hunter.
» Also, food sharing networks are strong in ISR communities. More than two‐thirds of households shared their country food with others in their community.
» Most households said they obtained country food from hunting and their families. Other important ways to obtain country food were from friends, stores, and community freezers/hunters and trappers organizations (CF/HTO).
» About one‐fourth of households preferred mainly country food, while the rest (74%) preferred a mix of both country and store‐bought foods.
» About one‐half (49%) of homes in the ISR worry about contaminants in country food.
Availability of Country Food
» Most households (86%) preferred to eat more country food than they could get.
» There were many reasons why participants could not get country food. The primary reasons were not having an active hunter in the home, not having a skidoo or boat, and the high cost of supplies and gas to go hunting and fishing.
» When households ran out of country food, more than two thirds received food from family, friends, the community freezer or hunter and trapper organizations. Almost 60% bought more store food, many went hunting or fishing (30%), and over 25% went without.
2.9
14.2
45.2
70.5
58.4
Stores
CF/HTO
Friends
Family
Hunting
How country food was obtained (%)
n=164
n=198
n=127
n=40
n=8
Food sharing networks are strong. The majority of
households share their country food
with others.
Inuvialuit prefer to eat country food, but the high cost of obtaining it
makes it difficult.
Ice house in Tuktoyaktuk

INUVIALUIT SETTLEMENT REGION • INUIT HEALTH SURVEY 2007–2008
21
» 5% of participants received income support.
» 12% of participants received their income from other sources (employment insurance, workers’ compensation, hunter support program, child support/foster care, dividends, interest and life insurance and child tax benefit).
» 37% of participants under 65 years of age estimated their personal income to be less than $20,000 per year.
» Almost 70% of participants 65 years and above estimated their personal income to be less than $20,000 per year.
Employment
» At the time of the interview 44% of participants had full time employment.
Employment status
n %
Full time 113 43.8
Part‐time /occasional work 66 25.6
Other 79 30.6
References
1. Tait H. AboriginalPeoples Survey, 2006: Inuit Health and Social Conditions. Ottawa, ON: Statistics Canada, 2008. Available at: dsp‐psd.pwgsc.gc.ca/collection_2008/statcan/89‐637‐X/89‐637‐x2008001 (accessed 8 March, 2010).
2. Statistics Canada. 2007.www.statcan.gc.ca/pub/82‐221‐x/2008001/structure/hs‐es/conditions/../../cchs03‐en.xls (accessed October 19, 2009) (diabetes, blood pressure)
3. Gilmour H. Physically active Canadians. Health reports, vol.18, no.3, August 2007.Statistics Canada, catalogue 82‐003, Available at: www.statcan.gc.ca/pub/82‐003‐x/2006008/article/phys/10307‐eng.pdf (accessed April 21, 2010).
4. www.hc‐sc.gc.ca/fniah‐spnia/substan/tobac‐tabac/effects‐effets‐eng.php (accessed April 27, 2010) (smoking).
5. Facts about smoking. The Lung Association of Canada. www.lung.ca/home‐accueil_e.php.
37.3
23.215.5
24.1
69
20.73.5 6.9
< 20,000 20,000 ‐ 40,000 40,000 ‐ 60,000 > 60,000
Personal income (%)
< 65 years ≥ 65 years
n=82
n=51n=34
n=53
n=20
n=6
n=1 n=2

INUVIALUIT SETTLEMENT REGION • INUIT HEALTH SURVEY 2007–2008
13
» The majority of households felt getting country food was cheaper than store‐bought food. There were 25% who said country food was as costly as store‐bought food, and 14% who thought country food was more expensive.
Limitations to getting country food*
n %
No active hunter 105 43
No transportation 79 32
Gas & supplies too expensive 70 29
Scarce/hard to harvest 40 16
Weather/no time 34 14
Other 34 14
*Percentages do not add up to 100 because participants could give more than one answer.
Cost of Living
» In the month prior to the survey, 20% (n=58) of households had someone receiving income support.
» The average household in the ISR spent $1,317 per month on food. The survey took place in August and amounts do vary throughout the year due to transportation costs.
» The average amount for other Canadian households was about $609 per month (5).
» A large difference in food costs was noted between homes with children and homes without children.
» The average household in the ISR spent $1,471 on shelter per month. This amount includes rent or mortgage, electricity, heating fuel, gas, water and sewage, and garbage.
» Homes with children spent between $907 and $2,382 on shelter each month. Homes without children spent between $463 and $, on shelter each month.
» According to Statistics Canada’s Survey of household spending, the average Canadian household spent $1,137 per month (5) on shelter in 2007.
60.7
25.1
14.2
Cheaper Same More expensive
Cost of country food vs. store‐bought food (%)
n=162 n=67n=38
Inuvialuit households spend more on food and shelter than other
Canadian households.
$2,382$2,180
$907
$463
Homes with children
Homes with no children
Money spent on shelter per household each month
Private housing
Public housing
$1,422
$821
$1,627
$1,046
Homes with children
Homes with no children
Money spent on food per household each month
Private housing
Public housing
2007–2008 INUIT HEALTH SURVEY • INUVIALUIT SETTLEMENT REGION
20
SOC I A L DEMOGRA PH I C I N F O RMA T I O N
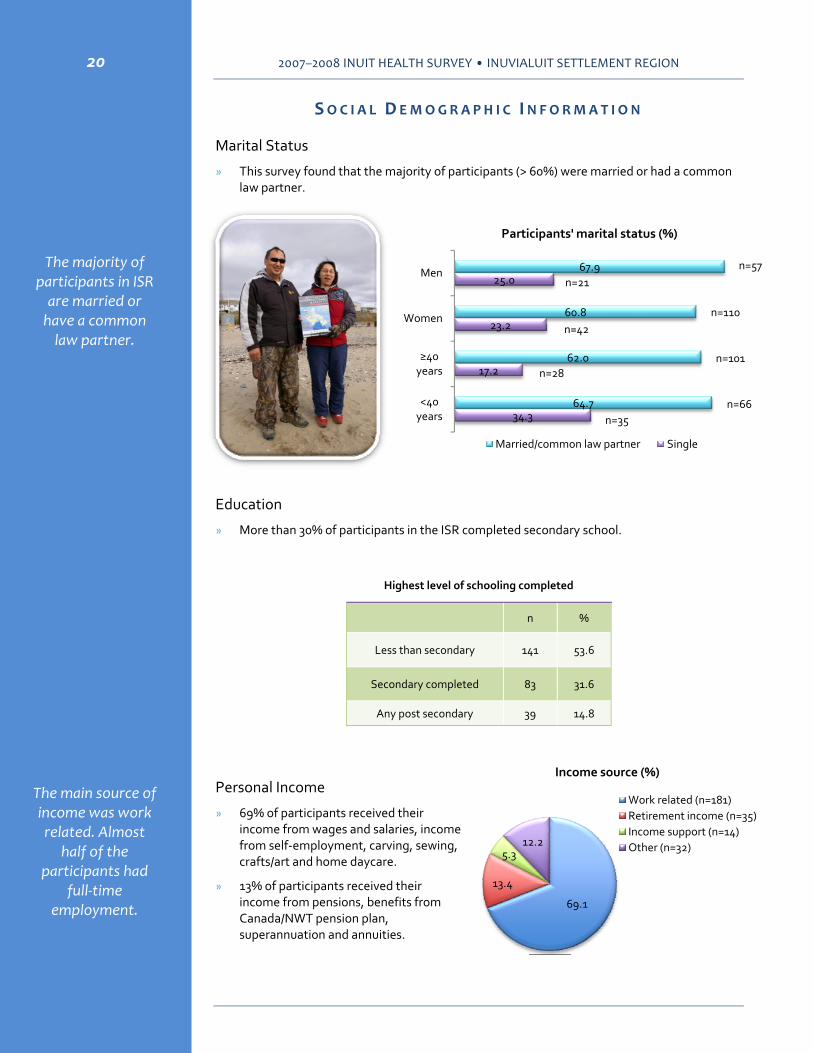
Marital Status
» This survey found that the majority of participants (> 60%) were married or had a common law partner.
Education
» More than 30% of participants in the ISR completed secondary school.
Highest level of schooling completed
n %
Less than secondary 141 53.6
Secondary completed 83 31.6
Any post secondary 39 14.8
Personal Income
» 69% of participants received their income from wages and salaries, income from self‐employment, carving, sewing, crafts/art and home daycare.
» 13% of participants received their income from pensions, benefits from Canada/NWT pension plan, superannuation and annuities.
34.3
17.2
23.2
25.0
64.7
62.0
60.8
67.9
<40 years
≥40 years
Women
Men
Participants' marital status (%)
Married/common law partner Single
n=57n=21
n=110n=42
n=101n=28
n=66n=35
The majority of participants in ISR are married or have a common law partner.
The main source of income was work related. Almost
half of the participants had
full‐time employment. 69.1
13.4
5.312.2
Income source (%)
Work related (n=181)Retirement income (n=35)Income support (n=14)Other (n=32)
2007–2008 INUIT HEALTH SURVEY • INUVIALUIT SETTLEMENT REGION
14
References
1. Statistics Canada. 2006 Census: Aboriginal peoples. Available at: www41.statcan.gc.ca/2008/10000/‐ceb10000_000‐eng.htm (accessed October 1, 2009) (home repair, crowded household).
2. Legacy of Hope Foundation. 2009: We Were So Far Away, The Inuit Experience of Residential Schools, Available at: www.legacyofhope.ca/WeWereSoFarAway.aspx (accessed April 29, 2010).
3. Nord, M., Andrews, M., & Carlson, S. Household food security in the United States, 2006. Economic Research Service ‐ United States Department of Agriculture. Washington: United States Department of Agriculture, 2007.
4. Office of Nutrition Policy and Promotion. Canadian Community Health Survey Cycle 2.2, Nutrition (2004). Income‐related household food security in Canada. Ottawa: Health Canada, 2007.
5. Statistics Canada. 2007: Survey of household spending, http://www.statcan.gc.ca/pub/62‐202‐x/2006000/t001‐eng.htm (accessed October 14, 2009) (food, shelter).

INUVIALUIT SETTLEMENT REGION • INUIT HEALTH SURVEY 2007–2008
19
Physical Activity
» 74% of participants walked, on average, 20 minutes per day on 5 days in the week prior to the survey. Men walked for almost 123 minutes on these days and women walked for 85 minutes.
» 48% of respondents to the 2005 Canadian Community Health Survey, aged 12 years and older, reported that they walked less than half an hour each day in their leisure time (3).
Smoking Habits
» At the time of the survey, 65% of participants reported that they were smoking cigarettes.
» In comparison, only 22% of other Canadians smoked in 2007 (4).
» About 29% of participants had already stopped smoking. More men than women, and more older people than younger people had quit smoking.
» On average, men smoked 13 and women 10 cigarettes per day.
» The average age when participants began smoking was 15.5 years.
» It is well known that smoking causes cancer, emphysema, and heart disease.Quitting smoking is the best thing you can do to improve your health and quality of life (5).
4
2.1
4.5
3
Age ≥40 yr
Age <40 yr
Pregnancies and live births (N)
Pregnancies
Live births
Smoking is very common in the
ISR.
6.6
3.6
4.9
6.9
66.9
61.9
57.7
77.5
26.5
34.5
37.4
15.7
Female
Male
Age≥40
Age<40
Smoking (%)
Ex smoker Current smoker Non smoker
n=7
n=79
n=16
n=8
n=94
n=61
n=3
n=52
n=29
n=121
n=48
n=12
INUVIALUIT SETTLEMENT REGION • INUIT HEALTH SURVEY 2007–2008
15
RESULTS FROM INDIVIDUAL QUESTIONNAIRES
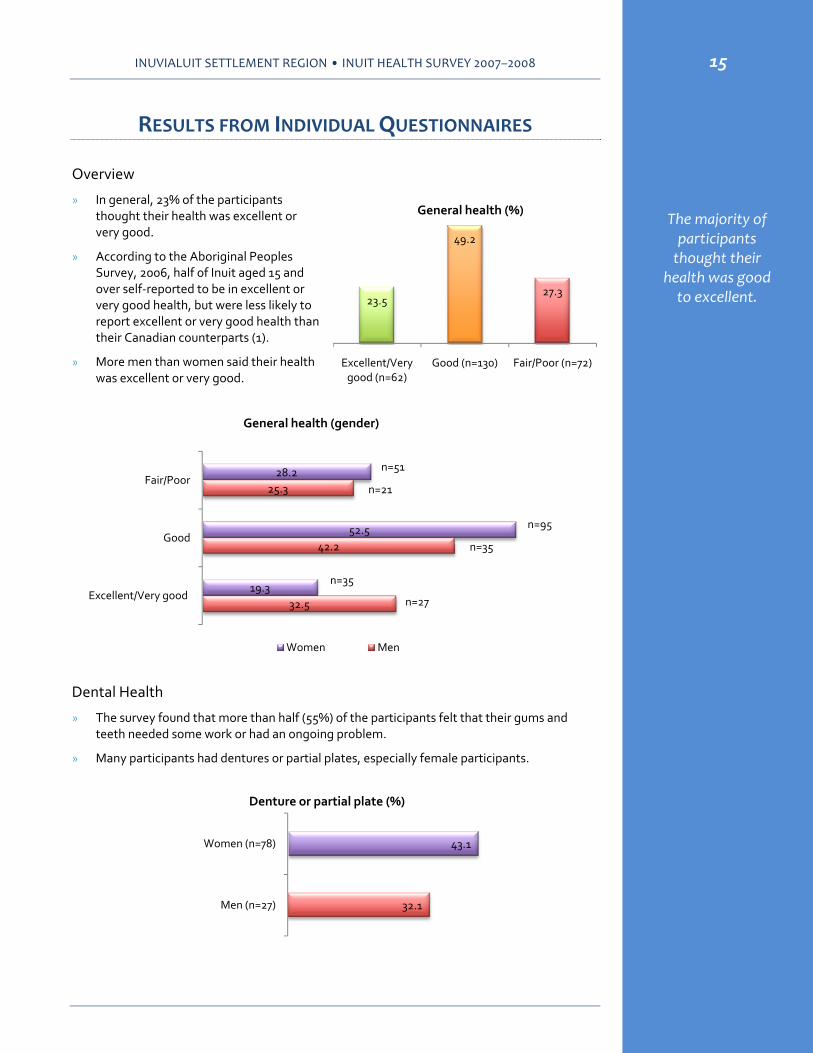
Overview
» In general, 23% of the participants thought their health was excellent or very good.
» According to the Aboriginal Peoples Survey, 2006, half of Inuit aged 15 and over self‐reported to be in excellent or very good health, but were less likely to report excellent or very good health than their Canadian counterparts (1).
» More men than women said their health was excellent or very good.
Dental Health
» The survey found that more than half (55%) of the participants felt that their gums and teeth needed some work or had an ongoing problem.
» Many participants had dentures or partial plates, especially female participants.
The majority of participants thought their
health was good to excellent.
23.5
49.2
27.3
Excellent/Very good (n=62)
Good (n=130) Fair/Poor (n=72)
General health (%)
32.5
42.2
25.3
19.3
52.5
28.2
Excellent/Very good
Good
Fair/Poor
General health (gender)
Women Men
32.1
43.1
Men (n=27)
Women (n=78)
Denture or partial plate (%)
n=27
n=35
n=35
n=95
n=21
n=51

2007–2008 INUIT HEALTH SURVEY • INUVIALUIT SETTLEMENT REGION
18
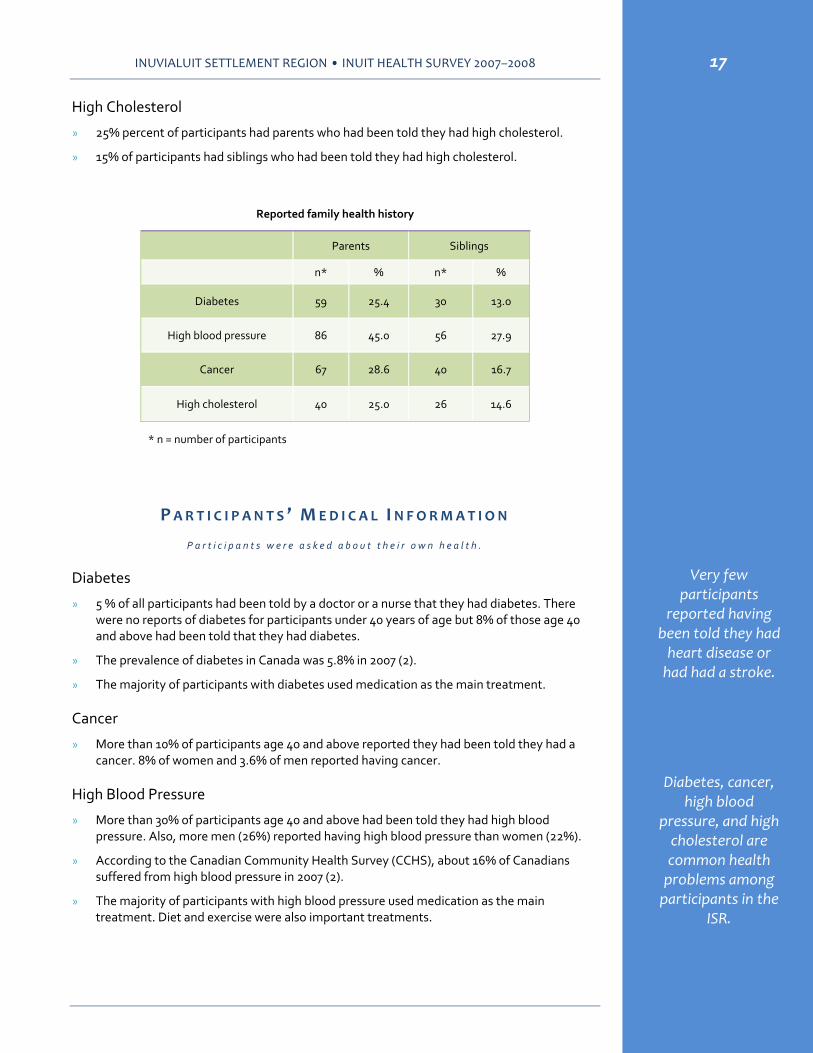
High Cholesterol
» High cholesterol was a common health problem, especially for those age 40 and over.
» The majority of participants with high cholesterol followed a treatment of medication. Many also followed a program of diet and exercise.
Participants’ health history
Age Gender
<40 yr ≥40 yr Men Women
n % n % n % n %
Diabetes 0 0.0 13 8.0 4 4.8 9 5.0
Cancer 1 1.0 17 10.4 3 3.6 15 8.3
High blood pressure 9 9.1 52 32.3 22 26.5 39 22.0
High cholesterol 3 3.0 33 21.3 12 14.3 24 14.1
Reproductive Health
» 84% of women had had a Pap test within two years of the survey.
» A further 7% of women had had a Pap test within 3‐5 years of the survey.
» 9% of women had either never had a Pap test or had not had one in more than 5 years.
Time of most recent Pap test
Age
<40 yr ≥40 yr
n % n %
Last 2 years 68 90.7 79 79.8
More than 2 years 2 2.7 10 10.1
Never or more than 5 years
5 6.7 10 10.1
» Women 40 years of age and above had had 4.5 pregnancies and 4 live births.
» Women below 40 years of age had had 3 pregnancies and 2.1 live births.
Most women had had a Pap test
within two years of the survey.

2007–2008 INUIT HEALTH SURVEY • INUVIALUIT SETTLEMENT REGION
16
RE POR T E D FAM I L Y HEA L T H H I S TO R Y
P a r t i c i p a n t s w e r e a s k e d a b o u t t h e i r p a r e n t s ’ a n d s i b l i n g s ’ h e a l t h .
Heart Attack
» 24% of participants reported that their parents were told by a doctor or a nurse that they had had a heart attack.
» 13% of participants had siblings who were told they had had a heart attack.
Stroke
» 17% of participants had parents who were told by a doctor or a nurse they had had a stroke.
» 6% of participants had siblings who had been told they had had a stroke.
Reported family health history
Parents Siblings
n* % n* %
Heart attack 59 24.2 31 12.8
Stroke 42 17.4 15 6.3
Other 51 22.2 39 16.7
* n = number of participants
Diabetes
» 25% of participants reported that their parents were told by a doctor or a nurse that they had diabetes.
» 13% of participants had siblings who had been told that they had diabetes.
High Blood Pressure
» Almost half (45%) of participants had parents who were told by a doctor or a nurse that they had high blood pressure.
» Almost one‐third (28%) of participants had siblings who had been told that they had high blood pressure.
Cancer
» Approximately one‐third (29%) of participants hadparents who had been told that they had cancer.
» More than 16% of participants had siblings who had been told that they had cancer.
Diabetes, high blood pressure, cancer and high cholesterol are common health problems for parents and siblings of
participants.
Heart disease is a common health problem among parents and siblings of
participants.
INUVIALUIT SETTLEMENT REGION • INUIT HEALTH SURVEY 2007–2008
17
High Cholesterol
» 25% percent of participants had parents who had been told they had high cholesterol.
» 15% of participants had siblings who had been told they had high cholesterol.
Reported family health history
Parents Siblings
n* % n* %
Diabetes 59 25.4 30 13.0
High blood pressure 86 45.0 56 27.9
Cancer 67 28.6 40 16.7
High cholesterol 40 25.0 26 14.6
* n = number of participants
PAR T I C I P AN T S ’ MED I C A L I N F O RMA T I ON
P a r t i c i p a n t s w e r e a s k e d a b o u t t h e i r o w n h e a l t h .
Diabetes
» 5 % of all participants had been told by a doctor or a nurse that they had diabetes. There were no reports of diabetes for participants under 40 years of age but 8% of those age 40 and above had been told that they had diabetes.
» The prevalence of diabetes in Canada was 5.8% in 2007 (2).
» The majority of participants with diabetes used medication as the main treatment.
Cancer
» More than 10% of participants age 40 and above reported they had been told they had a cancer. 8% of women and 3.6% of men reported having cancer.
High Blood Pressure
» More than 30% of participants age 40 and above had been told they had high blood pressure. Also, more men (26%) reported having high blood pressure than women (22%).
» According to the Canadian Community Health Survey (CCHS), about 16% of Canadians suffered from high blood pressure in 2007 (2).
» The majority of participants with high blood pressure used medication as the main treatment. Diet and exercise were also important treatments.
Very few participants
reported having been told they had heart disease or had had a stroke.
Diabetes, cancer, high blood
pressure, and high cholesterol are common health problems among participants in the
ISR.
Top Related