


Languages
Pages
Legal

International Bioenergy & Bioproducts ConferenceDOE Biomass Program
October 14, 2009Valri Lightner, Deployment Team Lead

2009 Program PrioritiesScience & Discovery• Connecting basic and applied bioscience• Conducting breakthrough R&D:
− Advances in enzymes and catalysis− Engineering of new microorganisms − Novel sustainability indicators
Clean, Secure Energy• Developing & demonstrating cellulosic
and advanced biofuels to meet RFSEconomic Prosperity• Creating 50 to 75 jobs per new biorefinery• Creating major new energy crop markets• Reinvigorating rural economiesClimate Change• Reducing GHG emissions by up to 90% with
advanced biofuels (relative to gasoline)

Where We Are Going
Our Goal:36 billion gallons/year of biofuels by 2022
Our path forward:• Integrated programs R&D to solve technical barriers
• Applied research for short- and mid-term impact• Fundamental research for longer-term impact
• Cost-shared programs with industry to reduce risk
Sustainability is highly important in all aspects of our work
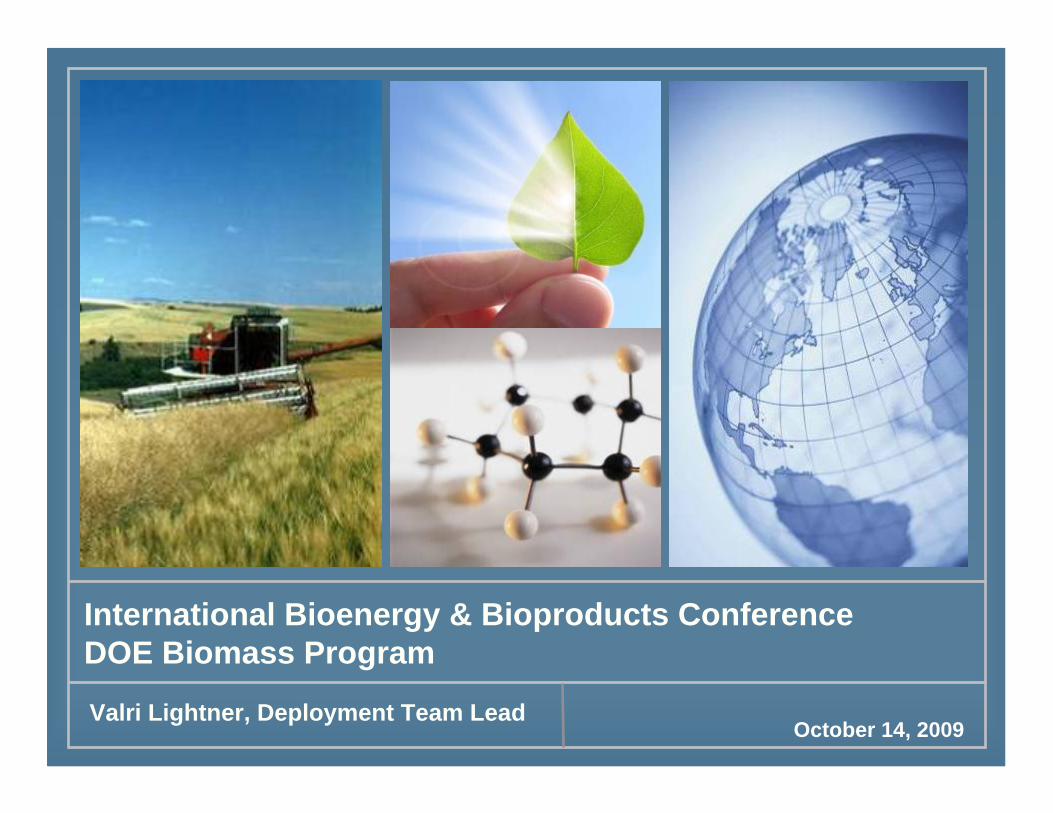
Renewable Fuel Standard (RFS)in the Energy Independence and Security Act (EISA) of 2007
EPAct 2005
Production Targets (Billions of Gallons)
EISA defines Advanced Biofuel as “renewable fuel, other than ethanol derived from corn starch, that has lifecycle greenhouse gas emissions…that are at least 50 percent less than baseline lifecycle greenhouse gas emissions.”
Ethanol & Biodiesel Conventional (Starch) Biofuel BiodieselCellulosic Biofuels Other Advanced Biofuels
Advanced Biofuels(include cellulosic biofuels other
than starch-based ethanol)
EISA Mandated Production Targets15 BGY cap on conventional
(starch) biofuel
EISA defines Cellulosic Biofuel as “renewable fuel derived from any cellulose, hemicellulose, or lignin that is derived from renewable biomass and that has lifecycle greenhouse gas emissions…that are at least 60 percent less than baseline lifecycle greenhouse gas emissions.”
4

Why Additional Advanced Biofuels?
U.S. Diesel Outlook (EIA AEO 2009 Reference Case for 2030)
• 75 billion gal/yr• 0.5 billion gal/yr biodiesel production (2007)
Jet Fuel Fraction
Diesel Fraction
U.S. Jet Fuel Outlook(EIA AEO 2009 Reference Case for 2030)
• 31 billion gal/yr
GasolineFraction
Petroleum
Cellulosic Ethanol displaces light duty gasoline fraction only.Need heavy duty/diesel substitutes to displace entire barrel.
Where Does My Gasoline Come From? Energy Information Administration DOE/EIA-X059 April 2008Annual Energy Outlook 2009, March 2009, DOE/EIA-0383(2009) 5

Three Bioenergy Research Centers (BRCs)
Targeting breakthroughs in biofuel technology to make abundant, affordable, low-carbon biofuels a reality
Already yielding results, such as:
−Bioengineering of yeasts that can produce gasoline-like fuels
−Developing improved ways to generate simple sugars from grasses and waste
• Joint BioEnergy Institute (LBNL)
• Bioenergy Science Center (ORNL)
• Great Lakes BioEnergy Research Center (Univ. of WI)

Conversion Technologies
Biomass Program Objectives and Goals
BiochemicalCost of converting feedstocks to ethanol: $0.92/gal by 2012
ThermochemicalCost of converting woody feedstocks to ethanol: $0.86/gal by 2012Cost of converting woody feedstock to hydrocarbon fuels: $1.50/gal gasoline equivalent by 2017
IntegratedBiorefineries
Infrastructure
Research & Development Demonstration & Deployment
Sustainability & Analysis • GHG emissions
• Water quality• Land use• Socioeconomics
Sustainable regional biomass resources: 130 million dry tons/yr by 2012Improved logistics systems: $50/dry ton herbaceous by 2012
Validate integrated process technologies
4 commercial scale 8 demonstration scaleUp to 20 pilot or demonstration scale
• Predictive Modeling• International
Increase understanding of and impacts on:
Make biofuels cost competitive with petroleum based on a modeled cost for mature technology at the refinery gateForecast to be 1.76/gal ethanol equivalent by 2012 and $2.62/gal gasoline equivalent by 2017
Help create an environment conducive to maximizing production and use of biofuels, 21 billion gallons of advanced biofuels per year by 2022 (EISA) (14 billion gge)
Testing of E15 & E20 and develop biofuels distribution infrastructure
Feedstock Systems

R E
F I
N I
N G
Exploring Routes to Convert Biomass
Integrated Biorefineries
Research on multiple conversion pathways aims to improve the efficiency and economics of biofuels production.
FeedstockProduction& Logistics• Energy
crops• Forest
Residue• Agricultural
wastes• Algae
EthanolButanolOlefinsGasolineDieselOthers
DDGS
Lignin(for power)
Thermochemical Conversion
FastPyrolysis
Gasification Syngas Fischer TropschAlcohol Synthesis
LiquidBio-oil
Zeolite CrackingHydrogenolysis
Upgrading
Enzymatic Hydrolysis
Pretreatment & Conditioning
Enzyme Production
Sugars Fermentation
DistillationBiochemical Conversion
By-ProductsWastes/Residue
Lipid (Oil) Extraction
Algal Oil
Transesterification Fractionation
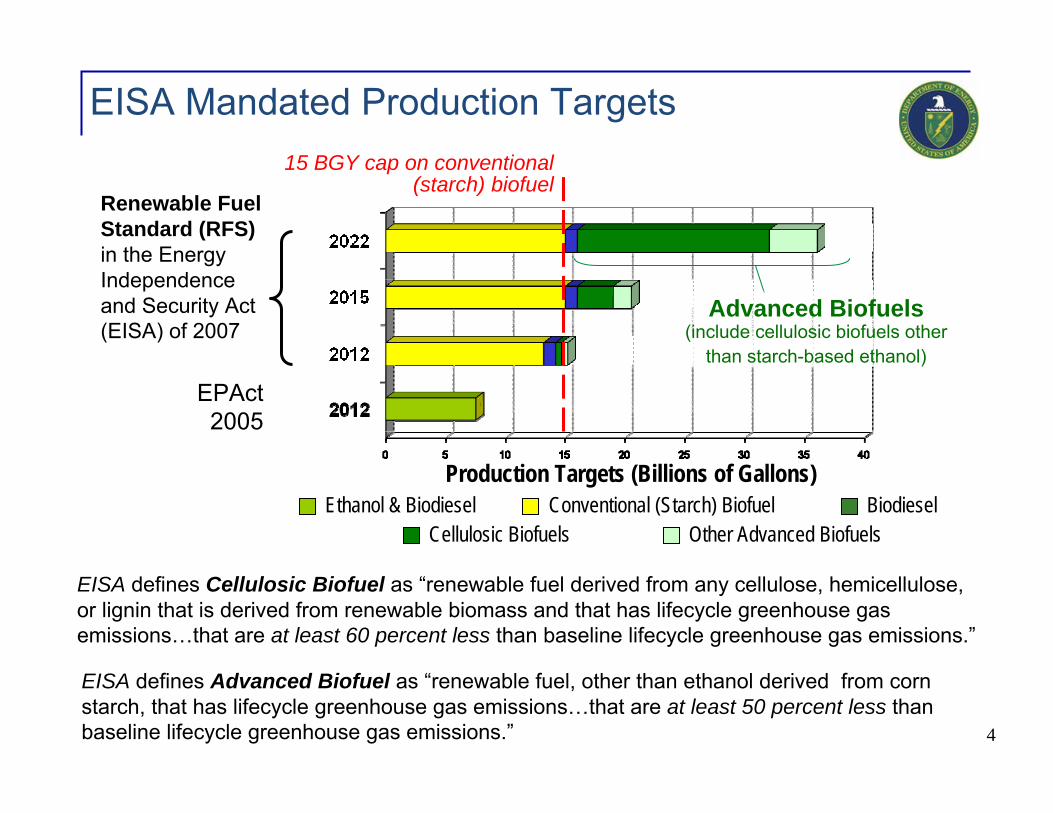
Biochemical Conversion/Enzymatic HydrolysisCost of ethanol production, $/gallon
$0.00
$0.50
$1.00
$1.50
$2.00
2005 State ofTechnology
2007 State ofTechnology
2009 Projection 2012ProjectionM
inim
um C
onve
rsio
n Pr
oces
sing
Cos
t of
Etha
nol P
rodu
ctio
n, $
/gal
lon
Etha
nol
(200
7$)
Prehydrolysis/treatmentEnzymes
Saccharification &Fermentation Distillation & SolidsRecoveryBalance of Plant
2009 2012
Minimum Ethanol Selling Price ($/gge) $3.58 $2.22
Feedstock Contribution ($/gge) $1.12 $0.86Conversion Contribution ($/gge) $2.42 $1.37Yield (Gallon/dry ton) 78% 90%Technical ProjectionsFeedstockFeedstock Cost ($/dry ton) $57.50 $50.90PretreatmentSolids Loading (wt%) 30% 30%Xylan to Xylose 80% 90%Xylan to Degradation Products 8% 5%
Ammonia Loading (mL of 30wt% per L hydrolyzate) 50 25%Hydrolyzate solid-liquid separation yes noXylose Sugar Loss 2% 1%Glucose Sugar Loss 1% 0%EnzymesEnzyme Contribution ($/gal EtOH) $0.52 $0.18Saccharification & FermentationToal Solids Loading (wt%) 20% 20%Combined Saccharificat ion & Fermentation Time (d) 7 3Corn Steep Liquor Loading (wt%) 1% 25%Overall Cellulose to Ethanol 85% 85%Xylose to Ethanol 80% 85%Minor Sugars to Ethanol 40% 85%
Conditioning
2005Status
2007 Status
2009Projection
2012Projection
Pretreatment
ResidueProcessing
ProductRecovery
Conditioning
EnzymeProduction
Co-fermentationOf C5 & C6
Sugars
EnzymaticHydrolysis
Ethanol
By-Products
Hybrid Saccharification & Fermentation - HSF
FeedProcessing& Handling
Reduction of sugar loss 13% (2005) to 1% (2012)
Xylan to Xylose76% (2005) to 85% (2012)
Minor sugars fermented (40%)
2009 2012
* Conversion costs represented in the figure above are based on conversion of corn stover and equate to an Minimum Ethanol Selling Price $1.49 in 2012.

Thermochemical Conversion/GasificationCost of ethanol production, $/gallon
* Conversion costs represented in the figure above are based on conversion of woody feedstocks and equate to an Minimum Ethanol Selling Price $1.59 in 2012.
2009 2012
Minimum Ethanol Selling Price ($/gge) $3.42 $2.38
Conversion Contribution ($/gge) $1.98 $1.30
Ethanol Yield (gal EtOH/dry ton) 61.5 71.1Mixed Alcohol Yield 72.5 83.7Technical ProjectionsFeedstockFeedstock Cost ($/dry ton) $58.20 $50.70GasificationRaw Syngas Yield (lb/lb dry feed) 0.82 0.82Raw Syngas Methane (dry basis) 15% 15%Gasifier Efficiency (LHV) 76.1% 76.1%
Tar Reformer (TR) Exit CH4 (dry basis) (mole %) 3% 1%TR Light CH4 Conversion (%) 50% 80%TR Benzene Conversion (%) 90% 99%TR Heavy HC/Tar Conversion (%) 97% 99%Sulfur Level in Clean Gas (as H2S) (ppmv) 50 50Fuels SynthesisPressure (psia) 1500 1500Single Pass CO Conversion (%CO) 40.0% 50%Overall CO Conversion (%CO) 40.0% 50%Selectivity to Alcohols (%C)) 80.0% 80.0%
Synthesis Gas Clean-up & Conditioning
FeedProcessing& Handling
Heat &
Power
Gasification
Indirect
Gas Cleanup
High TempSeparation
Gas Conditioning
Collection/Fractionation
Fuel Synthesis
Upgrading
Benzene Conversion 70% (2005) to 99%
(2012)
CO Conversion 40% (2005) to 50% (2012)
Products
$(0.50)
$-
$0.50
$1.00
$1.50
$2.00
2005 State ofTechnology
2007 State ofTechnology
2009 Projection 2012 Projection
Min
imum
Con
vers
ion
Proc
essi
ng C
ost o
f Et
hano
l , $/
gallo
n et
hano
l (20
07$s
)
Feed Handling andDryingGasification
SynGas Cleanup &ConditioningFuels Synthesis
Product Recoveryand PurificationBalance of Plant
2009 2012
2005Status
2007 Status
2009Projection
2012Projection
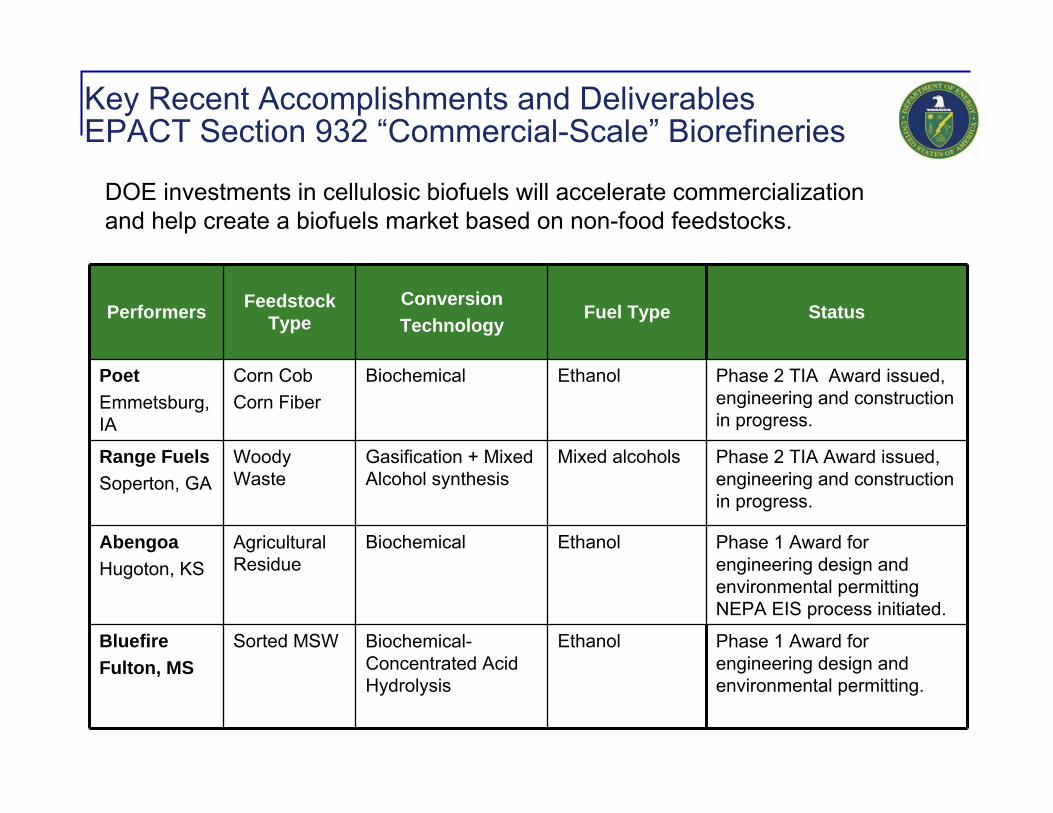
Key Recent Accomplishments and DeliverablesEPACT Section 932 “Commercial-Scale” Biorefineries
Performers Feedstock Type
Conversion Technology
Fuel Type Status
PoetEmmetsburg, IA
Corn CobCorn Fiber
Biochemical Ethanol Phase 2 TIA Award issued, engineering and construction in progress.
Range FuelsSoperton, GA
Woody Waste
Gasification + Mixed Alcohol synthesis
Mixed alcohols Phase 2 TIA Award issued, engineering and construction in progress.
Abengoa Hugoton, KS
Agricultural Residue
Biochemical Ethanol Phase 1 Award for engineering design and environmental permitting NEPA EIS process initiated.
BluefireFulton, MS
Sorted MSW Biochemical-Concentrated Acid Hydrolysis
Ethanol Phase 1 Award for engineering design and environmental permitting.
DOE investments in cellulosic biofuels will accelerate commercializationand help create a biofuels market based on non-food feedstocks.

Key Recent Accomplishments and DeliverablesDemonstration-Scale Biorefineries
Performers Feedstock TypeConversion Technology
Fuel Type
Alltech-EnvirofineWashington County, KY
Corn Cobs, Corn Fiber
Biochemical-Solid State Fermentation
Ethanol
Lignol InnovationsGrand Junction, CO
Woody Biomass Biochemical-Organisolve Ethanol
Mascoma Upper Peninsula, MI
Woody Biomass Biochemical Ethanol
NewPageWisconsin Rapids, WI
Woody Biomass -Mill Residue
Thermochemical-Fischer-Tropsch
Fischer-Tropsch liquids
Pacific EthanolBoardman, OR
Wheat Straw, Stover, Poplar Residuals
Biochemical-Biogasol Ethanol
RSAOld Town, ME
Woody Biomass -Mill residues
Biochemical-Pentose Extraction
To be determined
Verenium Biofuels Corp.Jennings, LA
Energy Cane and Bagasse
Biochemical Process Ethanol
Flambeau River Biofuels LLCPark Falls, WI
Forest residues and wood waste
Thermochem to Fischer-Tropsch
Fischer-Tropsch liquids
13
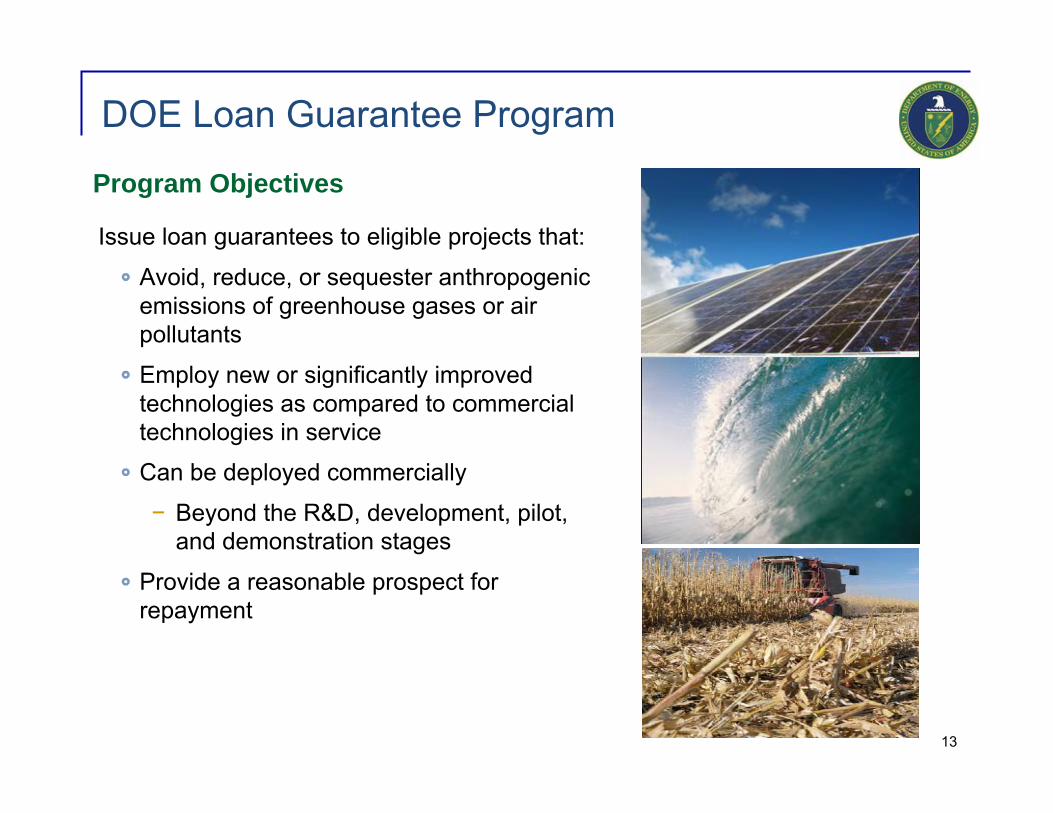
DOE Loan Guarantee Program
Issue loan guarantees to eligible projects that:
Avoid, reduce, or sequester anthropogenic emissions of greenhouse gases or air pollutants
Employ new or significantly improved technologies as compared to commercial technologies in service
Can be deployed commercially
− Beyond the R&D, development, pilot, and demonstration stages
Provide a reasonable prospect for repayment
Program Objectives

Biomass Program Budgets, FY05-10
$0
$50
$100
$150
$200
$250
FY2010FY09FY08FY07FY06FY05
Integration of Biorefinery TechnologiesProducts DevelopmentBiochemical Platform R&DThermochemical Platform R&DFeedstock Infrastructure
$0
$100
$200
$300
$400
$500
$600
$700
$800
ARRAFY10
Mill
ions

Recovery Act Funding and InitiativesBiomass R&D and Demonstration Projects - $800 Million in Funding
$480M Pilot and Demonstration-Scale BiorefineriesValidate technologies for integrated production of advancedbiofuels, products, and power to enable financing and replication.10 to 20 awards for refineries to be operational within 3 years:
Up to $25M for each pilot-scale projectUp to $50M for each demonstration-scale project
$176.5M Commercial-Scale BiorefineriesIncrease in funding for prior awards; two or more projectsExpedite construction; accelerate commissioning and start-up
$110M Fundamental Research$20M: Integrated Process Development Unit$5M: Sustainability research with the Office of Science$35M: Advanced Biofuels Technology Consortium $50M: Algal Biofuels Consortium to accelerate demonstration
$20M Ethanol Infrastructure ResearchOptimize flex-fuel vehicles operating on E85Evaluate impacts of intermediate blends on conventional vehiclesUpgrade existing infrastructure for compatibility with E85
$13.5M NREL Integrated Biorefinery Research Facility: expand the pretreatment capacity

DOE Biofuels Sustainability Research Priorities
Biomass R&D Board Interagency Sustainability Working Group -Engaged in U.S. Government partnership to identify biofuels sustainability indicators
Indirect Land Use - Developing models to help study international land use impact of domestic biofuels production and mandates
Climate Change - Conduct life cycle analysis (LCA) of biofuels production and use through a wide range of existing and future production pathways
Water - Conducting LCA of water demand for biofuel production (compares corn ethanol, sugarcane ethanol, and competing petroleum fuels)
Biodiversity – Study impact of biofuels industry growth on biodiversity and sensitive ecosystems
GIS Tools - Developing GIS tools to analyze currentand future U.S. feedstocks, infrastructure availability,and economic and environmental sustainability
Addressing sustainability challenges is critical to industry growth.
Office of Biomass Program, Valri Lightner
Web Site: http://www1.eere.energy.gov/biomass/
EERE Info Center - www1.eere.energy.gov/informationcenter
Alternative Fuels Data Center -http://www.eere.energy.gov/afdc/fuels/ethanol.html
Bioenergy Feedstock Information Network - http://bioenergy.ornl.gov/
Biomass R&D Initiative – www.biomass.govtools.us
Grant Solicitations - www.grants.gov
Office of Science - http://www.er.doe.gov/
Loan Guarantee Program Office - http://www.lgprogram.energy.gov
Information Resources
Top Related