


Languages
Pages
Legal

WeeklysSM Options on Leveraged and Inverse Exchange Traded Products May 21, 2014 Presented by Russell Rhoads, CFA
Interactive Brokers Webcast
THE OPTIONS INSTITUTE at CBOE 2
Disclosure
Options involve risks and are not suitable for all investors. Prior to buying or selling an option, an investor must receive a copy of Characteristics and Risks of Standardized Options. Copies are available from your broker, by calling 1-888-OPTIONS, or from The Options Clearing Corporation at www.theocc.com. The information in this presentation is provided solely for general education and information purposes. No statement within this presentation should be construed as a recommendation to buy or sell a security or to provide investment advice. Any strategies discussed, including examples using actual securities price data, are strictly for illustrative and educational purposes only. In order to simplify the computations, commissions, fees, margin interest and taxes have not been included in the examples used in this presentation. These costs will impact the outcome of all transactions and must be considered prior to entering into any transactions. Multiple leg strategies involve multiple commission charges. Investors should consult with their tax advisors to determine how the profit and loss on any particular option strategy will be taxed. Past performance does not guarantee future results. Supporting documentation for any claims, comparisons, statistics or other technical data in this presentation is available from CBOE upon request. CBOE, Chicago Board Options Exchange and Execute Success are registered trademarks and The Options Institute and Weeklys are service marks of Chicago Board Options Exchange, Incorporated (CBOE). All other trademarks and service marks are the property of their respective owners. Direxion and Proshares financial products are not sponsored, endorsed, sold or promoted by CBOE and CBOE makes no representation regarding the advisability of investing in such products. An investor should consider the investment objectives, risks, charges, and expenses of these products carefully before investing. This and other information about these products, including prospectuses, can be found at www.direxionfunds.com and http://www.proshares.com. CBOE is not affiliated with Interactive Brokers, Direxion or Proshares. This presentation should not be construed as an endorsement or an indication by CBOE of the value of any non-CBOE product or service described in this presentation. Copyright © 2014 CBOE. All rights reserved.
THE OPTIONS INSTITUTE at CBOE 3
Weeklys Options – Leveraged and Inverse ETPs
Outline
Weeklys Options Leveraged ETPs Inverse ETPs Option Price Behavior
THE OPTIONS INSTITUTE at CBOE 4
Weeklys Options – Leveraged and Inverse ETPs
Overview
Weeklys options on individual stocks and exchange traded products were introduced in the summer of 2010 The number of equity securities that have short dated options available has increased to well over 350 names Serial options followed shortly afterward and a majority of stocks and exchange traded funds now have options expiring every week for five consecutive weeks There are a handful of leveraged and inverse ETPs with short dated options available for trading

THE OPTIONS INSTITUTE at CBOE 5
Weeklys Options– Leveraged and Inverse ETPs
Leveraged ETPs
As of 5/8/2014 – AGQ ProShares® Ultra Silver (2x) FAS Direxion® Daily Financial Bull 3X Shares NUGT Direxion Daily Gold Miners Bull 3x Shares SSO ProShares Ultra S&P 500® (2x) TNA Direxion Daily Small Cap Bull 3x Shares UVXY Proshares Ultra VIX® Short-Term Futures ETF (2x)
These funds are designed to match the daily performance of a strategy or specific index.

THE OPTIONS INSTITUTE at CBOE 6
Weeklys Options – Leveraged and Inverse ETPs
Leveraged Performance
2013 –
Ticker ETP
Performance Index
Performance Adjusted
Index AGQ -64.26% -34.89% -69.78% FAS 125.90% 32.22% 96.67%
NUGT -95.00% -54.42% -163.26% SSO 69.94% 29.60% 59.20% TNA 146.50% 37.00% 111.01%
UVXY -91.97% -65.75% -131.49%
Source: Bloomberg

THE OPTIONS INSTITUTE at CBOE 7
Weeklys Options – Leveraged and Inverse ETPs
Leveraged Performance
First Four Months 2014 –
Ticker ETP
Performance Index
Performance Adjusted
Index AGQ -4.90% -1.13% -2.26% FAS -0.66% 0.10% 0.29%
NUGT 32.76% 14.02% 42.05% SSO 3.95% 1.93% 3.85% TNA -11.08% -3.16% -9.48%
UVXY -19.70% -5.35% -10.71%
Source: Bloomberg

THE OPTIONS INSTITUTE at CBOE 8
Weeklys Options – Leveraged and Inverse ETPs
Relative Weekly Performance
AGQ vs. Index – Jan 2009 – April 2014
AGQ Index Maximum 27.67% 15.00% Minimum -48.03% -29.77% Absolute Average 7.02% 3.65%
Source: Bloomberg

THE OPTIONS INSTITUTE at CBOE 9
Weeklys Options – Leveraged and Inverse ETPs
Relative Weekly Performance
FAS vs. Index – Jan 2009 – April 2014
FAS Index Maximum 95.08% 28.35% Minimum -46.12% -17.16% Absolute Average 7.82% 2.62%
Source: Bloomberg

THE OPTIONS INSTITUTE at CBOE 10
Weeklys Options – Leveraged and Inverse ETPs
Relative Weekly Performance
NUGT vs. Index – Jan 2011 – April 2014
NUGT Index Maximum 37.11% 12.51% Minimum -34.03% -11.79% Absolute Average 9.65% 3.62%
Source: Bloomberg

THE OPTIONS INSTITUTE at CBOE 11
Weeklys Options – Leveraged and Inverse ETPs
Relative Weekly Performance
SSO vs. Index – Jan 2007 – April 2014
SSO Index Maximum 25.41% 12.03% Minimum -34.05% -18.20% Absolute Average 3.94% 1.97%
Source: Bloomberg

THE OPTIONS INSTITUTE at CBOE 12
Weeklys Options – Leveraged and Inverse ETPs
Relative Weekly Performance
TNA vs. Index – Jan 2008 – April 2014
TNA Index Maximum 35.87% 11.98% Minimum -29.60% -10.34% Absolute Average 7.33% 2.47%
Source: Bloomberg

THE OPTIONS INSTITUTE at CBOE 13
Weeklys Options – Leveraged and Inverse ETPs
Relative Weekly Performance
UVXY vs. Index – Jan 2012 – April 2014
UVXY Index Maximum 62.36% 30.25% Minimum -44.44% -28.28% Absolute Average 11.58% 6.15%
Source: Bloomberg

THE OPTIONS INSTITUTE at CBOE 14
Weeklys Options – Leveraged and Inverse ETPs
Inverse ETPs
As of 5/8/2014 – DUST Direxion Daily Gold Miners Bear 3x Shares FAZ Direxion Daily Financial Bear 3x Shares SCO ProShares UltraShort DJ-UBS Crude Oil (2x) SDS ProShares UltraShort S&P 500 (2x) SVXY ProShares Short VIX Short-Term Futures ETF (1x) TBT ProShares UltraShort 20+ Year Treasury (2x) TZA Direxion Daily Small Cap Bear 3x Shares
These funds are designed to match the inverse daily performance of a strategy or specific index.
THE OPTIONS INSTITUTE at CBOE 15
Weeklys Options – Leveraged and Inverse ETPs
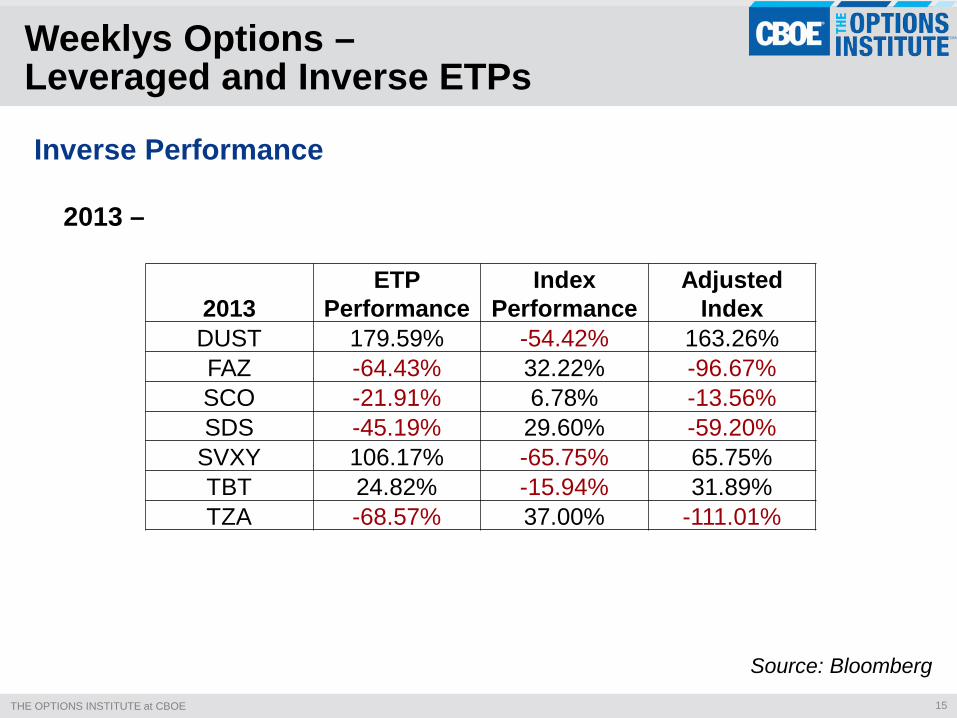
Inverse Performance
2013 –
2013 ETP
Performance Index
Performance Adjusted
Index DUST 179.59% -54.42% 163.26% FAZ -64.43% 32.22% -96.67% SCO -21.91% 6.78% -13.56% SDS -45.19% 29.60% -59.20%
SVXY 106.17% -65.75% 65.75% TBT 24.82% -15.94% 31.89% TZA -68.57% 37.00% -111.01%
Source: Bloomberg
THE OPTIONS INSTITUTE at CBOE 16
Weeklys Options – Leveraged and Inverse ETPs
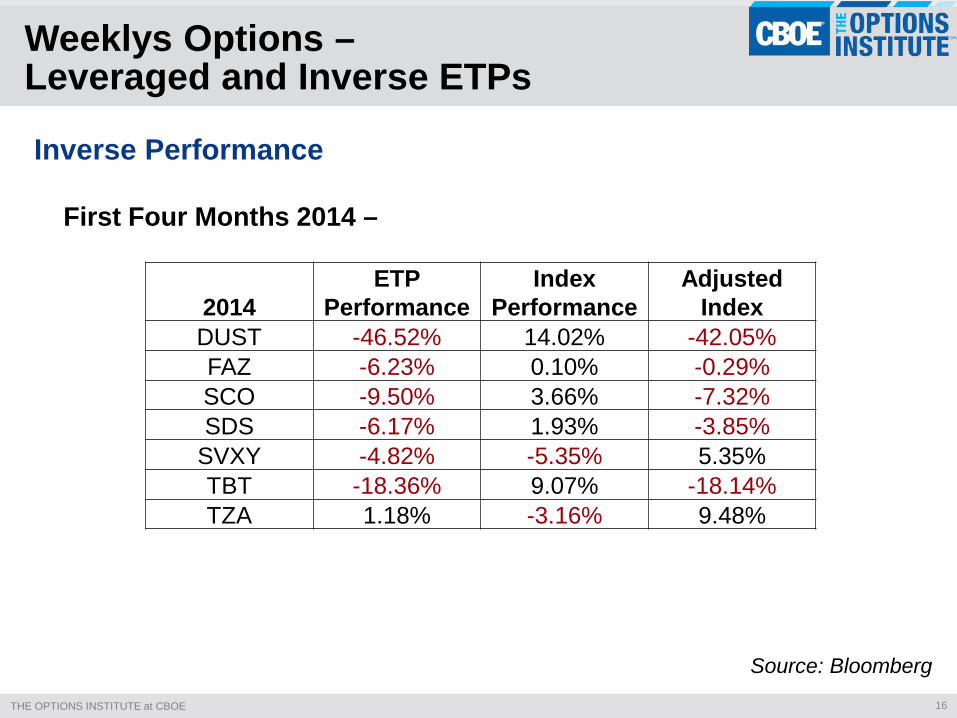
Inverse Performance
First Four Months 2014 –
2014 ETP
Performance Index
Performance Adjusted
Index DUST -46.52% 14.02% -42.05% FAZ -6.23% 0.10% -0.29% SCO -9.50% 3.66% -7.32% SDS -6.17% 1.93% -3.85%
SVXY -4.82% -5.35% 5.35% TBT -18.36% 9.07% -18.14% TZA 1.18% -3.16% 9.48%
Source: Bloomberg

THE OPTIONS INSTITUTE at CBOE 17
Weeklys Options – Leveraged and Inverse ETPs
Relative Weekly Performance
DUST vs. Index – Jan 2011 – April 2014
DUST Index Maximum 40.95% 12.51% Minimum -33.81% -11.79% Absolute Average 10.09% 3.62%
Source: Bloomberg
THE OPTIONS INSTITUTE at CBOE 18
Weeklys Options – Leveraged and Inverse ETPs
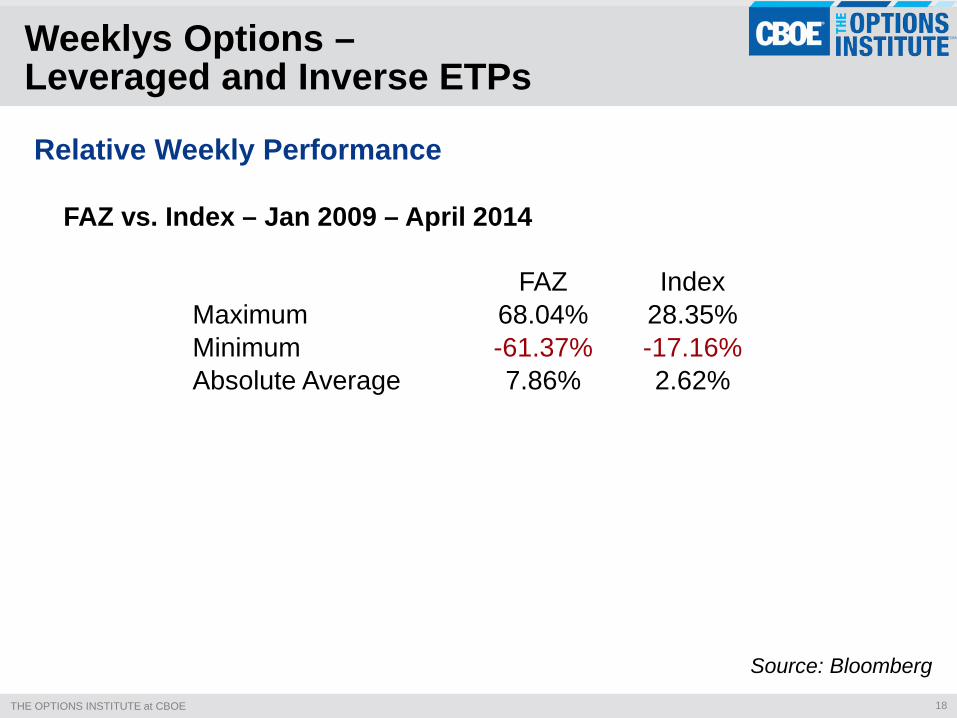
Relative Weekly Performance
FAZ vs. Index – Jan 2009 – April 2014
FAZ Index Maximum 68.04% 28.35% Minimum -61.37% -17.16% Absolute Average 7.86% 2.62%
Source: Bloomberg
THE OPTIONS INSTITUTE at CBOE 19
Weeklys Options – Leveraged and Inverse ETPs
Relative Weekly Performance
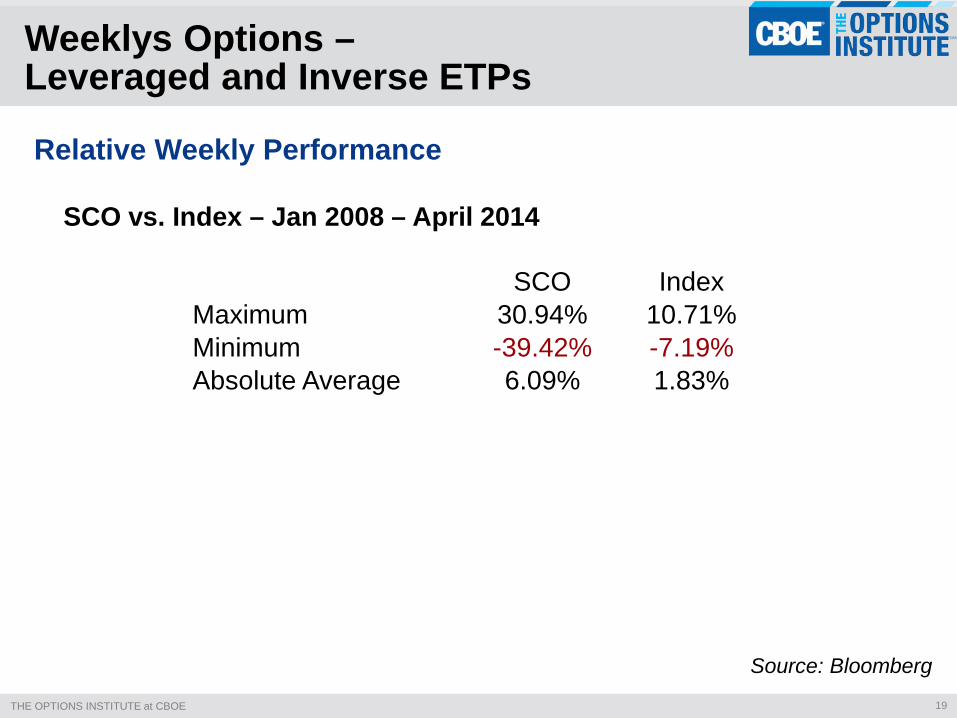
SCO vs. Index – Jan 2008 – April 2014
SCO Index Maximum 30.94% 10.71% Minimum -39.42% -7.19% Absolute Average 6.09% 1.83%
Source: Bloomberg

THE OPTIONS INSTITUTE at CBOE 20
Weeklys Options – Leveraged and Inverse ETPs
Relative Weekly Performance
SDS vs. Index – Jan 2007 – April 2014
SDS Index Maximum 43.79% 12.03% Minimum -22.08% -18.20% Absolute Average 3.92% 1.97%
Source: Bloomberg
THE OPTIONS INSTITUTE at CBOE 21
Weeklys Options – Leveraged and Inverse ETPs
Relative Weekly Performance
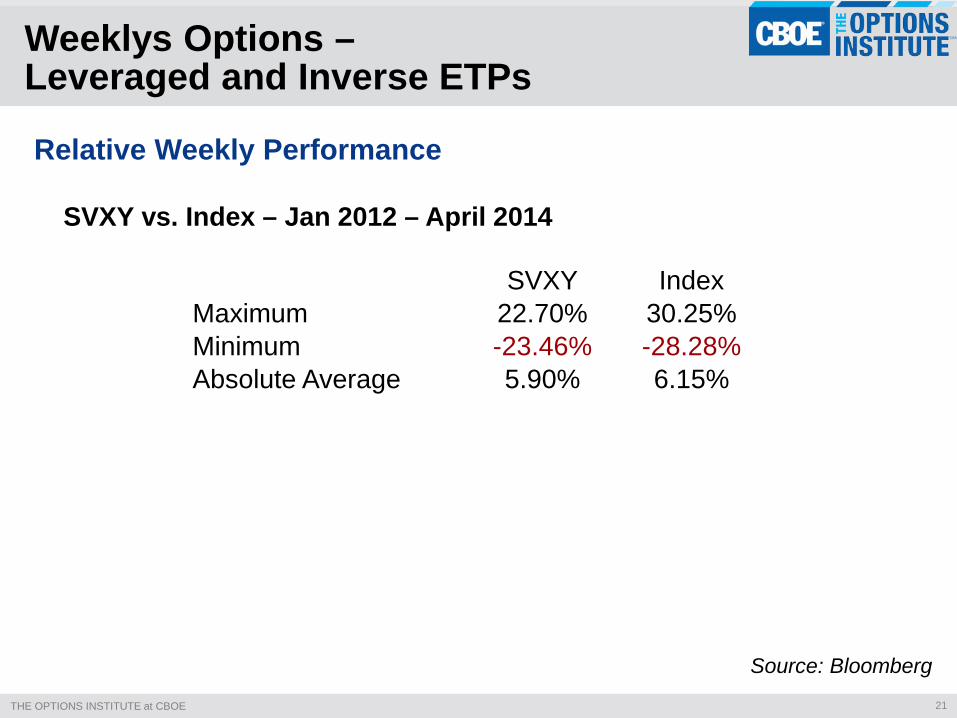
SVXY vs. Index – Jan 2012 – April 2014
SVXY Index Maximum 22.70% 30.25% Minimum -23.46% -28.28% Absolute Average 5.90% 6.15%
Source: Bloomberg
THE OPTIONS INSTITUTE at CBOE 22
Weeklys Options – Leveraged and Inverse ETPs
Relative Weekly Performance
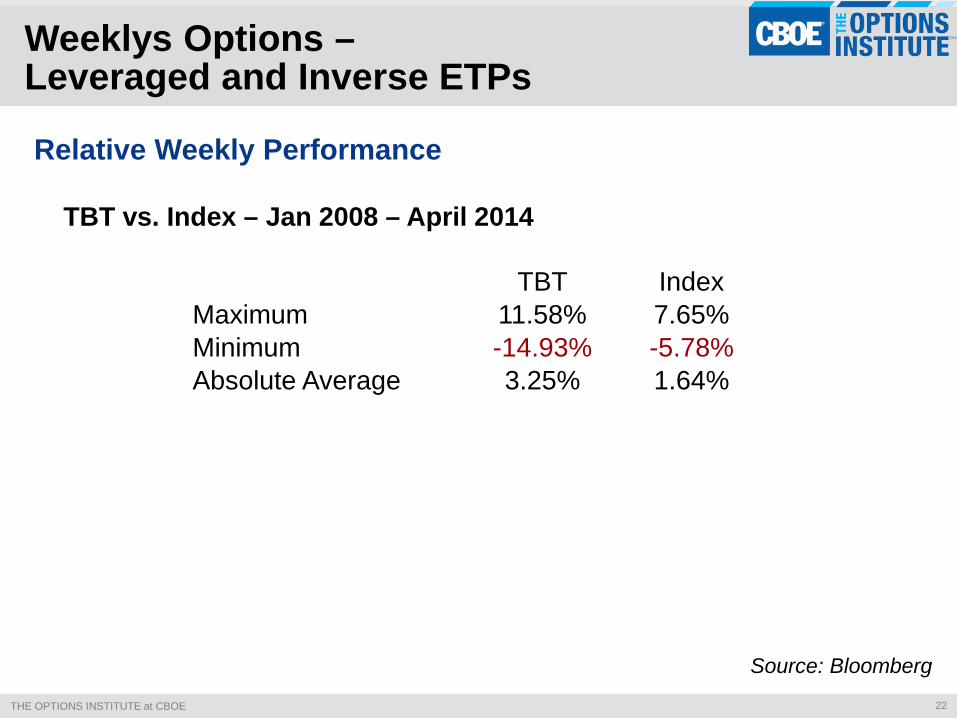
TBT vs. Index – Jan 2008 – April 2014
TBT Index Maximum 11.58% 7.65% Minimum -14.93% -5.78% Absolute Average 3.25% 1.64%
Source: Bloomberg

THE OPTIONS INSTITUTE at CBOE 23
Weeklys Options – Leveraged and Inverse ETPs
Relative Weekly Performance
TZA vs. Index – Jan 2008 – April 2014
TZA Index Maximum 35.49% 11.98% Minimum -33.15% -10.34% Absolute Average 7.35% 2.47%
Source: Bloomberg
THE OPTIONS INSTITUTE at CBOE 24
Weeklys Options – Leveraged and Inverse ETPs
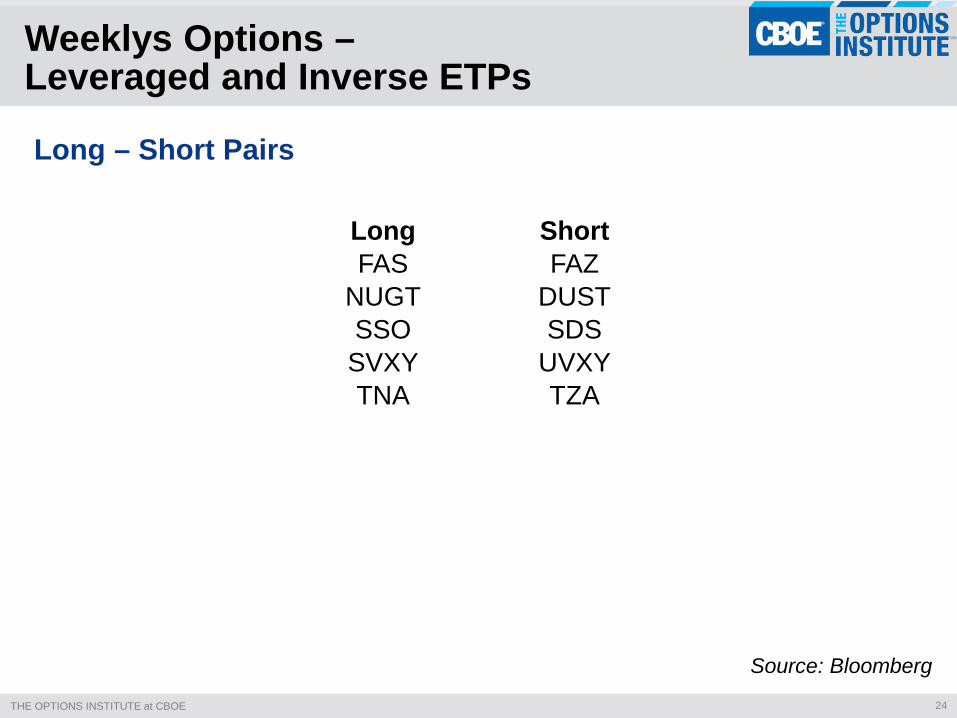
Long – Short Pairs
Long Short FAS FAZ
NUGT DUST SSO SDS SVXY UVXY TNA TZA
Source: Bloomberg
THE OPTIONS INSTITUTE at CBOE 25
Weeklys Options – Leveraged and Inverse ETPs
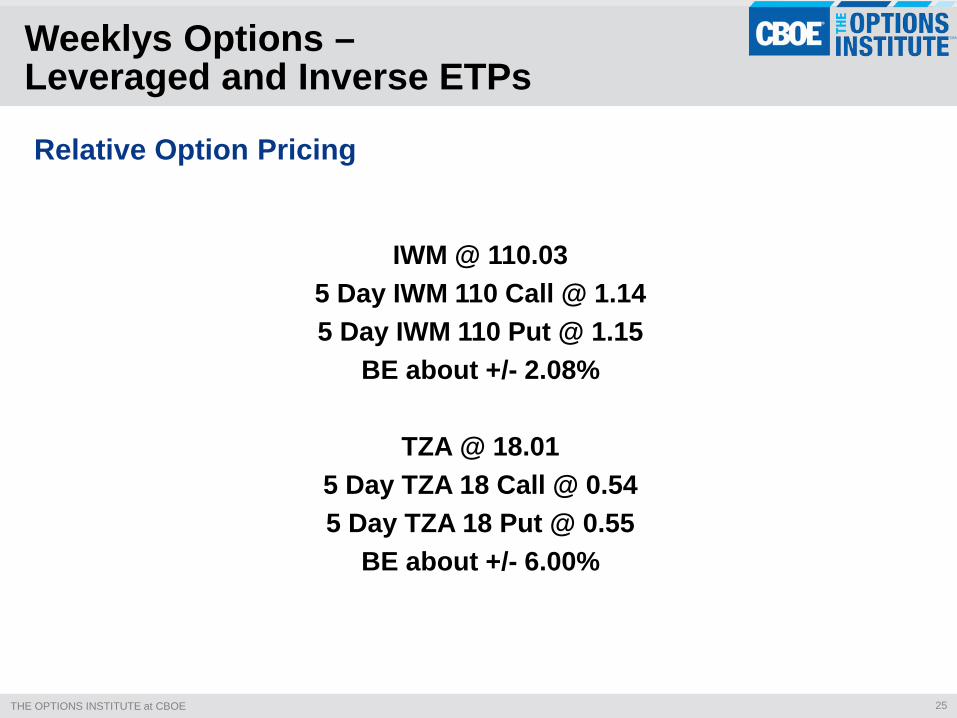
Relative Option Pricing
IWM @ 110.03
5 Day IWM 110 Call @ 1.14 5 Day IWM 110 Put @ 1.15
BE about +/- 2.08%
TZA @ 18.01 5 Day TZA 18 Call @ 0.54 5 Day TZA 18 Put @ 0.55
BE about +/- 6.00%

THE OPTIONS INSTITUTE at CBOE 26
Weeklys Options – Leveraged and Inverse ETPs
Relative Option Pricing
TLT @ 112.08
7 Day TLT 112 Call @ 0.76 7 Day TLT 112 Put @ 0.80
BE about +/- 1.39%
TBT @ 63.13 7 Day TBT 63 Call @ 0.86 7 Day TBT 63 Put @ 0.77
BE about +/- 2.58%

THE OPTIONS INSTITUTE at CBOE 27
Weeklys Options – Leveraged and Inverse ETPs
Resources
Issuer Websites –
Direxion – www.direxionfunds.com ProShares – www.proshares.com
Options Disclosure Document –
http://www.cboe.com/resources/intro.aspx

THE OPTIONS INSTITUTE at CBOE 28
Weeklys Options – Leveraged and Inverse ETPs
Links / Contact
New Weeklys List Wednesdays Mid-Day
www.cboe.com/weeklys
Next Week in Weeklys Blog Friday / Saturday Each Week www.cboeoptionshub.com
Contact Info
Twitter - @russellrhoads [email protected]
Top Related