


Languages
Pages
Legal


Information Visualization
Fall 2009
Jinwook Seo
SNU CSE
Interaction

Readings
� J.S. Yi, Y.A. Kang, J.T. Stasko and J.A. Jacko, "Toward a Deeper Understanding of the Role of Interaction in Information Visualization", IEEE Transactions on Visualization and Computer Graphics, Vol. 13, No. 6, Nov/Dec 2007, pp. 1224-1231.
� Chapter 10, Interacting with Visualizations, Information Visualization: Perception for Design, 2nd ed. Colin Ware, Morgan Kaufmann, 2004, ISBN 1-55860-819-2.
� B. Shneiderman, "Dynamic Queries for Visual Information Seeking", IEEE Software, Vol. 11, No. 6, pp. 70-77, 1994.

Definitions
� The communication between user and the
system - Dix et al., 1998
� Direct manipulation and instantaneous change
- Becker et al., 1987
“HCI research is far from having solid (and
falsifiable) theories of interaction”
- Beaudouin-Lafon, 2004
John Stasko

Two Pillars of InfoVis
� Representation & Interaction
� Representation gets all the attention
� very challenging to come up with innovative, new
visual representations
� Interaction is where the action is
�we can do interesting work with how user
interacts with the view or views
�what distinguishes InfoVis from static visual
representations on paper
Jinwook Seo/John Stasko

� Different feedback time scales� Shall I wait for that task to finish or go for coffee?
� Different feedback techniques� Short transaction: hour glass cursor
� Longer transaction: estimate of time left
� An overestimate is always better!
Being Interactive
> 10s User will switch to another task while waiting
10s Difficult to stay focused, cognitive response
1s Delay but user’s flow of thought is uninterrupted, conversation break
.1s Causality, visual continuity, animation, sliders
cancel
Contacting host (10-60 seconds)
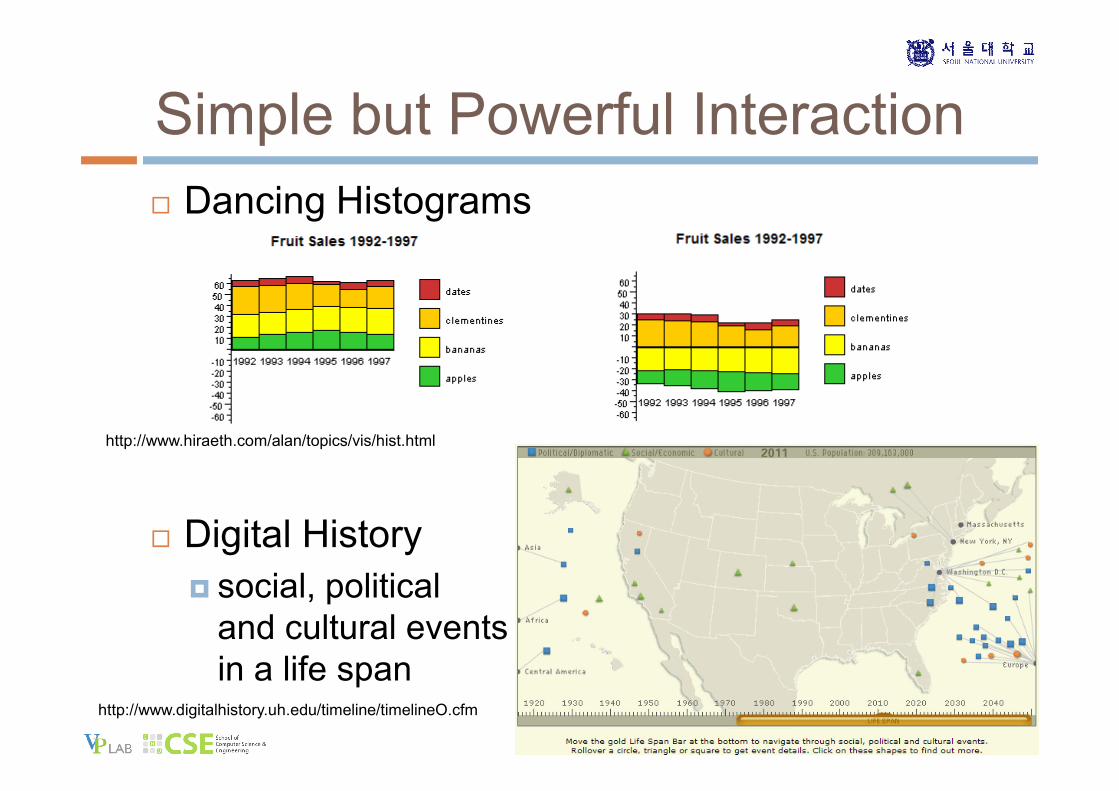
Simple but Powerful Interaction
� Dancing Histograms
� Digital History
� social, political
and cultural events
in a life span
http://www.hiraeth.com/alan/topics/vis/hist.html
http://www.digitalhistory.uh.edu/timeline/timelineO.cfm

Types of Interaction� Dix and Ellis (AVI ’98) propose
�Highlighting and focus
� Accessing extra info – drill down and hyperlinks
�Overview and context – zooming and fisheyes
� Same representation, changing parameters
� Same data, changing representation
� Linking representations – temporal fusion� successive images, moving images, simultaneous change
3444
33
811
639
89
7
209
111
223
10
531
1200
220
UK
Channel Islands
Midlands
North England
Cumbria
Isle of Man
North West
Northumbria
Yorkshire & Humberside
Northern Ireland
Scotland
South England
Wales
hotels region
tourist board areas
A. Dix and G. Ellis, "Starting Simple - adding value to static visualisation through
simple interaction." Proc. of AVI '98, May 1998, pp. 124-134.

Types of Interaction
� Keim’s taxonomy (TVCG ’02) includes
� Projection
� Filtering
� Zooming
�Distortion
� Linking and brushing
John Stasko

Tasks by Shneiderman
� Overview � Gain an overview of the entire collection
� Zoom � Zoom in on items of interest
� Filter� Filter out uninteresting items
� Details-on-demand
� Select an item or group and get details when needed
� Relate� View relationships among items
� History� Keep a history of actions to support undo, replay, and progressive refinement
� Extract� Allow extraction of sub-collections and of the query parameters

Taxonomy
� Low-level
� system centric
� High-level
� user goal
� Bridge two levels?
� user intent
J.S. Yi, Y.A. Kang, J.T. Stasko and J.A. Jacko, "Toward a Deeper Understanding of
the Role of Interaction in Information Visualization", IEEE Transactions on
Visualization and Computer Graphics, Vol. 13, No. 6, Nov/Dec 2007, pp. 1224-1231.

Categories of Interaction
� Yi et al. (InfoVis 07) propose 7 categories
� Select
� Explore
�Reconfigure
� Encode
� Abstract/Elaborate
� Filter
�Connect
John Stasko

1. Select
“Mark something as interesting”
� Mark items of interest to keep track
� Seems to often work as a preceding action to
subsequent operations
� Selecting a placemark
in Google Map
� The spotlight feature
in TableLens
Table Lens
Dust & Magnet

Labeling of the Selected
� Each label for a data point should:
� Be readable
�Non-ambiguously relate to its graphical object
�Not hide other pertinent information
� Completeness (labeling of all objects) is desired but not always possible
http://graphs.gapminder.org/world/
Spotfire
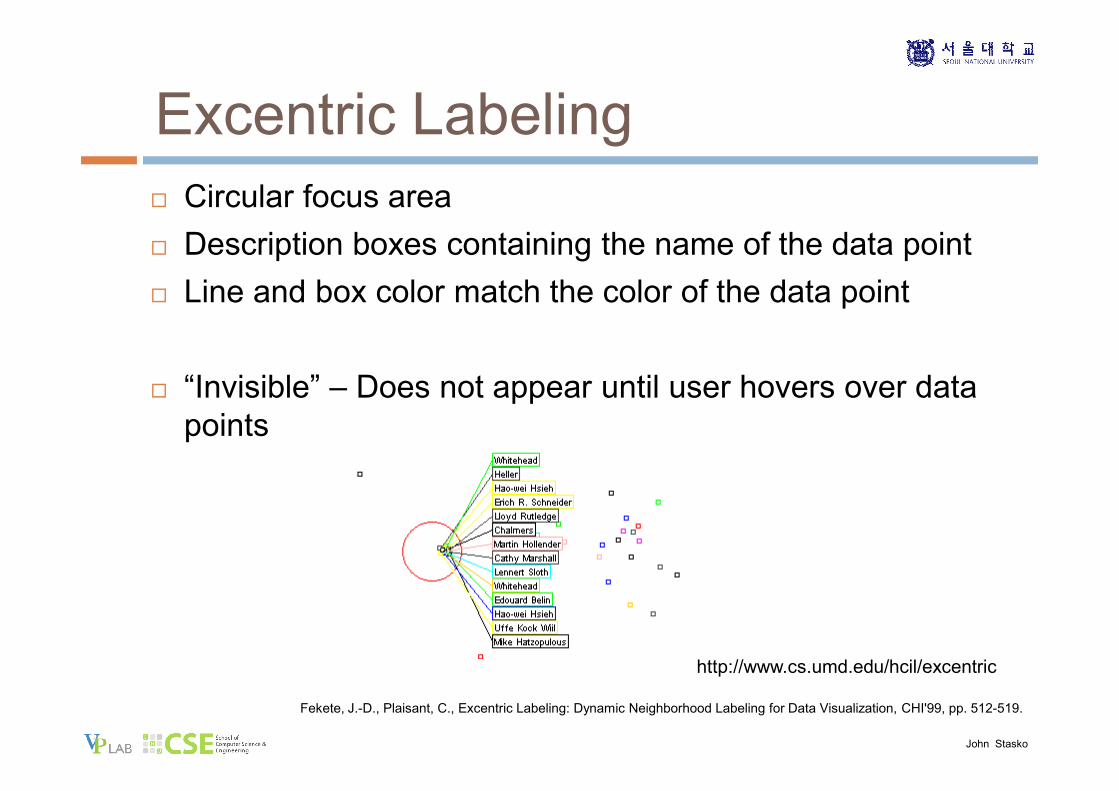
Excentric Labeling
� Circular focus area
� Description boxes containing the name of the data point
� Line and box color match the color of the data point
� “Invisible” – Does not appear until user hovers over data
points
http://www.cs.umd.edu/hcil/excentric
Fekete, J.-D., Plaisant, C., Excentric Labeling: Dynamic Neighborhood Labeling for Data Visualization, CHI'99, pp. 512-519.
John Stasko

2. Explore
“Show me something different”
� Examine a different subset of data
� Overcome the limitation of display size
� Following hyperlinks
on web pages
� Panning in Google Earth
� Direct Walking in
Visual Thesaurus
http://www.visualthesaurus.com/ John Stasko
3. Reconfigure
� “Show me a different arrangement”
� Provide different perspectives by changing the
spatial arrangement of representation
� Sorting and rearranging columns in TableLens
� Changing the attributes in a scatter plot
� The baseline adjustment feature in Stacked Histogram
John Stasko

4. Encode“Show me a different representation”
� Change visual appearances� Looking for new perspective
� Limited real estate may force change� semantic zooming
� Changing � color encoding
� size
� orientation
� font
� shape
Lam, H. and Baudisch, P.
Summary Thumbnails: Readable Overviews for Small Screen Web Browsers.
In Proceedings of CHI 2005, Portland, OR, Apr 2005, pp. 681-690.

5. Abstract/Elaborate
“Show me more or less detail”
� Adjust the level of abstraction (detail)
� overview and details
� Unfolding sub-categories in an interactive pie chart
� Drill-down in Treemap
� Details-on-demand in Sunburst
� The tool-tip operation in SeeIT
� Zooming (geometric zooming)
Jinwook Seo/John Stasko

Examples
SeeIT
Table Lens
Sunburst
Treemap

6. Filter
“Show me something conditionally”
� Change the set of data items being presented based on some specific conditions
� Focusing
� Narrowing/widening
� Dynamic query (range sliders) in HomeFinder and Spotfire
� Attribute Explorer & Influence Explorer
� Keystoke based filtering in NameVoyager
� QuerySketch
Jinwook Seo/John Stasko

7. Connect
“Show me related items”
� Highlight associations and relationships
� Show hidden data items that are relevant to a
specified item
� Highlighting directly connected
nodes in Vizster
� Brushing
� multiple view coordination (MVC)

Brushing
� Selecting or highlighting a case in one view
generates highlighting the case in the other
views
� Applies when you have multiple views of the
same data
� Very common technique in InfoVis
John Stasko

Example

Laws for Low-level Interaction - Ware
� Choice reaction time
� depends on number of choices
� Selection time: Fitts' Law
� depends on distance, target size
� Path tracing: continuous ongoing control
� speed depends on width ( v=W/c )
� Learning: power law of practice
� also subtask chunking
� Two-handed interaction: Guiard's theory
� coarse vs. fine control
� e.g. paper vs. pen positioning
Jinwook Seo/Tamara Munzner

Hick’s law� Time to choose one out of n actions : H=a + b log2(n+1)
� log rather than linear
• One menu of eight items vs. Two menus of four items
Fitts’ Law for position selection
� Describe an iterative process of eye-hand coordination
� MeanTime = C1 + C2log2(D/W + 0.5) (1)
� MeanTime = C1 + C2log2(D/W + 1.0) (2)
� Index of difficulty = log2(D/W + 1.0)
� Index of performance = 1/C2
� About 5-8 bits per second (many devices)
Colin Ware
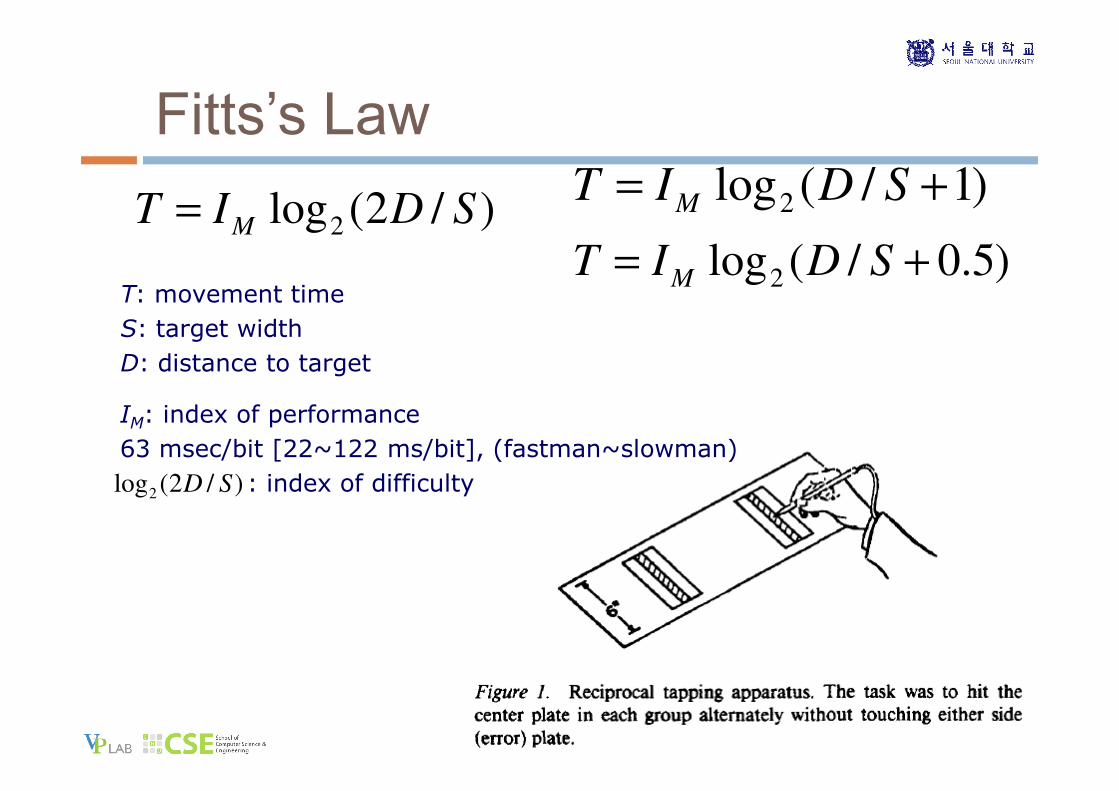
Fitts’s Law
)/2(log2 SDITM
=
T: movement time
S: target width
D: distance to target
IM: index of performance
63 msec/bit [22~122 ms/bit], (fastman~slowman)
: index of difficulty)/2(log2 SD
)1/(log2 += SDITM
)5.0/(log2 += SDITM

Closed Loop vs. Open Loop
� Closed Loop
� Feedback from perception through cognitive to
motor
� Examples?
� Open Loop
�Control is planned in advance and motor
executes without perception or cognitive
� Examples?

Closed Control Loop
Update displayMeasurehand position
Judge distanceto target
Effect handmovement
Yes
No
Human Processing
Machine Processing
Detect startsignal
InTarget?
On to next task
Colin Ware

Fitts’s Law
� Relies on “Closed Loop” control of Motor System
� Implications:� Larger (Closer) targets are easier to click
� Macintosh menu bar is faster to use (correction time)
� Pie menu is faster than popup menu
Images from Wikipedia

Power Law of Practice
� Time to perform a task is proportional to the log of the number of times the task has been carried out.
log(Tn) = log(T1) - αlog(n)
� The law is usually expressed in terms of blocks of trials since the time to perform a single trial is too variable.
Colin Ware

Learning (“Learning and memory” Anderson)
� Power law of learning
� Law of Diminishing Returns
Problem solving
Writing books
Manual skill
Two-handed Interaction
� Guiad’s kinematic chain theory (1987)
� left and right hands form a kinematic chain
� left providing a frame of reference for movements
with the right
� template on left hand, paint with right hand
� left hand to position tool palettes, right hand to do
drawing operations

Example
� Toolglass and Magic Lens
� interactive filter as transparent window
� left hand to move the window
� right hand to control cursor
K. Fishkin and M. Stone, "Enhanced dynamic queries via movable filters."
Proc. of CHI '95, pp. 415-420.
Toolglass and magic lenses: the see-through interface Eric A. Bier, Maureen
C. Stone, Ken Pier, William Buxton, and Tony D. DeRose, Proc.
SIGGRAPH'93, pp. 73-76.

Credits
� John Stasko, Georgia Tech
�www.cc.gatech.edu/~stasko/7450/
� Tamara Munzner, UBC
� people.cs.ubc.ca/~tmm/courses/533-09/
� Colin Ware, U of NH
� http://ccom.unh.edu/vislab/VisCourse/index.html
Top Related