


Languages
Pages
Legal

Intensive reading instruction for students with significant
reading disabilities: Relations with brain function
Louisiana DOEMay 25, 2012
Jack M. Fletcher, Ph.D.Department of PsychologyUniversity of Houston
The Texas Center for
Learning Disabilities
(TCLD) investigates
the classification, early
intervention, and
remediation of learning
disabilities.
Learning for SUCCESSwww.texasldcenter.org
What is intensive reading intervention?
After Tier 2 and in the context of enhanced Tier 1 instruction; often equated to special ed instruction
Increase time on task (intensive vs. extensive)
Make instruction more explicit (teacher models “thinking” and makes clear what student needs to learn)
Align and differentiate instruction
Decrease size of instructional group (for elementary students)
Vaughn, Wanzek, Murray, & Roberts: Center on Instruction
1. Implement strategies that address self-regulation and meta-cognitive awareness as part of academic intervention (corrective feedback, cues, incentives): make thinking explicit, model problem solving, text reading, and “remembering;” teach cuing, mnemonics, and breakdowns
Deal explicitly with attribution issues (I can’t read vs. what I can do to improve)
Teaching these skills in isolation is ineffective
Vaughn, Wanzek, Murray, & Roberts: Center on Instruction
2. Intensify instructional delivery
Make instruction more explicit (overtly teach)
Make instruction more systematic (break down complex skills into more discrete units)
Increase opportunities for student response and feedback

Vaughn, Wanzek, Murray, & Roberts: Center on Instruction
3. Increase instructional time: frequency of intervention, length of instructional sessions, number of sessions
We don’t know what is ideal for Tier 3, but let the data speak
4. Reduce group size
In elementary, groups >8 less effective than 3-5; little evidence showing 1:1 necessary (don’t know beyond grade 4)

Why do some students need intensive intervention?
Little evidence that inadequate responders have unique or special cognitive or learning characteristics
“Continuum of severity” unrelated to IQ
Children are not hardwired for inadequate responding or learning disabilities (bad gene, bad brain theory)
interaction model: genes make brains at risk and environment modifies level of risk)
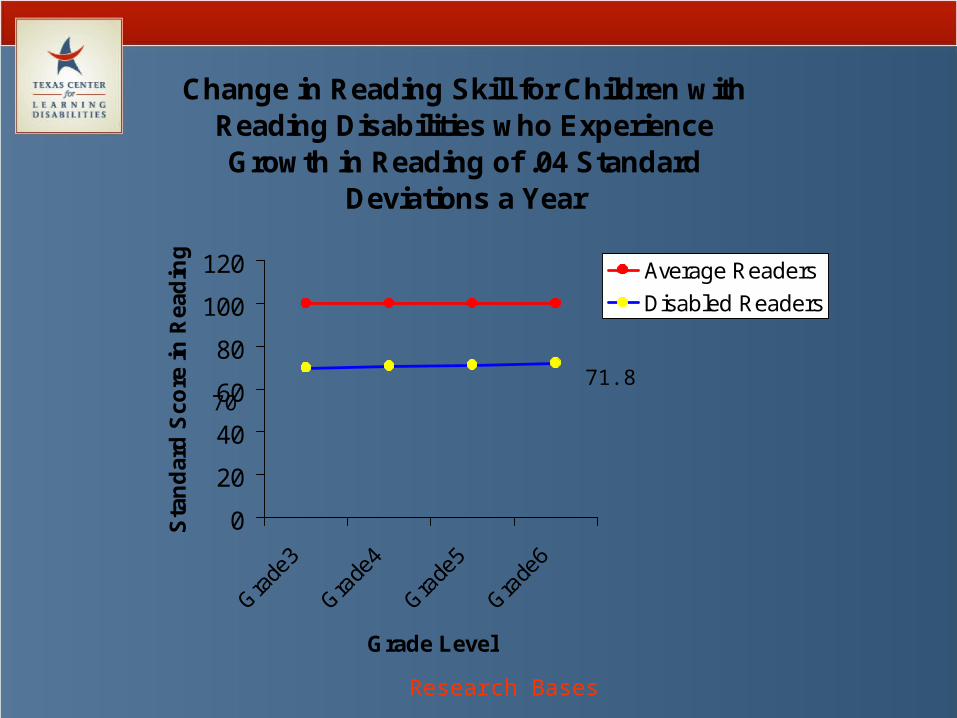
Change in Reading Skill for Children with Reading Disabilities who Experience Growth in Reading of .04 Standard
Deviations a Year
0
20
40
60
80
100
120
Gra
de3
Gra
de4
Gra
de5
Gra
de6
Grade Level
Sta
nd
ard
Sco
re i
n R
ead
ing
Average Readers
Disabled Readers
70 71.8
Research Bases
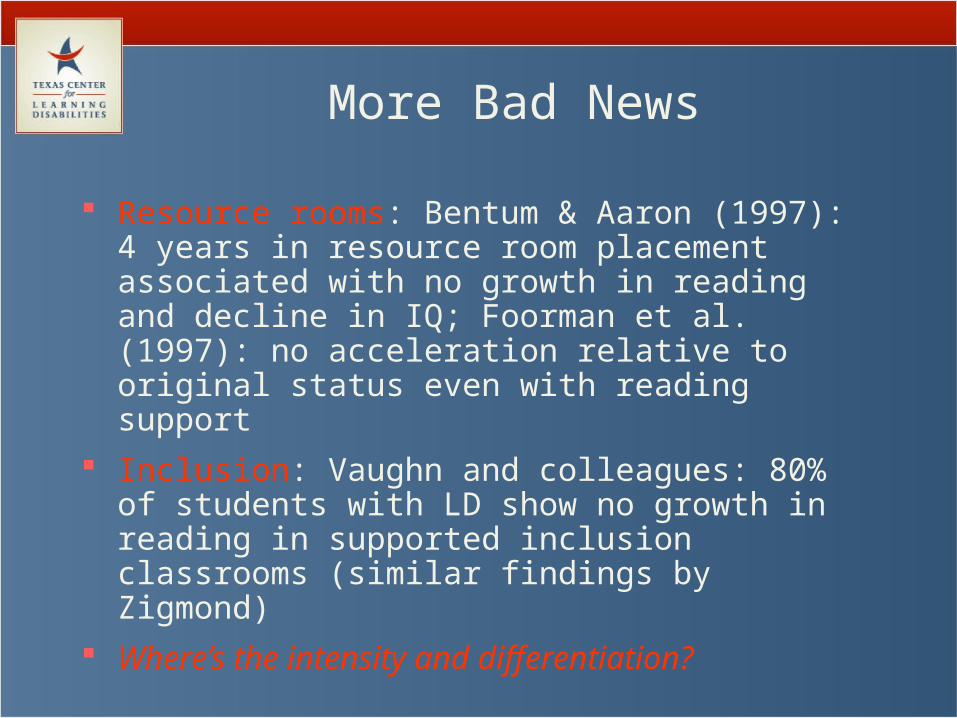
More Bad News
Resource rooms: Bentum & Aaron (1997): 4 years in resource room placement associated with no growth in reading and decline in IQ; Foorman et al. (1997): no acceleration relative to original status even with reading support
Inclusion: Vaughn and colleagues: 80% of students with LD show no growth in reading in supported inclusion classrooms (similar findings by Zigmond)
Where’s the intensity and differentiation?

Interval in Months Between Measurements
P-Pretest Pre Post 1 year 2 year
75
80
85
90
95
LPSPEP
Sta
nd
ard
S
core
Growth in Total Reading Skill Before, During, and Following Intensive Intervention (Torgesen et al., 2001)
Research Bases

Reading rate remained quite impaired
70
80
90
100
Pretest Posttest 1-year 2-year
Sta
nd
ard
Sco
re
Accuracy-91
Rate-72
Research Bases

Reading and Neural Plasticity
Reading is not a natural process and is not constructed as a result of simple exposure to language or words (Liberman)
Good reading instruction is always brain-based and involved in the development of reading proficiency
The process of learning to read rewrites the organization of the brain (Eden), which varies depending on the structure and transparency of the language (Zigler)
What is the relation of intensive reading instruction and brain function (and structure)?
Compensatory or normalizing changes?

A Model for the Brain Circuit for Reading (Component Processes)
Phonological processing: articulatory mapping
Graphemic analysis; word forms/ orthographpatterns
Phonological processing: correspondence between letter and sound
Relay station;Cross-modal integration
Courtesy P. Simos

Brain Function in Dyslexia (Simos et al., 2001; Pseudowords)
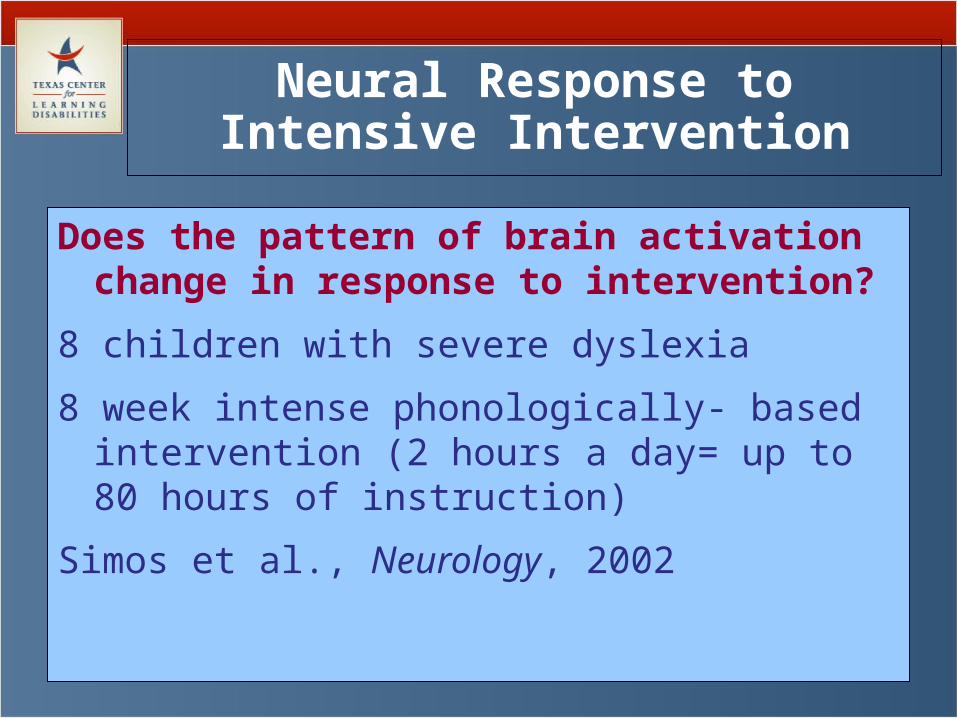
Neural Response to Intensive Intervention
Does the pattern of brain activation change in response to intervention?
8 children with severe dyslexia
8 week intense phonologically- based intervention (2 hours a day= up to 80 hours of instruction)
Simos et al., Neurology, 2002

Demographic Information
Child Gender Age (years/mo)
WJ-III pre (%)
WJ-III post (%)
IQ Medication
1 M 15 13 55 103 Adderall
2 M 10 2 59 95 Ritalin
3 M 10 2 38 110 Ritalin
4 F 8 3 55 105 Ritalin
5 F 7 2 50 110 Ritalin
6 M 7 18 60 101 __
7 M 11 1 38 98 Ritalin
8 M 17 1 45 102 __

Neural response to intervention; (Pseudoword Task; Simos et al., 2002)

Early Development of Reading Skills: A Cognitive Neuroscience Approach
(Jack M. Fletcher – PI)Grade 1 Multi-tiered Intervention
Patricia Mathes and Carolyn Denton Early Reading Intervention (Mathes
et al., RRQ, 2005; Denton et al., 2006, JLD)
A. Papanicolaou, P. Simos: Brain Activation Patterns (Simos et al., Neuropsychology, 2005; 2007; JLD,
2007)

The Core Sample
Children – two Grade 1 cohorts sampled across 2 years (2001- 2002)
300 At-Risk Readers - assigned randomly to intervention in Grade 1 (2 small group tutorial, one Enhanced Classroom Intervention); all programs in each school
100 Low Risk Readers
Teachers
6 Intervention Teachers; 30 General Education 1st-grade Teachers
Schools
6 elementary schools in a large urban school district
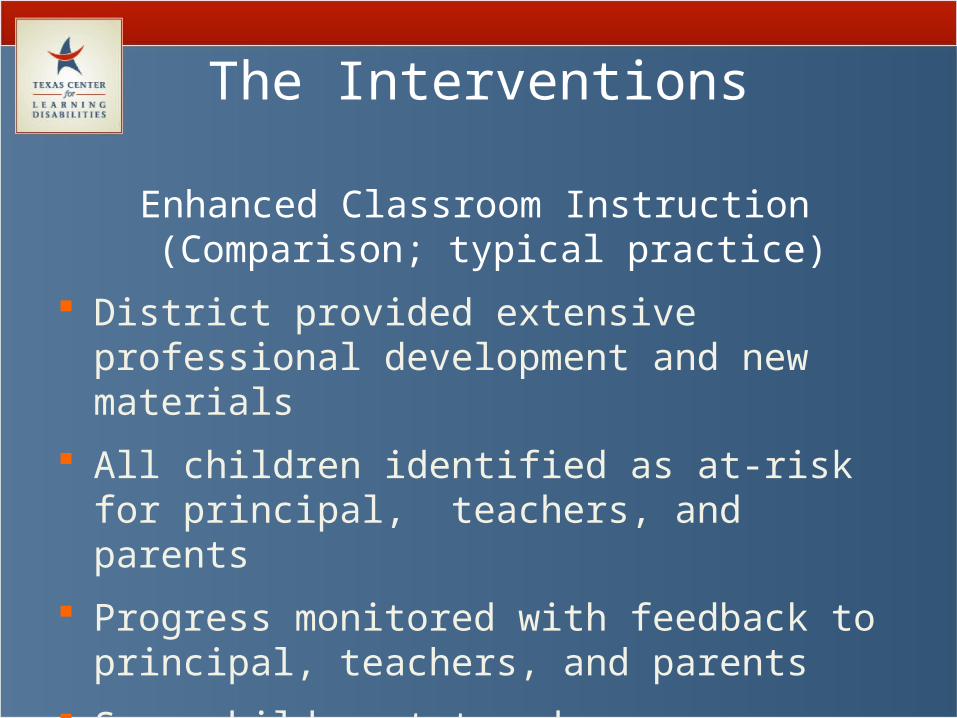
The Interventions
Enhanced Classroom Instruction (Comparison; typical practice)
District provided extensive professional development and new materials
All children identified as at-risk for principal, teachers, and parents
Progress monitored with feedback to principal, teachers, and parents
Some children tutored

Comparison of Pullout Interventions
40 minutes, 5 days per week, for 30 weeks
1:3 teacher-student ratio Taught by certified
teachers: school employees supervised and trained by our group
Supplemented enhanced classroom instruction
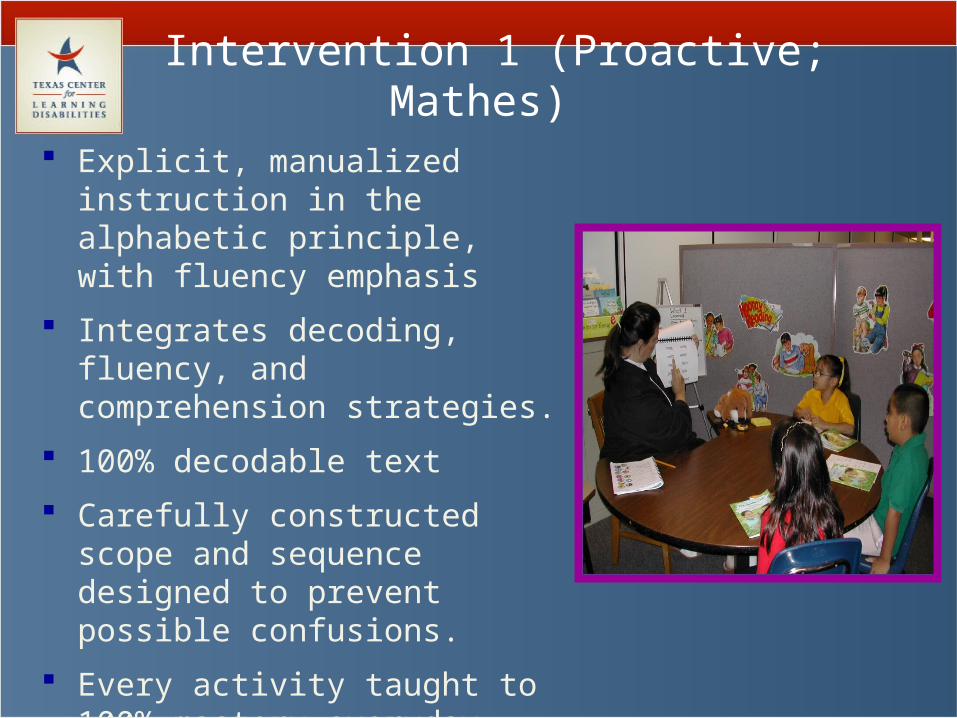
Intervention 1 (Proactive; Mathes)
Explicit, manualized instruction in the alphabetic principle, with fluency emphasis
Integrates decoding, fluency, and comprehension strategies.
100% decodable text
Carefully constructed scope and sequence designed to prevent possible confusions.
Every activity taught to 100% mastery everyday.
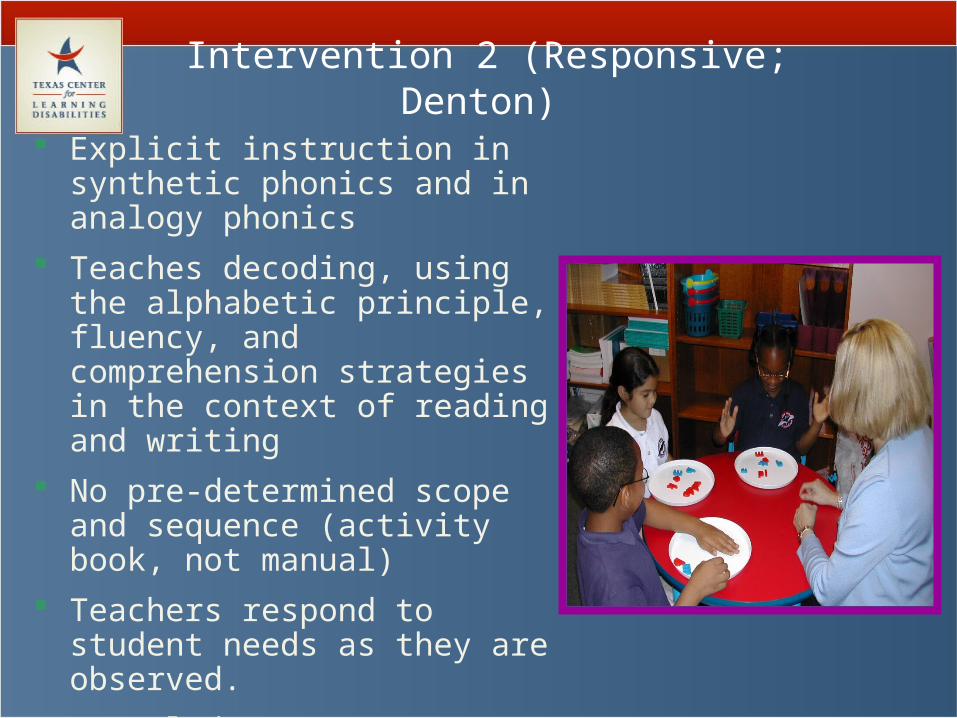
Intervention 2 (Responsive; Denton)
Explicit instruction in synthetic phonics and in analogy phonics
Teaches decoding, using the alphabetic principle, fluency, and comprehension strategies in the context of reading and writing
No pre-determined scope and sequence (activity book, not manual)
Teachers respond to student needs as they are observed.
Leveled text not phonetically decodable

Growth in Fluency by Intervention

Brain Activation Profiles Before Intervention (end K) (letter sound task)
Simos et al., J Child Neural, 2002N= 45 children 6 yrs old

Grade 1 Intervention (pseudoword task)
Simos et al (Neuropsychology, 2005)- after Grade 1 intervention in Mathes et al. (RRQ, 2005)

What percentage of children don’t respond adequately to quality
intervention?
ECI only: 15/92 = 16% (3.2% of school population)
ECI + Tutoring:
7/163 = 4% (<1% of school population)
(Basic Reading < 30th percentile) (5 others did not meet fluency benchmarks)

Wave 1 Wave 2 Wave 3 Wave 4
Round 1 Decoding Fluency
8 weeks 8 weeks 8 weeks
Round 2 Baseline Decoding Fluency
8 weeks 8 weeks 8 weeks
Pre
PrePre
D
D
F
F
Tier III Design (Denton et al., JLD, 2006)
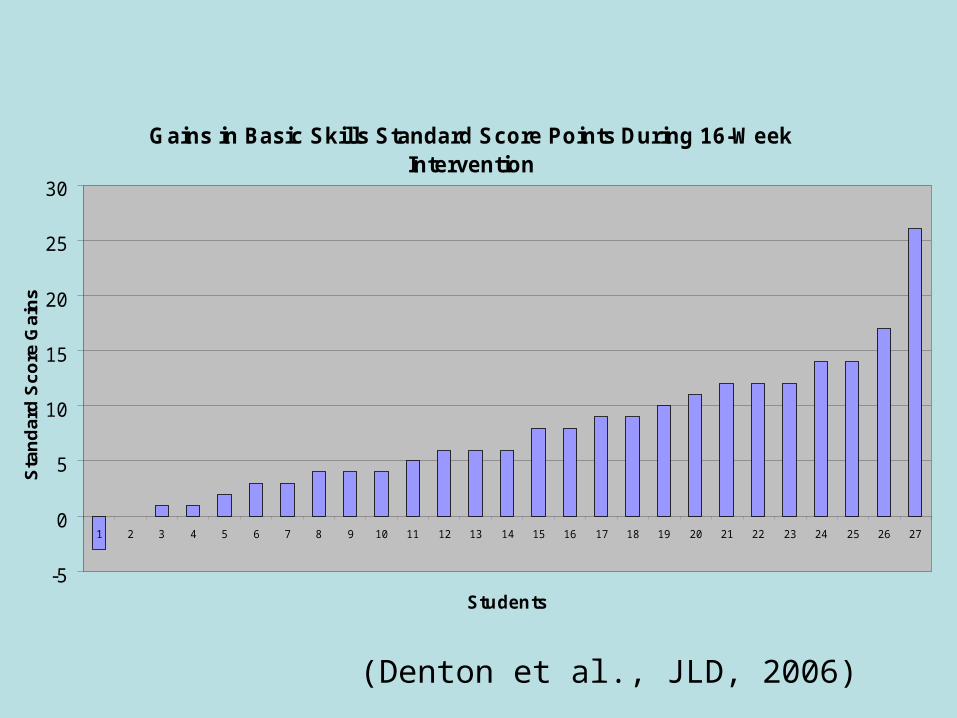
Gains in Basic Skills Standard Score Points During 16-Week Intervention
-5
0
5
10
15
20
25
30
1 2 3 4 5 6 7 8 9 10 11 12 13 14 15 16 17 18 19 20 21 22 23 24 25 26 27
Students
Sta
nd
ard
Sc
ore
Ga
ins
(Denton et al., JLD, 2006)

Response to Tertiary Instruction Simos et al., JLD, 2007)

Grade 1 Study: Tiers 1 and 2
Tier 1: Universal screening, progress monitoring, monthly meetings with classroom teachers to examine student data, Professional Development in adapting reading instruction
First grade at-risk readers (identified on fluency criteria) all received the same intervention January-May, randomized to different dosages and schedules
No significant differences between groups
Denton et al. (2011). Journal of Research on Educational Effectiveness.

Tier 2 Grade 1 Intervention Study (Denton et al., JREE, 2011)
Screen Sept.
Progress Monitor Sept.-May
Randomize & Pretest November
Begin Intervention
January
8-wk post-test
16-wk
Post-test
Tier 1 Classroom Teacher Data Meetings/PD Monthly

Intervention
Tier 1 (year long) Monthly “data meetings” with classroom teachers
Examine progress monitoring graphs and provide brief professional development
Coaching on demand
Tier 2 Beginning in January Modified explicit phonics program with comprehension
and fluency building 30 minute lessons on randomized schedules Groups of 3 taught by uncertified tutors

Design and Results
All “true positive” at-risk students randomized to 3 conditions, all received same intervention
8 weeks, 4 times per week (32 sessions)
16 weeks, 4 times per week (64 sessions)
16 weeks, 2 times per week (32 sessions)
No differences across multiple outcome domains, but results not as robust as in other Tier 2 studies

Criteria for Inadequate Response
Norm Referenced Assessments of untimed word reading (WJIII Basic Reading) and timed word reading fluency <= 25th %tile
CBM measure of passage reading fluency <= 20 wcpm based on DIBELS end Grade 1 benchmarks (Continuous Monitoring of Early Reading Skills; CMERS)

Resultant Groups
Decoding/Fluency (n = 29)
Fluency (n = 75)
Responders (n = 85)
Typicals (n = 69)
Assessed phonological awareness (CTOPP), rapid naming (CTOPP), speed of processing (Underlining), listening comprehension (CELF), syntactic comprehension/working memory (CELF), vocabulary/verbal reasoning (KBIT Verbal), and nonverbal problem solving (KBIT Matrices)

A continuum of severity (Fletcher et al., SPR, 2011)

37
Tier 3 Study (Grade 2) End of Grade 1, identified a group with low
response to Tier 1 + Tier 2 based on either word reading or fluency criteria (in 10 schools)
Students were randomly assigned (2:1 ratio) to receive an individualized Tier 3 intervention (N=47) or to a Typical School Practice comparison group (N=25) the following year
Most in 2nd grade, some retained in 1st; M age = 7.8 yrs
Sample primarily minority (AA and Hisp.) and Low-SES; about 30% Limited English Proficient
64% of the comparison group and 17% of the treatment group received reading intervention from their schools outside of the study.
38
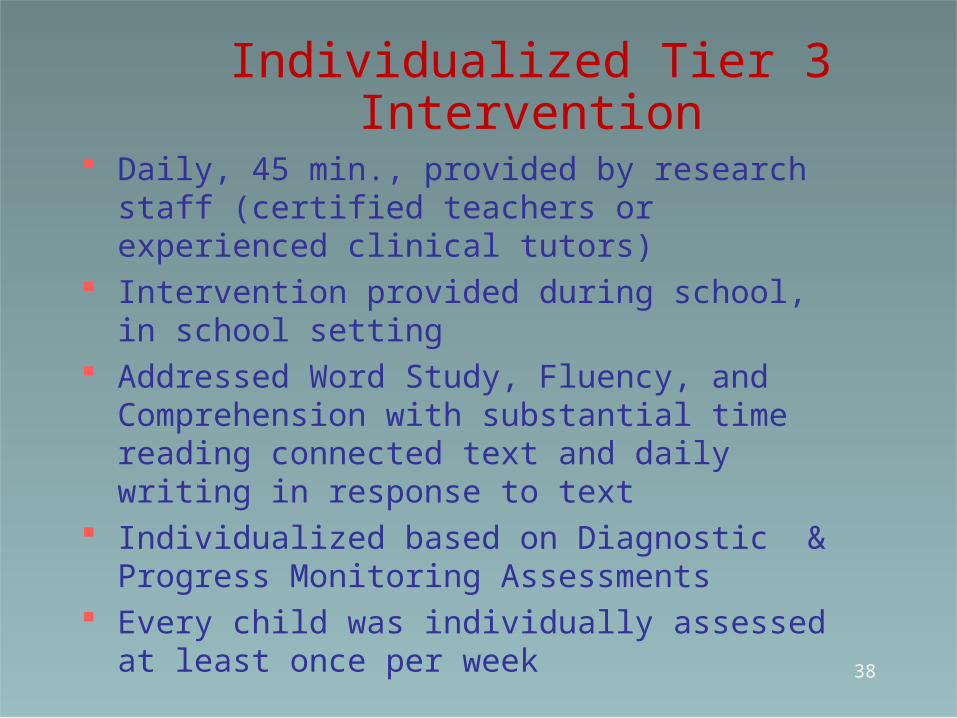
Individualized Tier 3 Intervention
Daily, 45 min., provided by research staff (certified teachers or experienced clinical tutors)
Intervention provided during school, in school setting
Addressed Word Study, Fluency, and Comprehension with substantial time reading connected text and daily writing in response to text
Individualized based on Diagnostic & Progress Monitoring Assessments
Every child was individually assessed at least once per week

39
Reading OutcomesMEASURE
TIER 3 GROUP CHANGE a
TYPICAL PRACTICE CHANGE a
E.S.
WJ III Letter-Word ID 4.34 - .01 .44 *WJ III Word Attack 3.91 1.32 .65 *TOWRE Words 8.42 - .36 .39 *TOWRE Nonwords 5.79 0 .40 DIBELS Oral Reading Fluency
33.13 10.74 .12
WJ III Passage Comprehension
5.49 .93 .34 *
Gates-MacGinitie Comprehension
8.04 5.50 .35
a Change in Standard Score Points except DIBELS (Raw Score)* p < .05 (40% vs. 20% adequate responders)
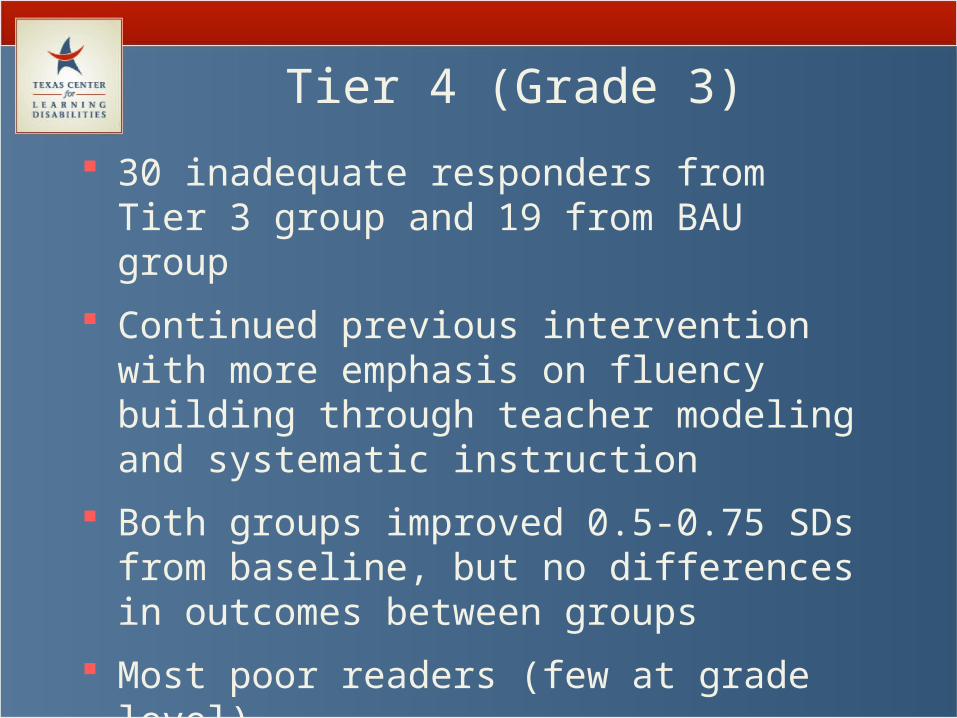
Tier 4 (Grade 3)
30 inadequate responders from Tier 3 group and 19 from BAU group
Continued previous intervention with more emphasis on fluency building through teacher modeling and systematic instruction
Both groups improved 0.5-0.75 SDs from baseline, but no differences in outcomes between groups
Most poor readers (few at grade level)

Adolescent Studies (Vaughn et al., 2010; 2011; Wanzek, 2011)
Sample selected on the basis of reading comprehension performance in grades 6-8 and randomized to typical practice or different reading interventions over 3 years
Typical Readers (pass state test), n=974:
Struggling Readers (don’t pass or don’t take state test), n=1032: 81% decoding/fluency problems; 19%
primarily comprehension

One Example of a Tiered Middle School Reading Intervention
High Standards; Effective Instruction; Instructional Leadership; School-wide Commitment;
Safe and Positive School Climate
Common Content-Area Comprehension and Vocabulary
Strategies
Strategic Intervention
Intensive Intervention
Tier 1: All Students
Tier 2: Struggling Readers (Students who do not
pass TAKS or take SDAA)
Tier 3: Students Who Do Not Respond Appropriately to Tier 2
http://www.texasreading.org/utcrla/materials/middle_school_instruction.asp

Tier 1 Support and involve content teachers in
a common set of procedures and strategies for teaching vocabulary and comprehension
Help content teachers work with academically diverse students who range in reading level
Focus on how to comprehend texts used in content areas and on how to think like content experts
Focus groups and extensive professional development
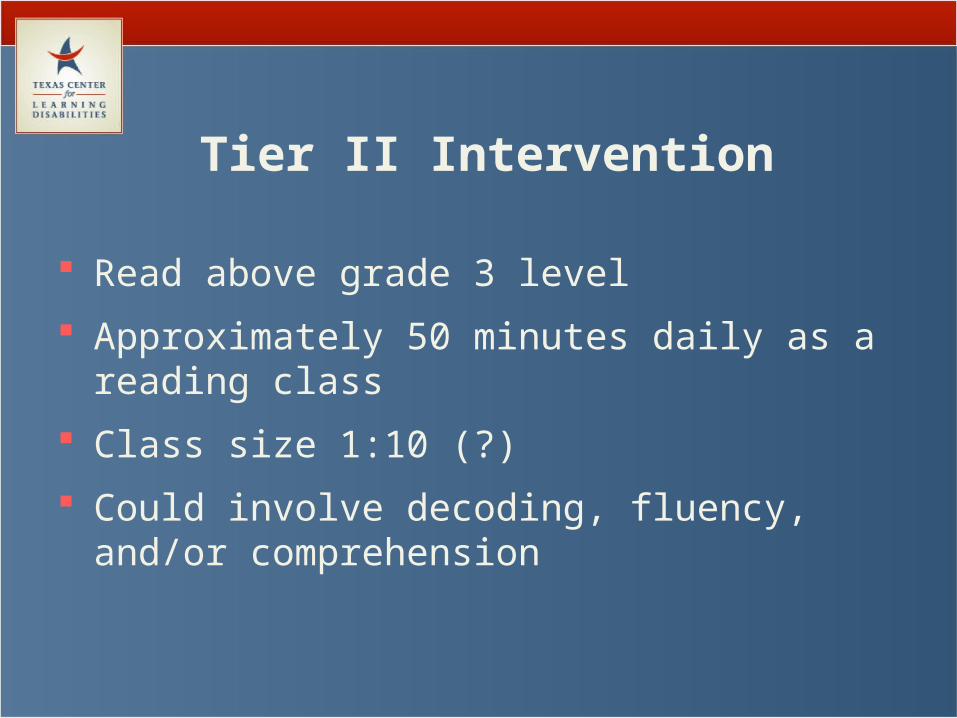
Tier II Intervention
Read above grade 3 level
Approximately 50 minutes daily as a reading class
Class size 1:10 (?)
Could involve decoding, fluency, and/or comprehension
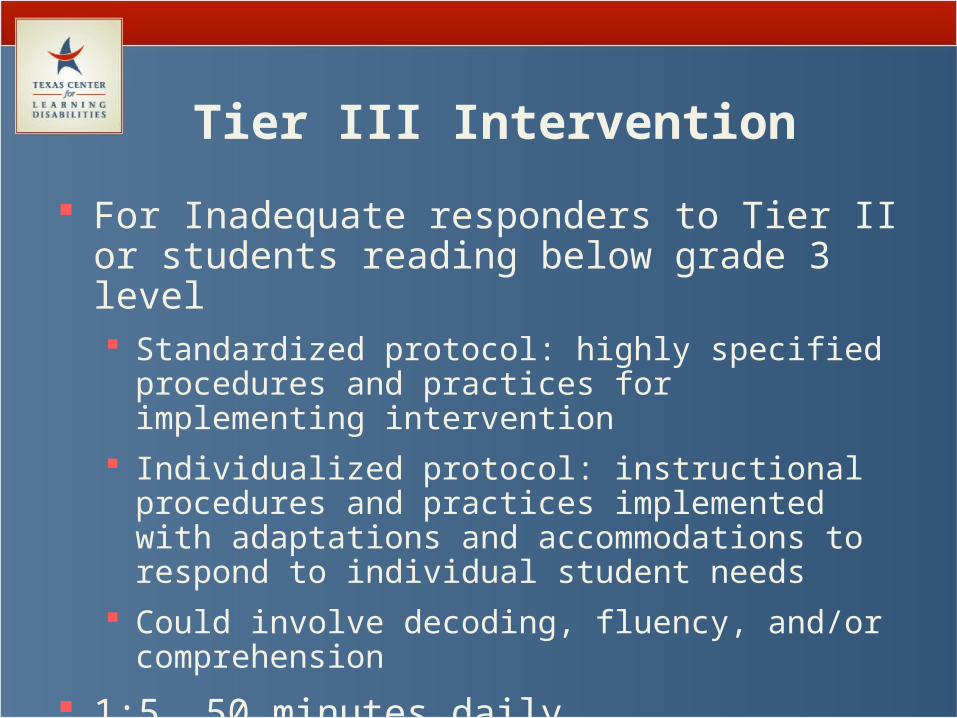
Tier III Intervention
For Inadequate responders to Tier II or students reading below grade 3 level Standardized protocol: highly specified
procedures and practices for implementing intervention
Individualized protocol: instructional procedures and practices implemented with adaptations and accommodations to respond to individual student needs
Could involve decoding, fluency, and/or comprehension
1:5, 50 minutes daily

Results Year 1: Small effects generally not
statistically significant; no effect of group size
Year 2: Moderate effects on decoding, fluency, and comprehension; no difference in standardized vs. individualized instruction exception for children identified with special needs (better with standardized intervention)
Year 3: Moderate to large effects on decoding, fluency and comprehension

• NICHD middle school studies –intensive interventions for adolescents with severe reading difficultiesCohort of minimal responders followed for three yearsindicated a decline in performance for the participantsin the control condition, with significant improvement in the treatment group
GatesMacGinitieReading
Yr 1 Yr 2 Yr 3
100
0
50
Treatment
Control

Neural Correlates of Adolescent Intervention
Inadequate responders (fluency criteria) show underactivation of left supramarginal and angular gyri, as well as in the superior and middle temporal gyri, bilaterally
Functional neuroimaging measures of activation predict intervention response especially engagement of left temporal regions (Rezaie et al., JINS, 2011)

Baseline MEG Patterns for Adolescent Adequate and Inadequate Responders

Intensive Intervention: Some Thoughts
Effective interventions for reading (and numeracy and written expression) are complex cognitive therapies more closely tied to domains, and less to disorders; continuum with little evidence of qualitative markers (dimensional view)
Strong evidence of efficacy for comprehensive and less comprehensive interventions in preschool and Grades K-3 for literacy and numeracy with effects often moderate to large (.40-.80) against best practice
Generalization to comprehension and other distal measures weaker (outcome measures not sensitive to far transfer?); weaker effects G4-12

Wanzek et al. (in press) Meta-analysis of reading interventions
in grades 4-12
Ten studies reporting on 22 distinct treatment/comparison differences
Mean effect sizes .10 .16 for comprehension, word reading, word reading fluency, reading fluency, and spelling outcomes
Interventions equally effective regardless of group size, number of hours of intervention, and grade level
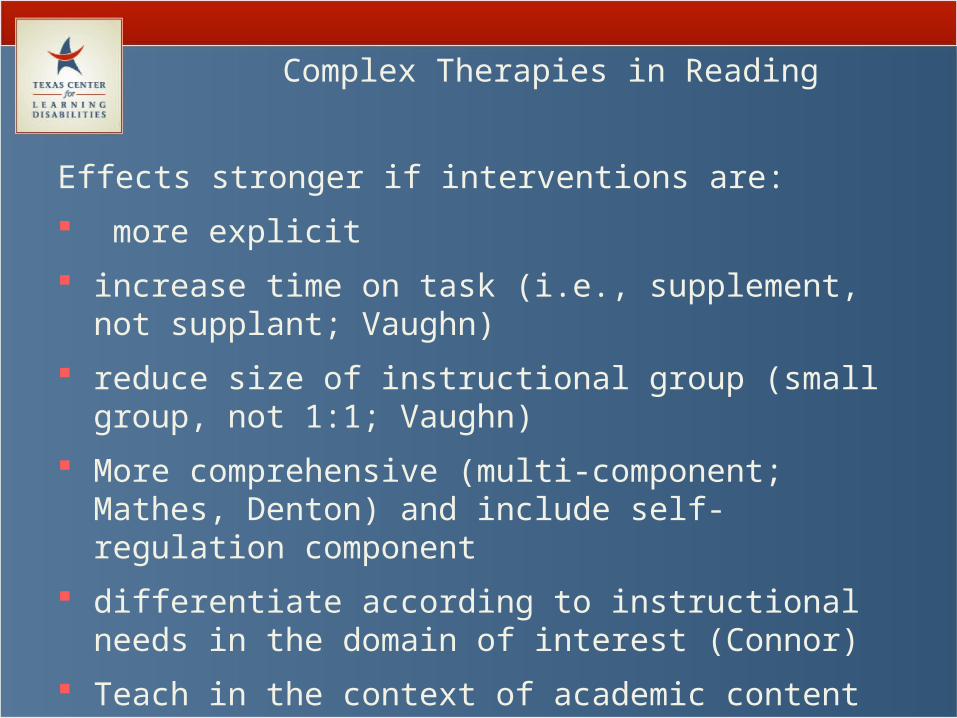
Complex Therapies in Reading
Effects stronger if interventions are:
more explicit
increase time on task (i.e., supplement, not supplant; Vaughn)
reduce size of instructional group (small group, not 1:1; Vaughn)
More comprehensive (multi-component; Mathes, Denton) and include self-regulation component
differentiate according to instructional needs in the domain of interest (Connor)
Teach in the context of academic content
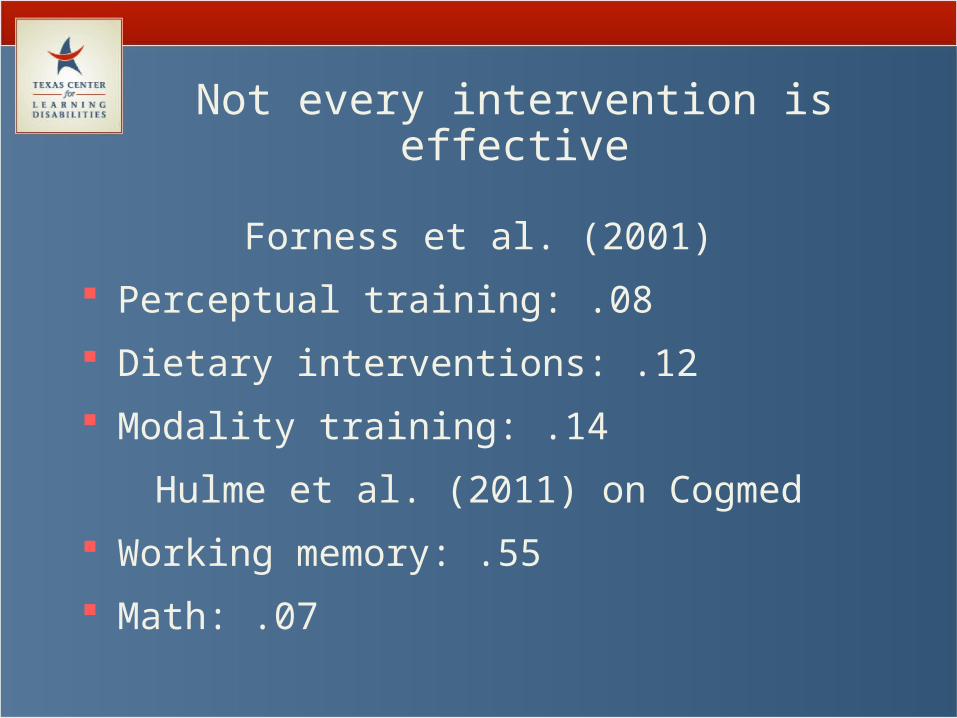
Not every intervention is effective
Forness et al. (2001)
Perceptual training: .08
Dietary interventions: .12
Modality training: .14
Hulme et al. (2011) on Cogmed
Working memory: .55
Math: .07

Not every intervention is effective
Pennington et al.,2011, IDA Perspectives, Winter: Reviews of alternative treatments
Older version of Fast ForWord®, exercise and movement training, low level vision and oculomotor training show little evidence of efficacy for
children with reading problems

Ineffective Intervention… Doesn’t focus on academic skills Defines academic proficiency narrowly Focuses on computer software Doesn’t increase instructional time, intensity,
or differentiation Doesn’t continually monitor progress and
adjust instruction or change program Teaches for the sake of learning rules, not to
master principles Doesn’t engage the child in reading
instructional level material or writing Waits for the child to fail; leaves the child
behind

Is plasticity an issue?
The neural systems underlying reading seem malleable, show plasticity across the age range, and are not disorder-specific; continuum of severity (Vellutino).
Mostly normalizing, not compensatory
Don’t know much about inadequate responders
Need to tie functional results to structural correlates (gray matter increases with intervention (Eden) and parallels differences in literate and illiterate adults (Castro-Caldes); coregister across imaging modalities
Are neuroimaging measures effective predictors of growth and intervention response?

Reading Sculpts the Brain, But Must Be Taught!!
“We are all born with dyslexia. The difference among us is that some are easy to cure and others are not.”
- Liberman, [email protected]
www.texasldcenter.org
Support: NICHD grant P50 HD052117
Top Related