


Languages
Pages
Legal


Integrating Sensors and Actuators into Assistive
Technology for the Blind
By Sameer Kamath
Massachusetts Academy of Math and Science

Kamath 2
Table of Contents
Section Page Number
Abstract 3
Literature Review 3
Research Plan 14
Methodology 15
Results 25
Analysis 31
Conclusions 34
Acknowledgements 34
References 35
Appendices 36

Kamath 3
Abstract
There are an estimated 285 million visually impaired people, 39 million of whom are
completely blind. Unfortunately, red and white canes are inaccurate and often miss obstacles.
Guide dogs, a common alternative, can cost over $42,000, and current electronic aids are poorly
engineered and have had little market success. The goal of this project was to engineer a tactile
device that would better allow blind people to perceive and avoid walls and obstacles. The first
prototype was an Arduino-based handheld device consisting of nine sonar sensors pointing out
from the body and a pad of vibrating motors that transmitted information from the sensors to the
test subject‘s palm. This device and a cane were tested separately in an obstacle course. The
problems encountered with the first prototype and the cane alone were addressed in the final
device. This system consisted of upper body sonar sensors, a magnetometer, a buzzer, vibrating
motors, and a cane with a mechanical attachment. The final prototype significantly reduced
orientation issues and variance in navigation times. Furthermore, based on a Poisson test,
collisions with low obstacles were significantly reduced.
Literature Review
Visual Depth Perception
Humans navigate by using visual cues to perceive depth from two-dimensional images,
which allows them to navigate. These cues can be divided into oculomotor, monocular, and
binocular cues. Binocular cues require both eyes to be open, whereas monocular cues require
only one eye to be open. Oculomotor cues rely upon the tensions in eye muscles and the
positions of the eyes. As the distance between an object and a person’s eyes varies, the eyes
move inward toward the nose or outward away the nose. This movement causes the eye muscles
to change tension. The relationship between the tension and positon of the eyes provides depth
Kamath 4
information to the brain. Additionally, monocular cues such as the sizes of familiar objects,
shadows, texture gradient, linear perspective, motion parallax, and occlusion further enhance
depth perception. Occlusion occurs when an object is covered by other objects, causing the
human brain to perceive the covered object as being farther away. Motion parallax causes nearby
objects to appear to move through the field of vision faster. Because of motion parallax, objects
that are farther away appear to move more slowly.
Figure 1. Familiar Size Cues. (“Perceiving Depth,” n.d.)
Furthermore, the brain uses binocular cues such as stereopsis, the disparity between
images the two eyes produce, to calculate depth from the correspondence of the points in the two
images (“Perceiving Depth,” n.d.). All these complex cues simultaneously work together to
provide sighted humans with detailed three dimensional perceptions of their surroundings.
Blindness
There are an estimated 285 million visually-impaired people, 39 million of which are
blind (“Visual Impairment,” 2014). Visual impairment indicates that a person has vision 20/40 or
worse in his or her better eye when the eye is corrected (“Blindness and Vision Impairment,”
2011). A person with 20/40 vision can read a line of letters at 20 feet that a normal person can
read at 40 feet (“What Does 20/20 Vision Mean?,” n.d.). A person is legally blind if his or her
corrected vision in his or her best eye is 20/200. A visual field less than or equal to 20 degrees in
diameter in a person’s best, corrected eye also constitutes legal blindness. (“Blindness and

Kamath 5
Vision Impairment,” 2011). A person’s depth perception and ability to navigate can be severely
hindered if his or her visual impairment is substantial.
Assistive Technology
Many devices have been engineered to help blind people navigate. The white and red
cane is one of the simplest of these devices. Blind people sweep the cane from side to side with
the tip of the cane hovering above the ground (Edison, 2014). The canes provide people with
information about obstructing objects and changes in surface and elevation (Schellingerhout,
Bongers, Grinsven, Smitsman, Galen, 2001).
Figure 2. Obstacle Detection with a Red and White Cane. (Edison, 2014)
Unfortunately, according to several cane-users, canes are inaccurate and tend to miss
obstacles (Schellingerhout et al., 2001). These flaws can pose a significant threat to the safety and
peace of mind of blind people when navigating. Also, the majority of cane-users hold the cane at
angles greater than 35° to the ground, which is far too high to adequately detect many obstacles
on the ground (Schellingerhout et al., 2001). Approximately 2% of blind people use trained
guide dogs. Guide dogs follow commands and lead their owners around obstacles (“Travel
Tools,” n.d.). However, guide dogs can cost upwards of $42,000, which makes them
unaffordable for many people (“FAQ,” 2016). The lack of decent assistive equipment for blind
people has lead researchers to utilize more advanced technology, such as sensors and
microcontrollers, to engineer complex electronic aids (“National Research Council,” 1986).

Kamath 6
Infrared and ultrasonic sensors are two common types of distance sensors that are widely
available.
Infrared Sensors
Infrared sensors emit a beam of infrared light, and the light is reflected back to a receiver
if an obstacle is present. This returning beam creates a triangle between the emitter, obstacle, and
receiver. The light is transmitted from the receiver of the sensor to a device called a charge-
coupled (CCD) array. The sensor then uses the CCD array to calculate the base angle of the
triangular beam, as shown in Figure 3. The base angle is used to calculate the distance to the
obstacle (Al-Fahoum, Al-Hmoud, Al-Fraihat, 2013).
Figure 3. Infrared Sensor Triangulation. (Al-Fahoum et al., 2013)
Unfortunately, infrared sensors, when compared to ultrasonic sensors, are terrible at
detecting objects that are not perpendicular to the sensor (Loven, 2016). Furthermore, reflecting
infrared light is a tricky process; sunlight can cancel out the infrared beams, and non-reflective
surfaces render these sensors useless. (Kanwal, Bostanci, Currie, Clark, 2015).
Ultrasonic Sensors
Points of Emission

Kamath 7
The ultrasonic sensor is another common type of sensor that can be used to find distances
to objects. The transmitting piezoelectric transducer of an ultrasonic sensor emits a short
ultrasonic pulse. After the pulse reflects off an object, the receiving transducer times how long it
takes for the pulse to be received. This duration, along with the speed of sound in air, 343 m/s, is
used to calculate the distance to the target object. For optimum detection, the obstacle must be
relatively flat and capable of reflecting sound properly. It is very important that the sensor face is
parallel to the object. If the face of the sensor is not parallel to the surface of the object, the
readings can be inaccurate due to the cone-shaped spread of the sound waves (“Ultrasonic
Acoustic Sensing,” n.d.).
Figure 4. Inaccuracies with Ultrasonic Sensors (“Ultrasonic Acoustic Sensing,” n.d.)
As the energy of the sound beam spreads, beam divergence occurs, as shown in Figure 5.
The greatest sound pressure comes from the centerline of the transducer. Therefore, objects
directly in front of the transmitting transducer will send the strongest echoes to the receiving
transducer.

Kamath 8
Figure 5. Beam Divergence from a Transducer (“Transducer,” n.d.)
Sound is a longitudinal pressure wave that moves through a medium by transferring
energy between particles. An ideal sound wave would be a perfectly straight, cylindrical shape.
However, in the real world, beam divergence occurs because the particles in the air do not
perfectly transfer all their energy to the particles directly in front of them as the sound wave
propagates. Beam spread is significantly affected by frequency and transducer diameter. Higher
frequencies and larger transducers correspond to less beam spread (“Transducer,” n.d.).
Arduino Mega
Arduino is an open source microcontroller platform for building electronic devices, such
as travel aids for the blind. Arduino boards can be programmed using the Arduino integrated
development environment (IDE) (Blum, 2013). At the heart of the Arduino Mega, one of
Arduino’s largest and most versatile boards, is an ATMega2560 integrated circuit. Some features
of the Mega are 54 digital input/output (I/O) pins, 15 of which can be used for pulse width
modulation, 16 analog inputs, and one 16 MHz crystal oscillator for clock signaling (“Arduino -
ArduinoBoardMega2560,” n.d.). Ordinary binary digital pins can output and receive a high
voltage of 5 V or low voltage of 0 V. The pulse width modulation pins can control the duty cycle
of the digital high and low voltages, allowing for an analog output or input. For example, an
LED can operate at half brightness by receiving a 50% duty cycle signal from an Arduino board

Kamath 9
(Hirzel, n.d.). The Arduino’s low price and extraordinary (I/O) capabilities make the platform
tremendously useful for controlling and receiving data from actuators and sensors.
Figure 6. Analog Output with Pulse Width Modulation. (Hirzel, n.d.)
Vibrating Motors
Vibration motors are commonly used in electronic travel aids to alert blind people about
obstacles (“National Research Council,” 1986). The fundamental principle behind a vibrating
motor is a net centripetal force. The non-symmetrical mass attached to the shaft of the dc motor
causes an unbalanced centripetal force, which in turn causes the entire motor to move. The shaft
oscillates extremely fast, resulting in constant displacement of the motor, which creates vibration
(“AB-004 : Understanding ERM,” n.d.).

Kamath 10
Figure 7. Pancake Vibration Motor (“Coin Vibration Motors,” n.d.)
Electronic Travel Aids
Many engineers have attempted to create electronic travel aids (ETA) that assist blind
people with navigation. These devices usually consist of sensors, often ultrasonic or infrared,
which gather information about a blind person’s surroundings, and some sort of auditory or
tactile system of transmitting the information to the person. Some aids, known as obstacle
detectors, detect only the general area and direction of obstacles without collecting information
about the nature of the obstacles. The Russell Pathsounder, for example, uses a chest-level
ultrasonic sensor to detect obstacles. It triggers an auditory and tactile warning if an obstacle is
detected within 6 feet of the person. The Mowat Sensor, another sonar ETA, is a handheld device
that consists of an ultrasonic sensor and vibration motors that vibrate with intensity proportional
to the distance detected by the sensor. Researchers have also engineered a modified version of
the Mowat Sensor that plays musical notes with frequencies proportional to the detected ranges.
Unfortunately, none of these outdated devices have achieved much success on the market
because they are expensive, uncomfortable and impractical. Furthermore, the devices do not
properly transmit enough desired information (“National Research Council,” 1986).

Kamath 11
Neuroscientists have recently attempted to reinvent electronic travel aids by trying to
connect the tongue to the brain by using a device called BrainPort V100. The device consists of a
video camera that is fixed to a pair of glasses, and an array of electrodes attached to the tongue.
The pixels of the image from the camera are converted into electric pulses that are sent to the
array of electrodes on the tongue. The identification of objects, shapes, and text were tested.
After one year of training, 69% of subjects could pass the object recognition test (“FDA,” 2015).
Unfortunately, even with funding from the US Department of Defense and Google, the device
still costs $10,000 (“FDA approves novel tongue sensor,” 2015). Furthermore, the images
transmitted to the brain are of extremely low resolution, and a cane is still necessary for depth
perception and obstacle detection in 3D space (“BrainPort V100 Vision Aid,” 2015).
Researchers at Chonbuk National University in Korea recently engineered a device that
used ultrasonic sensors and vibration feedback on the palm to detect and inform blind people
about objects in their path (Jeong, Yu, 2016). Figures 8 and 9 show how the configuration of
ultrasonic sensors on the device detects objects in front of users as well as changes in elevation.
Because the two-point discrimination of the palm is 11 mm, the vibration motors were spaced
over 20 mm apart from each other so that users could easily differentiate between which motors
were vibrating on their palms (Jeong et al., 2016).

Kamath 12
Figure 8. Spatial Obstacle Detection. (Jeong et al., 2016)
Figure 9. Array of Ultrasonic Sensors. (Jeong et al., 2016)

Kamath 13
Figure 10. Basic Indoor Obstacle Course. (Jeong et al., 2016)
Figure 11. Complex Outdoor Obstacle Course. (Jeong et al., 2016)
Figures 10 and 11 show the testing the device underwent. The test subjects of the
experiment in Figure 10 were blind-folded university students, and obstacles were placed in
random locations unknown to the test subjects. The obstacles were successfully avoided 90% of
the time. In the experiment shown in Figure 11, the test subjects were completely blind people
who normally used red and white canes for navigation. Single obstacles were avoided 96.7% of
the time, dual obstacles were avoided 60% of the time, the toll bar was avoided 86.7% of the
time, and the hanging obstacle only had a 13.3% avoidance rate. Detection of obstacles was not

Kamath 14
the main issue; the researchers found that an overwhelming majority of the collisions were
results of attempts to maneuver around obstacles. In fact, many subjects reported that the
vibration feedback would change erratically during the maneuvers, leading to collisions (Jeong et
al., 2016).
Unfortunately, most blind people still have few alternatives to the red and white cane due
to a lack of affordable and modern electronic travel aids that provide ample obstacle avoidance
capabilities.
Research Plan
Engineering Problem
There are no affordable, widespread, modern electronic travel aids on the market that
allow blind people to fully grasp the 3D space in front of them and avoid obstacles.
Engineering Goal
The goal of this project was to engineer a tactile device that would better allow blind people
to perceive and avoid walls and obstacles.
Design Criteria
Low Cost
High Obstacle Avoidance
Low Variance of Navigation Times
Development
The first prototype consisted of a handheld vertical stick with 3 rows of 3 ultrasonic
sensors at shoulder height, hip height, and ankle height. The 3 by 3 array of stationary sonar
sensors scanned and mapped out the depth of the region in front of the person and sent the data
to an Arduino. A 3 by 3 array of Arduino-controlled vibration motors formed a tactile hand-held

Kamath 15
grid that fit on the test subject’s palm. The location of the vibrations on the grid represented the
presence of obstacles in the 3-D space in front of the person. Rows corresponded to obstacle
range, and columns corresponded to horizontal position. After initial testing, a second prototype
was created. The second prototype consisted of two ultrasonic sensors and one Adafruit sensor
board that functioned as a gyroscope, accelerometer, and magnetometer. The first ultrasonic
sensor was mounted at neck height, and the second was at stomach height. The Adafruit board
was mounted just below the lower ultrasonic sensor. These three upper body sensors were
connected to an Arudino. A pad of three vibrating motors were attached to the subject’s arm, and
all three motors buzzed if the sensors detected a high obstacle within 152 cm. This second
prototype was a hybrid aid; therefore, in addition to the sensors, it also consisted of a stick
similar to a red and white cane. The stick had a wooden mechanical attachment that would
increase its detection area.
Testing
The two prototypes and the cane by itself were tested. A person navigated an obstacle
course multiple times with his eyes closed by using the aids. The set of obstacles were randomly
arranged each time. The subject’s ability to successfully avoid walls, high, medium, and low
obstacles were tested. The percentage of obstacles detected and avoided indicated the obstacle
detection capabilities of the device. Next, the stick was tested for obstacle detection capability.
Finally, the second prototype was tested for obstacle detection capability. The aids were
compared in an engineering matrix based on variance in times taken to navigate the obstacle
course, cost, and obstacle detection.
Methodology

Kamath 16
Prior to designing the first prototype, preliminary sensor tests were conducted on 3 HC-
SR04 ultrasonic sensors to observe the obstacle detection capabilities of the sensors. HC-SR04
sensors are manufactured by Elecfreaks and are available on Ebay. The trig and echo pins of 3
ultrasonic sensors were wired to digital pins on an Arduino Mega (from Amazon), and the VIN
and ground pins were wired to power and ground on the Arduino. Using duct tape, the 3 sensors
were mounted horizontally across a rectangular sheet of cardboard that was the width of the test
subject’s body at the ribs. The test subject held up the board of sensors at shoulder height at
60.96 cm, 91.44 cm, 152.40 cm, 213.35 cm, and 304.80 cm from a wall. The exact length
measurements were taken with measuring tape. The sensors were wired to an Arduino and a
stream of 57 readings were taken per sensor at each distance. Using Excel, the average error per
sensor was calculated.
Figure 12. Cardboard sensor board (not drawn to scale)
The goal of the next preliminary test was to map out the beam divergence of the sensors,
which was taken into account when programming the two prototypes. The same board of
ultrasonic sensors was attached to a cardboard box. Rectangular pieces of tape were directly
centered in front of the 3 sensors at distances of 30.48 cm, 60.96 cm, 91.44 cm, 121.92 cm, and
151.40 cm. Also, an additional 10 pieces of tape were positioned at 13.97 cm on the left and right
sides of the left and right sensors, as shown in Figure 13. A glass prism of dimensions 8 cm by
10 cm by 15 cm was centered on each piece of tape during each trial, as shown in Figure 14, and
24.8 𝑐𝑚
0.32 𝑐𝑚 12.4 𝑐𝑚

Kamath 17
a stream of 78 distance readings per sensor was taken with the prism on each piece of tape.
Figure 13. Tape configuration
Figure 14. Prism positioning at each tape setting
Two more boards of ultrasonic sensors were assembled. The boards were identical to the
one used in the preliminary sensor tests. Using hot glue, one board was mounted on a flat wood
stick at shoulder height, another at hip height, and the last at ankle height, as shown in Figure 15.
Figure 16 shows the approximate locations of the sensors relative to the body when the stick was
13.97 𝑐𝑚

Kamath 18
held in front of the test subject. The wood stick (Home Depot) was approximately the height of
the test subject. All the sensors were wired to an Arduino. Using hot glue, nine pancake vibration
motors (Amazon) were mounted on a hand-sized piece of foam (Mr. Loven), as shown in Figure
17. All nine motors must make contact with the test subject’s palm when his or her hand is
strapped to the foam vibration pad with a rubber band. The power wire of each motor was wired
to a PWM pin on the Arduino, and the ground wires were wired to the ground pin on the
Arduino. A program was written in Arduino C that vibrated the appropriate motor when an
obstacle was detected. Figure 18 shows how the program decided which motor to vibrate based
on the sensor readings. Positions on the table correspond to vibration motors on the palm.
Figure 15. Sensor mounting

Kamath 19
Figure 16. Approximate sensor locations.
Figure 17. Vibration pad
Figure 18. Vibration array program boolean logic
Kamath 20
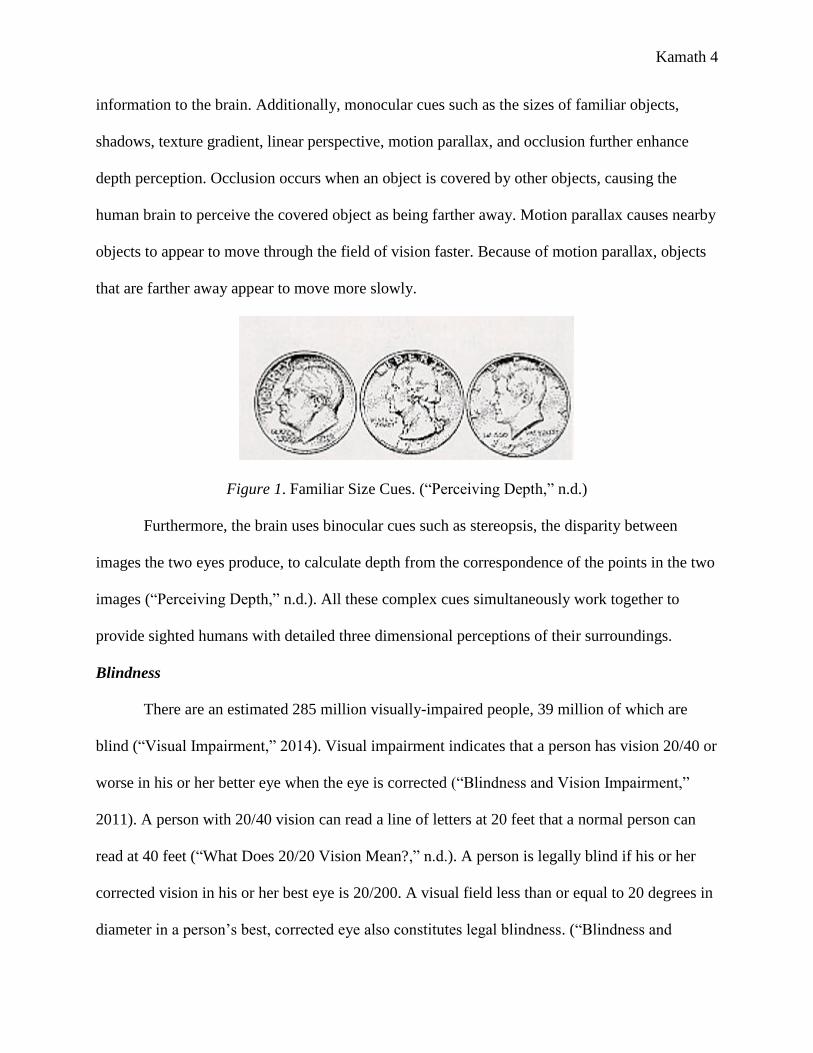
The first prototype was tested in an obstacle course consisting of two low level obstacles,
two medium height obstacles, and one high obstacle. The low obstacles were only high enough
to be detected by the bottom row of sensors. The medium obstacles were only high enough to be
detected by the middle and bottom rows. The high obstacle was high enough to be detected by all
3 rows. At the start of each trial, the test subject closed his eyes and faced forward at the starting
location while the obstacles were arranged in random locations in a 12 ft by 17 ft room.
Figure 19. Obstacle course room
The pad of vibrating motors was pressed against the subject’s left palm by a strong
rubber band. The subject held the sensor stick (with his right hand) directly in front of him 1 to 2
centimeters above the ground with the sensor boards facing straight ahead. The timer person
made sure that the subject was facing straight ahead toward the obstacle course and said “go”
right as she started the timer. The test subject navigated the obstacle course with his eyes closed.
When the test subject reached the opening at the top right corner of the room (shown in Figure
START
17 𝑓𝑡
12 𝑓𝑡
331 𝑓𝑡

Kamath 21
19), the timer person stopped the timer. During navigation, if the test subject turned the wrong
way and walked out of the 12 by 17 ft space, the trial was ended and recorded as a complete loss
of navigation. If the person successfully made it to the opening, the time, types of collisions
(high/medium/low/wall), and numbers of each type of collision were recorded.
Figure 20. The five obstacles
Next, a reflective driveway marker was purchased from Home Depot. The marker was
cut to the test subject’s armpit height. A piece of Scotch tape was attached to the bottom of the
marker so that it could sweep the ground smoothly. The obstacle course test was repeated 42
more times with the marker (held in the right hand) instead of the sensor-based device. The cane
was swept (not tapped) from side to side during navigation.
Next, a final aid was built and tested. The sensors were mounted on a cut meter stick
from Home Depot. The length the meter stick was cut to was equal to the length from the test
subject’s shoulders to hips. Two ultrasonic sensors were hot glued to two squares of cardboard.
The cardboard squares were then hot glued to the cut meter stick such that one sensor would be

Kamath 22
at shoulder height, and the other would be at chest height when the meter stick was mounted on
the test subject’s upper body. Next, an Adafruit gyroscope/accelerometer/magnetometer module
was hot glued to a cardboard square, and the square was hot glued onto the meter stick just
below the lower ultrasonic sensor, as shown in Figure 21. The VIN and ground pins of the
Adafruit module were wired to power and ground on the Arduino. The SCL and SDA pins of the
module were wired to the SCL and SDA pins on the Arduino. The Arduino Mega was hot glued
to the stick just under the Adafruit module, and a piezo buzzer (Mr. Loven) and three vibration
motors were wired to the Arduino. The power wire of the piezo buzzer was wired to a PWM pin
on the Arduino, and the ground wire was wired to the ground pin on the Arduino. The three
motors were hot glued to a piece of foam as shown in Figure 21. The Arduino C program for this
prototype vibrated all three vibration motors if either sensor detected an obstacle within 152 cm.
Also, if the yaw angle of the Adafruit module deviated more than 7 degrees from its initial angle,
the program buzzed the piezo buzzer. The test subject could press the reset button on the
Arduino at any time to restart the program and reset this initial reference angle. Two loops of
string were hot glued to the upper body apparatus and were used to firmly tie the device to the
test subject’s chest. The vibration pad was pressed against the test subject’s wrist with a rubber
band. The programs for both prototypes and the initial sensor testing are in Appendix C.
The final part of this prototype is the mechanical attachment to the marker (shown in
Figure 22). A thin strip of wood from Home Depot was cut to 55.5 cm, which is half the length
of the base of the triangle shown in Figure 22. The marker was laid out on the ground, and the
triangle was created on the ground with tape. Next, the wood was hot glued and firmly duct
taped to the orange marker 5 cm above the base of the tape triangle, as shown in Figures 22 and
23. The prototype was tested in the obstacle course exactly the same way the stick and the first

Kamath 23
prototype were tested. When the test subject intentionally changed directions (ex: when turning
at a wall), he had to press the reset button on the Arduino to reset the reference angle of the
Adafruit module. After testing, the average numbers of collisions, types of collisions, and
average times from the experiments were compared. Also, detailed written reflections were
recorded in a lab notebook immediately after each full experiment in the obstacle course.
Figure 21. Upper body sensors

Kamath 24
Figure 22. Lower body cane
Figure 23. Cane attachment measurements
Cane Height: 91 cm
Cane Length: 144 𝑐𝑚
111 𝑐𝑚
55.5 𝑐𝑚

Kamath 25
Results
Quantitative Data
The results of the first preliminary sensor test are shown in Table 1. Each cell shows the
average reading (from each stream of 57 readings) for each sensor at each measured distance
setting from the wall. The average error per sensor is shown in Table 2.
Table 1. Average sensor readings
Measured (cm) 60.96 91.44 152.40 213.35 304.80
Sensor 1 (cm) 58.82 91.59 149.47 210.78 320.64
Sensor 2 (cm) 58.15 89.69 147.91 208.71 298.58
Sensor 3 (cm) 55.08 88.81 146.27 209.36 299.67
Table 2. Average % error per sensor
± Error (cm)
Sensor 1 4.73
Sensor 2 3.98
Sensor 3 4.75
The results of the sensor test for beam divergence are shown in Table 3. Each cell
represents an average from a stream of 78 distance readings. Cells are highlighted if the prism-
shaped obstacle was detected with ±5 cm of accuracy. Cells are also bolded and underlined if the
obstacle was detected with ±5 cm of accuracy by the sensor directly in front of the obstacle.

Kamath 26
Table 3. Beam divergence data
Tables 4, 5, and 6 show the results of the three experiments in the obstacle course. The
number of collisions per trial with walls and high, medium, and low obstacles are shown. The
last column shows the amount of time it took to complete each trial. A blacked out row indicates
a complete loss of orientation for that trial. Figure 24 is a time vs trial number scatter plot of the
three experiments. Using Excel, a line of best fit was created for each set of data.
Table 4. Experiment 1 data
Total
Trial # High Medium Low Wall Collisions Time (s)
1 1 0 2 1 4 150
2 0 1 0 0 1 92
3 1 0 0 0 1 75
4 0 1 1 0 2 95
5 1 0 0 1 2 88
6 0 0 0 0 0 94
7 0 0 1 0 1 73
8 0 1 1 0 2 105
9 0 0 0 0 0 97
10 1 1 0 0 2 84
11 1 1 1 0 3 131
12 0 0 0 1 1 104
13 0 1 0 0 1 157
14 0 0 1 0 1 110
15 1 0 0 1 2 115
16 0 0 0 0 0 104
17 1 1 0 0 2 106
Obstacle Detection:
Obstacle: Far Left Left Middle Right Far Right
Distance (cm):
30 210 208 208 29 209 209 209 28 198 209 94 27 209 209 208
61 209 209 209 58 62 209 208 58 60 210 62 58 210 209 63
91 210 209 209 88 89 144 90 88 89 209 90 87 209 187 149
122 184 197 210 118 119 121 120 118 119 166 119 118 210 123 120
152 210 209 209 149 150 150 151 148 149 210 152 149 210 208 149
Sensor 1 Sensor 2 Sensor 3 Sensor 1 Sensor 2 Sensor 3 Sensor 1 Sensor 2 Sensor 3 Sensor 1 Sensor 2 Sensor 3 Sensor 1 Sensor 2 Sensor 3
Distance to
wall (cm): 213.35

Kamath 27
18 0 1 0 0 1 95
19 0 0 0 0 0 100
20 0 0 1 1 2 77
21 0 1 0 0 1 74
22 0 0 0 0 0 83
23 0 1 0 0 1 81
24
0
25 0 0 0 0 0 87
26 0 1 0 0 1 102
27
0
28 0 1 0 0 1 80
29 0 0 0 0 0 63
30 0 0 0 1 1 87
31 0 0 0 1 1 67
32 1 0 1 0 2 88
33 0 0 0 0 0 62
34 0 1 0 1 2 89
35 1 0 0 0 1 77
36 0 1 0 1 2 94
37 0 1 0 1 2 126
38 0 0 1 0 1 90
39 1 0 0 0 1 94
40 0 0 1 0 1 127
41 0 0 1 1 2 107
42 0 1 0 0 1 75
Table 5. Experiment 2 data
Total
Trial # High Medium Low Wall Collisions Time (s)
1 0 0 0 0 0 54
2 0 0 1 0 1 51
3 0 0 0 0 0 62
4 0 0 0 0 0 49
5 1 0 0 0 1 121
6 0 0 0 0 0 61
7 0 0 0 0 0 63
8 0 0 0 0 0 60
9 0 0 0 0 0 38
10 0 0 0 0 0 46
11 0 0 0 0 0 55

Kamath 28
12 0 0 0 0 0 103
13 0 0 0 0 0 52
14 0 0 0 0 0 58
15 0 0 1 0 1 35
16 0 0 0 0 0 27
17 0 0 0 0 0 46
18 0 0 0 0 0 33
19 0 0 0 0 0 40
20 0 0 0 0 0 41
21 0 0 0 0 0 38
22 0 0 0 0 0 28
23 0 0 1 0 1 34
24 0 0 1 0 1 53
25 1 0 0 0 1 32
26 0 0 0 0 0 40
27 0 0 0 0 0 37
28 1 0 1 0 2 39
29 0 0 0 0 0 53
30 0 0 0 0 0 35
31 0 0 0 0 0 27
32 0 0 0 0 0 35
33 0 0 0 0 0 34
34 0 0 0 0 0 33
35 0 0 0 0 0 35
36 0 0 1 0 1 32
37 0 0 0 0 0 24
38 0 0 0 0 0 31
39 0 0 0 0 0 40
40 0 0 0 0 0 32
41 0 0 0 0 0 32
42 0 0 0 0 0 38
Table 6. Experiment 3 data
Total
Trial # High Medium Low Wall Collisions Time (s)
1 1 0 0 0 1 36
2 0 0 0 0 0 34
3 0 0 0 0 0 48
4 1 0 0 0 1 34
5 0 0 0 0 0 33
6 0 0 0 0 0 37

Kamath 29
7 0 0 0 0 0 39
8 0 0 1 0 1 26
9 0 0 0 0 0 37
10 0 0 0 0 0 26
11 0 0 0 0 0 25
12 0 0 0 0 0 33
13 0 0 0 0 0 30
14 0 0 0 0 0 22
15 0 0 0 0 0 32
16 0 0 0 0 0 22
17 0 0 0 0 0 23
18 0 0 0 0 0 33
19 0 0 0 0 0 24
20 1 0 0 0 1 38
21 0 0 0 0 0 26
22 0 1 0 0 1 33
23 0 0 0 0 0 41
24 0 0 0 0 0 29
25 0 0 0 0 0 38
26 1 0 0 0 1 37
27 0 0 0 0 0 32
28 0 0 0 0 0 25
29 0 0 0 0 0 27
30 0 0 0 0 0 30
31 0 0 0 0 0 30
32 0 0 0 0 0 30
33 0 0 0 0 0 30
34 0 0 0 0 0 28
35 0 0 0 0 0 25
36 0 0 0 0 0 28
37 0 0 0 0 0 24
38 0 0 0 0 0 28
39 0 0 0 0 0 24
40 0 1 0 0 1 32
41 0 0 0 0 0 32
42 0 0 0 0 0 18

Kamath 30
Figure 24. Time vs trial number
Table 7 is a summary of the time data, and Table 8 shows the results of an ANOVA test
on the times from the 3 groups. Table 9 shows the results of a Poisson test where the decimals in
the high, medium, low and wall columns represent the probability of there being no collisions of
the specified type.
Table 7. Summary of times
SUMMARY of Times
Groups Count Sum Average Variance
Experiment 1 40 3805 95.125 452.1635
Experiment 2 40 1807 45.175 361.8917
Experiment 3 40 1229 30.725 33.99936
0
20
40
60
80
100
120
140
160
180
0 5 10 15 20 25 30 35 40 45
Tim
e (s
)
Trial Number
Time (s) vs Trial Number
Experiment 1 Experiment 2 Experiment 3
Linear (Experiment 1) Linear (Experiment 2) Linear (Experiment 3)

Kamath 31
Table 8. ANOVA test of times
ANOVA of Times
Source of Variation SS df MS F P-value F crit
Between Groups 91348.87 2 45674.43 161.5737 2.18E-34 3.073763
Within Groups 33074.13 117 282.6848
Total 124423 119
Table 9. Collisions Poisson test
Collisions Poisson Test
Total
Experiment # High Medium Low Wall Collisions
1 0.78 0.67 0.74 0.76 0.31
2 0.93 1.00 0.87 1.00 0.81
3 0.90 0.95 0.98 1.00 0.84
Analysis
According to Table 2, all three sensors were accurate to within 5 cm. Therefore, it was
assumed that properly working HC-SR04 ultrasonic sensors are accurate to within 5 cm. Based
on Table 3, an attempt to map beam divergence, the sensor directly in front of the prism always
detected the prism within 5 cm of accuracy to the measured distance. For the left, middle, and
right obstacle positions, beam divergence generally increased, and more sensors (not just the one
aligned directly in front of the prism) picked up on the prism as distance increased. This
phenomenon was a result of beam divergence. However, the left and right sides of the table are
not mirrored perfectly, proving that beam divergence is inconsistent and extremely
unpredictable. There were several scenarios where sensors picked up on the prism in the far right
position. However, the sensors never detected the prism in the far left position. Also, more
sensors detected the prism at the far right position at 122 cm than at 152, further proving the
inconsistency and high sensitivity of beam divergence. This preliminary experiment did not
prove to be very useful; significant sources of error included the alignment of the tape, minor

Kamath 32
measurement errors, and errors with the positioning of the prism on the tape. At 30 cm, no
sensors other than the ones directly in front of the prism detected the prism. Therefore, it was
concluded that 30 cm was a sufficient distance to indicate the closest obstacles (see Figure 18).
Based on Table 7, variance decreased significantly between the three experiments,
proving that consistency improved with each experiment. The p-value of 2e-34 from the
ANOVA test indicates that there is a statistically significant difference between the times of the
3 groups. The results of the Poisson test indicate the probability of having zero collisions for
each experiment. Experiment 1 only had a 31% chance of not having any collisions, and the
average time was 91.125 s. Experiment 2 had an 81% chance of not having any collisions, and
the average time was 45.175 s. Many of the collisions (especially with walls) in experiment 1
were caused by a lack of forward orientation. There was no way for the test subject to know
which way was forward, causing the two complete losses of orientation. The test subject
frequently walked at an angle toward walls and obstacles and collided with them. He often found
that interpreting the vibrations was confusing and overwhelming. Furthermore, the vibration
motors often did not make enough contact with the palm. In experiment 2, the test subject was
able to use the cane to get information about the nature of obstacles rather than the mere
presence of the obstacles. He was able to form a much stronger image of the space in front of
him and the exact position of obstacles, whereas the sensor and vibration motor system from
experiment 1 was far too confusing and unreliable. The increased spatial information resulted in
less collisions, and the test subject could navigate the course with more confidence, causing
lower times. It was concluded that ultrasonic sensors and vibration motors were only useful as a
supplement to the cane. Also, sweeping the tip of the cane along the wall provided information
about the test subject’s orientation. Orientation losses were not as severe in experiment 2, and the

Kamath 33
cane could be used to regain orientation. Nevertheless, the cane had a lot of room for
improvement. It often swept over low obstacles and could not detect protruding/hanging parts of
high obstacles at all. In fact, during all three experiments, collisions with the high obstacle were
often a result of bumping into the protruding hamper on top of the ladder (see Figure 20). The
final prototype was designed to fix the issues encountered during experiments 1 and 2. The
mechanical attachment and magnetometer allowed the test subject to have more confidence and
peace of mind when navigating, causing a 14.45 s decrease in average time and a 91% decrease
in variance. The test subject could sweep the cane along a wall and align himself forward and
then set the reference angle for the magnetometer. Then, no matter where the test subject went,
he could always re-orient himself forward. The attachment hit low obstacles and increased the
detection area of the cane, and the final prototype was 11% more likely to have no low obstacle
collisions than a standard cane. The upper body ultrasonic sensors (connected to vibration
motors) provided a sufficient warning that helped detect the first obstacle(s) encountered in each
trial. However, when obstacles were tightly packed close together, the motors constantly buzzed
and did not provide any information that helped the test subject weave through the obstacles.
Also, the upper body ultrasonic sensors unfortunately did not help with detecting the protruding
part of the high obstacle, and the test subject continued bumping into the hamper, causing high
collisions. In fact, the final prototype was slightly more likely to have medium and high
collisions.
Because the obstacles were arranged by a human for each trial, the arrangements were
not completely random each time, and there may have been biases which could have skewed
times. Also, as seen in Figure 24, the times improved during all three experiments as the test
subject got used to using the devices. Both the second and third experiments used the cane, and

Kamath 34
the decrease in average times and collisions was most likely partially caused by this
improvement. Nevertheless, the significant 91% decrease in variance and the lack of outliers in
the experiment 3 time vs trial plot suggests that improvements in orientation and navigation were
a result of the device itself. The wide spread of data in experiment 2 was a result of orientation
loss and confusion, which also contributed to the higher average time.
Engineering Matrix Max
Criteria Score A B C
1 High Obstacle Detection 10 3.10 8.10 8.40
2 Low Variance of Navigation Times 10 0.00 2.00 9.25
3 Low Cost 2 0.64 1.96 0.38
Total 22 3.74 12.06 18.03
Score (Percent)
17.00 54.82 81.95
Figure 25. Engineering matrix
Conclusions and Future Extensions
Based on the engineering matrix, the prototype from the third experiment is the best aid,
despite its high cost. Though the cane is an extremely powerful yet simple device, the final
prototype has the potential to further improve navigation for the blind. In the future, the device
should be further tested by real blind volunteers during their daily lives. The device the
researcher tested was somewhat crude because it was heavy, unbalanced, and held together by
duct tape and hot glue. If the aid were to go into production, the mechanical attachment and cane
could be improved significantly. Also, more accurate sensors could be used to trigger the
warnings and detect changes in orientation.
Acknowledgements
I would like to thank all the people who have helped develop this project. First, I would
like to thank both my parents for their financial and moral assistance. I would like to thank my
mother for arranging the obstacles during testing. I would also like to thank Mr. Pavel Loven for

Kamath 35
teaching me how to program Arduinos. Furthermore, I would like to thank Mrs. Shiobhan Curran
and Ms. Rachel Johnson for guiding me through the engineering process. Lastly, I would like to
thank Mr. William Ellis for teaching me how to statistically analyze data.
References
Perceiving Depth and Size. (n.d.). Retrieved November 23, 2016, from
http://www.ics.uci.edu/~majumder/vispercep/chap8notes.pdf
Visual impairment and blindness. (2014, August). Retrieved November 23, 2016, from
http://www.who.int/mediacentre/factsheets/fs282/en/
Blindness and Vision Impairment. (2011, February 08). Retrieved November 23, 2016, from
http://www.cdc.gov/healthcommunication/toolstemplates/entertainmented/tips/blindness.
html
Edison, T. (Producer). (2014, April 1). How Blind People Use a White Cane [Video file].
In Youtube. Retrieved November 23, 2016, from
https://www.youtube.com/watch?v=HoeUyyCpStA
Schellingerhout, R., Bongers, R. M., Grinsven, R. V., Smitsman, A. W., & Galen, G. P. (2001).
Improving obstacle detection by redesign of walking canes for blind
persons. Ergonomics, 44(5), 513-526. doi:10.1080/00140130120830
Travel Tools and Techniques of People Who are Blind or Who Have Low Vision. (n.d.).
Retrieved November 23, 2016, from http://www.apsguide.org/chapter2_travel.cfm
FAQ. (2016). Retrieved November 23, 2016, from
http://www.guidedogsofamerica.org/1/mission/
Al-Fahoum, A. S., Al-Hmoud, H. B., & Al-Fraihat, A. A. (2013). A Smart Infrared
Microcontroller-Based Blind Guidance System. Hindawi, 2013, 1-7.
doi:10.1155/2013/726480
Loven, P. (2016, October 30). STEM Project With Arduinos [E-mail to the author].
Kanwal, N., Bostanci, E., Currie, K., & Clark, A. F. (2015). A Navigation System for the
Visually Impaired: A Fusion of Vision and Depth Sensor. Applied Bionics and
Biomechanics, 2015, 1-16. doi:10.1155/2015/479857
Ultrasonic Acoustic Sensing. (n.d.). Retrieved November 23, 2016, from
http://cs.brown.edu/~tld/courses/cs148/02/sonar.html
National Research Council (US) Working Group on Mobility Aids for the Visually Impaired and
Blind. (1986). THE TECHNOLOGY OF ELECTRONIC TRAVEL AIDS - Electronic
Travel AIDS: New Directions for Research - NCBI Bookshelf. Retrieved November 23,
2016, from https://www.ncbi.nlm.nih.gov/books/NBK218025/

Kamath 36
FDA allows marketing of new device to help the blind process visual signals via their tongues.
(2015, June 18). Retrieved November 23, 2016, from
http://www.fda.gov/NewsEvents/Newsroom/PressAnnouncements/ucm451779.htm
FDA approves novel tongue sensor for the blind. (2015, June 19). Retrieved November 23, 2016,
from http://www.fiercebiotech.com/medical-devices/fda-approves-novel-tongue-sensor-
for-blind
BrainPort V100 Vision Aid [Video file]. (2015, November 30). In Youtube. Retrieved November
23, 2016, from https://www.youtube.com/watch?v=k5SKbXlHOZI
Blum, J. (2013). Exploring Arduino: Tools and techniques for engineering wizardry.
Indianapolis, IN: Wiley.
Arduino - ArduinoBoardMega2560. (n.d.). Retrieved November 23, 2016, from
https://www.arduino.cc/en/Main/ArduinoBoardMega2560
Hirzel, T. (n.d.). PWM. Retrieved November 23, 2016, from
https://www.arduino.cc/en/Tutorial/PWM
AB-004 : Understanding ERM Vibration Motor Characteristics. (n.d.). Retrieved November 23,
2016, from https://www.precisionmicrodrives.com/application-notes/ab-004-
understanding-erm-vibration-motor-characteristics
Jeong, G., & Yu, K. (2016, July 12). Multi-Section Sensing and Vibrotactile Perception for
Walking Guide of Visually Impaired Person. Sensors, 16(7). doi:10.3390/s16071070
Coin Vibration Motors. (n.d.). Retrieved November 27, 2016, from
https://www.precisionmicrodrives.com/vibration-motors/coin-vibration-motors
Transducer Beam Spread. (n.d.). Retrieved December 06, 2016, from https://www.nde-
ed.org/EducationResources/CommunityCollege/Ultrasonics/EquipmentTrans/beam
What Does 20/20 Vision Mean? (n.d.). Retrieved December 19, 2016, from
https://www.eyecaretyler.com/resources/how-the-eye-works/what-does-2020-mean/
Nedelkovski, D. (2016, May 16). Ultrasonic Sensor HC-SR04 and Arduino Tutorial. Retrieved
February 14, 2017, from http://howtomechatronics.com/tutorials/arduino/ultrasonic-
sensor-hc-sr04/
Appendix A: Limitations and Assumptions
The preliminary sensor tests conducted on the three ultrasonic sensors were a
generalization of all nine sensors used in the project. It was assumed that all nine sensors would
share the same accuracy and beam divergence characteristics. It was assumed that the Adafruit
magnetometer/accelerometer/gyroscope program was accurate and that the sensor module
Kamath 37
worked the way it should. Also, it was assumed that the marker used as the cane would simulate
a real red and white cane. It was also assumed that walking with one’s eyes closed would
simulate real blindness. Additionally, the obstacle course used during testing was not an accurate
representation of the spaces a blind person would normally encounter; obstacles are not usually
packed so densely together. This project only targeted obstacle detection and orientation; the
final device does not help blind people navigate to locations the way a GPS would. Also, the
final device does not replace vision in any way, and it only offers limited information about
obstacles around the user.
Appendix B: Literature Review Search Terms and Search Engines
Search Terms: echolocation, ultrasonic sensors, aid for blind, assistive devices for the
blind, improving canes for the blind
Search Engines: Google, WPI Gordon Library Database
Appendix C: Code
Preliminary Sensor Tests Code:
int leftTrig = 51;
int leftEcho=50;
int middleTrig=39;
int middleEcho=38;
int rightTrig=47;
int rightEcho=46;
double measurement;
double duration;
double distance;

Kamath 38
void setup() {
pinMode(leftTrig,OUTPUT);
pinMode(leftEcho,INPUT);
pinMode(middleTrig,OUTPUT);
pinMode(middleEcho,INPUT);
pinMode(rightTrig,OUTPUT);
pinMode(rightEcho,INPUT);
Serial.begin(9600);
}
double scan(int trigPin, int echoPin ) {
digitalWrite(trigPin, LOW);
delayMicroseconds(2);
digitalWrite(trigPin, HIGH);
delayMicroseconds(10);
digitalWrite(trigPin, LOW);
duration = pulseIn(echoPin, HIGH);
// Calculating the distance
distance = duration * 0.034 / 2; //sensor algorithm from (Nedelkovski,2016)
return distance;
}
void loop() {
measurement=scan(leftTrig,leftEcho);
//Serial.println("Left Sensor: ");
if(measurement<=117){
//Serial.println("High, ");
Serial.print(measurement);
}
else{
if(measurement>117 && measurement<=233){
//Serial.println("Medium, ");
Serial.print(measurement);

Kamath 39
}
else{
if(measurement>233 && measurement<=350){
//Serial.println("Low, ");
Serial.print(measurement);
}
}
}
Serial.print(" ");
delay(100);
measurement=scan(middleTrig,middleEcho);
//Serial.println("Middle Sensor: ");
if(measurement<=117){
//Serial.println("High, ");
Serial.print(measurement);
}
else{
if(measurement>117 && measurement<=233){
//Serial.println("Medium, ");
Serial.print(measurement);
}
else{
if(measurement>233 && measurement<=350){
//Serial.println("Low, ");
Serial.print(measurement);
}
}
}
Serial.print(" ");
delay(100);
measurement=scan(rightTrig,rightEcho);
//Serial.println("Right Sensor: ");
if(measurement<=117){
//Serial.println("High, ");
Serial.print(measurement);
}

Kamath 40
else{
if(measurement>117 && measurement<=233){
//Serial.println("Medium, ");
Serial.print(measurement);
}
else{
if(measurement>233 && measurement<=350){
//Serial.println("Low, ");
Serial.print(measurement);
}
}
}
Serial.print(" ");
Serial.println("");
delay(100);
}
Experiment 1 Code:
int motor1=13;
int motor2=12;
int motor3=11;
int motor4=10;
int motor5=9;
int motor6=8;
int motor7=7;
int motor8=6;
int motor9=5;
int leftTrig1 = 51;
int leftEcho1=50;
int middleTrig1=39;
int middleEcho1=38;
int rightTrig1=47;
int rightEcho1=46;

Kamath 41
int leftTrig2 = 28;
int leftEcho2 = 29;
int middleTrig2=30;
int middleEcho2=31;
int rightTrig2=52;
int rightEcho2=53;
int leftTrig3 = 32;
int leftEcho3=33;
int middleTrig3=34;
int middleEcho3=35;
int rightTrig3=36;
int rightEcho3=37;
double measurement;
double duration;
double distance;
double near=30;
double medium=60;
double far=90;
void setup() {
pinMode(leftTrig1,OUTPUT);
pinMode(leftEcho1,INPUT);
pinMode(middleTrig1,OUTPUT);
pinMode(middleEcho1,INPUT);
pinMode(rightTrig1,OUTPUT);
pinMode(rightEcho1,INPUT);

Kamath 42
pinMode(leftTrig2,OUTPUT);
pinMode(leftEcho2,INPUT);
pinMode(middleTrig2,OUTPUT);
pinMode(middleEcho2,INPUT);
pinMode(rightTrig2,OUTPUT);
pinMode(rightEcho2,INPUT);
pinMode(leftTrig3,OUTPUT);
pinMode(leftEcho3,INPUT);
pinMode(middleTrig3,OUTPUT);
pinMode(middleEcho3,INPUT);
pinMode(rightTrig3,OUTPUT);
pinMode(rightEcho3,INPUT);
pinMode(motor1,OUTPUT);
pinMode(motor2,OUTPUT);
pinMode(motor3,OUTPUT);
pinMode(motor4,OUTPUT);
pinMode(motor5,OUTPUT);
pinMode(motor6,OUTPUT);
pinMode(motor7,OUTPUT);
pinMode(motor8,OUTPUT);
pinMode(motor9,OUTPUT);
Serial.begin(9600);
}
double scan(int trigPin, int echoPin ) {
digitalWrite(trigPin, LOW);
delayMicroseconds(2);
digitalWrite(trigPin, HIGH);
delayMicroseconds(10);
digitalWrite(trigPin, LOW);

Kamath 43
duration = pulseIn(echoPin, HIGH);
// Calculating the distance
distance = duration * 0.034 / 2;
return distance;
}
double processDistance (int trigPin, int echoPin){
measurement=scan(trigPin,echoPin);
if(measurement<=near){
Serial.println("Near");
if(trigPin==51 || trigPin==28 || trigPin==32){
analogWrite(motor7,153);
}
if(trigPin==39 || trigPin==30 || trigPin==34){
analogWrite(motor8,153);
}
if(trigPin==47 || trigPin==52 || trigPin==36){
analogWrite(motor9,153);
}
}
else{
if(measurement>near && measurement<=medium){
Serial.println("Medium");
if(trigPin==51 || trigPin==28 || trigPin==32){
analogWrite(motor4,153);
}
if(trigPin==39 || trigPin==30 || trigPin==34){
analogWrite(motor5,153);
}
if(trigPin==47 || trigPin==52 || trigPin==36){
analogWrite(motor6,153);
}
}
else{
if(measurement>medium && measurement<=far){
Serial.println("Far");
if(trigPin==51 || trigPin==28 || trigPin==32){
analogWrite(motor1,153);

Kamath 44
}
if(trigPin==39 || trigPin==30 || trigPin==34){
analogWrite(motor2,153);
}
if(trigPin==47 || trigPin==52 || trigPin==36){
analogWrite(motor3,153);
}
}
}
}
Serial.println(measurement);
delay(200);
analogWrite(motor1,0);
analogWrite(motor2,0);
analogWrite(motor3,0);
analogWrite(motor4,0);
analogWrite(motor5,0);
analogWrite(motor6,0);
analogWrite(motor7,0);
analogWrite(motor8,0);
analogWrite(motor9,0);
}
void loop() {
Serial.println("Row 1");
processDistance(leftTrig1,leftEcho1);
processDistance(middleTrig1,middleEcho1);
processDistance(rightTrig1,rightEcho1);
Serial.println("");
Serial.println("Row 2");
processDistance(leftTrig2,leftEcho2);
processDistance(middleTrig2,middleEcho2);
processDistance(rightTrig2,rightEcho2);
Serial.println("");
Serial.println("Row 3");

Kamath 45
processDistance(leftTrig3,leftEcho3);
processDistance(middleTrig3,middleEcho3);
processDistance(rightTrig3,rightEcho3);
Serial.println("");
/*
Serial.println("Row 1");
Serial.println(scan(leftTrig1,leftEcho1));
delay(100);
Serial.println(scan(middleTrig1,middleEcho1));
delay(100);
Serial.println(scan(rightTrig1,rightEcho1));
delay(100);
Serial.println("");
Serial.println("Row 2");
Serial.println(scan(leftTrig2,leftEcho2));
delay(100);
Serial.println(scan(middleTrig2,middleEcho2));
delay(100);
Serial.println(scan(rightTrig2,rightEcho2));
delay(100);
Serial.println("");
Serial.println("Row 3");
Serial.println(scan(leftTrig3,leftEcho3));
delay(100);
Serial.println(scan(middleTrig3,middleEcho3));
delay(100);
Serial.println(scan(rightTrig3,rightEcho3));
delay(100);
Serial.println("");
*/
}
Experiment 3 Code:

Kamath 46
#include <SPI.h>
#include <Wire.h>
#include <Adafruit_Sensor.h>
#include <Adafruit_LSM9DS0.h>
#include <Adafruit_Simple_AHRS.h>
double angle=0;
int speaker=9;
int topTrig=51;
int topEcho=50;
int bottomTrig=53;
int bottomEcho=52;
int motor1=3;
int motor2=5;
int motor3=6;
int near=152;
long duration;
double distance;
double measurement;
// Create LSM9DS0 board instance.
Adafruit_LSM9DS0 lsm(1000); // Use I2C, ID #1000
// Create simple AHRS algorithm using the LSM9DS0 instance's accelerometer and magnetometer.
Adafruit_Simple_AHRS ahrs(&lsm.getAccel(), &lsm.getMag());
// Function to configure the sensors on the LSM9DS0 board.
// You don't need to change anything here, but have the option to select different
// range and gain values.
void configureLSM9DS0(void)
{
// 1.) Set the accelerometer range
lsm.setupAccel(lsm.LSM9DS0_ACCELRANGE_2G);

Kamath 47
//lsm.setupAccel(lsm.LSM9DS0_ACCELRANGE_4G);
//lsm.setupAccel(lsm.LSM9DS0_ACCELRANGE_6G);
//lsm.setupAccel(lsm.LSM9DS0_ACCELRANGE_8G);
//lsm.setupAccel(lsm.LSM9DS0_ACCELRANGE_16G);
// 2.) Set the magnetometer sensitivity
lsm.setupMag(lsm.LSM9DS0_MAGGAIN_2GAUSS);
//lsm.setupMag(lsm.LSM9DS0_MAGGAIN_4GAUSS);
//lsm.setupMag(lsm.LSM9DS0_MAGGAIN_8GAUSS);
//lsm.setupMag(lsm.LSM9DS0_MAGGAIN_12GAUSS);
// 3.) Setup the gyroscope
lsm.setupGyro(lsm.LSM9DS0_GYROSCALE_245DPS);
//lsm.setupGyro(lsm.LSM9DS0_GYROSCALE_500DPS);
//lsm.setupGyro(lsm.LSM9DS0_GYROSCALE_2000DPS);
}
double scan(int trigPin, int echoPin ) {
digitalWrite(trigPin, LOW);
delayMicroseconds(2);
digitalWrite(trigPin, HIGH);
delayMicroseconds(10);
digitalWrite(trigPin, LOW);
duration = pulseIn(echoPin, HIGH);
// Calculating the distance
distance = duration * 0.034 / 2;
return distance;
}
double processDistance (int trigPin, int echoPin){
measurement=scan(trigPin,echoPin);
if(measurement<=near){
analogWrite(motor1,153);
analogWrite(motor2,153);
analogWrite(motor3,153);
}
Serial.println("");
Serial.print("Measurement: ");

Kamath 48
Serial.print(measurement);
Serial.println("");
delay(200);
analogWrite(motor1,0);
analogWrite(motor2,0);
analogWrite(motor3,0);
}
void setup(void)
{
Serial.begin(115200);
Serial.println(F("Adafruit LSM9DS0 9 DOF Board AHRS Example")); Serial.println("");
// Initialise the LSM9DS0 board.
if(!lsm.begin())
{
// There was a problem detecting the LSM9DS0 ... check your connections
Serial.print(F("Ooops, no LSM9DS0 detected ... Check your wiring or I2C ADDR!"));
while(1);
}
// Setup the sensor gain and integration time.
configureLSM9DS0();
pinMode(speaker,OUTPUT);
pinMode(bottomTrig,OUTPUT);
pinMode(topTrig,OUTPUT);
pinMode(bottomEcho,INPUT);
pinMode(topEcho,INPUT);
pinMode(motor1,OUTPUT);
pinMode(motor2,OUTPUT);
pinMode(motor3,OUTPUT);
}
double angle2;
bool first=true;

Kamath 49
void loop(void)
{
sensors_vec_t orientation;
if (ahrs.getOrientation(&orientation))
{
angle2=orientation.heading;
if(first==true){
angle=angle2;
}
if (abs(angle2-angle)>20){
/*
Serial.print("Angle: ");
Serial.print(angle);
Serial.println("");
Serial.print("Angle2: ");
Serial.print(angle2);
*/
Serial.println("TONE");
tone(9,220);
delay(100);
}
else{
noTone(9);
}
}
first=false;
processDistance(topTrig,topEcho);
delay(100);
processDistance(bottomTrig,bottomEcho);
delay(100);
}
Appendix D: Extraneous Tables and Figures
Raw Data from Preliminary Sensor Test 1

Kamath 50
60.96 cm:
Sensor 1
Sensor 2
Sensor 3
57.72 58.00 59.02
56.88 56.27 58.50
57.05 56.92 58.80
55.83 55.71 58.51
54.52 54.40 56.32
53.75 54.40 56.66
53.02 53.07 55.62
51.00 51.26 54.01
49.15 49.16 50.17
51.78 51.17 42.52
55.15 54.50 48.77
60.93 59.76 59.08
62.70 61.13 62.36
62.65 61.74 51.87
63.02 62.32 62.56
63.78 62.48 62.76
61.51 60.50 52.85
60.21 59.28 60.23
59.96 59.16 50.00
58.79 58.89 60.78
59.04 58.97 60.67
59.18 58.92 51.39
58.96 59.30 61.46
58.55 58.70 60.59
59.64 58.70 59.53
61.08 60.06 60.35
61.88 60.23 51.68
59.53 58.62 48.77
59.23 58.36 48.60
59.38 58.55 59.04
60.20 59.13 60.01
59.89 58.87 51.24
59.53 59.04 53.01
59.26 58.41 58.80
91.44 cm:
Sensor 1
Sensor 2
Sensor 3
90.44 88.33 80.27
90.58 88.47 82.04
91.12 89.59 81.58
90.85 89.18 81.43
91.66 90.00 80.95
91.61 89.06 82.50
91.05 88.55 89.88
91.41 88.47 89.81
91.10 89.39 84.97
91.20 89.13 81.87
91.32 89.18 81.62
91.34 89.57 80.78
90.54 88.40 82.09
91.02 88.47 82.93
90.80 89.08 90.02
90.83 89.54 90.03
90.61 89.28 89.90
90.44 88.72 89.27
90.52 88.77 90.12
91.02 88.88 89.83
90.46 89.22 90.17
90.80 88.35 89.76
91.07 88.59 90.46
90.81 89.64 90.22
90.87 89.22 89.84
91.39 89.34 90.29
90.68 88.52 90.34
90.76 89.06 90.07
91.87 89.79 90.36
91.70 90.03 91.00
91.70 90.54 89.98
91.70 90.10 90.64
91.95 90.30 90.90
91.97 90.29 90.78
152.40 cm:
Sensor 1
Sensor 2
Sensor 3
148.89 147.53 149.21
149.06 147.59 147.42
149.48 147.83 147.54
149.01 147.56 149.16
148.41 147.59 148.58
149.45 147.65 148.39
149.79 148.72 148.48
149.53 148.31 148.87
150.54 148.80 148.77
149.86 148.36 149.06
150.33 148.90 149.53
151.56 149.38 149.26
150.28 149.33 140.01
150.69 148.75 141.20
150.20 148.39 148.50
149.62 148.19 148.78
150.25 148.09 148.56
150.21 147.65 148.53
149.09 148.14 148.36
151.27 148.33 148.39
150.40 148.27 149.18
150.67 149.43 149.48
150.13 150.08 149.35
151.01 149.62 149.82
151.22 149.40 150.93
152.63 149.14 151.03
152.07 149.41 149.97
151.42 149.12 141.10
149.75 148.94 149.79
149.96 148.00 148.97
149.57 147.99 148.10
148.38 147.95 147.46
148.63 147.15 147.17
148.39 147.07 146.54

Kamath 51
59.65 59.08 51.46
59.65 58.43 50.64
59.93 58.74 49.69
59.30 58.85 49.30
59.16 58.28 50.83
58.92 58.33 50.30
59.18 58.38 59.43
59.64 58.41 58.74
59.40 58.58 50.49
59.40 58.67 50.32
59.69 58.92 59.23
59.42 58.23 50.49
58.87 58.02 58.84
58.87 58.02 58.43
59.16 58.45 50.83
59.06 58.33 51.41
59.04 58.28 52.07
58.92 58.11 58.60
59.02 58.26 59.52
59.89 58.62 59.36
59.70 58.82 51.44
59.84 59.35 54.98
60.62 59.70 50.81
60.76 60.13 51.09
92.09 90.85 91.04
92.28 90.64 84.71
92.34 90.39 91.80
92.68 90.59 91.39
92.75 90.64 91.15
92.94 90.44 91.38
92.38 90.29 91.26
92.09 89.69 91.31
92.00 89.91 90.83
91.63 90.07 90.56
92.40 90.29 90.85
92.31 90.29 90.78
92.21 90.15 90.68
92.06 90.10 91.36
92.23 89.74 91.02
92.33 90.25 90.71
91.87 89.78 91.51
91.87 90.19 91.15
92.24 90.54 91.04
92.11 90.08 91.92
92.97 90.63 92.11
92.50 91.05 92.06
92.60 91.26 91.04
92.24 90.90 92.41
148.05 147.39 147.05
148.14 147.20 147.51
148.85 146.93 139.15
148.73 147.56 147.99
149.09 148.10 138.62
149.21 146.86 147.58
149.12 147.12 140.23
149.23 148.12 148.05
148.94 147.25 147.68
148.99 147.07 139.98
149.97 147.22 147.39
149.19 147.12 147.46
148.16 148.00 146.90
148.73 147.87 146.93
148.07 146.56 146.86
148.87 146.40 146.90
147.99 147.46 146.40
148.09 147.36 138.81
148.55 147.12 139.60
148.92 147.00 139.49
148.02 146.46 140.83
147.93 146.34 138.31
148.72 146.40 138.36
148.00 147.03 140.25
213.36 cm:
Sensor 1
Sensor 2
Sensor 3
209.70 208.28 209.81
210.39 208.17 209.30
209.59 208.79 209.05
211.99 208.28 208.90
209.93 208.59 209.10
209.30 208.35 208.96
209.12 208.62 208.85
210.27 208.08 208.76
209.54 207.76 208.81
209.63 208.30 209.29
304.80 cm:
Sensor 1
Sensor 2
Sensor 3
301.75 298.86 299.17
301.67 299.20 299.47
302.65 298.61 299.76
301.78 299.15 299.32
301.41 299.12 301.43
302.16 298.57 299.23
303.45 298.59 298.78
302.62 298.62 298.88
302.12 298.59 299.23
302.02 298.96 301.31

Kamath 52
210.10 208.25 208.96
210.43 208.59 208.68
210.56 208.81 209.36
210.14 208.42 209.56
211.28 209.12 209.87
211.21 208.74 209.39
210.72 209.03 209.71
211.84 209.66 210.32
212.33 208.54 209.15
212.48 208.68 209.32
211.68 209.05 210.19
210.02 208.71 209.47
209.85 208.08 208.71
209.44 208.17 209.29
210.85 208.69 209.36
210.14 208.40 209.54
210.75 209.46 209.30
210.80 209.13 209.87
210.41 208.74 209.51
210.65 208.57 209.85
211.41 208.44 209.20
209.85 209.07 210.12
211.58 208.56 209.22
210.34 209.03 209.24
211.23 209.10 209.22
210.56 208.76 208.81
210.78 208.61 210.07
211.84 208.88 209.81
211.58 208.91 209.54
213.13 210.48 210.07
211.57 210.10 210.55
212.84 210.55 210.15
213.61 209.12 211.77
211.87 208.69 209.25
211.46 209.19 211.00
210.27 209.29 209.44
211.50 208.90 209.47
209.70 208.74 208.49
211.79 208.40 208.93
210.05 208.23 208.73
210.68 208.10 208.61
302.07 299.42 299.27
304.25 298.57 300.92
303.23 298.67 299.06
303.89 299.39 301.80
302.53 299.03 299.90
303.74 298.47 299.37
331.87 298.40 301.17
302.58 298.64 299.25
301.82 298.72 301.55
303.11 298.61 300.31
330.75 298.69 299.42
332.49 299.10 299.46
331.08 298.40 299.20
331.02 298.57 300.14
330.96 298.83 300.97
330.33 299.85 300.12
330.87 298.84 299.13
331.98 300.32 300.14
331.13 299.00 299.66
332.25 298.76 299.81
330.46 298.71 299.81
330.79 298.50 299.69
331.45 298.91 299.66
332.13 298.79 299.88
330.19 298.76 300.75
332.18 299.30 301.22
332.16 299.32 299.66
330.48 299.23 299.71
331.55 299.15 300.68
331.69 299.08 301.84
332.30 298.83 299.68
330.29 298.83 299.68
329.66 298.35 298.33
330.12 298.03 298.95
332.81 298.21 299.76
329.27 297.87 299.13
332.27 298.38 298.69
328.93 297.14 299.66
331.31 297.96 299.15
329.19 297.48 298.32
330.24 297.43 298.28

Kamath 53
209.39 208.10 208.32
209.53 208.28 208.30
209.66 208.40 208.85
211.77 208.30 209.32
211.38 208.35 208.51
210.63 208.45 208.57
210.07 208.00 208.96
329.65 297.09 298.93
329.58 297.18 298.44
301.92 298.18 298.98
328.85 297.72 299.27
330.41 297.18 299.25
302.58 298.03 298.01
331.04 297.19 298.44
The raw tables from the beam divergence tests were not included due to the large size of
the tables. Anyone who wishes to view this data should contact the researcher at
Appendix E: Full Patents Referenced
Zeng, X. (Oct 22, 2002). U.S. Patent No. US6469956 B1. Washington, DC: U.S. Patent and
Trademark Office.
Appendix F: Notes
Appendix F Table of Contents
Ultrasonic Helmet Lets Anyone ‘See’ Like a Bat……………………………………………….54
Human Echolocation Waveform Analysis………………………………………………………55
Blind Echolocation Using Ultrasonic Sensors…………………………………………………..56
A Smart Infrared Microcontroller-Based Blind Guidance System………………………………57
Visually Impaired Will Benefit from New Infrared Device: Enactive Torch Helps The Blind To
'See' Without Canes……………………………………………………………………………...58
Choosing an Ultrasonic Sensor for Proximity or Distance Measurement Part 1: Acoustic
Considerations……………………………………………………………………………………59
This Suit Gives You A Real Life Spider-Sense………………………………………………….60
Ultrasonic Distance Detection for Visually Impaired Pedestrians………………………………61
Mobility Devices…………………………………………………………………………………62
Ultrasonic Sensing……………………………………………………………………………….63

Kamath 54
A Navigation System for the Visually Impaired: A Fusion of Vision and Depth Sensor……….64
A Walking Assistant Robotic System for the Visually Impaired Based on Computer Vision and
Tactile Perception………………………………………………………………………………..65
Original URL http://www.popsci.com/ultrasonic-helmet-lets-anyone-
see-bat
File name of PDF
Date written February 9, 2015 Date
Accessed
September 15,
2016
Type of paper Secondary source
Goal of the paper To describe advances in human echolocation
technology
Major findings Vision part of brain lights up during
echolocation
Developing the skill early helps
High frequency bat chirps bounce better than
human voice echoes
Notes on the paper There blind people that can navigate with
echolocation
Bats, unlike humans, can use ultrasonic sound
Human ears aren’t designed for high
frequency sounds unlike bats
Features of Sonic Eye device:
o Bat-shaped ears that have ultrasonic
microphone
o Bat-like chirps
o Very precise
o Captures a lot of spatial information
Vision part of brain lights up
Developing the skill early helps
High frequency bat chirps bounce better than
human voice echoes
Researchers hope to turn the device into a
headband
Biases of the authors Commercial interests of Sonic Eye
My opinions on the paper I think this is a genius and effective device, and
the activity in vision-related parts of the brain
proves that blind people have hope with
echolocation.
Follow up questions and ideas When will this become available for blind people
to purchase?
Keywords Echolocation, spatial audition, soundscape, pinna

Kamath 55
Original URL http://www2.ece.ohio-
state.edu/~passino/humanecholocation.pdf
File name of PDF humanecholocation.pdf
Date written 22 October, 2012 Date
Accessed
September 15,
2016
Type of paper Original Research
Goal of the paper To analyze waveforms and test the limits of
human echolocation
Major findings People can tell shapes apart in short distance
echolocation tests (a few cm)
Notes on the paper It is possible for some blind people to get
around without using a cane
o They use echolocation
Radar sensors and sonar sensors have potential
uses
Previous echolocation studies showed that
blind people performed best and could detect
obstacles around 3-5m away
People can tell shapes apart in short distance
echolocation tests (a few cm)
Middle temporal and cortical regions of brain
activated when echolocating
These are the visual parts of the brain
Biases of the authors
My opinions on the paper The introduction and abstract do not explain the
findings or procedure enough. The description of
former echolocation studies is useful, however.
Follow up questions and ideas What features should an ideal radar device have
based on the study?
Keywords Radar, middle temporal, cortical regions

Kamath 56
Original URL http://ieeexplore.ieee.org.ezproxy.wpi.edu/document/4631900/
File name of PDF
Date written August 26-28,
2008
Date Accessed September 24, 2016
Type of paper Primary source
Goal of the paper To describe an echolocation device for the blind.
Major findings The device detected moving and still objects very
accurately
Undulations in levels (the topography, basically)
was not detected well
Hanging objects were not detected
Objects 0.1-1m away were detected well
Notes on the paper Durability, comfort, ease of navigation, and
detection were the focus
Mowat handheld sensors use the vibration principle
to detect and give blind people information about the
distance from objects
Binaural Sonic Aid: glasses that give audio signals
to both ears about distance to nearby objects
The device in this article:
o “The device detects the nearest object in
front of the user, using two-dimensional
echolocation, and indicates its presence by
triggering an audible alarm”
Not accurate enough when detecting objects on the
ground
Biases of the authors
My opinions on the paper I think this device is OK, but it is too bulky, and it is not
accurate enough. The author of the paper could have done a
much better job explaining the device. It would be better if
the device was wearable.
Follow up questions and ideas What type of ultrasonic sensors were specifically used?
Keywords Ultrasonic sensors, transmitter, reflected impulse,
propagation time

Kamath 57
Original URL https://www.hindawi.com/journals/apec/2013/726480/
File name of PDF
Date written 20 March 2013 Date
Accessed
September 24,
2016
Type of paper Primary source
Goal of the paper To describe an infrared device for the blind.
Major findings Can detect different shapes with over 90%
accuracy
Can detect all combinations of moving and
still obstacles around the person.
Differentiates between different materials.
Notes on the paper Infrared sensors can offer additional
information about the objects
o Like material and shape
“Three simple IR sensors and brings together
all reflective signals in order to codify an
obstacle through PIC microcontroller”
Device: hat and a small pen-sized stick
Doesn’t detect ambient light
Two sensors on hat (right and left)
One on the small stick
The infrared beams form triangles based on
the distance to the object
Vibrating motors were used
Can detect different shapes with over 90%
accuracy
Biases of the authors
My opinions on the paper This was an extremely well-written paper that
beautifully described the device and how the infrared
sensors triangularly reflect information about
obstacles.
Follow up questions and ideas How exactly can you notify the blind person about the
shapes of objects? Can you use this in conjunction
with ultrasonic sensors?
Keywords Infrared sensor, PIC Microcontroller

Kamath 58
Original URL http://www.medicaldaily.com/visually-impaired-will-benefit-new-infrared-device-enactive-torch-helps-blind-see-without-297540
File name of PDF
Date written 11 August 2014 Date
Accessed
September 28,
2016
Type of paper Secondary source article
Goal of the paper To describe an infrared device for the blind.
Major findings An infrared device was created that is equal in function to the
cane
Notes on the paper Blind people don’t like canes much
o Bump into cracks
o Slip under too many objects
Enactive Torch connected to wristband
Vibrates harder as infrared sensor detects obstacle closer
More compact version in production
Can help children fit in
Biases of the authors
My opinions on the
paper
This article did a decent job explaining the device and its benefits. Its
convenience is emphasized since it performed as well as the cane, but
it is smaller.
Follow up questions
and ideas
I want to know what steps the creators will take to make the device
more common.
Keywords Infrared sensor

Kamath 59
Original URL http://www.sensorsmag.com/sensors/acoustic-ultrasound/choosing-
ultrasonic-sensor-proximity-or-distance-measurement-825
File name of PDF
Date written February 1, 1999 Date
Accessed
October 2, 2016
Type of paper Secondary source article
Goal of the paper To describe the factors that affect ultrasonic sensors
Major findings sound waves loose amplitude through transmission through air
humidity affects attenuation
Notes on the paper transducers release the sound
temperature affects speed of sound and sensor’s calculations
wavelength dependent on speed of sound and the frequency
sound waves loose amplitude through transmission through air
loss of amplitude increases with frequency
humidity affects attenuation
Biases of the
authors
My opinions on
the paper very technical
too specific for this particular project, but good for locating
potential sources of error in the sensors
Follow up
questions and
ideas
where are the best sources to find accurate sensors?
Keywords humidity in ultrasonic sensors, wavelength

Kamath 60
Original URL http://www.forbes.com/sites/alexknapp/2013/02/23/prototype-suit-gives-
you-real-life-spider-sense/#6b192b377f2d
File name of PDF
Date written February 23, 2013 Date
Accessed
October 2, 2016
Type of paper Secondary source article
Goal of the paper To describe an ultrasonic suit created by a PhD student at the University
of Illinois
Major findings it works fairly accurately
95% of the time the students could detect the oncoming attacker
Notes on the paper used ultrasonic sensors
motors exerted pressure on skin
7 different sensors
3 pounds
$500 cost to build
Biases of the
authors
My opinions on
the paper
Follow up
questions and
ideas
when will these types of devices become more common for the
blind?
Keywords

Kamath 61
Original URL https://www.google.com/patents/US6469956
File name of PDF Ultrasonic distance detection for visually impaired pedestrians
Date written October 22, 2002 Date
Accessed
October 2, 2016
Type of paper Patent
Goal of the paper To describe an ultrasonic device for blind pedestrians
Major findings human voice works better than vibration
Notes on the paper Glasses with earphones on the sides
Ultrasonic sensor to sense distance
converts the distance to # of user strides
vibrations are too confusing
instead communicates # of strides to user
sends audio message into ear of
o too close
o one step
o two steps
o three steps
human voice
Biases of the
authors
My opinions on
the paper This device might seem confusing with so much input constantly
coming in.
Follow up
questions and
ideas
Keywords

Kamath 62
Original URL http://www.tandfonline.com.ezproxy.wpi.edu/doi/abs/10.1080/001401
30120830#aHR0cDovL3d3dy50YW5kZm9ubGluZS5jb20uZXpwcm9
4eS53cGkuZWR1L2RvaS9wZGYvMTAuMTA4MC8wMDE0MDEz
MDEyMDgzMD9uZWVkQWNjZXNzPXRydWVAQEAw
File name of PDF
Date written 2001 Date Accessed October 5, 2016
Type of paper Primary Source
Goal of the paper Improving obstacle detection by redesign of walking canes for blind
persons
Major findings
Notes on the paper Blind people sweep the cane side to side to find
o objects in the path
o changes in surface
o integrity of surface foot is going to be placed on
People have reported that the cane tends miss obstacles
Smaller the angle, more detection
Canes make 35 degree+ angle, too much
Canes get stuck and can get jammed
Cumbersome/heavy
Bystander attention
Poor obstacle and step detection
Biases of the authors
My opinions on the
paper
Follow up questions
and ideas
Keywords

Kamath 63
Original URL http://www.ab.com/en/epub/catalogs/12772/6543185/12041221/12041
229/print.html
File name of PDF
Date written Date Accessed October 8, 2016
Type of paper Secondary Source
Goal of the paper Technical information on ultrasonic sensors
Major findings
Notes on the paper blind zone of a sensor:
o “If the ultrasonic beam leaves the sensor, strikes the
target, and returns before the sensor has completed its
transmission, the sensor is unable to receive the echo
accurately”
sensors emit cone
o cone can be variable through potentiometer
must space sensors so that beam angles do not interfere
usually detect obstacles 3 degrees+ to parallel the transducer
look for noise suppression circuitry
use temperature sensors to get a more accurate value for the
speed of sound
photoelectric sensors are another option
Biases of the authors
My opinions on the
paper
Follow up questions
and ideas

Kamath 64
Original URL https://www.ncbi.nlm.nih.gov/pmc/articles/PMC4745441/
File name of PDF
Date written 18 August 2015 Date Accessed 24 October 2016
Type of paper
Goal of the paper Create a Kinect-based
Major findings Device works reasonably well indoors, not too well outdoors in
sunlight
Notes on the paper Uses Kinect corner and depth sensors
Ultrasonic sensors may be inaccurate due to sound absorption
Speckled pattern infrared projector on Kinect
o compares reference to actual points to sense depth
o shadows and blind spots cannot detect light
o sunlight clouds infrared sensor
converts depth image to pixeled depth map
uses voice commands to give information
2 types of obstacles
o walls/complete obstructions
o things like chairs that can be avoided by switching
direction
tried on a blind person and a visually impaired person
useful when used with white cane, identifies objects earlier
Biases of the authors
My opinions on the
paper
Follow up questions
and ideas

Kamath 65
Original URL http://link.springer.com/article/10.1007%2Fs12369-015-0313-z
File name of PDF A Walking Assistant Robotic System for the Visually Impaired Based
on Computer Vision and Tactile Perception
Date written 30 July 2015 Date Accessed 25 October 2016
Type of paper
Goal of the paper Create a Kinect-based vibro-tactile belt device for the blind
Major findings
Notes on the paper “vOICe uses a head mounted camera to capture environment
information and converts image information into sound output
for the visually impaired”
Kinect gathers depth data
Ultrasonic sensor detects additional obstacles and surface
safe direction voice messages and obstacle messages
Biases of the authors
My opinions on the
paper I sort of wanted to use the Kinect, but I think it is a bit too
complicated and ultrasonic sensors can do the job just as well.
Follow up questions
and ideas
Top Related