


Languages
Pages
Legal


Working Paper Series, Paper No. 12-02
Insolvency in English professional football:
Irrational Exuberance or Negative Shocks?
Stefan Szymanski†
October 2012
Abstract
Insolvency is an endemic problem in the world of European football. This paper uses a
unique database of financial accounts for English football clubs between 1974 and 2010 to
examine the causes of insolvency. Two alternative hypotheses are considered- “irrational
exuberance”, meaning that owners attempt to achieve a significant improvement in league
position which is not affordable, leading to financial crisis. This view seems widely espoused
and seems to lie behind initiatives such as UEFA’s Financial Fair Play. An alternative is that club
finances are subject to negative shocks – either to productivity or to demand- and that a series of
such shocks can lead to insolvency. The empirical model provides evidence in support of this
alternative hypothesis.
JEL Classification Codes: L83, G33, G38
Key Words: Insolvency, football, soccer
I have benefited from the comments of Christopher Anderson, John Beech, Mike Leeds, Thomas
Peeters and Ron Smith, as well as conference participants at the 7h Gijon Sport Economics
Conference, the 2012 Western Economics Association meetings and the 2012 conference of the
European Sports Economics Association. I thank Jobin Abraham, Jean-Paul Bewers, Blake
Bogdanovich, Jake Kaufman, Tom Lambert, Ben Manko, Karan Mirpuri, Akeeb Patel, Patrick
Spicer, Cedrick Song, Robert Snyder, Robert Vanderpluijm, Valeriya Vitkova, Naglis
Vysniauskas for their research assistance. I am grateful to Cass Business School and the
University of Michigan UROP Program for their financial support.
† Department of Kinesiology, University of Michigan, 3118 Observatory Lodge 1402
Washington Heights, Ann Arbor, MI 48109-2013. Tel: (734) 647-0950, Fax: (734) 647-2808,
email [email protected]

2
1. Introduction
Insolvency is a chronic problem in the world of professional Association football, the world’s most
popular sport.1 According to the UEFA 2010 Club Licensing Report (UEFA2(2012a)), 56% of European
clubs participating at the highest level of national competition were loss-making in 2010 and 36%
reported negative net equity. From 2013-14 the eligibility of a club to play in international UEFA
competitions will be assessed in relation to minimum financial criteria, including an assessment that it is
a going concern, has no overdues payable and no negative equity (these regulations are known as
Financial Fair Play). UEFA reported that 56% of clubs failed to meet at least one of these criteria in 2010.
Nor is this a recent phenomenon; financial crises in football are frequent and well documented.3
In the top division of English football, the FA Premier League (FAPL), only one club has ever formally
entered insolvency proceedings (Portsmouth Football Club in 2010). However, insolvency proceedings
are commonplace in the lower divisions of English football, and there were 66 cases of legal insolvency
proceedings among English clubs participating in the second, third and fourth tiers of English football
between 1982 and 2010.4 Because of the competitive institution known as “promotion and relegation”5
(through which a number of the worst performing teams in a given tier are automatically sent down to
play in the next lower tier at the end of the season, to be replaced by the best performing teams in the
1generally known as “football” in most of the world, but also often referred to as “soccer”, especially in North America.
2 UEFA is the governing body European football
3See e.g. the symposium in the Journal of Sports Economics on the Financial Crisis in Europe, Lago et al. (2006), Szymanski and Smith (1997) and Jennett and Sloane (1985). A UK government report in 1968 revealed substantial losses among professional football clubs and commented “Ominously, clubs were in financial debt in inverse ratio to their likely capacity, in terms of playing success, to pay it off” (Department of Education and Science, p41). “If these clubs continue to incur losses at the present rate or at an increased rate, one must ask who will take responsibility for the accumulated deficits in, say, a decade’s time, or even less? Is it possible for them to remain in existence or will there be increasing insolvency?” Ibid, p45.
4The tiers are generally known as divisions, and the words will be used interchangeably here, but some care is required since the names of the divisions have changed over time. Hence the FAPL was formerly known as the First Division, the Football League Championship was formerly known as the Second Division, and for a short while as the Football League Division One, the third tier has been called the Third Division, the Second Division, and is now Football League One, and the fourth tier was known as the Fourth Division, then the Third Division, and now Football League Two. To avoid confusion I shall simply refer to the first, second, third and fourth tiers.
5This system is almost universal in the football world, but unknown in the professional major leagues of North America.

3
lower tier) it can and does happen that a club going into insolvency has in recent history played in a
higher tier, including the FAPL.
This paper draws on a unique accounting database for English professional football to examine the
causes of insolvency. Generally speaking, there is a perception that insolvent clubs have been
excessively profligate, living beyond their means, a kind of irrational exuberance. Thus the pre-amble to
Financial Fair Play Regulations claims that they will, inter alia, “introduce more discipline and rationality
in club football finances” (UEFA (2012b), p2). On this view insolvency is the result of systematic errors in
management that can be predicted and then eliminated.
An alternative view is that financial failure and insolvency is a consequence of random, negative shocks.
Clubs spend resources in the pursuit of sporting success (supply) which then generates revenues
through ticket sales, merchandising and broadcast income (demand). Given that there exists a large and
relatively transparent market for playing talent and a reliable relationship between success and fan
interest, it is possible to model these relationships with a good degree of precision. When clubs invest
they generally have an understanding, possibly tacit, of these relationships. However, there can be
negative productivity shocks to the investment-performance relationship (bad luck on the field) or
negative demand shocks to the performance-revenue relationship. A good example of the latter was the
unexpected collapse of the ITV Digital broadcast contract6 in March 2002, involving a loss equivalent to
about 10-20% of annual income for the clubs affected. Within one year 12 clubs entered insolvency
proceedings.
The richness of the accounting data used in this paper and the objectivity of the performance data
(league position) mean that it is possible to estimate these relationships and hence derive a measure of
shocks. The data shows that insolvency events are indeed significantly influenced by negative
productivity and demand shocks over a period of years. Moreover, there is little evidence that teams
have been “irrational” or “undisciplined”, at least in the sense of spending to achieve league positions
significantly higher than the norm in periods leading up to insolvency. Generally speaking, insolvent
teams have been declining, in the sense of achieving lower leagues positions and being relegated to
6Properly speaking, what was unexpected was that the Football League, which signed the contract on behalf of the clubs, had failed to ensure that the wealthy parent companies of ITV Digital had signed the guarantees which they had agreed to provide, rendering the guarantees unenforceable.

4
lower divisions, for several years before becoming insolvent. Given this evidence, it is not clear that
discipline and rationality will avoid further insolvency events in the future.
The next section is divided into four parts – an overview of the fragility of English football clubs, a brief
description of English insolvency law, a simple model of financial distress for football clubs and a
discussion of the accounting literature on modeling insolvency. Section 3 describes the regression model
and reports the results and section 4 concludes with a discussion of the some of the implications of this
study.
2. English football and insolvency
While financial crises have been a feature of professional football in most countries around the world,
the English case is easiest to analyse because English football clubs have been limited liability companies
since the 19th century and under English law all limited liability companies have to publish annual
accounts available for public inspection. Moreover, the date on which a limited company enters
insolvency proceedings is also a matter of public record. The data used in this paper covers the four
professional divisions of English league football over 37 seasons from 1973/74 to 2009/10.
In each season this amounts to a total of 92 clubs, but due to promotion and relegation from the fourth
tier the database includes 109 clubs. Two thirds of the teams were present in all 37 seasons, and only 12
clubs were present for fewer than 10 seasons. Given that the league position is known for every team,
the data represents the entire population (3404 club seasons) rather than a sample. The financial
information was obtained from Companies House.7 The data includes a full set of accounting
information for 87% of the 3404 club seasons, plus abbreviated accounts for a further 8%, leaving only
5% of club years for which there is no accounting information.
7 financial information for the last decade or so at least can downloaded for a small fee from this website http://wck2.companieshouse.gov.uk/c3e6ddbd60434f4088c2fcfcf1db83ac/wcframe?name=accessCompanyInfo. Data from 1974 to around 2000 can be obtained by request on a CD-rom. Prior to 1974 they have only paper records.
5
(a) An overview of financial fragility in English football
Figure 1 illustrates the frequency of insolvency proceedings and contrasts it with the level of
attendance. It is striking that the frequency of insolvencies seems to vary inversely with the trend in
attendance. Whilst it is possible to associate the cluster of insolvencies in the early 1980s with the steep
fall in attendance between 1980 and 1985 (which was in turn associated with a severe recession in the
UK), the frequency of insolvencies in the last two decades coincide with rapidly growing attendance.
Figure 1 here
Attendances are a crude indicator of the financial wellbeing of a football club; revenues also depend on
prices, broadcast and ancillary income. Figure 2 shows the trend in real (inflation adjusted) average club
income by division from 1974 to 2010. The aggregate revenues of clubs in the top division have grown at
9.3% per year on average for 37 years, a 24-fold increase in real terms. This is an extraordinary rate of
growth over such an extended period of time. While real growth rates have been less spectacular in the
lower divisions, they have still been well in excess of the average real growth rates recorded by the UK
economy over the period. At the aggregate divisional level revenue growth rates are not volatile and
while negative in some years, in percentage terms declines are generally small.
Figure 2 here
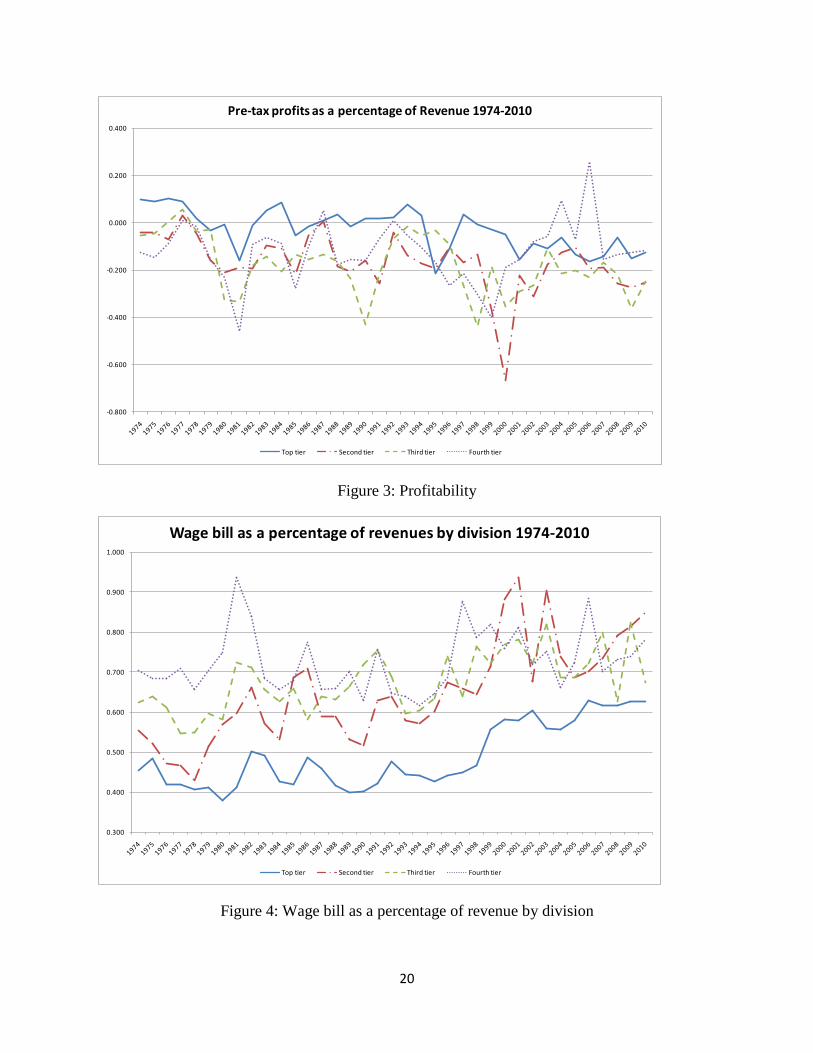
Despite this rapid rate of growth, clubs have rarely managed to generate significant profits, as shown in
figure 3. In each division total reported profits are seldom above zero. Given that profitability data is
available for only 85% of the population and that accounts are often not available during insolvency,
figure 3 probably overstates the average level of profitability. While some individual clubs may have
sustained profits over some years, on average few do better than breakeven, and many do substantially
worse.
Figure 3 here
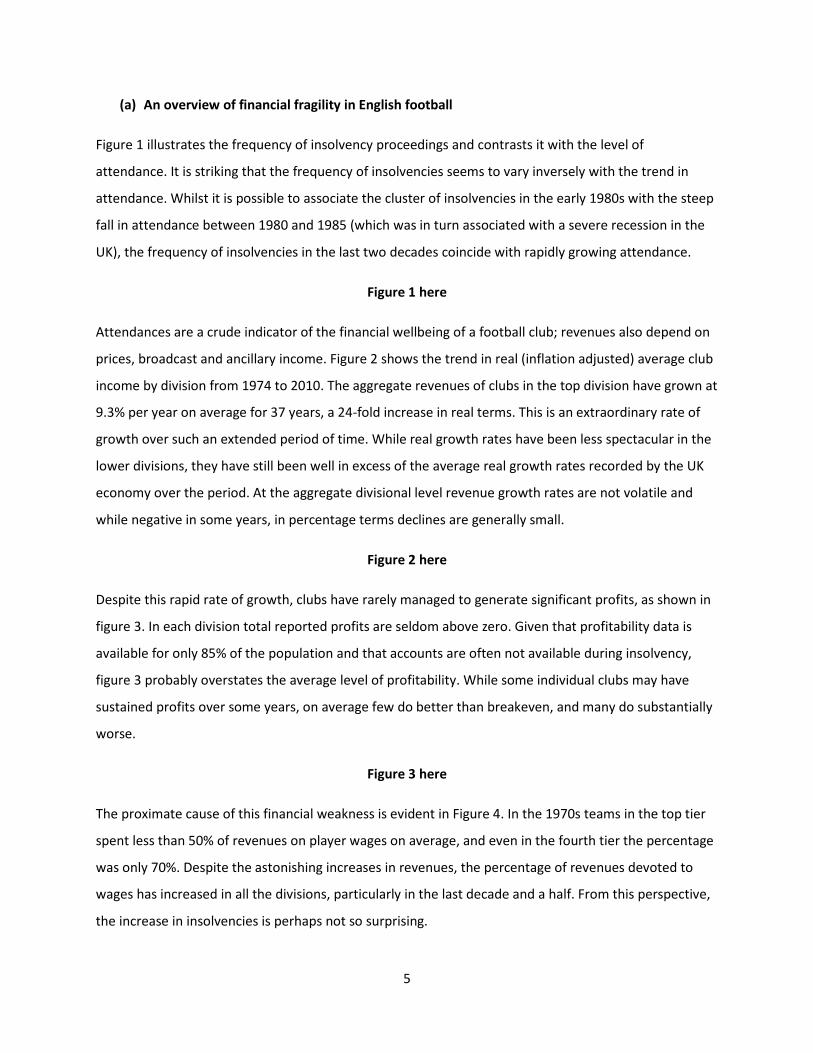
The proximate cause of this financial weakness is evident in Figure 4. In the 1970s teams in the top tier
spent less than 50% of revenues on player wages on average, and even in the fourth tier the percentage
was only 70%. Despite the astonishing increases in revenues, the percentage of revenues devoted to
wages has increased in all the divisions, particularly in the last decade and a half. From this perspective,
the increase in insolvencies is perhaps not so surprising.

6
Figure 4 here.
(b) Insolvency
Insolvency law8 is complex and country specific. In English law a creditor can apply to a court to have
the company wound up and its assets sold to repay creditors, usually under the temporary management
of a professional insolvency practitioner (see e.g. Finch (2009), chapters 1 and 2). The purpose of the law
is to protect creditors from in cases where a business is continuing to trade and incur liabilities when
there is no realistic prospect of repayment. By the early 1980s it was widely perceived that the law gave
undue power to certain creditors and too frequently provoked the winding up of companies that were in
fact, given a reasonable settlement with creditors, capable of surviving as a (profitable) going concern
(Cork (1982)). The Insolvency Act of 1986 significantly altered the law and extended a process known as
“administration”, whereby a company could place itself under the management of an insolvency
practitioner whose job is to reach an agreement with creditors so that the business can survive (thus the
legislation is akin to Chapter XI in US bankruptcy law).
By the end of the 1990s there was a consensus that the 1986 Act was still failing to ensure that viable
companies could be rescued from liquidation (see e.g. Review Group (2000)). In particular it was argued
that it continued to be difficult for a company to negotiate a write-off with its creditors. Thus the 2002
Enterprise Act created greater incentives for negotiation and placed more power in the hands of
company directors to reach a voluntary arrangement.
Most of the insolvencies of English football clubs have involved either administration or a company
voluntary arrangement. Whatever the perceived failings of insolvency law in the wider economy,
football clubs have survived. Although there are 67 recorded cases of formal insolvency proceedings in
the population between 1982 and 2010, 849 of the clubs that participated in the four divisions in 1982
also did so in 2010, while all but two of the remaining clubs were relegated to play in fifth tier.10 Even
when the limited liability company that owned the football club has been liquidated, the football club 8 Under English law insolvency relates to corporations, bankruptcy to individuals.
9One team, formerly Wimbledon, relocated to Milton Keynes and was renamed MK Dons.
10Newport County and Halifax Town were closed down before being (almost immediately) reformed by fans, and made to start at the bottom of the competitive pyramid. Aldershot were forced to resign from the league in 1992 without completing their fixtures, but were later reformed. Maidstone United, whose insolvency occurred after they had resigned from the fourth tier, were reformed with a longer lag.

7
has been taken over by a new limited liability company. But in most cases the company itself survives,
having reaching a deal with its creditors.
This unusual phenomenon arises from three special features of the industry. First, when a football club’s
performance on the field deteriorates it loses support, but there is always a small number of diehards
prepared to stand by the club, and thus at almost any level of play it can generate some income. Second,
a club can always adjust its wage bill to its current status. While competition for talent is intense, this is
also a large supply of players, and at the lower levels individuals are willing to play for almost nothing
(usually in the hope of gaining recognition and playing at a higher level). Third, the principal asset of any
club is usually its stadium. In an unrestricted market the value would reside almost entirely in the land
which could profitably be converted to commercial or residential uses11. However, local planning
authorities seldom permit this to happen since they value the sense of community that a football club
creates. Hence the only viable use of the assets of an insolvent football club is to continue operating as a
football club.
Since the change in the law in 2002 the football authorities have become concerned that clubs owners
are using the insolvency laws to write-off debt and obtain a competitive advantage. With the help of a
friendly administrator a club can pressure creditors to agree to write-off most of what they are owed,
allowing the club to emerge from administration as a more competitive entity. Since 2005 the football
authorities have applied a sporting penalty for entering administration in the form of a deduction of
points in the season following the start insolvency proceedings.
Given these peculiar features, it might be wondered how clubs obtain access to credit in the first place.
Insolvencies have become relatively frequent but the sums of money involved are relatively small. In
2009/10 the total revenue across the four divisions totaled £2.5 billion, but the average turnover of
clubs in the second tier was only £19 million in the second tier, £9 million in the third tier and £3 million
in the fourth. Clubs frequently obtain overdrafts from a local bank, and in most years clubs are able to
service these loans. Moreover, the largest creditors are usually the tax authorities (payroll taxes and
VAT). Since by law these are paid in arrears, the tax authority cannot avoid becoming a creditor.
11 many stadia in England, having been built over a century ago, are located in prime sites in cities that have grown significantly

8
(c) A behavioural model
The simple model of Szymanski and Smith (1997) can be adapted to focus on the issue of insolvency.
That paper estimated two relationships, now well established in the football finance literature. First,
league performance is highly correlated with player wage spending (see e.g. Hall et al (2002), Simmons
and Forrest (2002, 2004), Torgler and Schmidt (2007), Carmichael et al (2010))12. This should be
expected given the large numbers of buyers and sellers in the market, the widespread availability of
data on player ability (most players perform in public up to 50 times per year), the desire of teams to
win and the eagerness of players to make money. Hence we can write
(1) Pi = a + b 𝑤𝑖∑ 𝑤𝑖
+ εi, a,b> 0
Where Pi is league position, which runs from 1 to 92 in the case of English professional football, w are
wages and 𝑤𝑖∑ 𝑤𝑖
is the Tullock contest success function – money buys talent and talent produces success
(for an analysis of contest theory and sports leagues see Szymanski (2003)) and εi is a random
productivity shock.
The second relationship is between club revenues and league position- more successful clubs generate
larger revenues, which is, ceteris paribus, equivalent to saying that demand is increasing in the quality of
home team (see e.g. Dobson and Goddard (2011), Buraimo et al (2007), Cox (2012)). This can be written
as
(2) R(Pi) = c + dPi + ηi , c, d> 0
Where ηi is a random demand shock. Profit is simply (2)-(1):
(3) πi = R(Pi) - wi
Ever since the work of Sloane (1971) it has been a widespread view among academics that football clubs
in Europe are not profit maximisers (unlike North American sports franchises), but rather win
maximisers (Késenne (1996)), so that all available income is spent on playing talent. “Available” here
may also entail a soft budget constraint (see Andreff (2007) and Storm (2012)). Thus the objective of the
owner can be written as
12 Were there any doubt about the relationship, the crude way in which Chelsea and Manchester City have bought Championship titles in the FAPL in recent years should be enough to convince.

9
(4) Max Ωi = απi + (1 – α) Pi subject to πi ≥ k
where k may be negative if the club faces a soft budget constraint. Assuming that the expectations of
the random shocks are zero, then the symmetric Nash equilibrium when α = 1 is
(5) w = bd(n-1)/n2
where n is the number of clubs and expected profits are
(6) πi = ad + c + bd/n2 + dεi + ηi
For large n this expected profit is positive and equal to ad + c > 0.
For 0 < α < 1
(7) w = (n-1)/n2 (αbd + 1 – α)/α
so that ∂w/∂α < 0. Thus as α decreases (a greater emphasis on winning)
• wage spending increases, even though in the symmetric equilibrium the expected league
position is constant and equal to 1/n
• The profits of the firm are driven down and may no longer be positive
• Even if profits fall to zero in expectation, a random shock may be sufficient to generate
economic losses.
In this context one might interpret UEFA’s “discipline” to mean a regulated value of k, and “rationality”
to mean a higher value of α. However, UEFA also argues that “sport is not simply a business like any
other” and would not like to see clubs run as purely profit making ventures. Rather, they argue
“Financial fair play means clubs not getting into a spiral of debt to compete with their rivals”13. One way
to interpret this is to think of the asymmetric version of the model. If some clubs are able to generate
more revenue from a given level of success or more success from a given level of wage expenditure,
then this would involve a degree of competitive imbalance. If the weaker team attempted to remove the
imbalance by high levels of spending (and borrowing), this might end up with a team driving itself into
insolvency. A testable result of this interpretation is that teams which end up in insolvency should have
13 The Values of UEFA for European Football’s Future, published: Friday 27 March 2009, http://www.uefa.com/uefa/aboutuefa/organisation/congress/news/newsid=813447.html

10
experienced a significant improvement in performance (due to unsustainable spending and borrowing)
some time prior to becoming insolvent.
The alternative hypothesis is that insolvency is a consequence of negative shocks, to performance (1),
revenue (2) or both.
(d) Modeling insolvency
There is considerable interest in the accounting and finance literature in the causes and ultimately the
prediction of bankruptcy. The accounting literature is usually traced back to Altman (1968) who used
discriminant analysis to develop a prediction tool for bankruptcy (the Z Score) based on five well known
accounting ratios –working capital/total assets, retained earnings/total assets, earnings before interest
and taxes/total assets, sales/total assets and market value of equity/book value of total liabilities. The
weight to attach to each of these ratios is derived by matching insolvent businesses with a sample of
businesses with similar characteristics (e.g. size and industry). Such models have been widely used by
practitioners to assess bankruptcy probabilities. In more recent times logit models have been developed
(e.g. Ohlson (1980), Jones and Hensher (2004)). One problem with these approaches is that the
accounting variables are often not very informative, while the businesses themselves are
heterogeneous, even within industry groups, and so predictive performance is not strong (see e.g.
Ohlson pp124-130 and Peat and Jones (2012)). More recently attention has focused on whether
information contained in share prices might not be a better predictor of insolvency, given that under the
efficient market hypothesis the share price should contain all relevant information. Hillegeist et al (2004)
show that an option pricing model can improve on the best alternative ratio-based indicator, but while
the difference is statistically significant it does not appear large in absolute terms.
Two papers have used data to analyse financial distress of football clubs.14 Barajas and Rodriguez
(2010) used accounting data to test for the probability of insolvency for Spanish football clubs. They
found that accounting measures similar to those used in the mainstream literature had no significant
14Beech at al (2008) provide an extremely useful historical account of insolvency events in English football. Madden (2011) develops a welfare theoretic model concerning the negative externality that may be created by “excessive” spending by “sugar daddies”.

11
effect (although they questioned the reliability of the accounting data), while presence in the top
division significantly reduced the probability of insolvency.
Leach (2006), who uses a similar methodology to the one that will be adopted here, looked at the same
population of football clubs over eleven seasons between 1990 and 2001. She estimated the
relationships (1) and (2) above in error correction form and then used the residuals from these
equations to explain (a) company credit ratings and (b) financial distress, in the form of adverse
comments by the auditors in the company report and accounts. She found that negative residuals
(meaning either a worse than expected league position conditional on wage expenditure, or lower than
expected revenues conditional on league position) had a statistically significant adverse effect on credit
ratings and raised the probability of adverse audit opinions.
3. Regression model and results
One interpretation of a lack of “discipline and rationality” is that clubs have attempted achieve a
position in the league than is unsustainable. One kind of supportive evidence for this would be that prior
to insolvency clubs had first risen significantly in the league, only to collapse later. The evidence of the
path to insolvency does not seem consistent with this.
The solid line in figure 5 shows the average league position of the 48 clubs that entered insolvency
proceedings (for the first time) since 1982, from 22 years before the event to 28 years after the event
(league position is treated as if continuous across divisions, so that top of the Premier League is 1,
bottom of the Premier League is 20, top the Football League Championship is 21, and so on down to 92).
The number of observations is shown by the dotted line - for the 22 years before the event there are
between 45 and 48 observations (three of the insolvent clubs had only entered the four divisions within
a few years of becoming insolvent). The chart shows that in the seven years prior to insolvency league
position declines from an average of 47 to 63 (16 places, which almost inevitably entails relegation),
while in the five years before that league position is stable between 47 and 49. There is some evidence
of an improvement of league position takes place in the between 20 and 12 years before entering
insolvency, but the rise is relatively small, from 54 to 47 = 7 places, or less than half a division.
Figure 5 here

12
Figure 5 also shows that by around ten years after the insolvency event league position reverts back to
the level it stood at before the pre-insolvency decline. Unfortunately the sample size declines quite
rapidly after insolvency, and so some caution is required in interpreting the data more than ten years
after insolvency.
The panels in Figure 6 illustrate the distribution of changes in league position for clubs entering
insolvency for the first time. Bars to the right of “0” indicate that the club had a higher league position at
the date of insolvency than at this prior date. As might be expected the distribution is more widely
dispersed the further back one goes, but around three quarter of the clubs were in a lower league
position at the date of insolvency than in any given prior year. This confirms the impression given by
figure 5- most clubs entering insolvency have been in decline for some time.
Figure 6 here
Table 1 further illustrates this tale of decline. Panel (a) shows the percentage of the previous ten
seasons that insolvent clubs had spent in different divisions. There were no clubs in the top tier at the
date of their first insolvency.15 The teams that went into insolvency in the second tier had on average
spent 48% of the previous ten seasons in the same tier, 47% in the top tier and only 5% of their time in
the third tier. For each tier at the date of insolvency, it seems clear that the teams had spent more of
their time in the upper tiers, and thus experienced relegation, rather than having first risen from a lower
tier.
Table 1 here
For comparison panel (b) shows the how the clubs in each division in 2010 were spread across the
division in the previous decade. In the second tier teams had spent more time in the lower tiers than the
top tier, while in the third tier they had spent approximately the same amount of time in higher and
lower tiers. In the fourth tier teams had spent more time in higher tiers, but to a lesser degree than was
the case for insolvent clubs.
This evidence suggests that insolvency is primarily a consequence of relative decline. However, to make
this more specific a regression model is helpful. The natural starting point is to estimate the
15 Portsmouth, the only team to enter insolvency while in the FAPL (in 2010), had already been through an administration process in 1999.

13
relationships analogous to (1) and (2) above. Augmented Dickey-Fuller tests were run to test whether
league position is stationary or trend-stationary and in both cases the hypothesis could be rejected for
all but around 20% of clubs (see appendix). Following Leach (2006) an error correction framework is
adopted and so (1) and (2) become
(1’) ∆lnpit = β0 + β1lnpit-1 + β2∆lnpit-1 + β3lnrelwit + β4∆lnrelwit-1 + promotion/relegation dummies +
division/tier dummies + wage/tier interaction dummies + εit
Where lnp is the log odds position (-ln(P/(93-P)) and relw is the club wage bill taken from the annual
report and accounts divided by the average wage bill of all clubs in that season. Szymanski and Smith
(1997) found that the log odds formulation worked well in estimation and this formulation has
subsequently been adopted by other researchers (e.g. Buraimo et al (2007)).
(2’) ∆relrevit = γ0 + γ1lnrelrevit-1 + γ2∆lnrelrevit-1 + γ3lnpit + γ4∆lnpit-1 + promotion/relegation dummies +
division/tier dummies + revenue/tier interaction dummies + ηit
where relrev is the total turnover of the club taken from the annual report and accounts divided by the
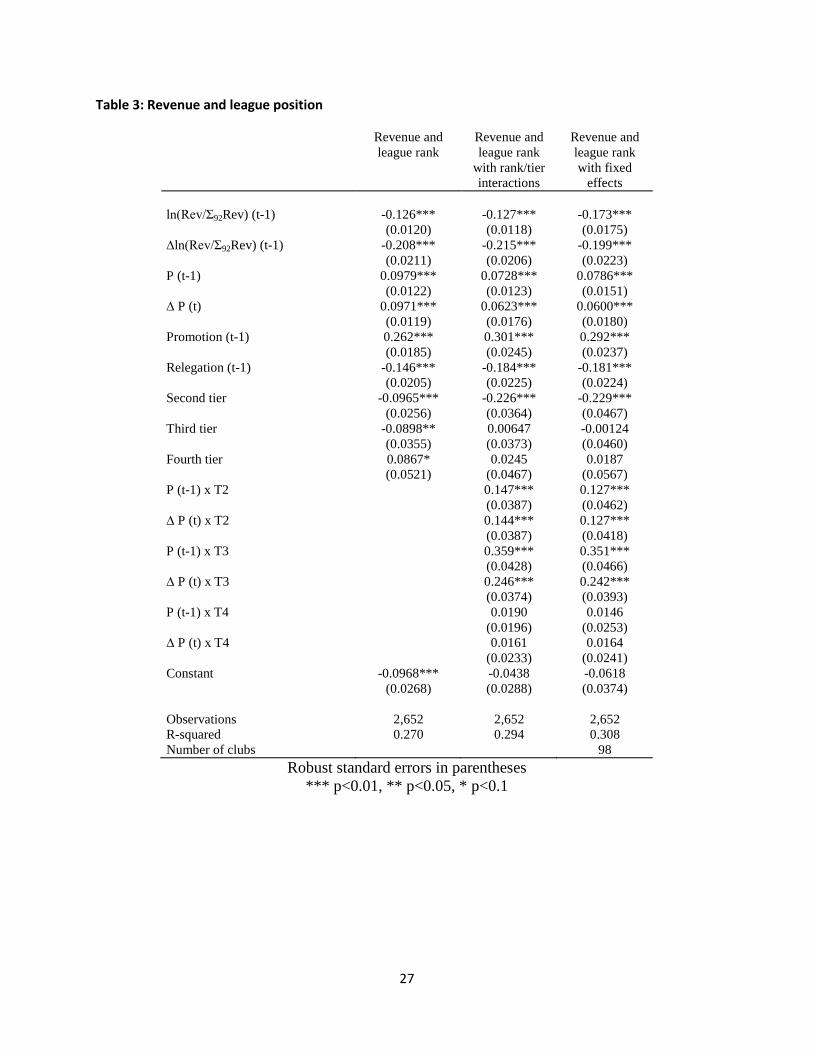
average turnover of all clubs in that season. The results are shown in Tables 2 and 3. Standard errors are
clustered around each club. The regressions confirm that higher league position is associated with a
higher wage bill and that higher revenues are associated with a higher league position.16
Tables 2 and 3 here
The main focus of interest here is the residuals from (1’) and (2’). Figures 7 and 8 are a plot of the
residuals against the fitted values and a plot of the kernel density from (1’). Both suggest the residuals
are normal and well behaved. The equivalent plots (not shown here but available on request) for (2’)
appear equally normal.
Figures 7 and 8 here
Since we are using (1') and (2') to obtain best linear unbiased predictors of position and revenue, rather
than estimates of the structural parameters, we do not need to assume the exogeneity of the right hand
side variables. The prediction is conservative in that the estimate of expected position from (1') will pick
up not only the effect of relative wages, but the effect of any omitted variable correlated with relative
16See Hall et al (2002) and Simmons and Walker (2010) for a discussion of causality and identification strategies.

14
wages. Thus the residual ("luck") only measures elements orthogonal to the included regressors, as is
appropriate for the unexpected component.
Figure 9 plots the residuals against league rank. This shows that within each tier/division more
successful teams tend to be associated with a positive error and less successful teams with a negative
error. Thus while team investments in talent and team fixed effects have a significant impact on
performance, so does “luck”. In some sense this is essential if competitive league sports are to be
attractive to spectators. However, “luck” might combine several factors in this context. Obvious sources
of bad fortune are injuries to star players and the unexpected discovery of new talent. From year to year
player performance can change significantly. Another important factor is the manager. Managerial
tenure is relatively short; Dobson and Goddard (2011) p270 report that average tenure in recent years is
90 games- little more than two seasons- and this number is skewed by a small number of long-term
survivors. Given that the data used in this paper is annual, and a club may appoint more than one
manager in a given season, managerial effects may enter as random fluctuations from year to year.
Other effects that may be caught up in the error term include changes in club ownership or strategy,
performance spillovers from other competitions (e.g. the Champions League or FA Cup) or even the
weather (climatic conditions might in some years prove more helpful to a particular style of play).
Figures 9 here
The residuals from (1’) and (2’) were then used as regressors in a probit regression for the probability of
entering insolvency proceedings. The results are reported in Table 4. A considerable number of variables
were experimented with but only those included were significant. Financial variables such as the ratio of
wages to turnover in the previous season were insignificant, while the debt/revenue ratio is only
significant in some years. In the report and accounts the auditors can qualify the statements if they are
not entirely confident about the reliability of the accounting data, and qualification might be expected
to be an indicator of future problems, but was in fact insignificant. In many cases clubs have changed the
date of their accounting year end, which might be an indicator of financial turmoil, but this was also
insignificant. Recent promotion or relegation was insignificant. The standard deviation of league position
over the previous five seasons was included in some specifications, to capture the effect of turbulence in
performance, but this variable was insignificant.
Table 4 here

15
Among the significant variables, presence in the lower tiers was highly significant, which is not surprising
given that only one team in the top tier entered insolvency proceedings. The 2002 dummy captures the
effect of the ITV Digital collapse (described above) and the dozen insolvencies that followed in the next
year. The ratio of total liabilities to total assets in the previous year is positive and strongly significant.
Columns 1-5 in Table 4 differ according to the number of lagged residuals used. Thus column 1 uses the
lagged residual, column 2 adds the second lag, and so on. This captures the idea that insolvency can be
triggered by a sequence of negative shocks. Both the position-wage and revenue-position residuals are
of the right sign. The best fit appears to be the sum of the first and second lags, which are jointly
significant at the 5% level. While the revenue-position residuals are significant over a longer period, the
position-wage residuals are not. One explanation for this may be that it is easier to recover from a poor
season on the pitch than it is from a shortfall in revenue.
A further mechanism by which the residuals from (1’) and (2’) may trigger insolvency is explored in the
next two tables. Table 4 shows that insolvency is more likely when the ratio of liabilities to assets
increases. One way for this to happen is as follows. If a team underperforms on the field (1’) or fails to
generate as much revenue as expected from performance (2’) then there may be a tendency for the
ratio of wages to turnover to rise. This in turn will increase the likelihood that the team will have to
borrow, causing the balance sheet to deteriorate and hence increasing the probability of insolvency.
Table 5 reports the relationship between the wage/turnover ratio and the residuals from (1’) and (2’). As
illustrated by figure 4, the wage turnover ratio tends to be larger in lower divisions. But Table 5 also
shows that negative residuals have a negative impact on the wage/turnover ratio.
Table 5 here
Table 6 shows the relationship between the wage/turnover ratio (which comes from the profit and loss
account) and various balance sheet measures- total liabilities/total assets, net debt/revenue and
revenue/ total liabilities. It appears that there is a fairly predictable relationship: a higher wage/turnover
ratio leads to a statistically significant deterioration in the balance sheet.
Table 6 here
To conclude the empirical section, a set of regressions (not reported here but available on request) were
estimated to identify any negative impacts on performance post insolvency. As the evidence of figure 5
might lead one to expect, there is no evidence that an insolvency event has any long lasting effect, in the

16
sense that the post-insolvency clubs face the same trade-offs as other clubs as identified in (1’) and (2’),
while the relationship between the profit and loss account and the balance sheet also seems
unimpaired. One is left with the impression that negative shocks provoke insolvency, which leads to a
company restructuring and a writing-off of debts, which returns the club to its former good health.
4. Discussion and conclusions
While there has much hand-wringing in the football world about the problem of insolvency, there has
been limited empirical work on the causes of insolvency. This paper has used extensive accounting data
for English clubs to attempt to distinguish two hypotheses: “irrational exuberance”- the idea that
insolvency is caused by teams attempting to advance their league position above what it might normally
be, and “negative productivity or demand shocks” – the idea that insolvency is caused by consistent
underperformance relative to expectations.
The data seems to be more in line with the hypothesis that negative shocks to productivity or to
demand cause wage expenditure to rise relative to income, a deteriorating balance sheet and a higher
probability of insolvency. There is little evidence in the data to support the idea that team owners in the
decade prior to insolvency are attempting to raise their league standing to an excessive degree. In the
decade before insolvency the issue seems to be more one of stagnation and decline, rather than “crash
and burn”, at least as far as league performance is concerned. Of course, it may be that clubs tried to
prevent decline by unrealistic financial behavior, and one might take the evidence of the rising
wage/turnover ratio in support of this hypothesis. Perhaps this is indiscipline and irrationality. Even so,
the evidence at least suggests that negative shocks play a significant role in financial failure. If the model
described is section 2 is close to reality, then financial failure may be more a consequence of systemic
rather than behavioural failure.
It is certainly natural to expect that professional football clubs experience low profitability. Given a
competitive player market and the institution of promotion and relegation, which means that there is
potentially unlimited entry into the market, this sounds like a competitive market in which one would
17
expect to see zero profits in equilibrium, even absent the win maximization hypothesis.17 By contrast,
the closed leagues of North America not only restrict entry, they also agree a variety of restraints such
as a the draft system (which allocates bargaining rights over a player to a single team) and the salary
cap; franchises also practice extensive revenue sharing (see Hoehn and Szymanski (1999) for a
comparison).
However, zero profits are not the same as repeated insolvency. To see this consider figure 10, which
shows the frequency of insolvency involving teams that have played in the top four divisions, since the
foundation of the Football League in 1888. While there were occasional failures prior to 1939, these
involved teams that had fallen out of the leagues altogether. Between 1945 and 1980 there were only 5
cases, again all involving teams that had left the four divisions. Then there were a spate of insolvencies
in the early 1980s as a response to the very deep decline in attendances between 1980 and 1982.
The Insolvency Act of 1986, with its enhanced protection for companies in the face of creditors,
represented a major reform in the law. The Enterprise Act of 2002 further shifted the law in favour of
corporations. It seem plausible that these changes in bargaining power have led football club owners to
take advantage of the law, and pursue looser financial control policies, knowing that they are likely to be
cushioned in insolvency. This may be especially true for football clubs rather than other kinds of
businesses because of their perceived social significance.
There is an old saying that “capitalism without bankruptcy is like religion without hell”. Football
capitalism abolished hell, and replaced it with purgatory. Insolvency is not painless, but clubs always
survive in one form or another. UEFA’s new regulatory system, Financial Fair Play, will have a limited
impact on this situation since the rules apply only to teams eligible for UEFA competition, which is not
the case for most teams in the lower tiers. This year (2012) the teams participating in the English
Football League Championship announced that they plan to adopt a similar system in coming seasons,
and there have been discussions about extending the rules to the whole of the Premier League. These
rules have been welcomed by many owners, since they inhibit spending on players and reduce the
incentive to engage in an arms race. American owners of English clubs, familiar with the more restrictive
17 The simple symmetric model used here resembles a model of perfect competition, but the more realistic case of asymmetry would be analogous to a model of imperfect competition, in which each team has a degree of market power, but competitive entry still drives profits to zero.

18
and more profitable arrangements of the North American major leagues, have been particularly
enthusiastic supporters of the new regulations. The results of this paper suggest that the success of the
regulations in terms of reducing insolvency is likely to depend on whether they provide an incentive to
maintain a large enough financial cushion such that the cushion will be larger than the unanticipated
shocks.

19
Figure 1: Insolvencies and league attendance 1947-2010
Figure 2: Average real revenue growth by division
0
5000000
10000000
15000000
20000000
25000000
30000000
35000000
40000000
45000000
0
1
2
3
4
5
6
7
8
9
insolvencies attendance
0.10
1.00
10.00
100.00
1000.00
Average real revenue (£2010) by division 1974-2010logarithmic scale
Top tier Second tier Third tier Fourth tier
20
Figure 3: Profitability
Figure 4: Wage bill as a percentage of revenue by division
-0.800
-0.600
-0.400
-0.200
0.000
0.200
0.400
Pre-tax profits as a percentage of Revenue 1974-2010
Top tier Second tier Third tier Fourth tier
0.300
0.400
0.500
0.600
0.700
0.800
0.900
1.000
Wage bill as a percentage of revenues by division 1974-2010
Top tier Second tier Third tier Fourth tier

21
Figure 5
0
10
20
30
40
50
60
70
-22 -20 -18 -16 -14 -12 -10 -8 -6 -4 -2 0 2 4 6 8 10 12 14 16 18 20 22 24 26 28
Leag
ue ra
nk a
nd n
umbe
r of o
bser
vatio
ns
Years before and after insolvency event
Average League Rank before and after insolvency event
Observations
Average league rank

22
Figure 6: Distribution of changes in league position t years before insolvency
0
5
10
15
20
25
-90 -80 -70 -60 -50 -40 -30 -20 -10 0 10 20 30 40 50 60 70 80 90
-1
0
2
4
6
8
10
12
14
16
18
20
-90 -80 -70 -60 -50 -40 -30 -20 -10 0 10 20 30 40 50 60 70 80 90
-2
0
2
4
6
8
10
12
14
-90 -80 -70 -60 -50 -40 -30 -20 -10 0 10 20 30 40 50 60 70 80 90
-3
0
2
4
6
8
10
12
14
-90 -80 -70 -60 -50 -40 -30 -20 -10 0 10 20 30 40 50 60 70 80 90
-4
0
2
4
6
8
10
12
-90 -80 -70 -60 -50 -40 -30 -20 -10 0 10 20 30 40 50 60 70 80
-5
0
2
4
6
8
10
12
14
-90 -80 -70 -60 -50 -40 -30 -20 -10 0 10 20 30 40 50 60 70 80 90
-6
0
2
4
6
8
10
12
-90 -80 -70 -60 -50 -40 -30 -20 -10 0 10 20 30 40 50 60 70 80 90
-7
0
2
4
6
8
10
12
-90 -80 -70 -60 -50 -40 -30 -20 -10 0 10 20 30 40 50 60 70 80 90
-8
0
2
4
6
8
10
12
-90 -80 -70 -60 -50 -40 -30 -20 -10 0 10 20 30 40 50 60 70 80 90
-9
0
1
2
3
4
5
6
7
8
9
10
-90 -80 -70 -60 -50 -40 -30 -20 -10 0 10 20 30 40 50 60 70 80 90
-10

23
Table 1: Movement of teams between divisions
Panel (a) 10 year history of teams before year of entering insolvency
fraction of club years in division over previous decade division at date of insolvency 1 2 3 4 lower n
1 0% 0% 0% 0% 0% 0 2 47% 48% 5% 0% 0% 120 3 10% 30% 33% 24% 4% 210 4 0% 5% 32% 59% 5% 150
Panel (b) 10 year history of all clubs in the four divisions in 2010
fraction of club years in division over previous decade
Division in 2010 1 2 3 4 lower n 1 68% 26% 5% 3% 0% 200 2 18% 49% 23% 8% 2% 240 3 8% 20% 43% 23% 6% 240 4 1% 8% 23% 46% 23% 240

24
Table 2: League position and wages pending
Position only Position and wages
Position and wages and wage/tier
interaction
Fixed effects
P (t-1) -0.421*** -0.440*** -0.559*** -0.715*** (0.0602) (0.0582) (0.0463) (0.0440) ∆ P (t-1) -0.114*** -0.132*** -0.0884*** -0.0250 (0.0318) (0.0287) (0.0247) (0.0232) Promotion (t-1) 0.380*** 0.354*** 0.334*** 0.217*** (0.0560) (0.0586) (0.0480) (0.0457) Relegation (t-1) -0.424*** -0.405*** -0.255*** -0.160*** (0.0669) (0.0650) (0.0510) (0.0456) Second tier -0.663*** -0.496*** -0.263*** -0.494*** (0.0758) (0.0779) (0.0623) (0.0680) Third tier -1.104*** -0.817*** -0.811*** -1.128*** (0.136) (0.141) (0.106) (0.0969) Fourth tier -1.845*** -1.486*** -1.628*** -2.034*** (0.232) (0.231) (0.170) (0.152) ln(Wage/Σ92wages) (t-1) 0.189*** 0.833*** 0.568*** (0.0257) (0.0823) (0.128) ∆ln(Wage/Σ92wages) (t) 0.671*** 1.040*** 0.875*** (0.0563) (0.134) (0.141) ln(Wage/Σ92wages) (t-1) x T2 -0.678*** -0.477*** (0.0839) (0.124) ∆ln(Wage/Σ92wages) (t) x T2 -0.577*** -0.462*** (0.146) (0.158) ln(Wage/Σ92wages) (t-1) x T3 -0.762*** -0.524*** (0.0823) (0.127) ∆ln(Wage/Σ92wages) (t) x T3 -0.508*** -0.376** (0.132) (0.146) ln(Wage/Σ92wages) (t-1) x T4 -0.738*** -0.474*** (0.0912) (0.136) ∆ln(Wage/Σ92wages) (t) x T4 0.239 0.266 (0.222) (0.223) Constant 0.921*** 0.834*** 0.646*** 0.949*** (0.106) (0.108) (0.0861) (0.0864) Observations 3,162 2,609 2,609 2,609 R-squared 0.355 0.410 0.445 0.487 Number of clubs 98
Robust standard errors in parentheses *** p<0.01, ** p<0.05, * p<0.1

25
Figure 7: residuals and fitted values from position – wage regression
Figure 8: Residuals from position –wage regression
-3-2
-10
12
Res
idua
ls
-2 -1 0 1 2Fitted values
0.2
.4.6
.81
Den
sity
-3 -2 -1 0 1 2Residuals
Kernel density estimateNormal density
kernel = epanechnikov, bandwidth = 0.0839
Kernel density estimate
26
Figure 9: Residuals from position – wage regression order by team rank
-3-2
-10
12
e[in
d,t]
0 20 40 60 80 100Rank
27
Table 3: Revenue and league position
Revenue and league rank
Revenue and league rank
with rank/tier interactions
Revenue and league rank with fixed
effects ln(Rev/Σ92Rev) (t-1) -0.126*** -0.127*** -0.173*** (0.0120) (0.0118) (0.0175) ∆ln(Rev/Σ92Rev) (t-1) -0.208*** -0.215*** -0.199*** (0.0211) (0.0206) (0.0223) P (t-1) 0.0979*** 0.0728*** 0.0786*** (0.0122) (0.0123) (0.0151) ∆ P (t) 0.0971*** 0.0623*** 0.0600*** (0.0119) (0.0176) (0.0180) Promotion (t-1) 0.262*** 0.301*** 0.292*** (0.0185) (0.0245) (0.0237) Relegation (t-1) -0.146*** -0.184*** -0.181*** (0.0205) (0.0225) (0.0224) Second tier -0.0965*** -0.226*** -0.229*** (0.0256) (0.0364) (0.0467) Third tier -0.0898** 0.00647 -0.00124 (0.0355) (0.0373) (0.0460) Fourth tier 0.0867* 0.0245 0.0187 (0.0521) (0.0467) (0.0567) P (t-1) x T2 0.147*** 0.127*** (0.0387) (0.0462) ∆ P (t) x T2 0.144*** 0.127*** (0.0387) (0.0418) P (t-1) x T3 0.359*** 0.351*** (0.0428) (0.0466) ∆ P (t) x T3 0.246*** 0.242*** (0.0374) (0.0393) P (t-1) x T4 0.0190 0.0146 (0.0196) (0.0253) ∆ P (t) x T4 0.0161 0.0164 (0.0233) (0.0241) Constant -0.0968*** -0.0438 -0.0618 (0.0268) (0.0288) (0.0374) Observations 2,652 2,652 2,652 R-squared 0.270 0.294 0.308 Number of clubs 98
Robust standard errors in parentheses *** p<0.01, ** p<0.05, * p<0.1

28
Table 4: Dependent variable- Insolvency Event (probit)
(1) (2) (3) (4) (5) VARIABLES Second tier 3.829*** 3.876*** 3.933*** 3.795*** 3.794*** (0.333) (0.381) (0.376) (0.407) (0.443) Third tier 4.024*** 4.070*** 4.225*** 4.002*** 3.987*** (0.281) (0.327) (0.349) (0.387) (0.425) Fourth tier 4.067*** 4.055*** 4.228*** 4.138*** 4.171*** (0.274) (0.264) (0.286) (0.299) (0.333) 2002 dummy 0.930*** 0.861*** 0.869*** 0.864*** 0.890*** (0.281) (0.275) (0.275) (0.287) (0.298) Total liabilities/total assets (t-1) 0.0350 0.0643** 0.0586** 0.0535* 0.0580* (0.0227) (0.0288) (0.0293) (0.0302) (0.0316) Net debt/revenue (t-1) 0.0777** 0.0515 0.0570 0.0751** 0.0743**
(0.0345) (0.0371) (0.0376) (0.0333) (0.0347) Position-wage residual t: t-1 -0.337**
(0.148) Revenue-position residual t:t-1 -0.439*
(0.233) -0.342** Position-wage residual t:t-2 (0.168)
-0.573** Revenue-position residual t:t-2 (0.232)
-0.261* Position-wage residual t:t-3 (0.144)
-0.391* Revenue-position residual t:t-3 (0.234)
-0.215 Position-wage residual t:t-4 (0.143)
-0.415** Revenue-position residual t:t-4 (0.193)
-0.169 Position-wage residual t:t-5 (0.124)
-0.301** Revenue-position residual t:t-5 (0.151)
Constant -6.485*** -6.579*** -6.670*** -6.536*** -6.492***
(0.312) (0.379) (0.391) (0.432) (0.462)
Observations 2,235 2,114 1,997 1,884 1,774 Pseudo- R2 .164 .194 .186 .192 .180
Joint significance of residuals 6.66** 8.35** 4.59 5.38* 4.64*
p-value .036 .015 .101 .068 .098 Robust standard errors in parentheses
*** p<0.01, ** p<0.05, * p<0.1

29
Table 5: the Wage-Revenue ratio
(1) (2) (3) (4) (5) VARIABLES Second tier 0.190*** 0.182*** 0.184*** 0.181*** 0.180*** (0.0214) (0.0225) (0.0231) (0.0245) (0.0251) Third tier 0.223*** 0.223*** 0.226*** 0.222*** 0.219*** (0.0262) (0.0270) (0.0277) (0.0290) (0.0297) Fourth tier 0.264*** 0.245*** 0.233*** 0.229*** 0.228*** (0.0279) (0.0294) (0.0297) (0.0312) (0.0329) -0.0556*** Position-wage residual t:t-1 (0.00985)
-0.382*** Revenue-position residual t:t-1 (0.0189)
-0.0495*** Position-wage residual t:t-2 (0.00951)
-0.258*** Revenue-position residual t:t-2 (0.0181)
-0.0348*** Position-wage residual t:t-3 (0.00912)
-0.213*** Revenue-position residual t:t-3 (0.0188)
-0.0246*** Position-wage residual t:t-4 (0.00854)
-0.183*** Revenue-position residual t:t-4 (0.0183)
-0.0188** Position-wage residual t:t-5 (0.00843)
-0.155*** Revenue-position residual t:t-5 (0.0179) Constant 0.566*** 0.576*** 0.581*** 0.588*** 0.595*** (0.0163) (0.0173) (0.0178) (0.0188) (0.0195) Observations 2,517 2,357 2,219 2,087 1,960 R-squared 0.264 0.255 0.251 0.245 0.230
Standard errors in parentheses *** p<0.01, ** p<0.05, * p<0.1

30
Table 6: The wage/revenue ratio and the balance sheet
Total liabilities/ total assets
Net debt/revenue Revenue/total liabilities
Wage/revenue (t-1) 0.529*** 0.351** -0.630* (0.183) (0.138) (0.327) Wage/revenue (t-2) 0.511** 0.327*** -0.289* (0.227) (0.111) (0.152) Wage/revenue (t-3) 1.275*** 0.604*** -0.809*** (0.270) (0.190) (0.226) Position-wage residual t:t-3 -0.0612 -0.0856*** -0.00519
(0.0386) (0.0257) (0.133) Revenue-position residual t:t-3 -0.533*** -0.386*** 0.514*** (0.179) (0.0867) (0.111) Constant -0.287 -0.177 2.769*** (0.299) (0.205) (0.307) Observations 2,114 2,205 2,108 R-squared 0.105 0.110 0.025
Robust standard errors in parentheses *** p<0.01, ** p<0.05, * p<0.1

31
Source: The London Gazette and Companies House
Figure 10: Insolvencies of professional English Football Clubs 1888-2010
0
1
2
3
4
5
6
7
8
9
1888
1891
1894
1897
1900
1903
1906
1909
1912
1915
1918
1921
1924
1927
1930
1933
1936
1939
1942
1945
1948
1951
1954
1957
1960
1963
1966
1969
1972
1975
1978
1981
1984
1987
1990
1993
1996
1999
2002
2005
2008

32
Table A1: Augmented Dickey-Fuller tests
Club ADF stat p value ADF with trend
p value observations
Accrington Stanley -5.94 0.00
1.00 4 Aston Villa -5.42 0.00 -5.33 0.00 37 Tottenham Hotspur -4.51 0.00 -4.59 0.00 37 West Ham United -4.04 0.00 -4.05 0.01 37 Rochdale -4.02 0.00 -5.96 0.00 37 Torquay United -3.89 0.00 -3.87 0.01 35 Brentford -3.86 0.00 -3.69 0.02 37 Manchester United -3.53 0.01 -4.68 0.00 37 Everton -3.41 0.01 -3.49 0.04 37 Arsenal -3.34 0.01 -4.13 0.01 37 Darlington -3.25 0.02 -3.10 0.11 36 Liverpool -3.22 0.02 -4.82 0.00 37 Rotherham United -3.13 0.02 -3.27 0.07 37 Northampton Town -2.90 0.05 -3.12 0.10 37 Norwich City -2.89 0.05 -3.87 0.01 37 Leicester City -2.89 0.05 -2.82 0.19 37 Scunthorpe United -2.88 0.05 -4.40 0.00 37 Leeds United -2.86 0.05 -2.85 0.18 37 Hereford United -2.82 0.05 -2.86 0.18 28 Stockport County -2.81 0.06 -2.87 0.17 37 Newcastle United -2.80 0.06 -2.94 0.15 37 Derby County -2.72 0.07 -2.64 0.26 37 Exeter City -2.66 0.08 -3.16 0.09 32 Crystal Palace -2.64 0.08 -2.51 0.33 37 Bournemouth -2.63 0.09 -2.66 0.25 37 Hartlepool United -2.57 0.10 -3.51 0.04 37 Sunderland -2.54 0.11 -2.72 0.23 37 Chesterfield -2.54 0.11 -2.56 0.30 37 Blackburn Rovers -2.53 0.11 -3.00 0.13 37 Preston North End -2.53 0.11 -2.85 0.18 37 Middlesbrough -2.52 0.11 -2.42 0.37 37 Queens Park Rangers -2.52 0.11 -3.14 0.10 37 Southend United -2.48 0.12 -2.44 0.36 37 York City -2.45 0.13 -2.48 0.34 31 Manchester City -2.44 0.13 -2.35 0.41 37 Halifax Town -2.44 0.13 -3.26 0.07 24 Yeovil Town -2.42 0.14 -1.51 0.82 7 Nottingham Forest -2.40 0.14 -3.40 0.05 37 Barnsley -2.39 0.14 -1.98 0.61 37 Leyton Orient -2.34 0.16 -2.26 0.46 37 Walsall -2.33 0.16 -2.32 0.42 37 Peterborough United -2.33 0.16 -2.34 0.41 37 Stoke City -2.32 0.17 -1.28 0.89 37 Sheffield United -2.32 0.17 -2.51 0.32 37 Millwall -2.32 0.17 -2.28 0.44 37 Wolverhampton Wanderers -2.30 0.17 -2.13 0.53 37 Macclesfield Town -2.29 0.17 -3.62 0.03 13 Lincoln City -2.29 0.17 -2.88 0.17 36 Charlton Athletic -2.27 0.18 -1.60 0.79 37 Watford -2.27 0.18 -2.20 0.49 37 Ipswich Town -2.26 0.19 -3.10 0.11 37 Scarborough -2.26 0.19 -2.81 0.19 12
33
Burnley -2.25 0.19 -2.33 0.42 37 Cardiff City -2.24 0.19 -2.15 0.52 37 MK Dons -2.21 0.20 -2.15 0.52 7 Wimbledon -2.20 0.20 -1.09 0.93 26 Aldershot -2.19 0.21 -2.02 0.59 20 Swansea City -2.17 0.22 -2.13 0.53 37 Huddersfield Town -2.16 0.22 -2.31 0.43 37 Boston United -2.13 0.23 -1.98 0.61 5 West Bromwich Albion -2.12 0.24 -2.31 0.43 37 Bristol Rovers -2.10 0.25 -2.46 0.35 37 Mansfield Town -2.09 0.25 -3.00 0.13 35 Blackpool -2.07 0.26 -2.00 0.60 37 Bury -2.07 0.26 -2.32 0.42 37 Bristol City -2.04 0.27 -1.95 0.63 37 Reading -2.03 0.27 -3.46 0.04 37 Swindon Town -2.03 0.27 -2.03 0.59 37 Gillingham -2.00 0.29 -1.97 0.62 37 Plymouth Argyle -1.97 0.30 -1.94 0.63 37 Sheffield Wednesday -1.95 0.31 -1.86 0.68 37 Wycombe Wanderers -1.94 0.31 -3.40 0.05 17 Barnet -1.93 0.32 -3.47 0.04 15 Carlisle United -1.91 0.33 -2.04 0.58 36 Crewe Alexandra -1.88 0.34 -1.71 0.75 37 Southampton -1.76 0.40 -2.08 0.56 37 Brighton & Hove Albion -1.76 0.40 -2.11 0.54 37 Port Vale -1.76 0.40 -1.63 0.78 37 Tranmere Rovers -1.68 0.44 -1.94 0.64 37 Notts County -1.65 0.45 -2.86 0.18 37 Cheltenham Town -1.59 0.49 -1.07 0.93 11 Doncaster Rovers -1.59 0.49 -1.60 0.79 32 Portsmouth -1.56 0.50 -2.74 0.22 37 Coventry City -1.51 0.53 -2.81 0.19 37 Birmingham City -1.40 0.58 -1.33 0.88 37 Southport -1.40 0.58 -0.69 0.97 5 Bradford City -1.39 0.58 -0.85 0.96 37 Cambridge United -1.37 0.60 -1.83 0.69 32 Hull City -1.30 0.63 -1.00 0.94 37 Wrexham -1.16 0.69 -1.43 0.85 35 Fulham -1.16 0.69 -1.58 0.80 37 Oldham Athletic -1.15 0.70 -2.15 0.52 37 Shrewsbury Town -1.14 0.70 -2.41 0.37 36 Chester City -1.10 0.71 -2.03 0.59 32 Bolton Wanderers -1.04 0.74 -1.60 0.79 37 Chelsea -1.02 0.75 -3.65 0.03 37 Wigan Athletic -1.01 0.75 -1.75 0.73 32 Newport County -0.92 0.78 0.02 0.99 15 Workington -0.58 0.88
1.00 4
Grimsby Town -0.40 0.91 -0.89 0.96 37 Oxford United -0.28 0.93 -0.97 0.95 33 Rushden& Diamonds 0.05 0.96 -1.16 0.92 5 Kidderminster Harriers 0.22 0.97 0.84 1.00 5 Colchester United 0.24 0.97 0.11 1.00 35 Luton Town 0.87 0.99 -0.33 0.99 36 Dagenham & Redbridge
1.00
1.00 3
Maidstone United
1.00
1.00 3 Morecambe
1.00
1.00 3
Burton Albion
1

34
References Altman, E.(1968),‘Financial ratios, discriminant analysis and the prediction of corporate bankruptcy’, Journal of Finance 23(4),589–609 Andreff W., (2007) “French Football: A Financial Crisis Rooted in Weak Governance”, Journal of Sports Economics, 8 (6), 652-61. Beech, J., Horsman, S., & Magraw, J. (2008). “The circumstances in which English clubs becomes insolvent”. Coventry: Coventry University. Babatunde Buraimo, David Forrest and Robert Simmons (2007) “Freedom of Entry, Market Size, and Competitive Outcome: Evidence from English Soccer”, Southern Economic Journal, Vol. 74, No. 1 pp. 204-213 Fiona Carmichael, Ian McHale and Dennis Thomas(2010) “Maintaining market position: team performance, revenue and wage expenditure in the English Premier League” Bulletin of Economic Research, DOI: 10.1111/j.1467-8586.2009.00340.x Cork , K.(1982) Insolvency Law and Practice: Report of the Review Committee. HMSO: Cm 8558 Adam Cox (2012) “Live Broadcasting, Gate Revenue, and Football Club Performance: Some Evidence”, International Journal of the Economics of Business, 19:1, 75-98 Barajas, A., & Rodrıguez, P. (2010). Spanish football clubs’ finances: Crisis and player salaries. International Journal of Sport Finance, 5, 52_66. Department of Education and Science (1968) Report of the Committee on Football. HMSO: 27-427 Dobson, S. and J. Goddard (2011) The Economics of Football, second edition. Cambridge, England. Finch, V. (2009) Corporate Insolvency Law: Perspectives and Principles. (Second edition) Cambridge, England Stephen Hall, Stefan Szymanski and Andrew S. Zimbalist (2002) “Testing Causality Between Team Performance and Payroll : The Cases of Major League Baseball and English Soccer” Journal of Sports Economics, 3: 149-168 Hillegeist, S., D. Cram, E. Keating and K. Lundstedt (2004) ‘‘Assessing the Probability of Bankruptcy.’’ Review of Accounting Studies 9(1), 5–34. Hoehn, T. and S. Szymanski (1999). “The Americanization of European Football” Economic Policy, No. 28, 205-33. Jennett, N. And P.J. Sloane (1985) “The future of league football: a critique of the report of the chester committee of enquiry”, Leisure Studies, Vol. 4, 1, 39-56

35
Jones, S. and Hensher DA (2004)“Predicting firm financial distress: a mixed logit model”, The Accounting Review79(4): 1011–1038. Késenne, S., (1996) “League Management in Professional Team Sports with Win Maximizing Clubs”, European Journal for Sport Management, vol. 2/ 2, pp. 14-22 Lago, U., Simmons, R., & Szymanski, S. (2006) “The financial crisis in European football: Anintroduction”Journal of Sports Economics, 7, 3-12. Leach, S. (2006) Financial viability and competitive balance in English football. Unpublished Ph.D thesis, University of London Madden, P. (2011) “Welfare consequences of Financial Fair Play for a sports league with benefactor owners”, mimeo Ohlson, J. (1980). ‘‘Financial Ratios and the Probabilistic Prediction of Bankruptcy.’’ Journal of AccountingResearch18, 109–131. Peat, M. and S. Jones (2012) “Using neural nets to combine information sets in corporate bankruptcy prediction” Intell. Sys. Acc. Fin. Mgmt.19, 90–101 (2012) Rasmus K. Storm, (2012) "The need for regulating professional soccer in Europe: A soft budget constraint approach argument", Sport, Business and Management: An International Journal, Vol. 2, 1, pp.21 – 38 Review Group (2000) A Review of Company Rescue and Business Reconstruction Mechanisms. UK government Insolvency Service. Simmons, Robert, and David Forrest (2002) “Team salaries and playing success in sports: a comparative perspective”, Zeitschrift fur Betriebswirtschaft, Vol. 72, No. 4, 221-36 Simmons, Robert, and David Forrest (2004)“Buying success: Relationships between team performance and wage bills” in the U.S. and European sports leagues. In International sports economics comparisons, edited by Rodney Fort and John Fizel. Westport, CT: Praeger, pp. 123-40. Simmons, R. and I. Walker (2010) “Can subsidies help buy success? Revenue sharing in English football” in Optimal Strategies in Sports Economics and Management, Butenko, Sergiy; Gil-Lafuente, Jaime; Pardalos, Panos M. (Eds.) 2010, Springer Sloane, P. (1971) “The economics of professional football: The football club as a utility maximiser”, Scottish Journal of Political Economy, 17,121-146 Szymanski, S. (2003). ‘The economic design of sporting contests’, Journal of Economic Literature, XLI(December), pp. 1137–87. Szymanski, S., & Smith, R. (1997). The English football industry: Profit, performance and industrial structure. International Review of Applied Economics, 11(1), 135-153.

36
Benno Torgler & Sascha Schmidt, 2007. "What shapes player performance in soccer? Empirical findings from a panel analysis," Applied Economics, vol. 39(18), pages 2355-2369. UEFA (2012a) Club Licensing Report UEFA (2012b) Financial Fair Play Regulations
Top Related