


Languages
Pages
Legal


APRIL 2016
Inland Empire Market Report APRIL 2016
Riverside County San Bernardino County
Banning La Quinta Adelanto Ontario
Beaumont Lake Elsinore Apple Valley Rancho Cucamonga
Blythe Menifee Barstow Redlands
Calimesa Moreno Valley Big Bear Rialto
Canyon Lake Murrieta Chino San Bernardino (city)
Cathedral City Norco Chino Hills Upland
Coachella Palm Desert Colton Victorville
Corona Palm Springs Fontana Yucaipa
Desert Hot Springs Perris Grand Terrace Yucca Valley
Eastvale Rancho Mirage Hesperia
Hemet Riverside (city) Highland
Indian Wells San Jacinto Loma Linda
Indio Temecula Montclair
Jurupa Valley Wildomar
TABLE OF CONTENTS
AllreportspresentedwithinthisdocumentarebasedondatasuppliedbytheCARETS(CLAW,CRISNetMLS,DAMLS,CRMLS,i-TechMLS,and/orVCRDS)ortheirMLSs.NeithertheAssociaGonsnortheirMLSsguaranteeorareinanywayresponsiblefortheiraccuracy.DatamaintainedbytheAssociaGonsortheirMLSsmaynotreflectallrealestateacGviGesinthemarket.InformaGondeemedreliablebutnotguaranteed.
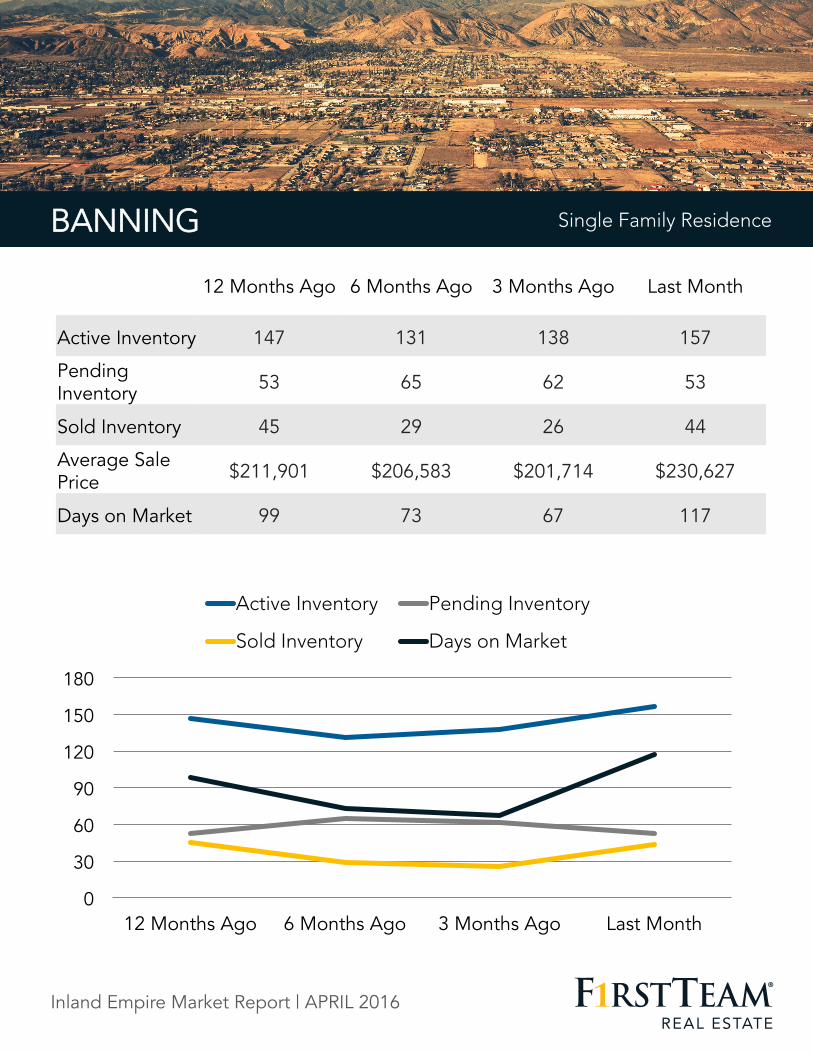
BANNINGSingleFamilyResidence
Inland Empire Market Report | APRIL 2016
BANNING
0
30
60
90
120
150
180
12 Months Ago 6 Months Ago 3 Months Ago Last Month
Active Inventory Pending Inventory
Sold Inventory Days on Market
Single Family Residence
12 Months Ago 6 Months Ago 3 Months Ago Last Month
Active Inventory 147 131 138 157
Pending Inventory 53 65 62 53
Sold Inventory 45 29 26 44
Average Sale Price $211,901 $206,583 $201,714 $230,627
Days on Market 99 73 67 117

BEAUMONT
ViewhomesforsaleinAlisoViejo>>
0
40
80
120
160
200
240
280
12 Months Ago 6 Months Ago 3 Months Ago Last Month
Active Inventory Pending Inventory
Sold Inventory Days on Market
Single Family Residence BEAUMONT
12 Months Ago 6 Months Ago 3 Months Ago Last Month
Active Inventory 237 221 196 235
Pending Inventory 111 102 106 87
Sold Inventory 67 55 61 69
Average Sale Price $268,191 $276,160 $281,244 $294,722
Days on Market 69 72 102 54
Inland Empire Market Report | APRIL 2016

BLYTHE
ViewhomesforsaleinAlisoViejo>>
0 20 40 60 80
100 120 140 160
12 Months Ago 6 Months Ago 3 Months Ago Last Month
Active Inventory Pending Inventory
Sold Inventory Days on Market
BLYTHE Single Family Residence
12 Months Ago 6 Months Ago 3 Months Ago Last Month
Active Inventory 45 31 36 44
Pending Inventory 18 17 16 11
Sold Inventory 6 6 6 4
Average Sale Price $90,546 $115,157 $109,304 $164,125
Days on Market 141 115 116 77
Inland Empire Market Report | APRIL 2016
CALIMESA
0
20
40
60
80
100
12 Months Ago 6 Months Ago 3 Months Ago Last Month
Active Inventory Pending Inventory
Sold Inventory Days on Market
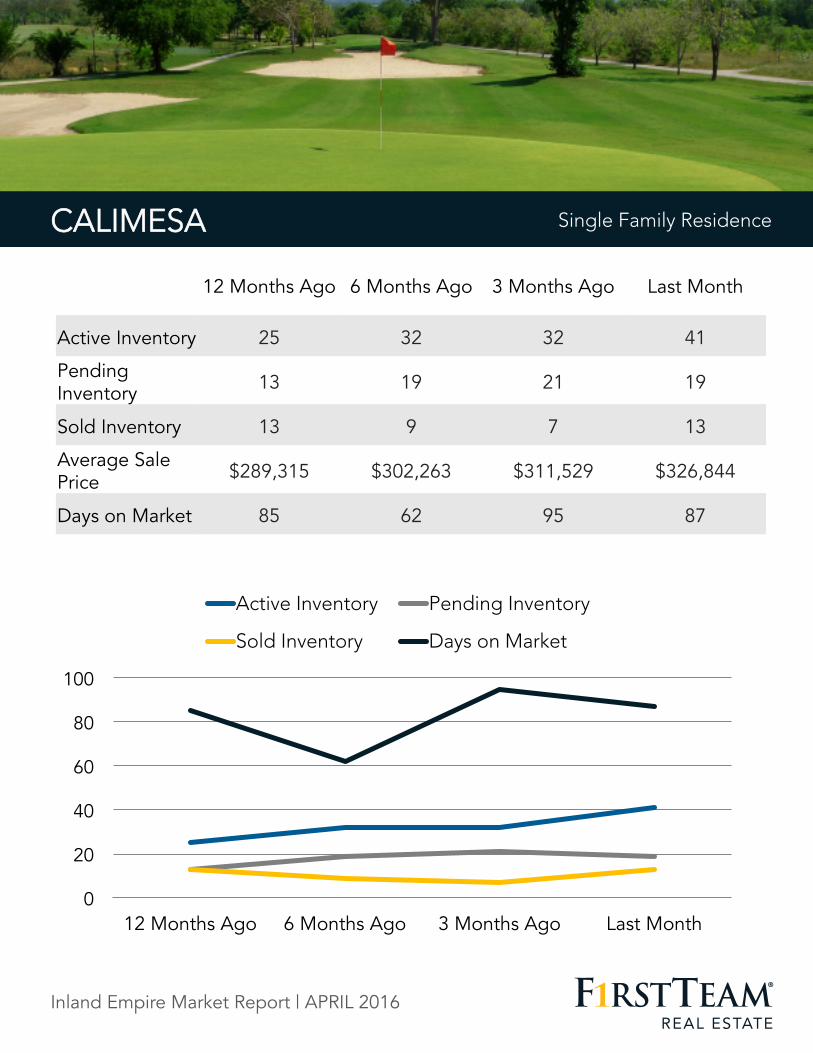
CALIMESA Single Family Residence
12 Months Ago 6 Months Ago 3 Months Ago Last Month
Active Inventory 25 32 32 41
Pending Inventory 13 19 21 19
Sold Inventory 13 9 7 13
Average Sale Price $289,315 $302,263 $311,529 $326,844
Days on Market 85 62 95 87
Inland Empire Market Report | APRIL 2016
CANYONLAKE
0
30
60
90
120
150
180
12 Months Ago 6 Months Ago 3 Months Ago Last Month
Active Inventory Pending Inventory
Sold Inventory Days on Market
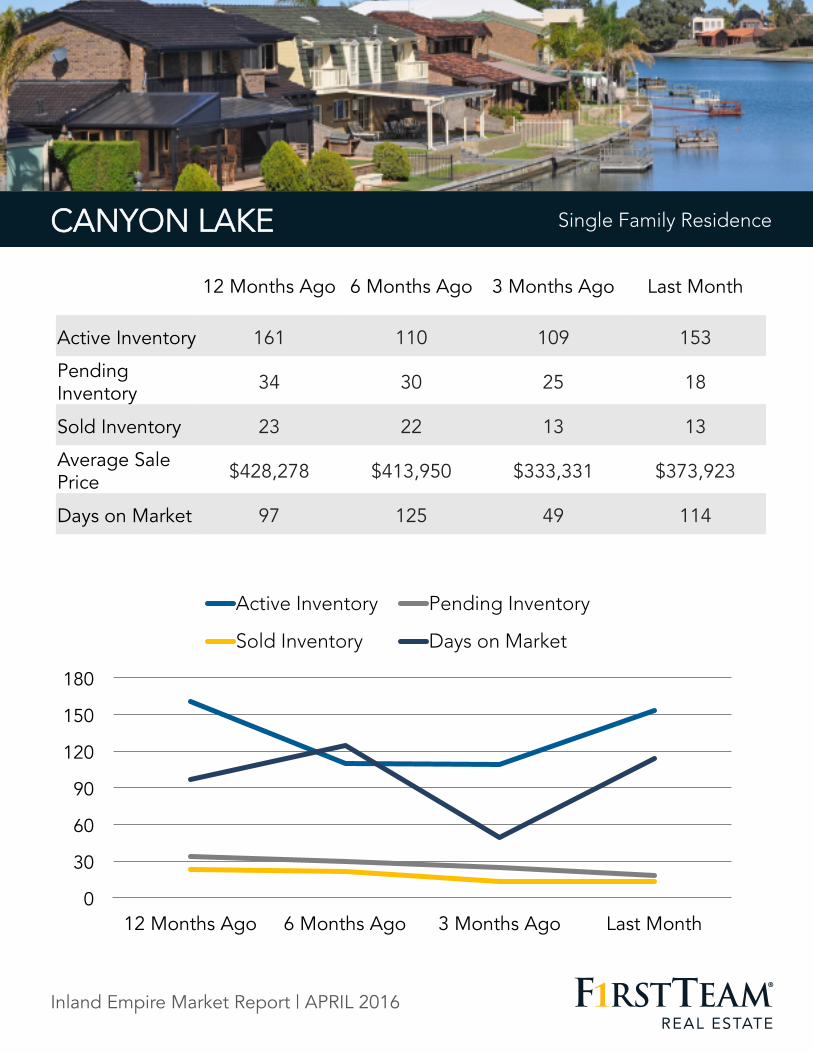
CANYON LAKE Single Family Residence
12 Months Ago 6 Months Ago 3 Months Ago Last Month
Active Inventory 161 110 109 153
Pending Inventory 34 30 25 18
Sold Inventory 23 22 13 13
Average Sale Price $428,278 $413,950 $333,331 $373,923
Days on Market 97 125 49 114
Inland Empire Market Report | APRIL 2016
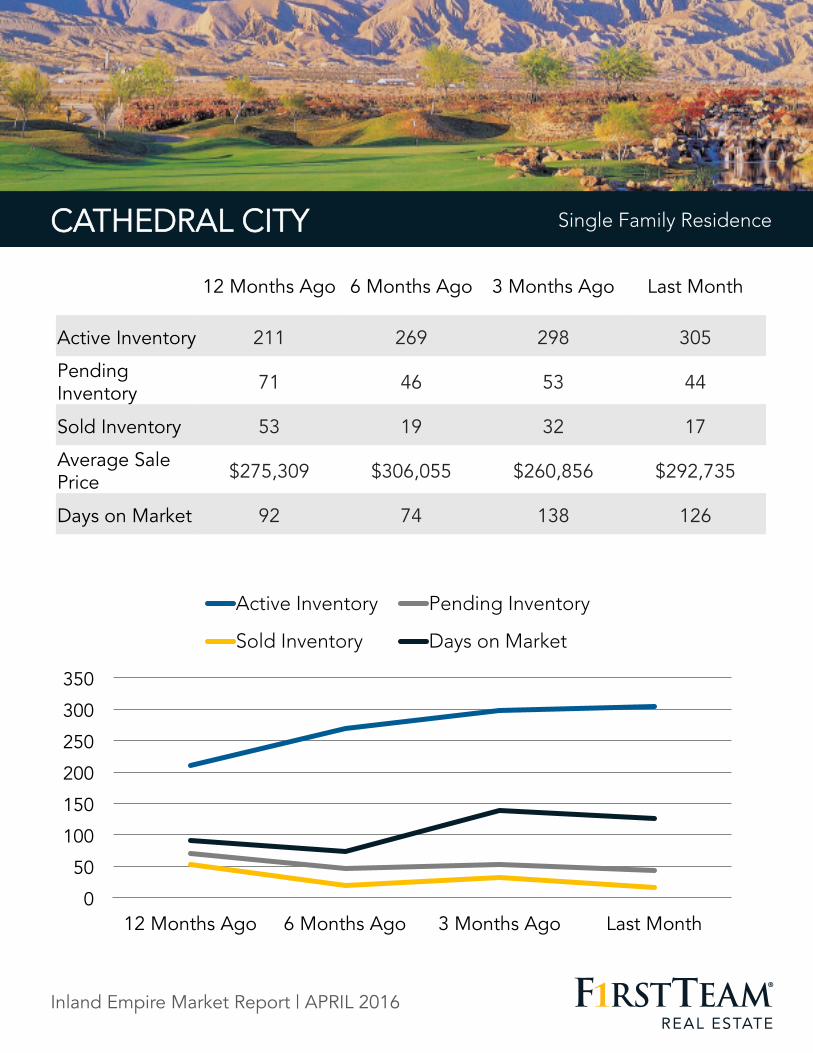
CATHEDRALCITY
0
50
100
150
200
250
300
350
12 Months Ago 6 Months Ago 3 Months Ago Last Month
Active Inventory Pending Inventory
Sold Inventory Days on Market
SingleFamilyResidenceCATHEDRAL CITY Single Family Residence
12 Months Ago 6 Months Ago 3 Months Ago Last Month
Active Inventory 211 269 298 305
Pending Inventory 71 46 53 44
Sold Inventory 53 19 32 17
Average Sale Price $275,309 $306,055 $260,856 $292,735
Days on Market 92 74 138 126
Inland Empire Market Report | APRIL 2016
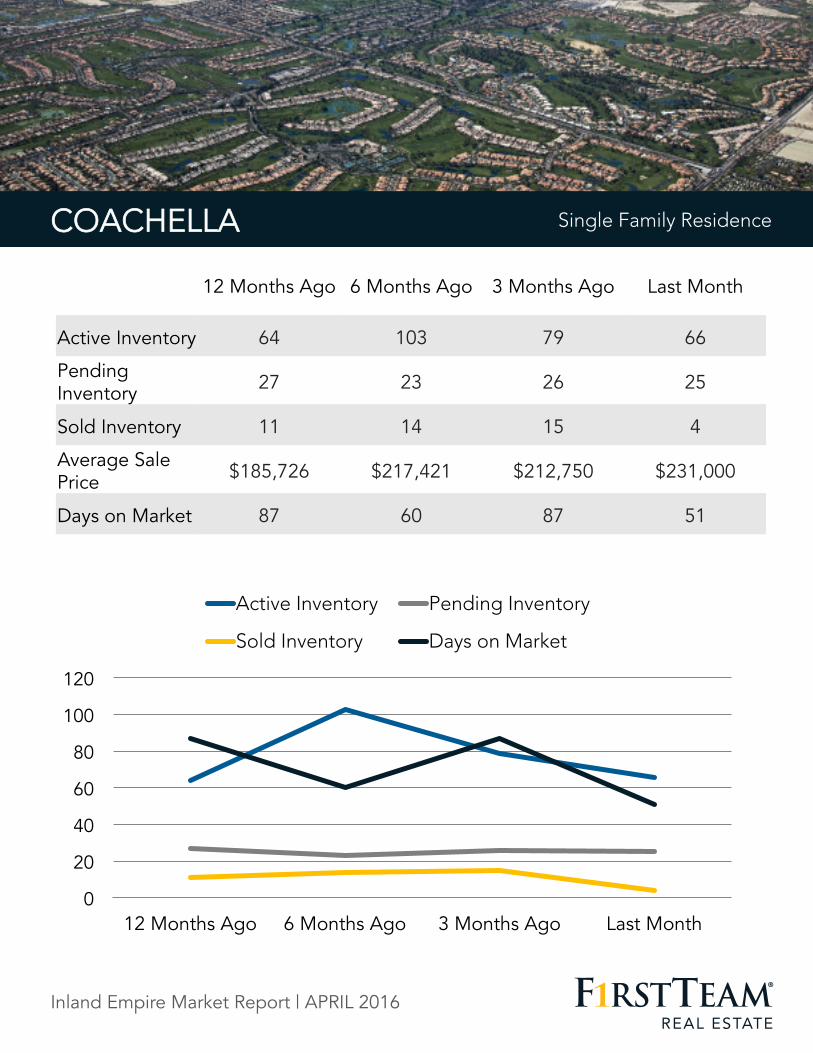
COACHELLA
0
20
40
60
80
100
120
12 Months Ago 6 Months Ago 3 Months Ago Last Month
Active Inventory Pending Inventory
Sold Inventory Days on Market
SingleFamilyResidenceCOACHELLA Single Family Residence
12 Months Ago 6 Months Ago 3 Months Ago Last Month
Active Inventory 64 103 79 66
Pending Inventory 27 23 26 25
Sold Inventory 11 14 15 4
Average Sale Price $185,726 $217,421 $212,750 $231,000
Days on Market 87 60 87 51
Inland Empire Market Report | APRIL 2016

CORONA
0
100
200
300
400
500
600
700
12 Months Ago 6 Months Ago 3 Months Ago Last Month
Active Inventory Pending Inventory
Sold Inventory Days on Market
CORONA Single Family Residence
12 Months Ago 6 Months Ago 3 Months Ago Last Month
Active Inventory 621 605 514 647
Pending Inventory 328 287 285 218
Sold Inventory 222 132 138 178
Average Sale Price $456,825 $444,899 $438,174 $466,770
Days on Market 71 82 103 76
Inland Empire Market Report | APRIL 2016

DESERTHOTSPRINGS
0
50
100
150
200
250
300
350
12 Months Ago 6 Months Ago 3 Months Ago Last Month
Active Inventory Pending Inventory
Sold Inventory Days on Market
DESERT HOT SPRINGS Single Family Residence
12 Months Ago 6 Months Ago 3 Months Ago Last Month
Active Inventory 293 277 267 279
Pending Inventory 59 79 56 58
Sold Inventory 41 33 49 29
Average Sale Price $160,871 $169,873 $160,618 $176,834
Days on Market 101 83 110 69
Inland Empire Market Report | APRIL 2016
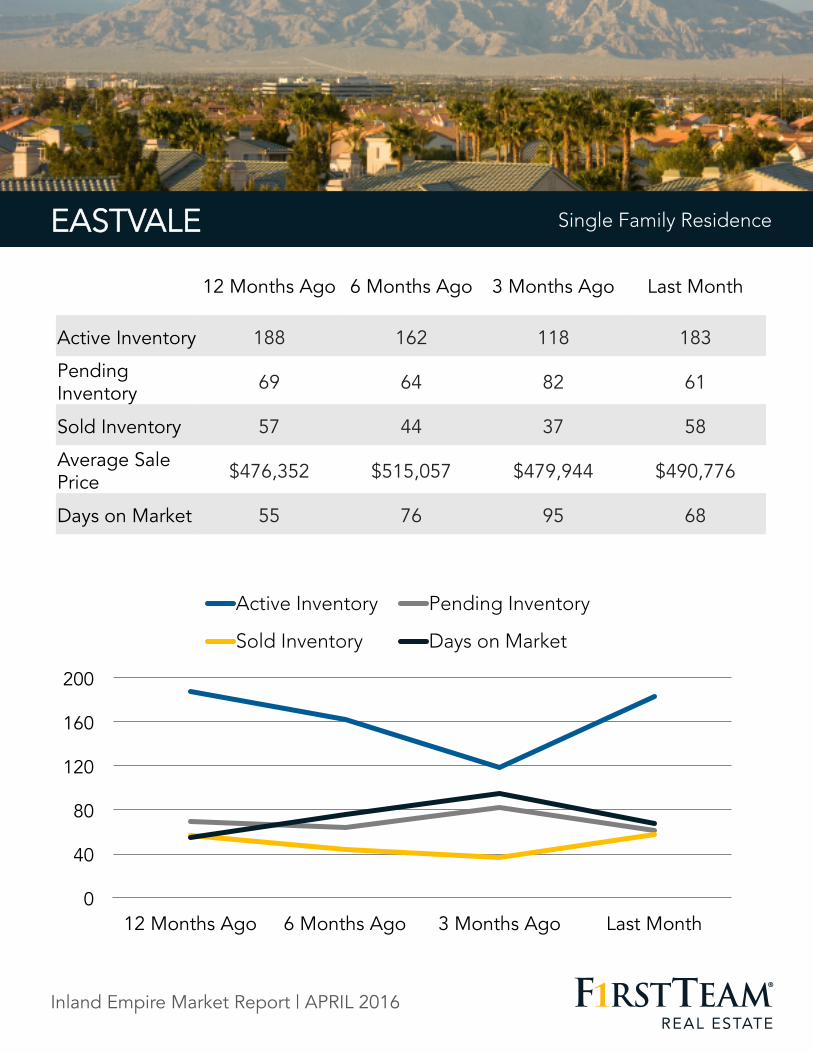
EASTVALE
0
40
80
120
160
200
12 Months Ago 6 Months Ago 3 Months Ago Last Month
Active Inventory Pending Inventory
Sold Inventory Days on Market
SingleFamilyResidenceEASTVALE Single Family Residence
12 Months Ago 6 Months Ago 3 Months Ago Last Month
Active Inventory 188 162 118 183
Pending Inventory 69 64 82 61
Sold Inventory 57 44 37 58
Average Sale Price $476,352 $515,057 $479,944 $490,776
Days on Market 55 76 95 68
Inland Empire Market Report | APRIL 2016
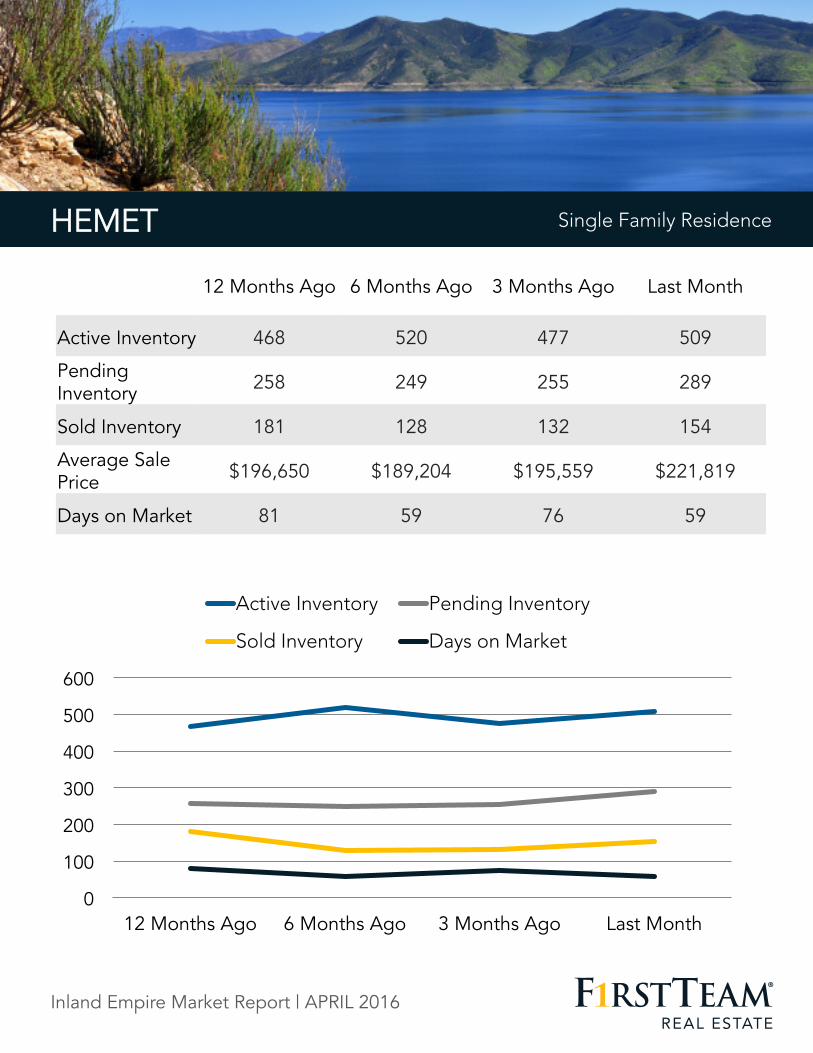
HEMET
0
100
200
300
400
500
600
12 Months Ago 6 Months Ago 3 Months Ago Last Month
Active Inventory Pending Inventory
Sold Inventory Days on Market
SingleFamilyResidenceHEMET Single Family Residence
12 Months Ago 6 Months Ago 3 Months Ago Last Month
Active Inventory 468 520 477 509
Pending Inventory 258 249 255 289
Sold Inventory 181 128 132 154
Average Sale Price $196,650 $189,204 $195,559 $221,819
Days on Market 81 59 76 59
Inland Empire Market Report | APRIL 2016

INDIANWELLS
0
50
100
150
200
250
300
350
12 Months Ago 6 Months Ago 3 Months Ago Last Month
Active Inventory Pending Inventory
Sold Inventory Days on Market
SingleFamilyResidenceINDIAN WELLS Single Family Residence
12 Months Ago 6 Months Ago 3 Months Ago Last Month
Active Inventory 221 243 301 310
Pending Inventory 13 7 11 10
Sold Inventory 21 11 15 1
Average Sale Price $889,090 $980,636 $1,025,133 $720,000
Days on Market 169 186 121 42
Inland Empire Market Report | APRIL 2016
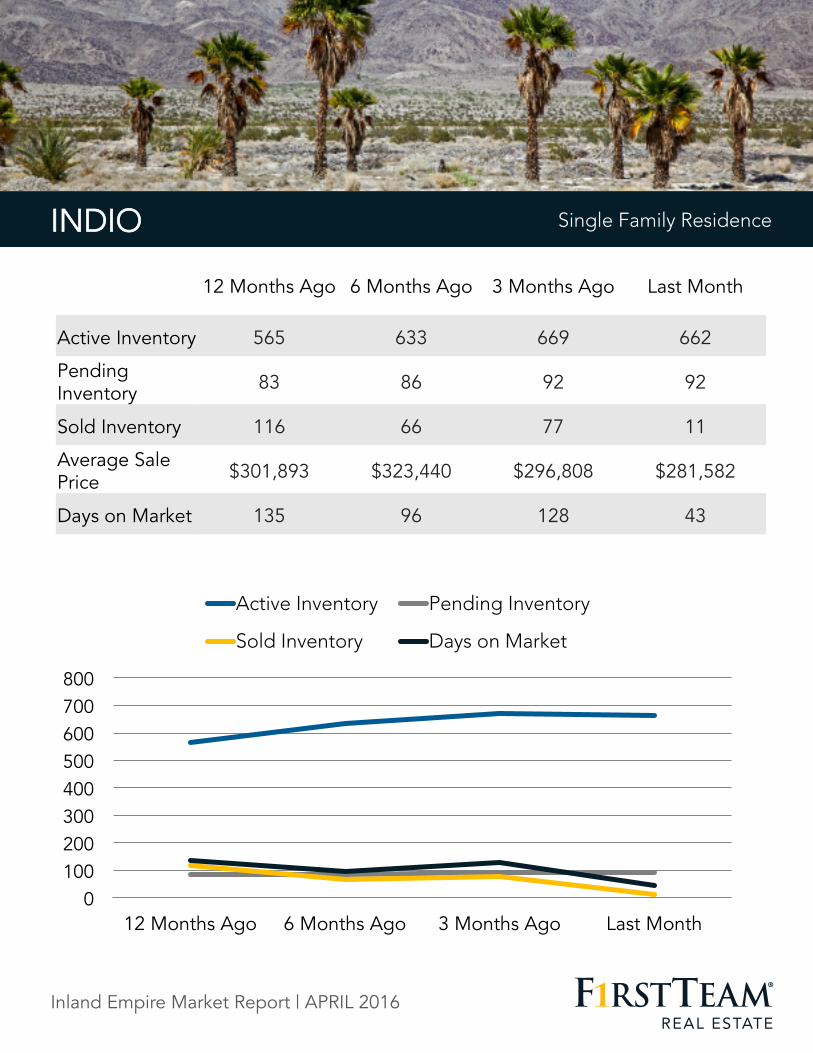
INDIO
0 100 200 300 400 500 600 700 800
12 Months Ago 6 Months Ago 3 Months Ago Last Month
Active Inventory Pending Inventory
Sold Inventory Days on Market
SingleFamilyResidenceINDIO Single Family Residence
12 Months Ago 6 Months Ago 3 Months Ago Last Month
Active Inventory 565 633 669 662
Pending Inventory 83 86 92 92
Sold Inventory 116 66 77 11
Average Sale Price $301,893 $323,440 $296,808 $281,582
Days on Market 135 96 128 43
Inland Empire Market Report | APRIL 2016

JURUPAVALLEY
0
20
40
60
80
100
120
140
12 Months Ago 6 Months Ago 3 Months Ago Last Month
Active Inventory Pending Inventory
Sold Inventory Days on Market
SingleFamilyResidenceJURUPA VALLEY Single Family Residence
12 Months Ago 6 Months Ago 3 Months Ago Last Month
Active Inventory 84 119 90 115
Pending Inventory 51 48 53 45
Sold Inventory 34 23 20 32
Average Sale Price $330,755 $346,874 $332,215 $384,603
Days on Market 48 56 82 67
Inland Empire Market Report | APRIL 2016
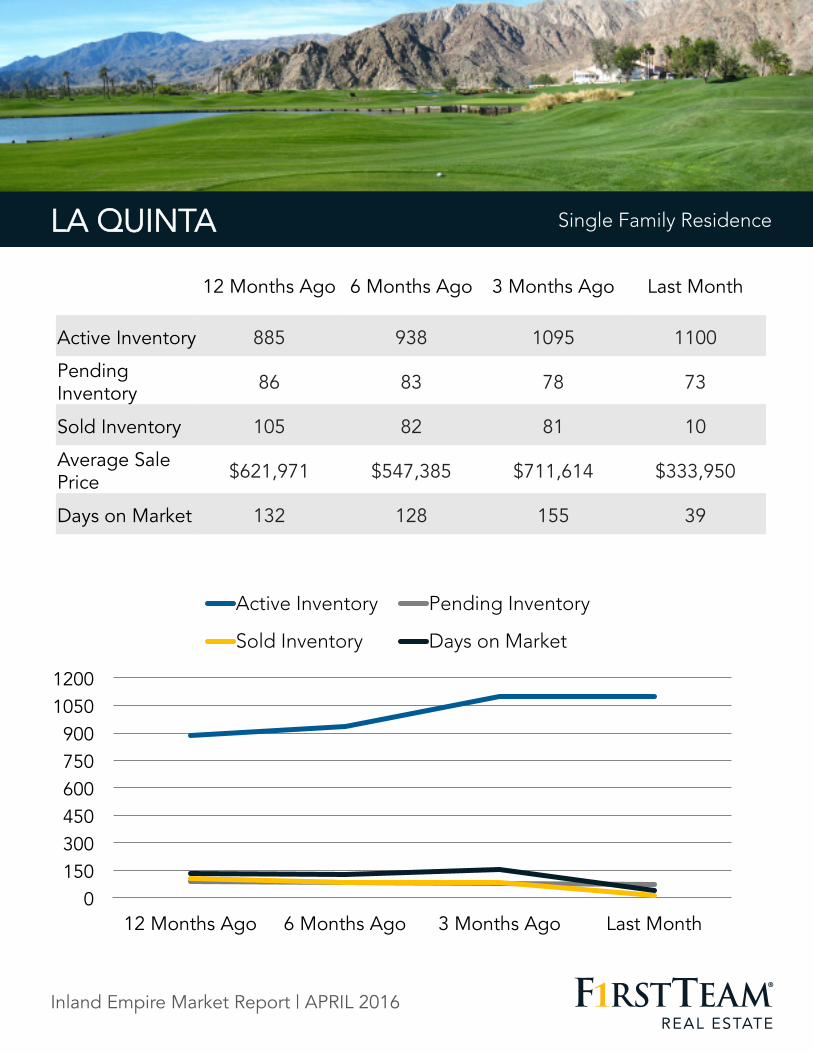
LAQUINTA
0 150 300 450 600 750 900
1050 1200
12 Months Ago 6 Months Ago 3 Months Ago Last Month
Active Inventory Pending Inventory
Sold Inventory Days on Market
SingleFamilyResidenceLA QUINTA Single Family Residence
12 Months Ago 6 Months Ago 3 Months Ago Last Month
Active Inventory 885 938 1095 1100
Pending Inventory 86 83 78 73
Sold Inventory 105 82 81 10
Average Sale Price $621,971 $547,385 $711,614 $333,950
Days on Market 132 128 155 39
Inland Empire Market Report | APRIL 2016

LAKEELSINORE
0 50
100 150 200 250 300 350 400
12 Months Ago 6 Months Ago 3 Months Ago Last Month
Active Inventory Pending Inventory
Sold Inventory Days on Market
SingleFamilyResidenceLAKE ELSINORE Single Family Residence
12 Months Ago 6 Months Ago 3 Months Ago Last Month
Active Inventory 317 323 308 343
Pending Inventory 174 167 157 136
Sold Inventory 89 67 68 94
Average Sale Price $288,186 $295,299 $332,180 $295,072
Days on Market 81 81 110 62
Inland Empire Market Report | APRIL 2016
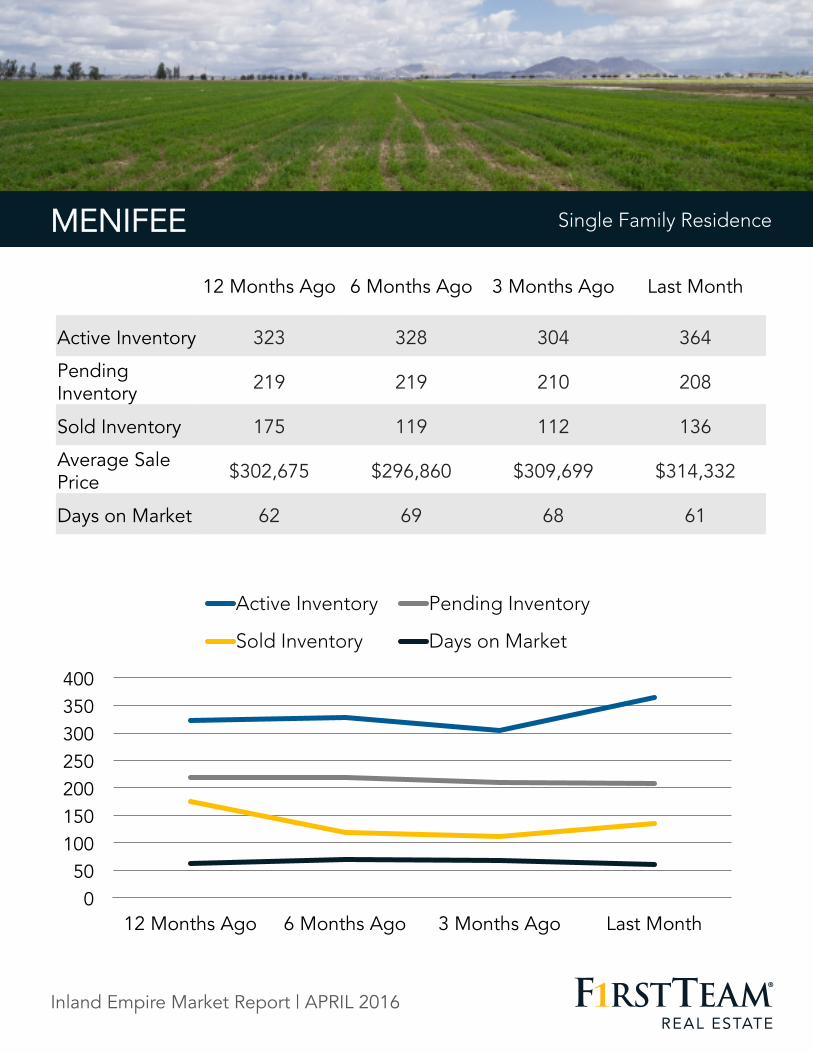
MENIFEE
0 50
100 150 200 250 300 350 400
12 Months Ago 6 Months Ago 3 Months Ago Last Month
Active Inventory Pending Inventory
Sold Inventory Days on Market
SingleFamilyResidenceMENIFEE Single Family Residence
12 Months Ago 6 Months Ago 3 Months Ago Last Month
Active Inventory 323 328 304 364
Pending Inventory 219 219 210 208
Sold Inventory 175 119 112 136
Average Sale Price $302,675 $296,860 $309,699 $314,332
Days on Market 62 69 68 61
Inland Empire Market Report | APRIL 2016
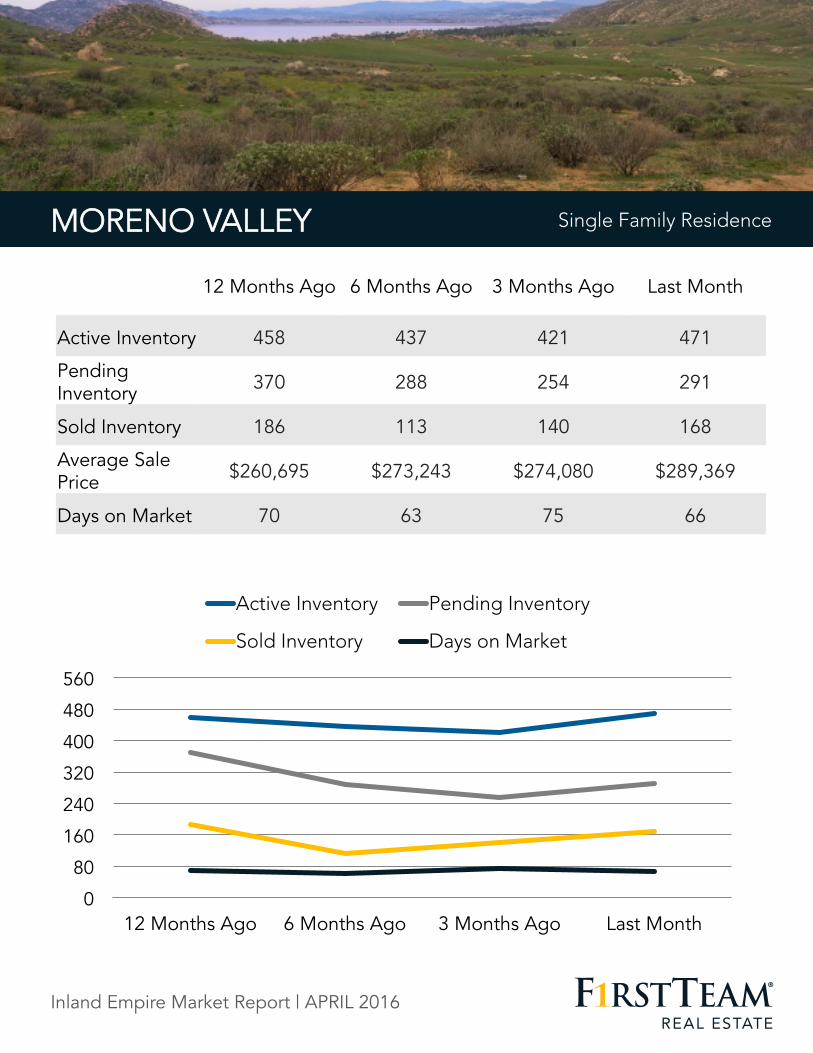
MORENOVALLEYSingleFamilyResidence
MORENO VALLEY Single Family Residence
12 Months Ago 6 Months Ago 3 Months Ago Last Month
Active Inventory 458 437 421 471
Pending Inventory 370 288 254 291
Sold Inventory 186 113 140 168
Average Sale Price $260,695 $273,243 $274,080 $289,369
Days on Market 70 63 75 66
Inland Empire Market Report | APRIL 2016
0
80
160
240
320
400
480
560
12 Months Ago 6 Months Ago 3 Months Ago Last Month
Active Inventory Pending Inventory
Sold Inventory Days on Market

MURRIETA
0
100
200
300
400
500
600
700
12 Months Ago 6 Months Ago 3 Months Ago Last Month
Active Inventory Pending Inventory
Sold Inventory Days on Market
SingleFamilyResidenceMURRIETA Single Family Residence
12 Months Ago 6 Months Ago 3 Months Ago Last Month
Active Inventory 554 495 452 582
Pending Inventory 314 228 292 271
Sold Inventory 219 143 119 164
Average Sale Price $365,787 $414,313 $369,429 $401,694
Days on Market 68 103 99 93
Inland Empire Market Report | APRIL 2016
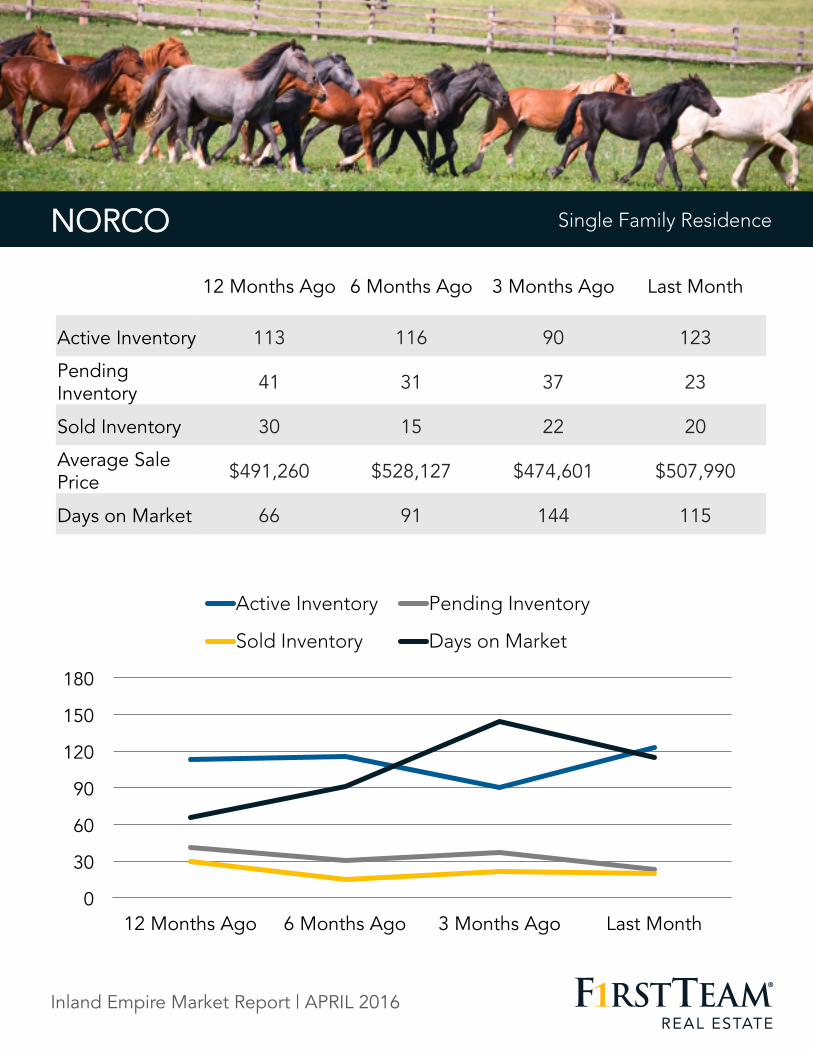
NORCOSingleFamilyResidence
NORCO Single Family Residence
12 Months Ago 6 Months Ago 3 Months Ago Last Month
Active Inventory 113 116 90 123
Pending Inventory 41 31 37 23
Sold Inventory 30 15 22 20
Average Sale Price $491,260 $528,127 $474,601 $507,990
Days on Market 66 91 144 115
Inland Empire Market Report | APRIL 2016
0
30
60
90
120
150
180
12 Months Ago 6 Months Ago 3 Months Ago Last Month
Active Inventory Pending Inventory
Sold Inventory Days on Market
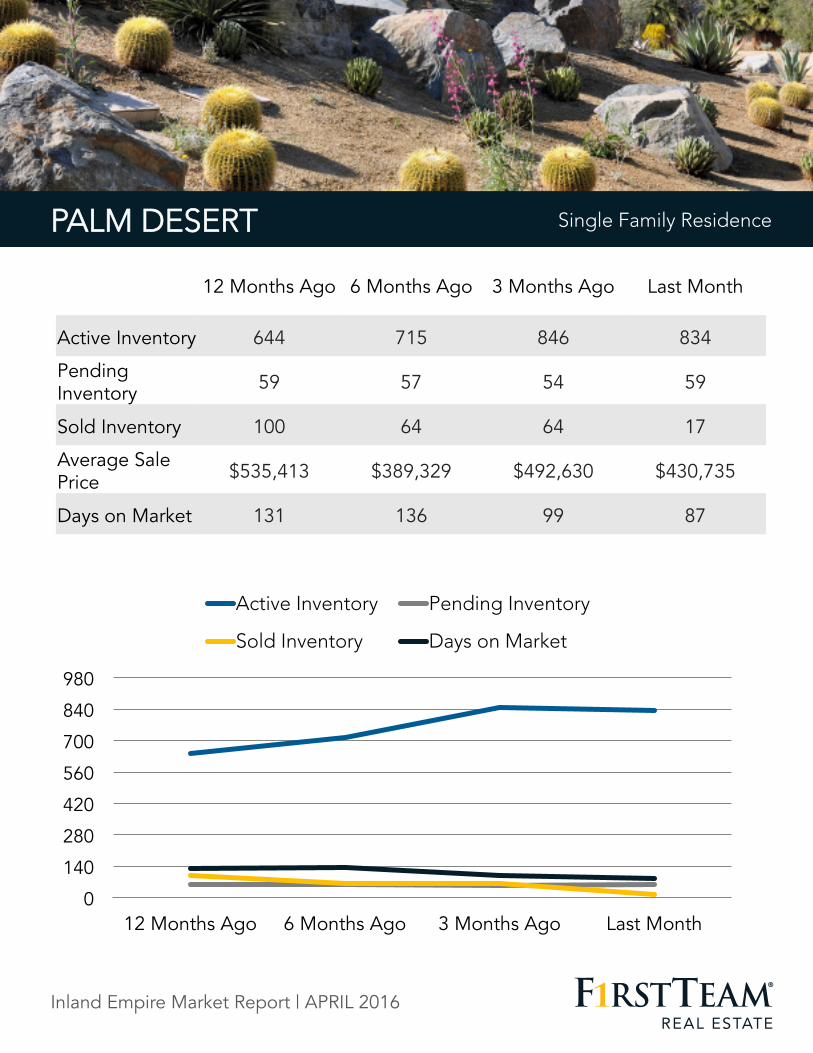
PALMDESERT
0
140
280
420
560
700
840
980
12 Months Ago 6 Months Ago 3 Months Ago Last Month
Active Inventory Pending Inventory
Sold Inventory Days on Market
SingleFamilyResidencePALM DESERT Single Family Residence
12 Months Ago 6 Months Ago 3 Months Ago Last Month
Active Inventory 644 715 846 834
Pending Inventory 59 57 54 59
Sold Inventory 100 64 64 17
Average Sale Price $535,413 $389,329 $492,630 $430,735
Days on Market 131 136 99 87
Inland Empire Market Report | APRIL 2016
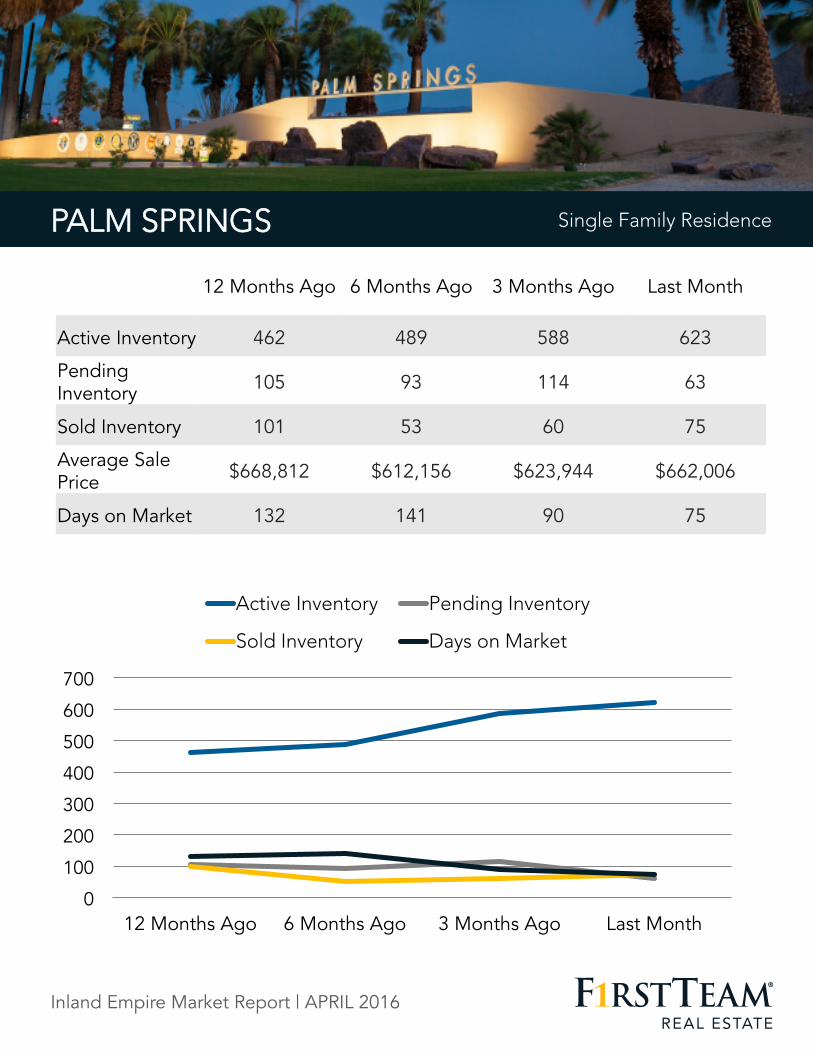
PALMSPRINGS
0
100
200
300
400
500
600
700
12 Months Ago 6 Months Ago 3 Months Ago Last Month
Active Inventory Pending Inventory
Sold Inventory Days on Market
SingleFamilyResidencePALM SPRINGS Single Family Residence
12 Months Ago 6 Months Ago 3 Months Ago Last Month
Active Inventory 462 489 588 623
Pending Inventory 105 93 114 63
Sold Inventory 101 53 60 75
Average Sale Price $668,812 $612,156 $623,944 $662,006
Days on Market 132 141 90 75
Inland Empire Market Report | APRIL 2016
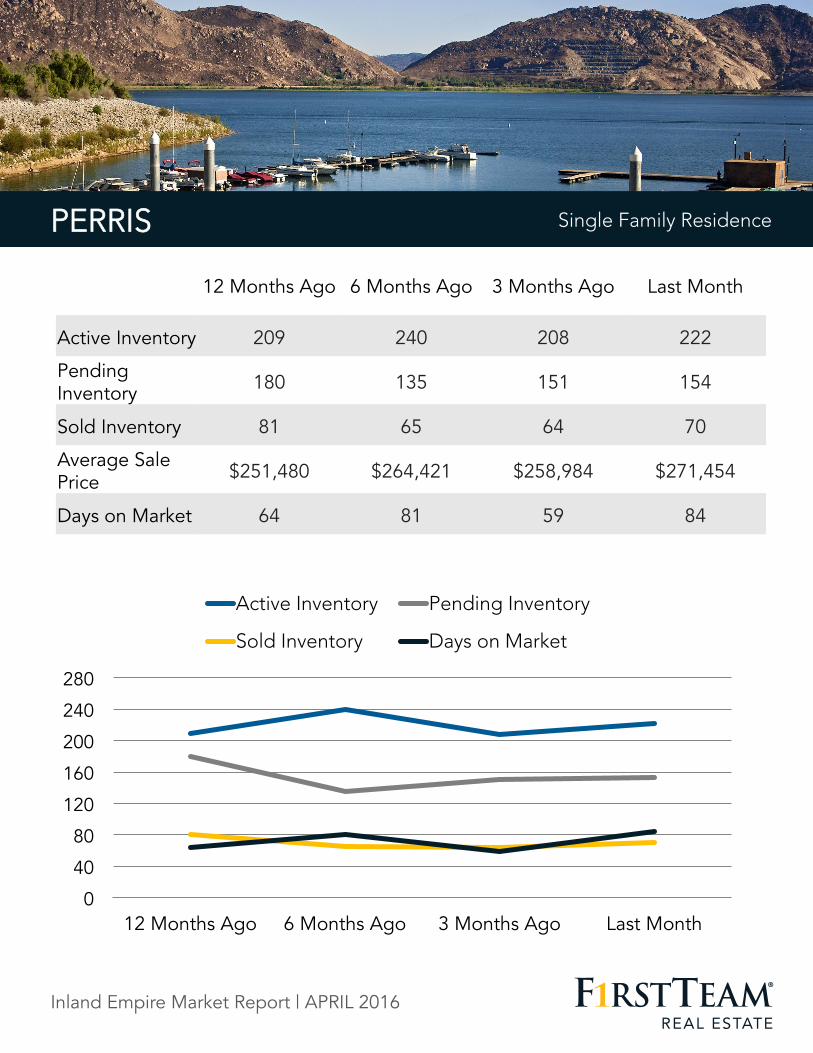
PERRIS
0
40
80
120
160
200
240
280
12 Months Ago 6 Months Ago 3 Months Ago Last Month
Active Inventory Pending Inventory
Sold Inventory Days on Market
SingleFamilyResidencePERRIS Single Family Residence
12 Months Ago 6 Months Ago 3 Months Ago Last Month
Active Inventory 209 240 208 222
Pending Inventory 180 135 151 154
Sold Inventory 81 65 64 70
Average Sale Price $251,480 $264,421 $258,984 $271,454
Days on Market 64 81 59 84
Inland Empire Market Report | APRIL 2016
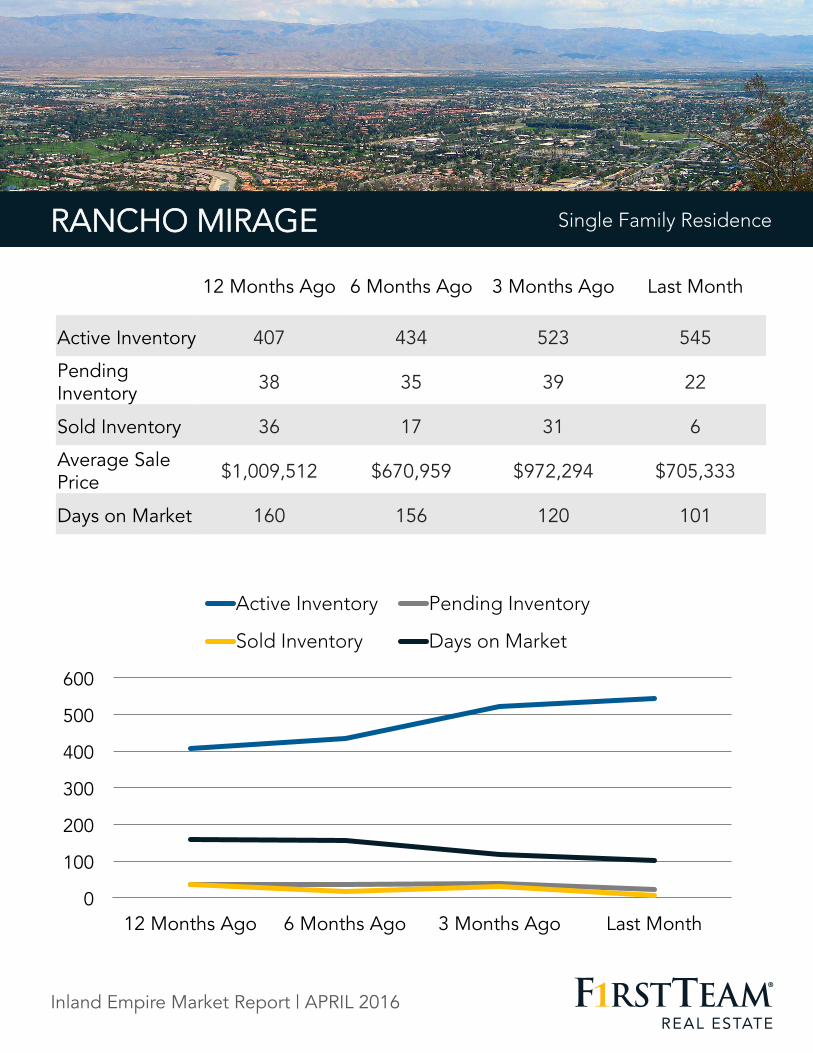
RANCHOMIRAGE
0
100
200
300
400
500
600
12 Months Ago 6 Months Ago 3 Months Ago Last Month
Active Inventory Pending Inventory
Sold Inventory Days on Market
SingleFamilyResidenceRANCHO MIRAGE Single Family Residence
12 Months Ago 6 Months Ago 3 Months Ago Last Month
Active Inventory 407 434 523 545
Pending Inventory 38 35 39 22
Sold Inventory 36 17 31 6
Average Sale Price $1,009,512 $670,959 $972,294 $705,333
Days on Market 160 156 120 101
Inland Empire Market Report | APRIL 2016
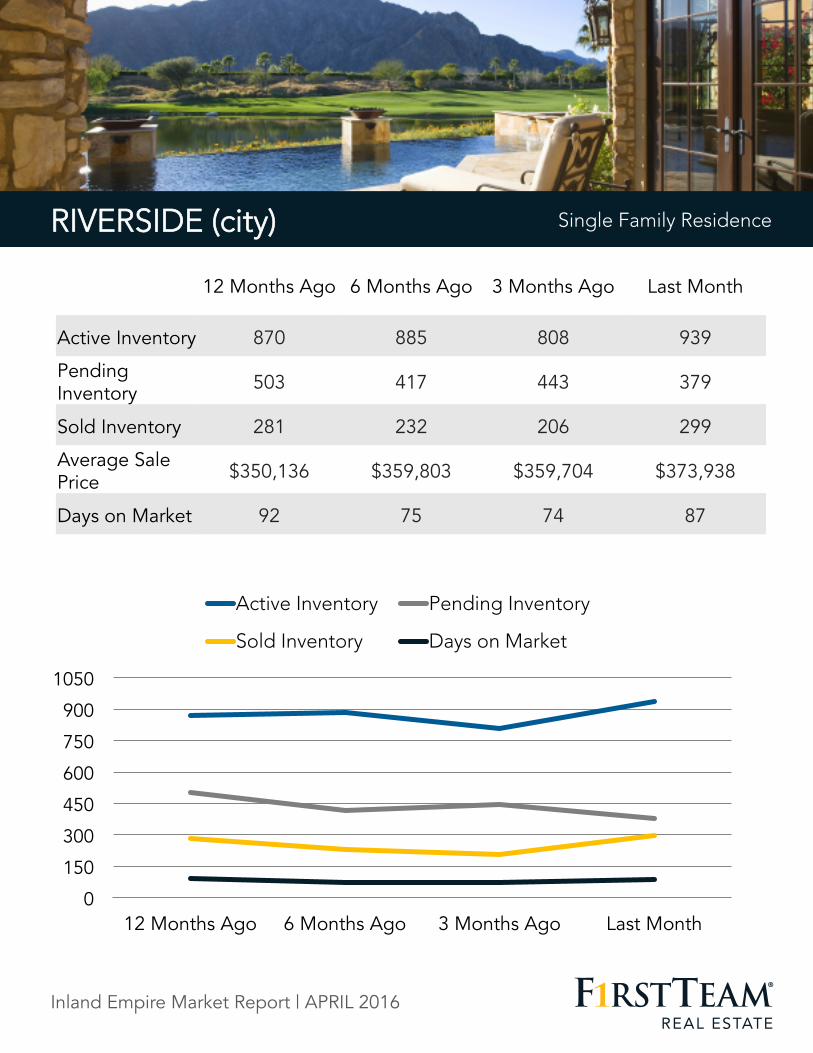
RIVERSIDE(city)
0
150
300
450
600
750
900
1050
12 Months Ago 6 Months Ago 3 Months Ago Last Month
Active Inventory Pending Inventory
Sold Inventory Days on Market
SingleFamilyResidenceRIVERSIDE (city) Single Family Residence
12 Months Ago 6 Months Ago 3 Months Ago Last Month
Active Inventory 870 885 808 939
Pending Inventory 503 417 443 379
Sold Inventory 281 232 206 299
Average Sale Price $350,136 $359,803 $359,704 $373,938
Days on Market 92 75 74 87
Inland Empire Market Report | APRIL 2016
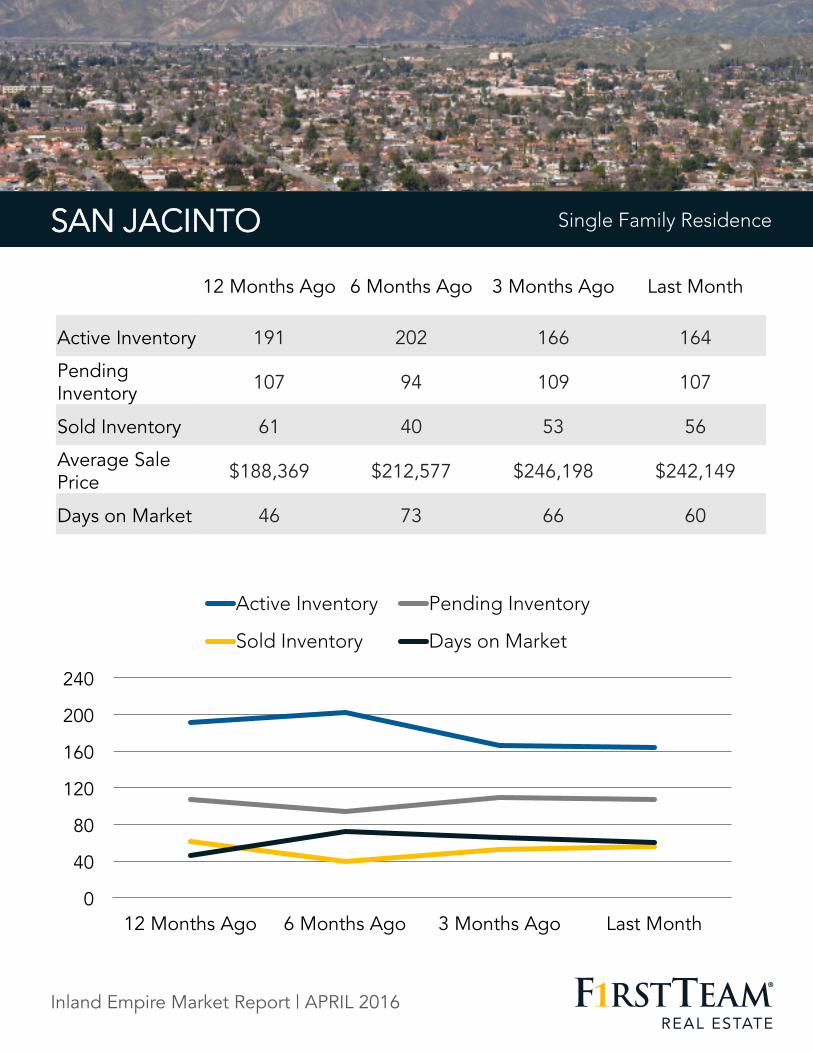
SANJACINTO
0
40
80
120
160
200
240
12 Months Ago 6 Months Ago 3 Months Ago Last Month
Active Inventory Pending Inventory
Sold Inventory Days on Market
SingleFamilyResidenceSAN JACINTO Single Family Residence
12 Months Ago 6 Months Ago 3 Months Ago Last Month
Active Inventory 191 202 166 164
Pending Inventory 107 94 109 107
Sold Inventory 61 40 53 56
Average Sale Price $188,369 $212,577 $246,198 $242,149
Days on Market 46 73 66 60
Inland Empire Market Report | APRIL 2016

TEMECULATEMECULA
0
100
200
300
400
500
600
700
12 Months Ago 6 Months Ago 3 Months Ago Last Month
Active Inventory Pending Inventory
Sold Inventory Days on Market
Single Family Residence
12 Months Ago 6 Months Ago 3 Months Ago Last Month
Active Inventory 618 527 443 585
Pending Inventory 319 267 303 229
Sold Inventory 218 122 143 177
Average Sale Price $452,573 $432,935 $468,608 $463,465
Days on Market 134 102 97 88
Inland Empire Market Report | APRIL 2016

WILDOMARWILDOMAR
0
20
40
60
80
100
120
140
12 Months Ago 6 Months Ago 3 Months Ago Last Month
Active Inventory Pending Inventory
Sold Inventory Days on Market
Single Family Residence
12 Months Ago 6 Months Ago 3 Months Ago Last Month
Active Inventory 113 114 107 129
Pending Inventory 72 60 56 56
Sold Inventory 47 23 26 43
Average Sale Price $327,274 $325,303 $325,037 $324,065
Days on Market 87 78 55 58
Inland Empire Market Report | APRIL 2016
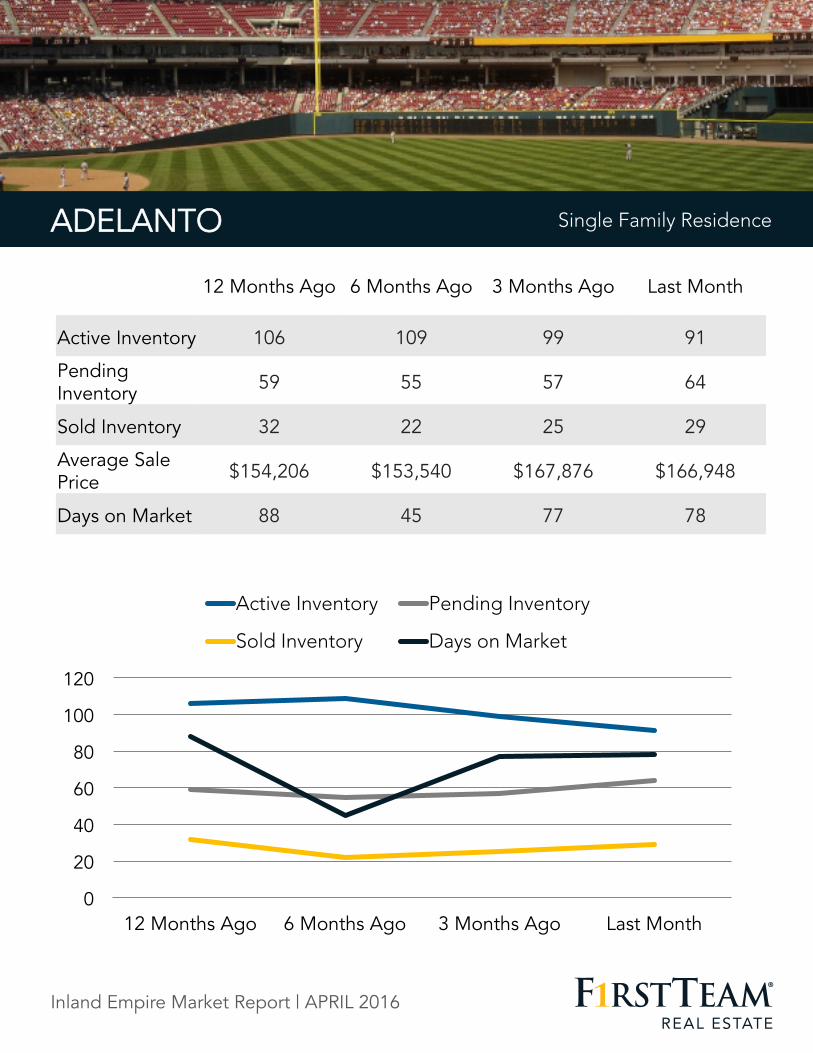
ADELANTO
0
20
40
60
80
100
120
12 Months Ago 6 Months Ago 3 Months Ago Last Month
Active Inventory Pending Inventory
Sold Inventory Days on Market
SingleFamilyResidenceADELANTO Single Family Residence
12 Months Ago 6 Months Ago 3 Months Ago Last Month
Active Inventory 106 109 99 91
Pending Inventory 59 55 57 64
Sold Inventory 32 22 25 29
Average Sale Price $154,206 $153,540 $167,876 $166,948
Days on Market 88 45 77 78
Inland Empire Market Report | APRIL 2016
APPLEVALLEYSingleFamilyResidence
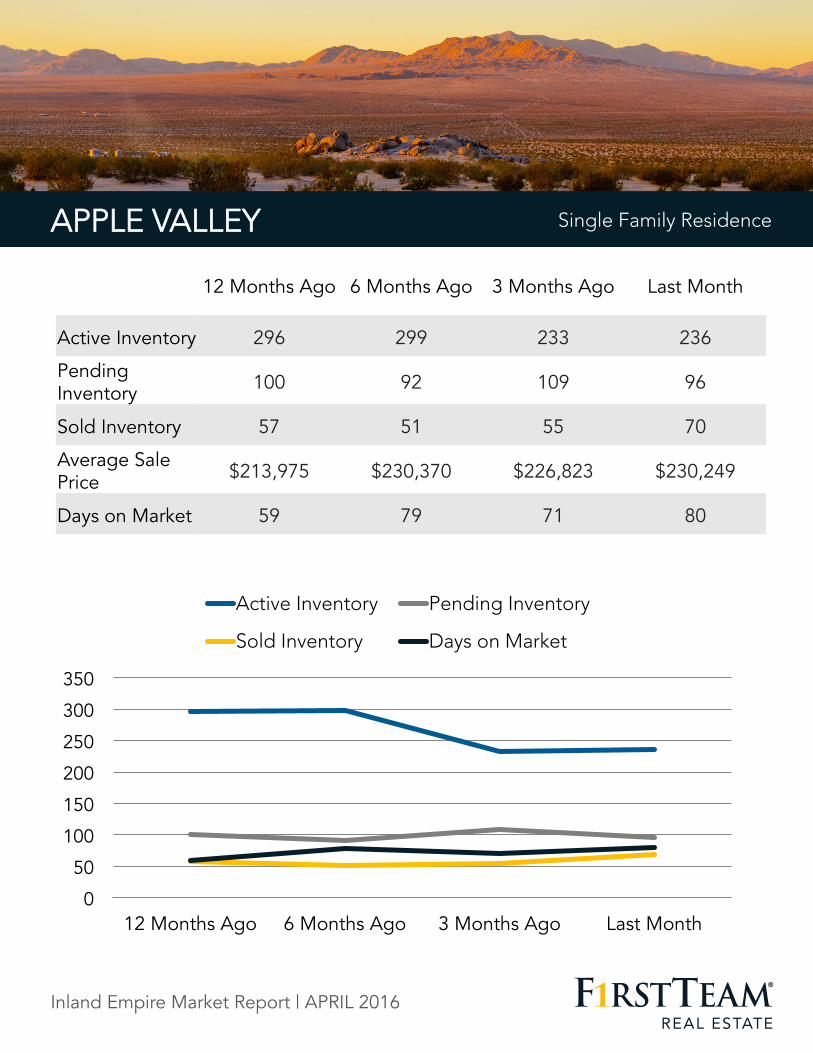
APPLE VALLEY Single Family Residence
12 Months Ago 6 Months Ago 3 Months Ago Last Month
Active Inventory 296 299 233 236
Pending Inventory 100 92 109 96
Sold Inventory 57 51 55 70
Average Sale Price $213,975 $230,370 $226,823 $230,249
Days on Market 59 79 71 80
Inland Empire Market Report | APRIL 2016
0
50
100
150
200
250
300
350
12 Months Ago 6 Months Ago 3 Months Ago Last Month
Active Inventory Pending Inventory
Sold Inventory Days on Market
BARSTOW
0
50
100
150
200
250
300
12 Months Ago 6 Months Ago 3 Months Ago Last Month
Active Inventory Pending Inventory
Sold Inventory Days on Market
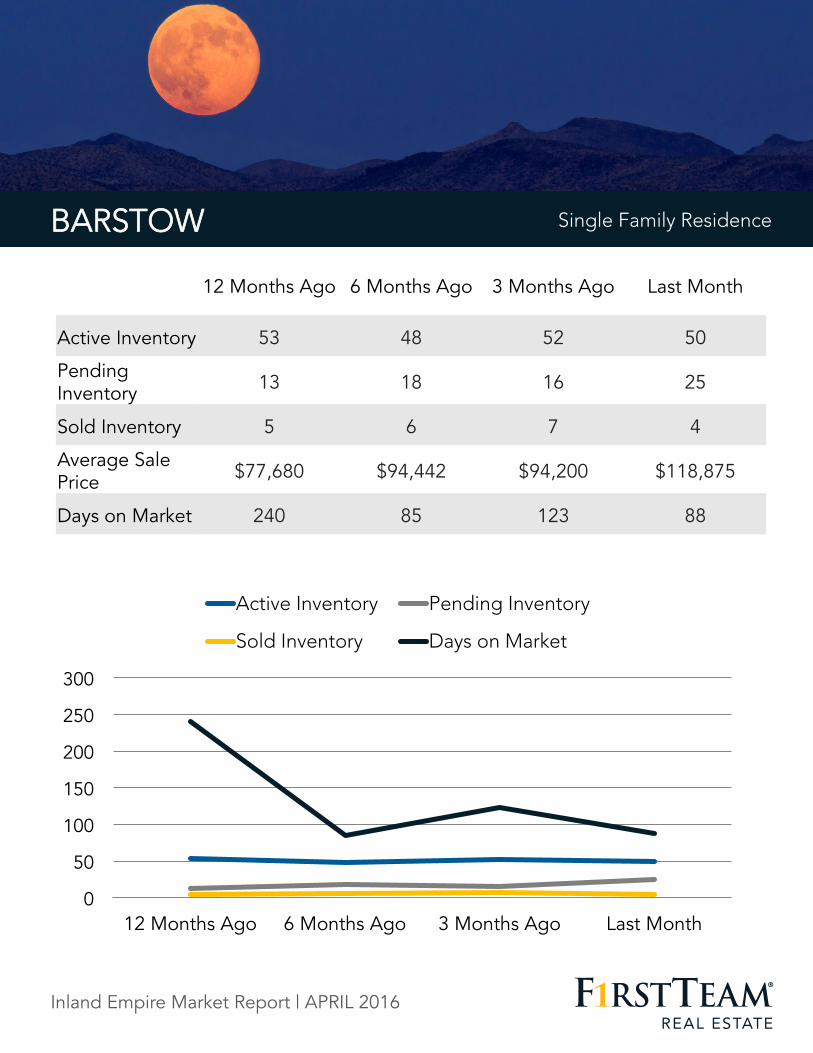
SingleFamilyResidenceBARSTOW Single Family Residence
12 Months Ago 6 Months Ago 3 Months Ago Last Month
Active Inventory 53 48 52 50
Pending Inventory 13 18 16 25
Sold Inventory 5 6 7 4
Average Sale Price $77,680 $94,442 $94,200 $118,875
Days on Market 240 85 123 88
Inland Empire Market Report | APRIL 2016

0
70
140
210
280
350
420
12 Months Ago 6 Months Ago 3 Months Ago Last Month
Active Inventory Pending Inventory
Sold Inventory Days on Market
BIG BEAR Single Family Residence
12 Months Ago 6 Months Ago 3 Months Ago Last Month
Active Inventory 381 339 292 354
Pending Inventory 67 103 90 44
Sold Inventory 44 57 50 48
Average Sale Price $352,687 $322,997 $376,131 $293,482
Days on Market 94 139 220 82
Inland Empire Market Report | APRIL 2016

CHINO
0
40
80
120
160
200
240
12 Months Ago 6 Months Ago 3 Months Ago Last Month
Active Inventory Pending Inventory
Sold Inventory Days on Market
SingleFamilyResidenceCHINO Single Family Residence
12 Months Ago 6 Months Ago 3 Months Ago Last Month
Active Inventory 192 178 156 195
Pending Inventory 83 89 80 65
Sold Inventory 47 42 38 54
Average Sale Price $457,446 $475,263 $506,505 $465,440
Days on Market 73 103 68 85
Inland Empire Market Report | APRIL 2016
CHINOHILLS
0
50
100
150
200
250
12 Months Ago 6 Months Ago 3 Months Ago Last Month
Active Inventory Pending Inventory
Sold Inventory Days on Market
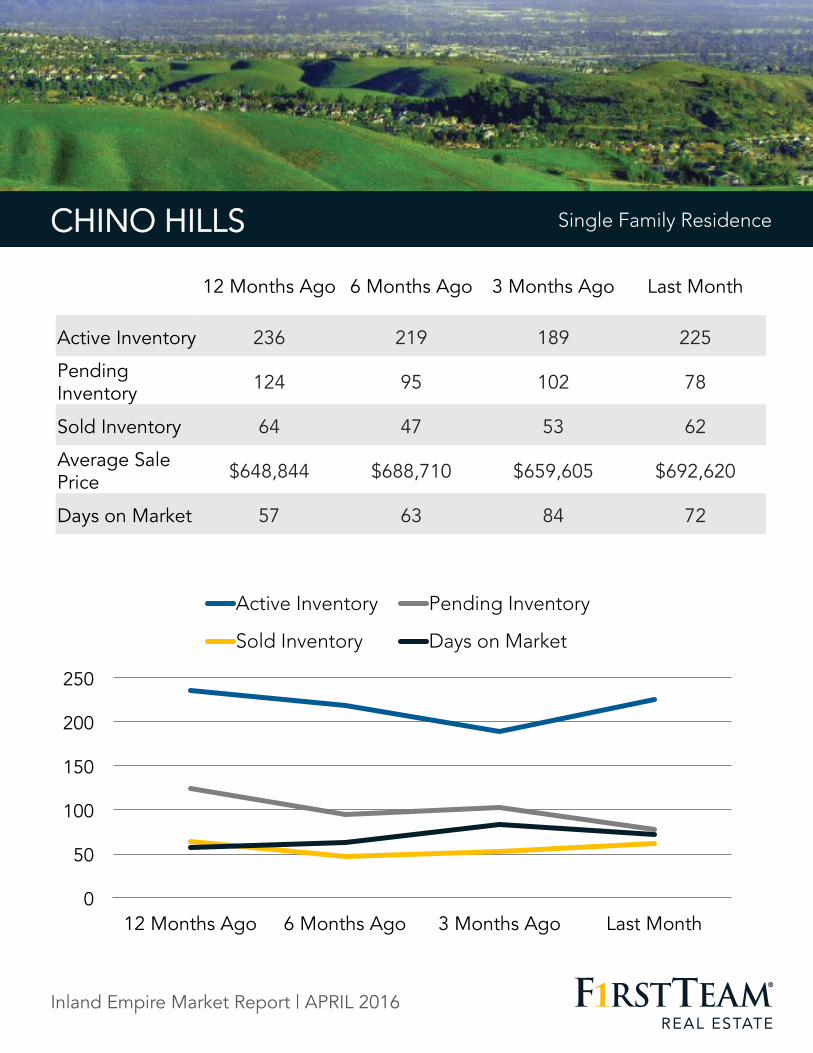
SingleFamilyResidenceCHINO HILLS Single Family Residence
12 Months Ago 6 Months Ago 3 Months Ago Last Month
Active Inventory 236 219 189 225
Pending Inventory 124 95 102 78
Sold Inventory 64 47 53 62
Average Sale Price $648,844 $688,710 $659,605 $692,620
Days on Market 57 63 84 72
Inland Empire Market Report | APRIL 2016
COLTON
0
20
40
60
80
100
120
12 Months Ago 6 Months Ago 3 Months Ago Last Month
Active Inventory Pending Inventory
Sold Inventory Days on Market
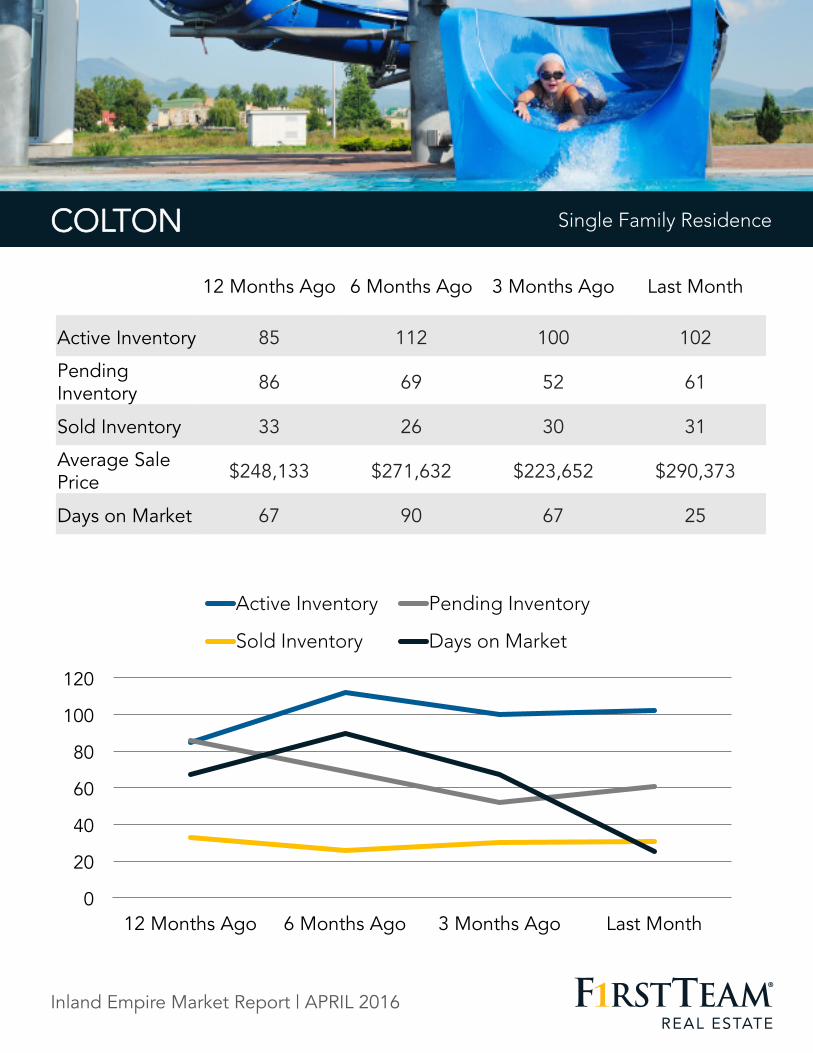
SingleFamilyResidenceCOLTON Single Family Residence
12 Months Ago 6 Months Ago 3 Months Ago Last Month
Active Inventory 85 112 100 102
Pending Inventory 86 69 52 61
Sold Inventory 33 26 30 31
Average Sale Price $248,133 $271,632 $223,652 $290,373
Days on Market 67 90 67 25
Inland Empire Market Report | APRIL 2016
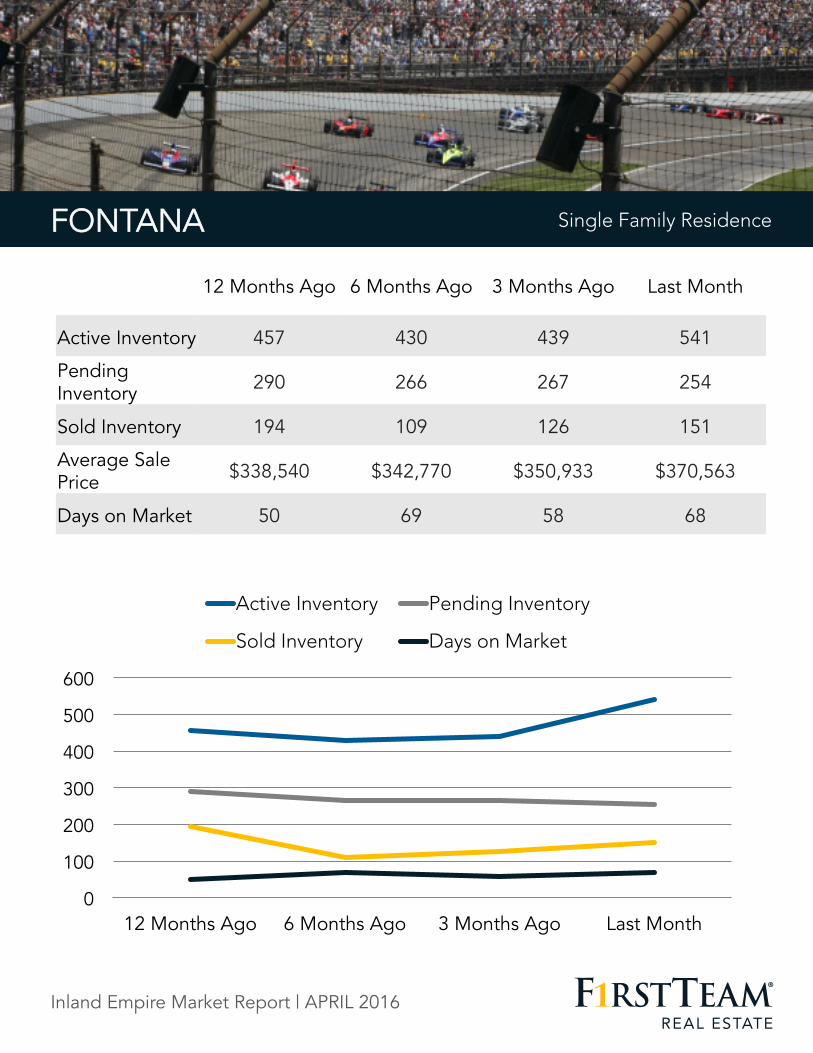
FONTANA
0
100
200
300
400
500
600
12 Months Ago 6 Months Ago 3 Months Ago Last Month
Active Inventory Pending Inventory
Sold Inventory Days on Market
SingleFamilyResidenceFONTANA Single Family Residence
12 Months Ago 6 Months Ago 3 Months Ago Last Month
Active Inventory 457 430 439 541
Pending Inventory 290 266 267 254
Sold Inventory 194 109 126 151
Average Sale Price $338,540 $342,770 $350,933 $370,563
Days on Market 50 69 58 68
Inland Empire Market Report | APRIL 2016

GRANDTERRACE
0
20
40
60
80
100
12 Months Ago 6 Months Ago 3 Months Ago Last Month
Active Inventory Pending Inventory
Sold Inventory Days on Market
SingleFamilyResidenceGRAND TERRACE Single Family Residence
12 Months Ago 6 Months Ago 3 Months Ago Last Month
Active Inventory 21 23 31 39
Pending Inventory 20 10 15 14
Sold Inventory 11 2 3 9
Average Sale Price $328,241 $255,250 $322,333 $325,111
Days on Market 77 76 37 22
Inland Empire Market Report | APRIL 2016
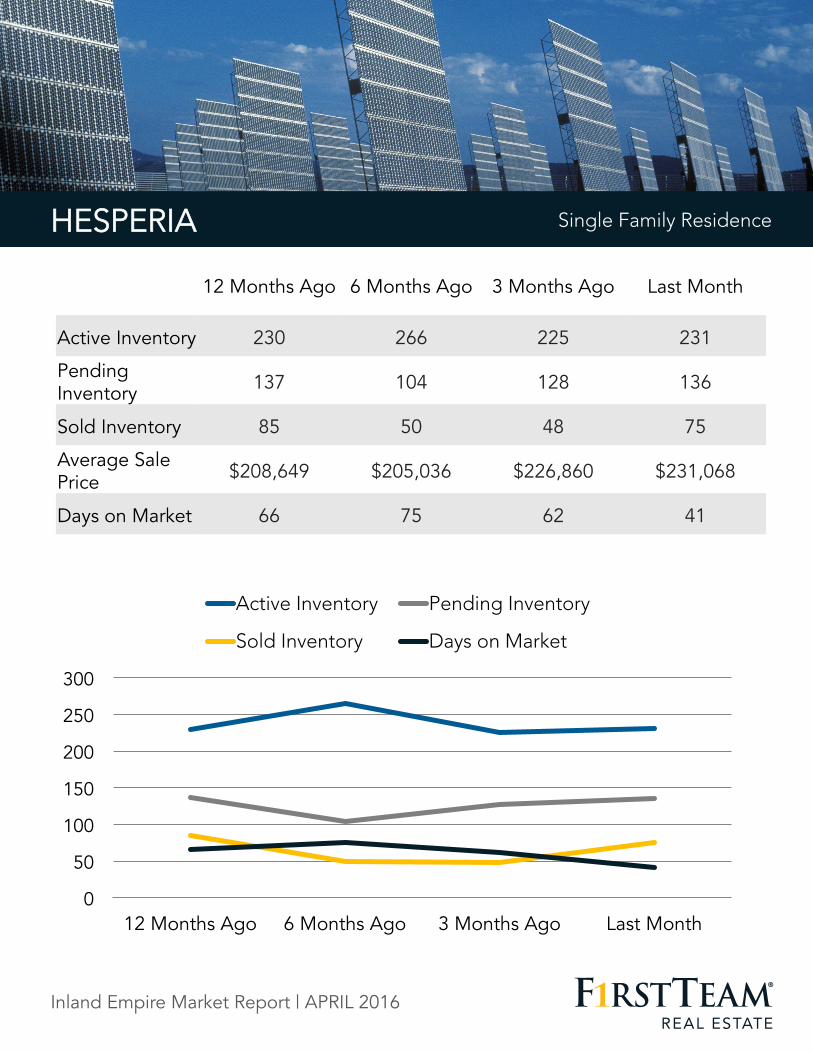
HESPERIA
0
50
100
150
200
250
300
12 Months Ago 6 Months Ago 3 Months Ago Last Month
Active Inventory Pending Inventory
Sold Inventory Days on Market
SingleFamilyResidenceHESPERIA Single Family Residence
12 Months Ago 6 Months Ago 3 Months Ago Last Month
Active Inventory 230 266 225 231
Pending Inventory 137 104 128 136
Sold Inventory 85 50 48 75
Average Sale Price $208,649 $205,036 $226,860 $231,068
Days on Market 66 75 62 41
Inland Empire Market Report | APRIL 2016
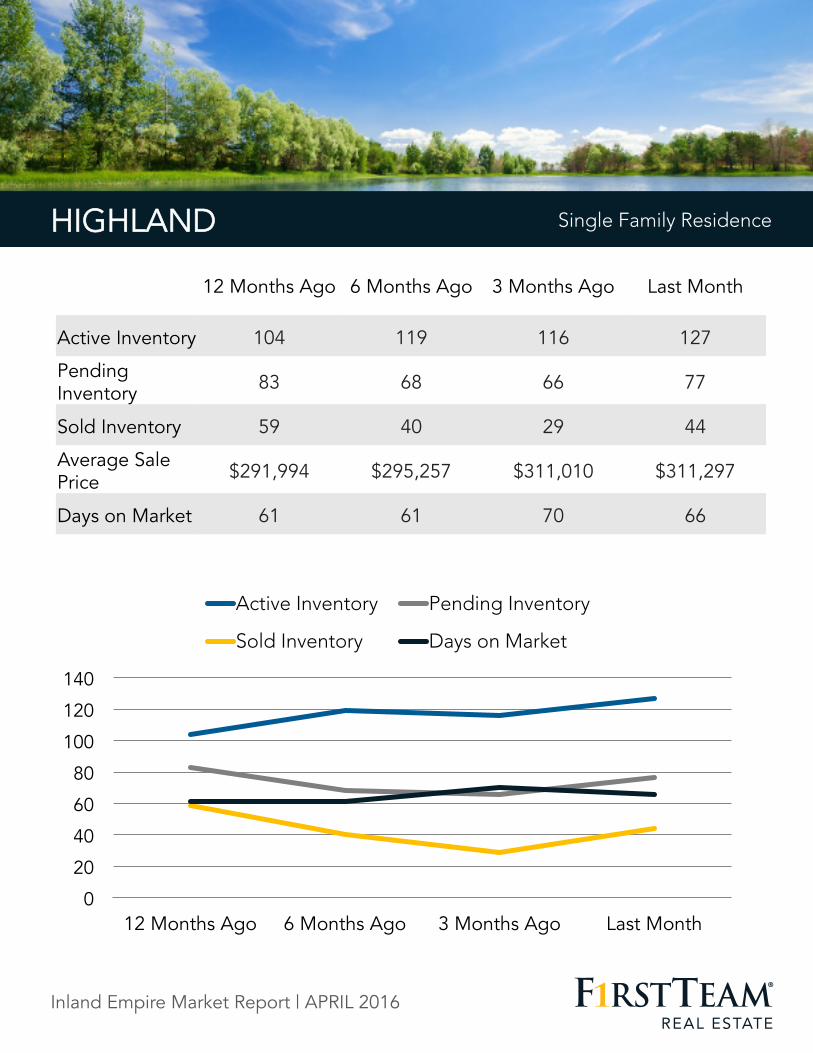
HIGHLAND
0
20
40
60
80
100
120
140
12 Months Ago 6 Months Ago 3 Months Ago Last Month
Active Inventory Pending Inventory
Sold Inventory Days on Market
SingleFamilyResidenceHIGHLAND Single Family Residence
12 Months Ago 6 Months Ago 3 Months Ago Last Month
Active Inventory 104 119 116 127
Pending Inventory 83 68 66 77
Sold Inventory 59 40 29 44
Average Sale Price $291,994 $295,257 $311,010 $311,297
Days on Market 61 61 70 66
Inland Empire Market Report | APRIL 2016
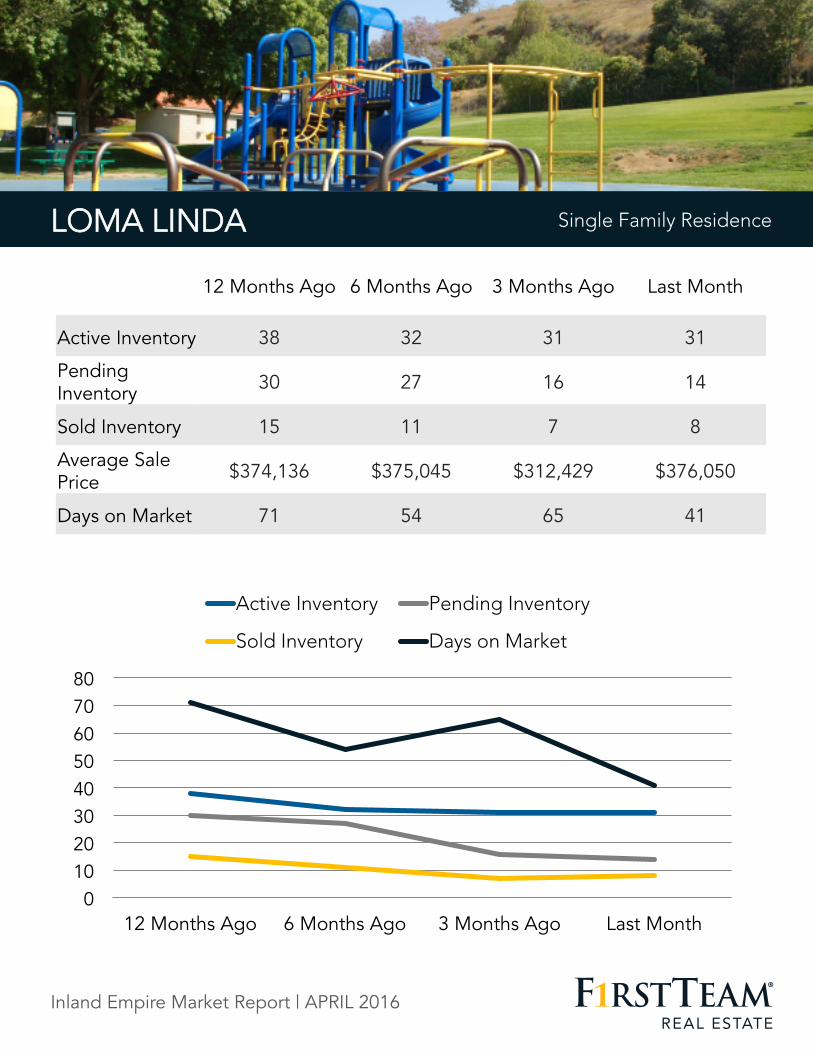
LOMALINDA
0 10 20 30 40 50 60 70 80
12 Months Ago 6 Months Ago 3 Months Ago Last Month
Active Inventory Pending Inventory
Sold Inventory Days on Market
SingleFamilyResidenceLOMA LINDA Single Family Residence
12 Months Ago 6 Months Ago 3 Months Ago Last Month
Active Inventory 38 32 31 31
Pending Inventory 30 27 16 14
Sold Inventory 15 11 7 8
Average Sale Price $374,136 $375,045 $312,429 $376,050
Days on Market 71 54 65 41
Inland Empire Market Report | APRIL 2016
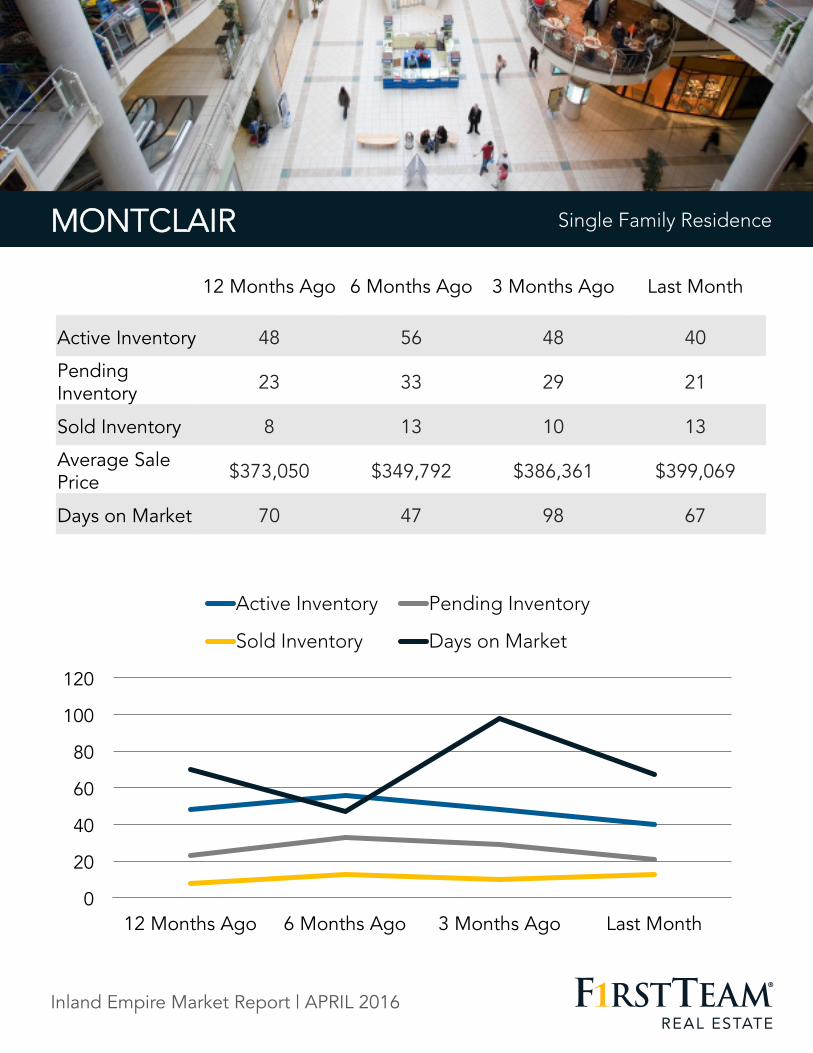
MONTCLAIR
0
20
40
60
80
100
120
12 Months Ago 6 Months Ago 3 Months Ago Last Month
Active Inventory Pending Inventory
Sold Inventory Days on Market
SingleFamilyResidenceMONTCLAIR Single Family Residence
12 Months Ago 6 Months Ago 3 Months Ago Last Month
Active Inventory 48 56 48 40
Pending Inventory 23 33 29 21
Sold Inventory 8 13 10 13
Average Sale Price $373,050 $349,792 $386,361 $399,069
Days on Market 70 47 98 67
Inland Empire Market Report | APRIL 2016

ONTARIO
0
50
100
150
200
250
300
12 Months Ago 6 Months Ago 3 Months Ago Last Month
Active Inventory Pending Inventory
Sold Inventory Days on Market
SingleFamilyResidenceONTARIO Single Family Residence
12 Months Ago 6 Months Ago 3 Months Ago Last Month
Active Inventory 247 251 234 249
Pending Inventory 158 140 133 123
Sold Inventory 76 73 64 76
Average Sale Price $357,909 $366,798 $362,967 $380,577
Days on Market 78 83 69 74
Inland Empire Market Report | APRIL 2016
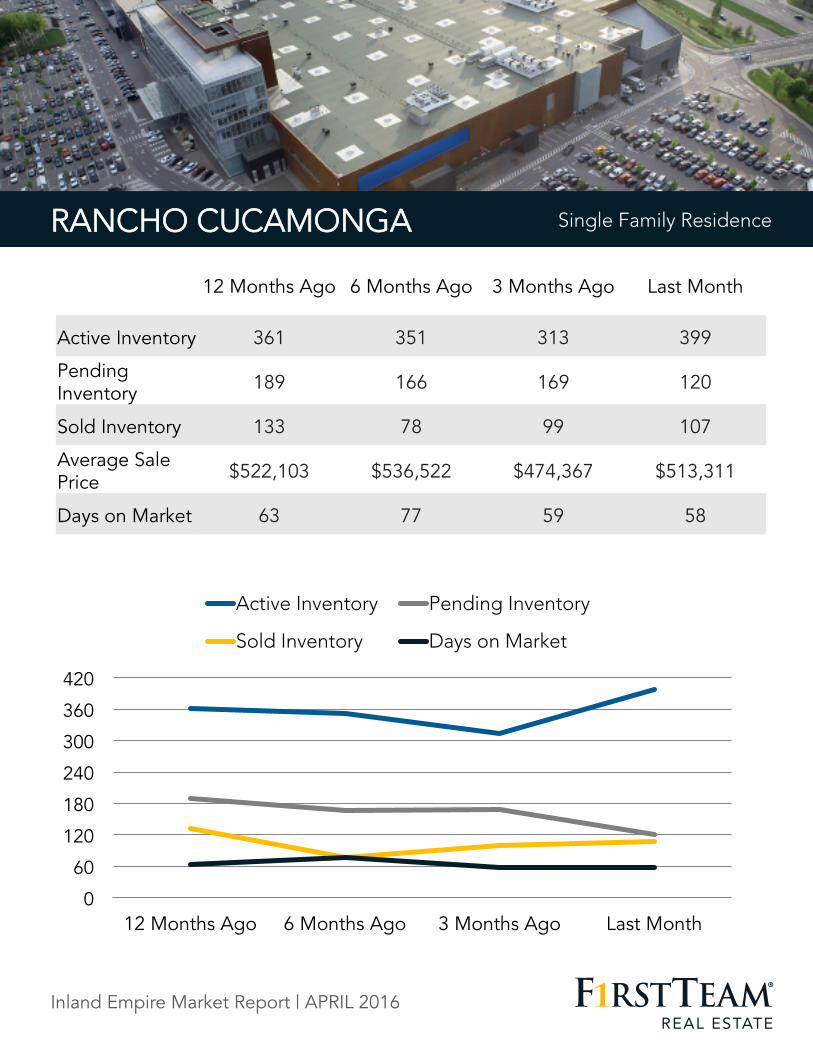
RANCHOCUCAMONGA
0
60
120
180
240
300
360
420
12 Months Ago 6 Months Ago 3 Months Ago Last Month
Active Inventory Pending Inventory
Sold Inventory Days on Market
SingleFamilyResidenceRANCHO CUCAMONGA Single Family Residence
12 Months Ago 6 Months Ago 3 Months Ago Last Month
Active Inventory 361 351 313 399
Pending Inventory 189 166 169 120
Sold Inventory 133 78 99 107
Average Sale Price $522,103 $536,522 $474,367 $513,311
Days on Market 63 77 59 58
Inland Empire Market Report | APRIL 2016

REDLANDS
0
40
80
120
160
200
240
280
12 Months Ago 6 Months Ago 3 Months Ago Last Month
Active Inventory Pending Inventory
Sold Inventory Days on Market
SingleFamilyResidenceREDLANDS Single Family Residence
12 Months Ago 6 Months Ago 3 Months Ago Last Month
Active Inventory 229 233 209 231
Pending Inventory 107 91 85 85
Sold Inventory 57 41 39 49
Average Sale Price $359,173 $372,416 $399,331 $442,821
Days on Market 71 69 60 62
Inland Empire Market Report | APRIL 2016
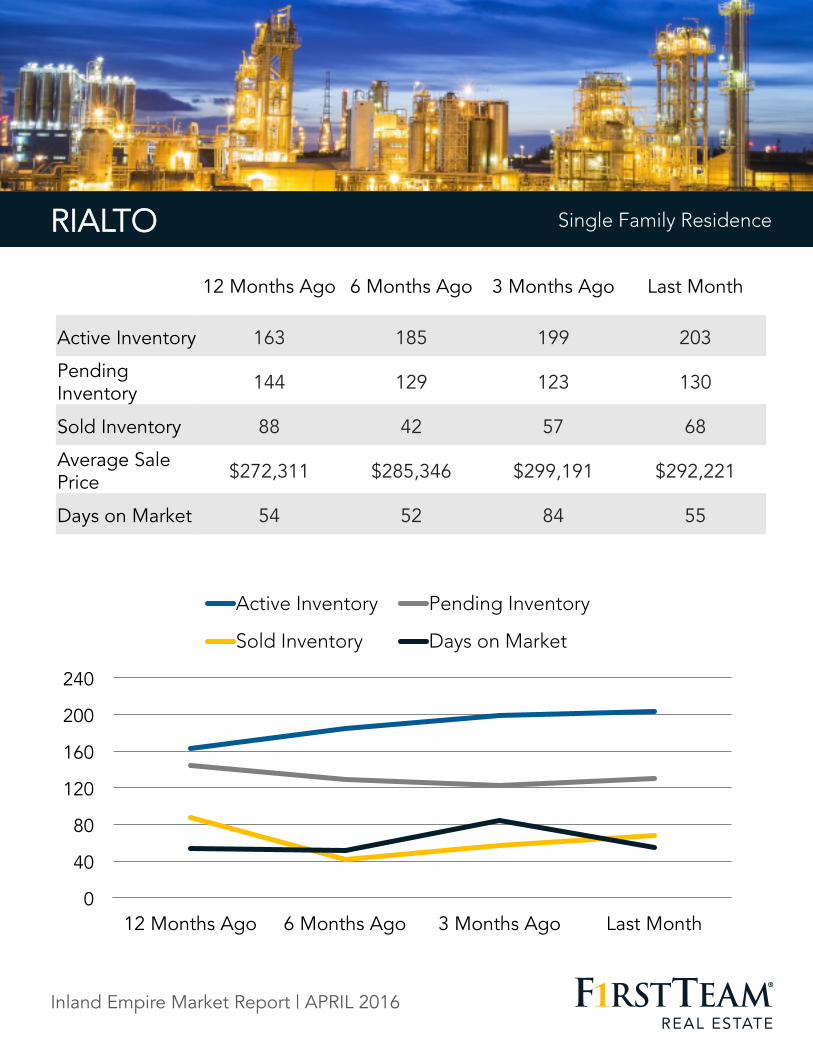
RIALTO
0
40
80
120
160
200
240
12 Months Ago 6 Months Ago 3 Months Ago Last Month
Active Inventory Pending Inventory
Sold Inventory Days on Market
SingleFamilyResidenceRIALTO Single Family Residence
12 Months Ago 6 Months Ago 3 Months Ago Last Month
Active Inventory 163 185 199 203
Pending Inventory 144 129 123 130
Sold Inventory 88 42 57 68
Average Sale Price $272,311 $285,346 $299,191 $292,221
Days on Market 54 52 84 55
Inland Empire Market Report | APRIL 2016
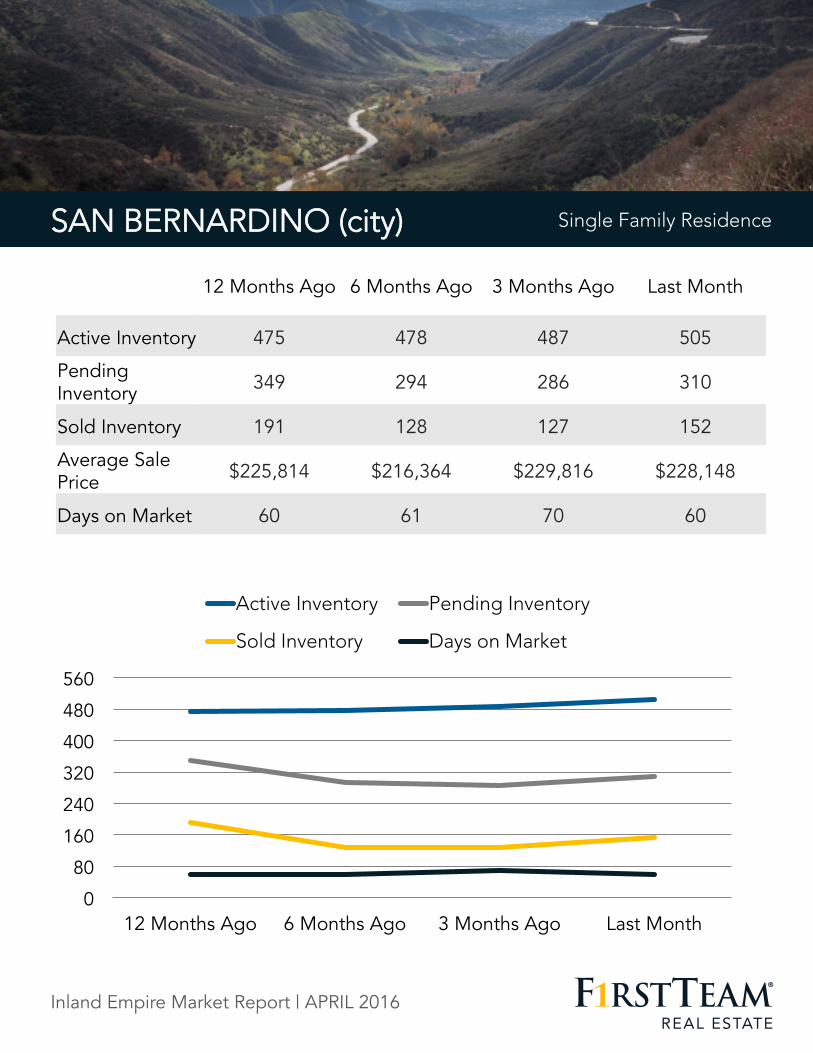
SANBERNARDINO(city)
0
80
160
240
320
400
480
560
12 Months Ago 6 Months Ago 3 Months Ago Last Month
Active Inventory Pending Inventory
Sold Inventory Days on Market
SingleFamilyResidenceSAN BERNARDINO (city) Single Family Residence
12 Months Ago 6 Months Ago 3 Months Ago Last Month
Active Inventory 475 478 487 505
Pending Inventory 349 294 286 310
Sold Inventory 191 128 127 152
Average Sale Price $225,814 $216,364 $229,816 $228,148
Days on Market 60 61 70 60
Inland Empire Market Report | APRIL 2016

UPLAND
0
40
80
120
160
200
240
12 Months Ago 6 Months Ago 3 Months Ago Last Month
Active Inventory Pending Inventory
Sold Inventory Days on Market
SingleFamilyResidenceUPLAND Single Family Residence
12 Months Ago 6 Months Ago 3 Months Ago Last Month
Active Inventory 195 191 150 214
Pending Inventory 104 79 72 56
Sold Inventory 58 44 42 45
Average Sale Price $483,069 $555,565 $546,981 $518,315
Days on Market 81 90 118 93
Inland Empire Market Report | APRIL 2016

VICTORVILLE
0
80
160
240
320
400
480
12 Months Ago 6 Months Ago 3 Months Ago Last Month
Active Inventory Pending Inventory
Sold Inventory Days on Market
SingleFamilyResidenceVICTORVILLE Single Family Residence
12 Months Ago 6 Months Ago 3 Months Ago Last Month
Active Inventory 431 424 376 384
Pending Inventory 220 192 200 207
Sold Inventory 127 84 91 108
Average Sale Price $195,705 $206,216 $204,290 $210,530
Days on Market 97 65 59 71
Inland Empire Market Report | APRIL 2016

YUCAIPA
0
40
80
120
160
200
240
280
12 Months Ago 6 Months Ago 3 Months Ago Last Month
Active Inventory Pending Inventory
Sold Inventory Days on Market
SingleFamilyResidenceYUCAIPA Single Family Residence
12 Months Ago 6 Months Ago 3 Months Ago Last Month
Active Inventory 194 194 203 244
Pending Inventory 94 80 96 59
Sold Inventory 44 46 24 52
Average Sale Price $303,869 $352,526 $307,584 $351,228
Days on Market 81 66 141 95
Inland Empire Market Report | APRIL 2016
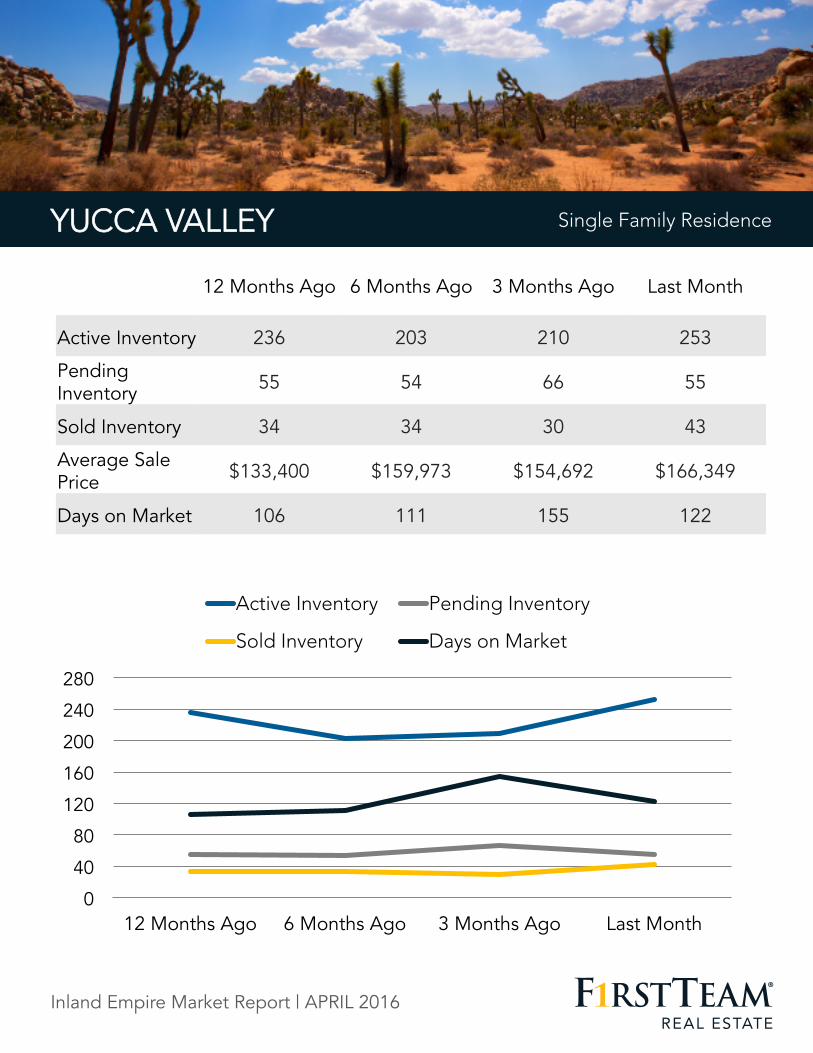
YUCCAVALLEY
0
40
80
120
160
200
240
280
12 Months Ago 6 Months Ago 3 Months Ago Last Month
Active Inventory Pending Inventory
Sold Inventory Days on Market
SingleFamilyResidenceYUCCA VALLEY Single Family Residence
12 Months Ago 6 Months Ago 3 Months Ago Last Month
Active Inventory 236 203 210 253
Pending Inventory 55 54 66 55
Sold Inventory 34 34 30 43
Average Sale Price $133,400 $159,973 $154,692 $166,349
Days on Market 106 111 155 122
Inland Empire Market Report | APRIL 2016

FirstTeam.com Inland Empire Market Report | APRIL 2016
Top Related