


Languages
Pages
Legal

Infrastructure Dialogues
Nico JonkerDirector Engineering ServicesAmathole District MunicipalityEast London
27 August 2009
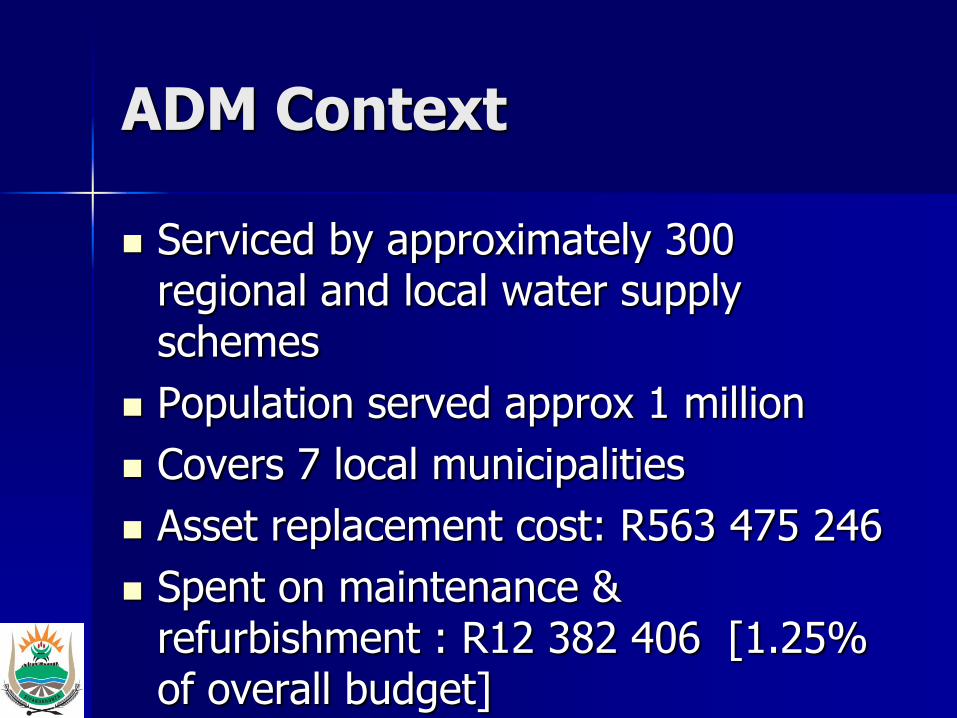
ADM Context
Serviced by approximately 300 regional and local water supply schemes
Population served approx 1 million
Covers 7 local municipalities
Asset replacement cost: R563 475 246
Spent on maintenance & refurbishment : R12 382 406 [1.25% of overall budget]

New Infrastructure
Demand for New infrastructure
– Large service backlogs
– High urban growth rates
– Water scarce area –drought impact
– High demand for housing
Demand for new infrastructure is substantial and requires substantial allocation of financial and technical resources
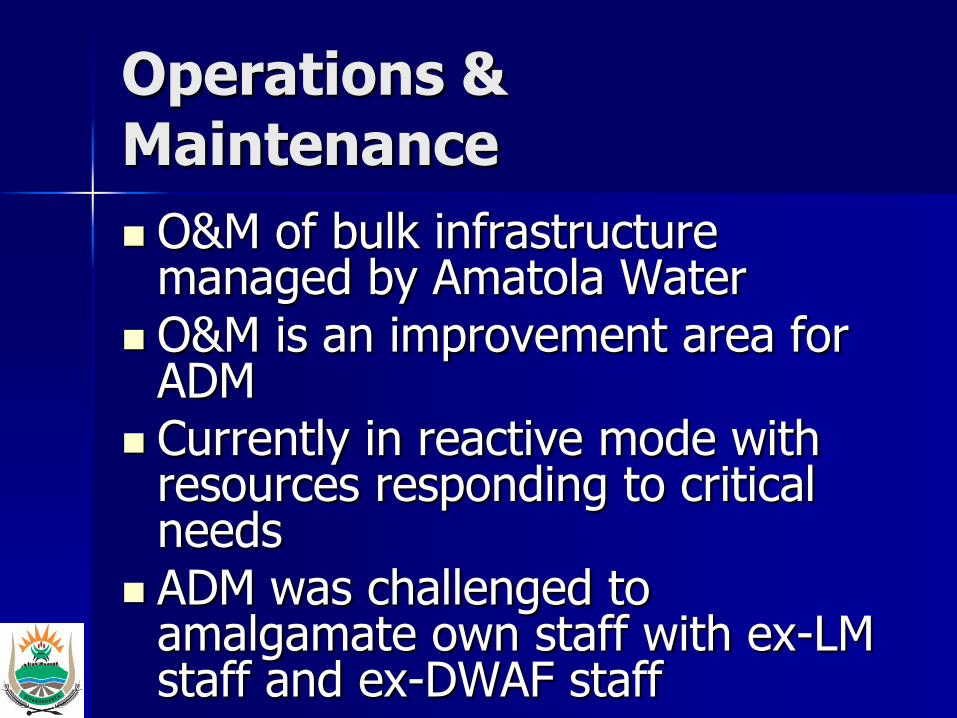
Operations & Maintenance
O&M of bulk infrastructure managed by Amatola Water
O&M is an improvement area for ADM
Currently in reactive mode with resources responding to critical needs
ADM was challenged to amalgamate own staff with ex-LM staff and ex-DWAF staff
Operations & Maintenance
People–Require more O&M resources to
deal with planning and management
–Require focused training for field operators
Inherited dilapidated bulk services with no funding reserves to refurbish and/or upgrade
Operations & Maintenance
Software– Have sophisticated software that can deal
with maintenance, but have to implement more modules to fully utilize features
Data– Are in process of improving data with asset
register, GIS capturing, plan organisation– Need better condition assessment and data
management Processes
– Processes to deal with data, planned maintenance, inspections, customer problems, communication with finance are needed
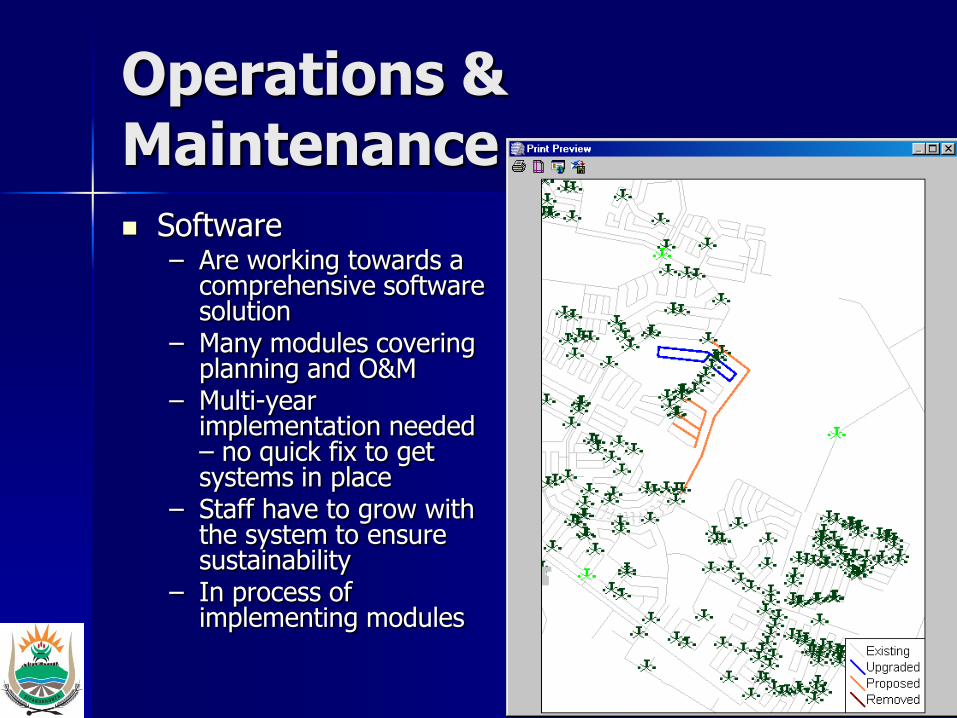
Operations & Maintenance
Software– Are working towards a
comprehensive software solution
– Many modules covering planning and O&M
– Multi-year implementation needed – no quick fix to get systems in place
– Staff have to grow with the system to ensure sustainability
– In process of implementing modules
Infrastructure Asset Management
New technical discipline for ADM
Have started with a situational assessment of current practices and improvement plan
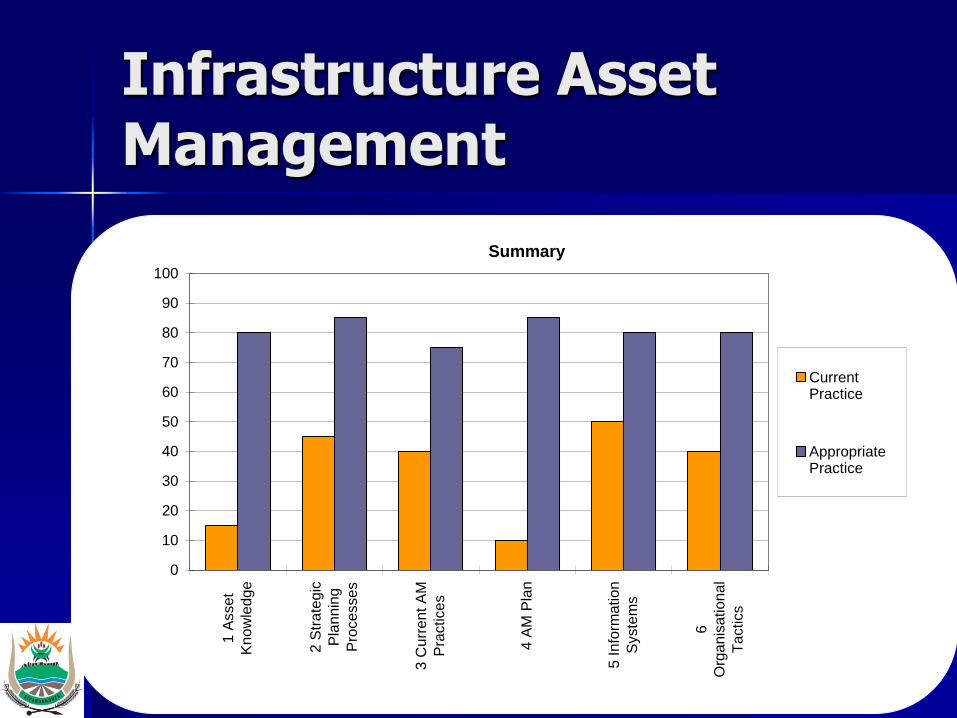
Infrastructure Asset Management
Summary
0
10
20
30
40
50
60
70
80
90
100
1 A
sse
t
Kn
ow
led
ge
2 S
tra
teg
ic
Pla
nnin
g
Pro
ce
sse
s
3 C
urr
en
t A
M
Pra
ctice
s
4 A
M P
lan
5 I
nfo
rma
tion
Syste
ms
6
Org
an
isa
tio
na
l
Ta
ctics
Current Practice
Appropriate Practice
Infrastructure Asset Management
Key improvements
– Human resources
– Asset Management Co-ordination
– Data Management Processes
– Software Implementation
– Asset condition and performance information
– AMP’s / Future Expenditure Models
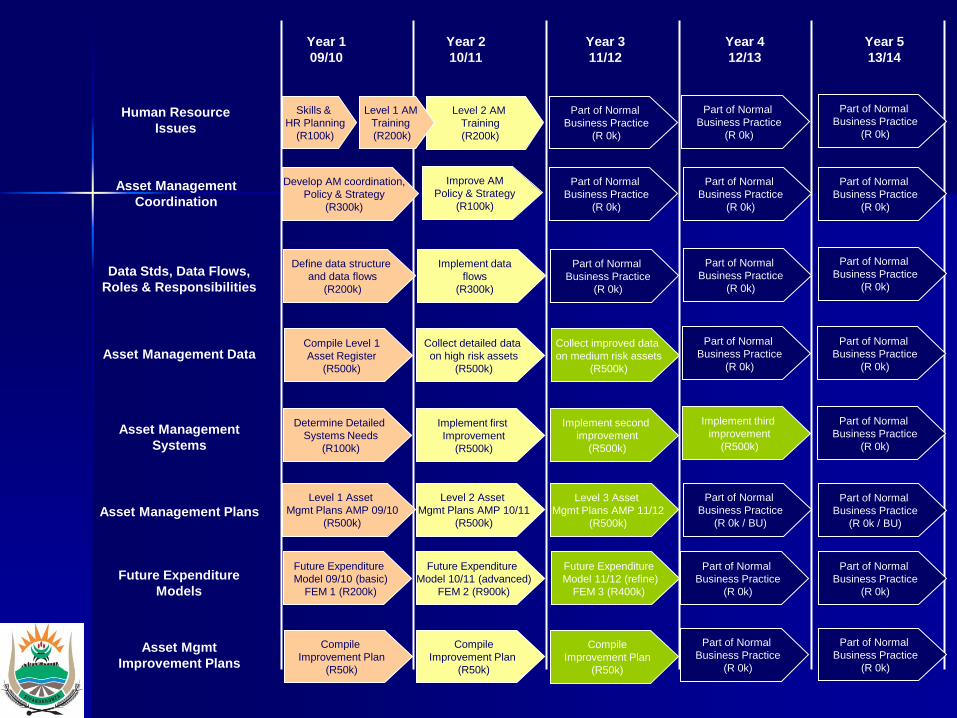
Year 1
09/10
Year 2
10/11
Year 3
11/12
Year 4
12/13
Year 5
13/14
Human Resource
Issues
Asset Management
Coordination
Data Stds, Data Flows,
Roles & Responsibilities
Asset Management Data
Asset Management Plans
Asset Mgmt
Improvement Plans
Skills &
HR Planning
(R100k)
Define data structure
and data flows
(R200k)
Compile Level 1
Asset Register
(R500k)
Implement first
Improvement
(R500k)
Implement second
improvement
(R500k)
Level 1 Asset
Mgmt Plans AMP 09/10
(R500k)
Level 2 Asset
Mgmt Plans AMP 10/11
(R500k)
Collect detailed data
on high risk assets
(R500k)
Collect improved data
on medium risk assets
(R500k)
Asset Management
Systems
Level 3 Asset
Mgmt Plans AMP 11/12
(R500k)
Implement data
flows
(R300k)
Compile
Improvement Plan
(R50k)
Compile
Improvement Plan
(R50k)
Compile
Improvement Plan
(R50k)
Determine Detailed
Systems Needs
(R100k)
Future Expenditure
Model 09/10 (basic)
FEM 1 (R200k)
Develop AM coordination,
Policy & Strategy
(R300k)
Improve AM
Policy & Strategy
(R100k)
Level 2 AM
Training
(R200k)
Future Expenditure
Models
Future Expenditure
Model 10/11 (advanced)
FEM 2 (R900k)
Future Expenditure
Model 11/12 (refine)
FEM 3 (R400k)
Implement third
improvement
(R500k)
Part of Normal
Business Practice
(R 0k)
Part of Normal
Business Practice
(R 0k)
Part of Normal
Business Practice
(R 0k / BU)
Part of Normal
Business Practice
(R 0k)
Part of Normal
Business Practice
(R 0k)
Part of Normal
Business Practice
(R 0k)
Part of Normal
Business Practice
(R 0k)
Part of Normal
Business Practice
(R 0k)
Level 1 AM
Training
(R200k)
Part of Normal
Business Practice
(R 0k)
Part of Normal
Business Practice
(R 0k)
Part of Normal
Business Practice
(R 0k)
Part of Normal
Business Practice
(R 0k)
Part of Normal
Business Practice
(R 0k)
Part of Normal
Business Practice
(R 0k)
Part of Normal
Business Practice
(R 0k / BU)
Part of Normal
Business Practice
(R 0k)
Part of Normal
Business Practice
(R 0k)
Part of Normal
Business Practice
(R 0k)
Infrastructure Asset Management
Summary– Do not have a consistent
understanding of the inputs and outcomes
– Wrt asset mgmt planning - WSDP is very comprehensive, but needs to align with Asset Management thinking
– Currently do not have a good understanding of the condition of all assets and the replacement needs
Infrastructure Asset Management
Summary ….cont– First step is for awareness to be
raised in the organisation– Next steps are for implementation of
asset management practices, but rate of adoption of new practices must be balanced with internal human capacity at all levels of org.
– Data, software, new processes, etc. will have little long term effect if the resources are not in place to manage
Conclusion
ADM are aware of the relevance of infrastructure asset management
Some activities are consistent with asset management implementation
Need to focus implementation in a structured manner
MUNICIPAL WASTEWATER TREATMENT
- A REGIONAL AND NATIONAL PERSPECTIVE -
Raising performance through a regulatory risk-based
approach
Thoko SigwazaLeonardo Manus
Marlene vd Merwe-Botha
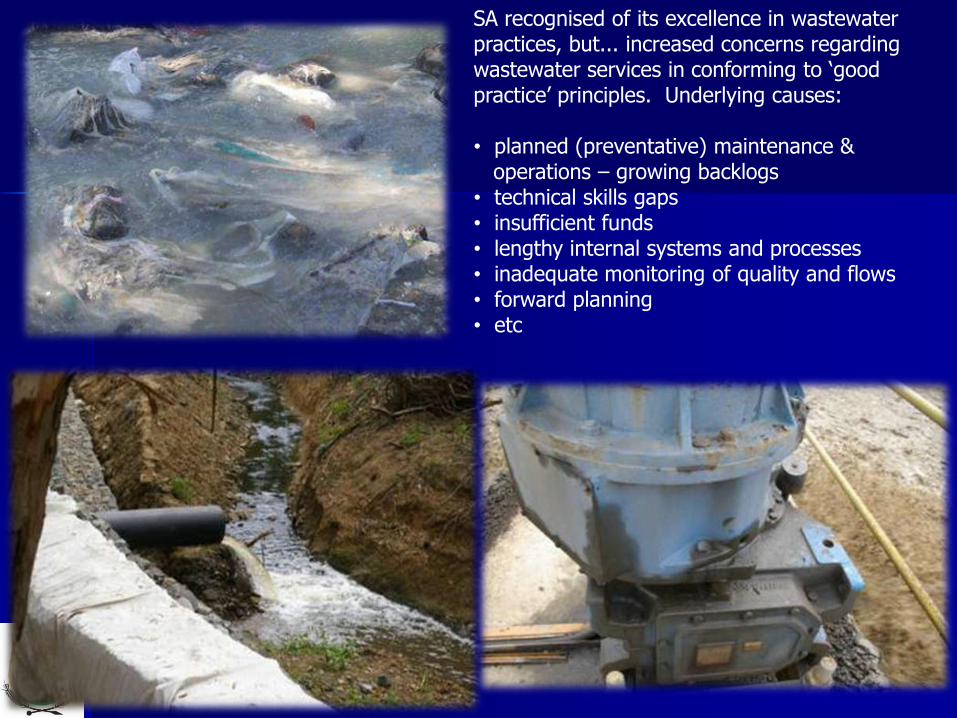
SA recognised of its excellence in wastewater practices, but... increased concerns regarding wastewater services in conforming to ‘good practice’ principles. Underlying causes:
• planned (preventative) maintenance & operations – growing backlogs
• technical skills gaps • insufficient funds• lengthy internal systems and processes• inadequate monitoring of quality and flows• forward planning • etc
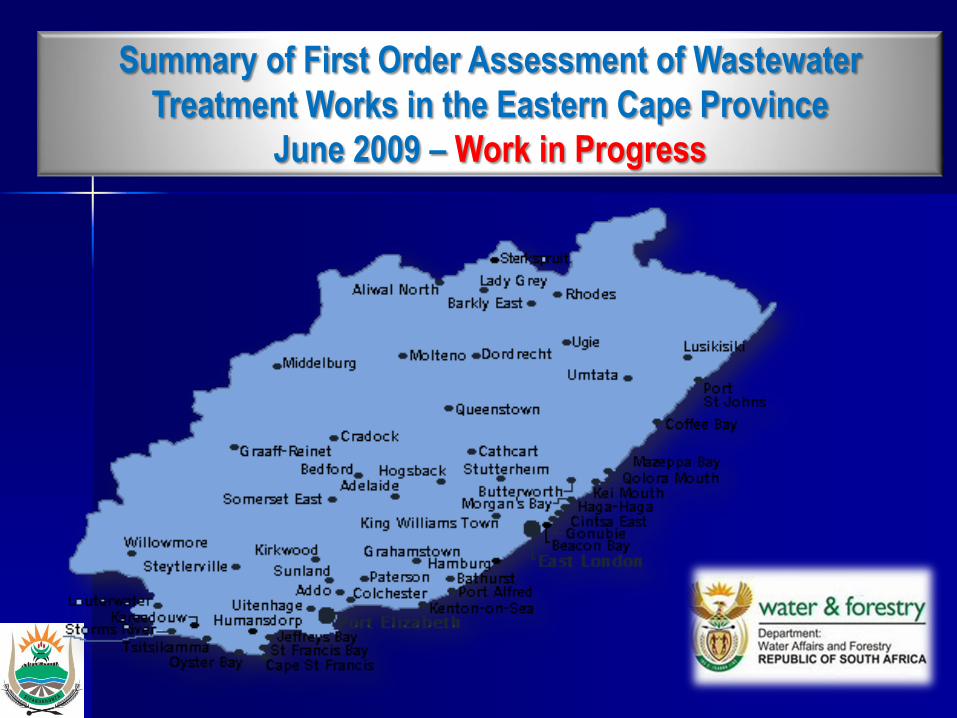
Summary of First Order Assessment of Wastewater
Treatment Works in the Eastern Cape Province
June 2009 – Work in Progress
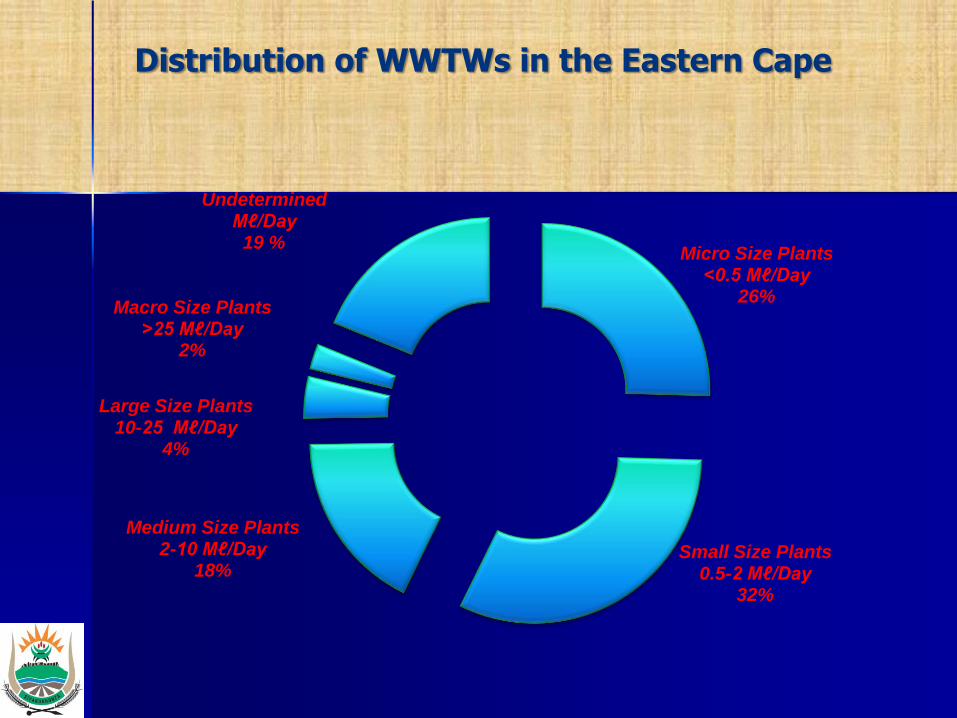
Micro Size Plants <0.5 Mℓ/Day
26%
Small Size Plants 0.5-2 Mℓ/Day
32%
Medium Size Plants 2-10 Mℓ/Day
18%
Large Size Plants 10-25 Mℓ/Day
4%
Macro Size Plants >25 Mℓ/Day
2%
Undetermined Mℓ/Day
19 %
Distribution of WWTWs in the Eastern Cape
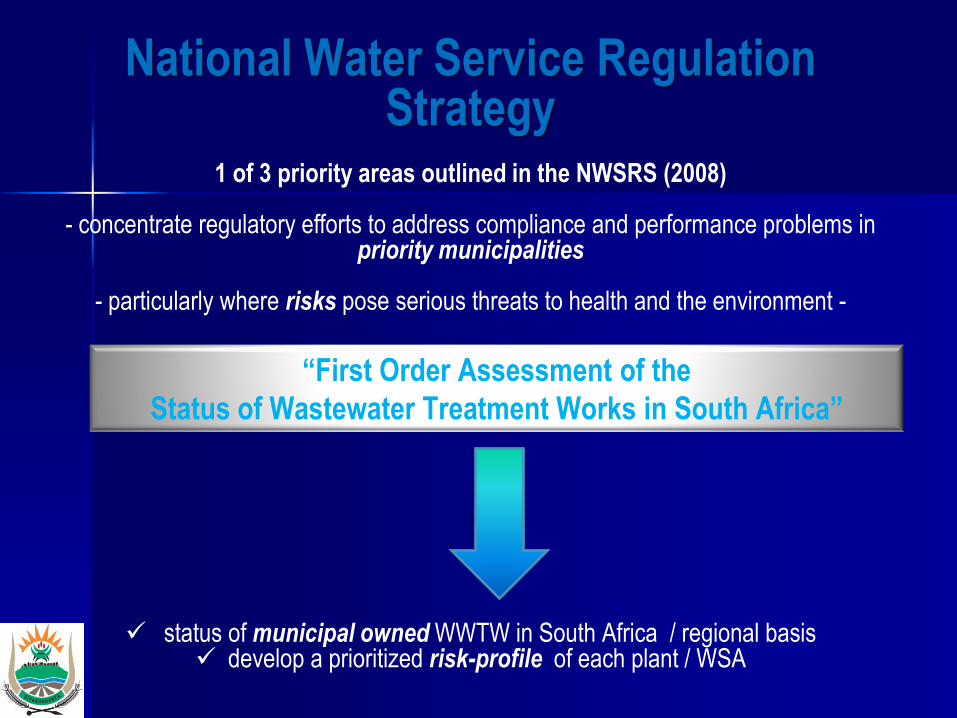
National Water Service Regulation Strategy
1 of 3 priority areas outlined in the NWSRS (2008)
- concentrate regulatory efforts to address compliance and performance problems in priority municipalities
- particularly where risks pose serious threats to health and the environment -
status of municipal owned WWTW in South Africa / regional basis develop a prioritized risk-profile of each plant / WSA
“First Order Assessment of the
Status of Wastewater Treatment Works in South Africa”

Questions?
Top Related