


Languages
Pages
Legal

International Journal of Developing and Emerging Economies
Vol.5, No.1, pp.26-39, April 2017
Published by European Centre for Research Training and Development UK (www.eajournals.org)
26 ISSN 2055-608X(Print), ISSN 2055-6098(Online)
INFLATION, UNEMPLOYMENT AND ECONOMIC GROWTH: EVIDENCE FROM
THE VAR MODEL APPROACH FOR THE ECONOMY OF IRAQ.
Lucy Anning
School of Business Administration, Zhongnan University of Economics and Law, Wuhan, China
Ali Salman Tuama
School of Economics, Huazhong University of Science and Technology, Wuhan, China
Samuel Darko
School of Business Administration, University College of Management Studies, Accra, Ghana
ABSTRACT: This study investigates the impact of inflation and unemployment on the economic
growth of Iraq. Considering the fact that the majority of the studies on the Phillips Curve have
been done in the context of developed economies and on an aggregate level, this study focuses on
Iraq, a single developing economy (a disaggregated level) and aims to empirically analyse the
impact of Unemployment and inflation on economic growth in the economy of Iraq. The research
results indicate that there exist an equilibrium impact between unemployment and inflation in Iraq
thereby supporting the validity of the Phillips Curve hypothesis.
KEYWORDS: Unemployment, Inflation, Economic Growth, Philips Curve, VAR Approach,
Iraq.
INTRODUCTION
The economy of Iraq saw a radical decline in growth and development in 1980’s following the
substantial development in the 1970’s (Almsafir, 1993). Since then there’s been a number of wars
and invasions of several kinds which have contributed to infrastructural disorder, abnormal
inflation and poor economic growth amidst high unemployment and poverty.
The nexus of inflation and unemployment has over the last decade attracted hot debate among
politicians, economist and the ordinary citizen. The adverse effects of unemployment and inflation
on economic growth alike has attracted the attention of government and researchers the world over.
One major challenge of policy makers are how to maintain low and stable unemployment level as
well as relatively stable prices so as to achieve high economic growth. Several studies have been
conducted on the impact of unemployment and inflation on economic growth.
In various insightful studies on the phenomenon, modern econometric models are adopted in
examining the nexus with their findings exhibiting interesting and debatable results principally in
the area of impact of unemployment and inflation on the overall economic growth.

International Journal of Developing and Emerging Economies
Vol.5, No.1, pp.26-39, April 2017
Published by European Centre for Research Training and Development UK (www.eajournals.org)
27 ISSN 2055-608X(Print), ISSN 2055-6098(Online)
LITERATURE REVIEW
The concepts of Unemployment and inflation are two intricately linked economic concepts. Over
the years there have been a number of economists trying to interpret the relationship between
growth, inflation and unemployment. This relationship can be elaborated in two ways being the
long run and the short run. In the short term there is an inverse correlation between the three. As
per this relation, when unemployment is low and inflation on the high side, economic growth is
expected to be high. The relationship between unemployment and inflation was first of all studied
by Phillips (1958). He found an inverse relationship between unemployment and inflation in UK.
In the short term the Phillips curve could be a declining curve. The Phillips curve in the long term
is separate from the Phillips curve in the short term. It has been observed in the literature that in
the longrun unemployment and inflation are not related.
According to (McConnel and Brue, 1996), Okun’s (1962) law suggests that in the US, the ratio
between and a shift in output is the law through which GDP shift from the trend is enlarged by
approximately 3percent if unemployment rate grows by 1percent above its natural rate level. This
ratio is better known as Okun’s law. In his earlier researches he concluded that this ratio was
approximately 3 to 1, but after some later analyses the ratio of 2 or 2.5 to 1 was accepted as the
representative one. Okun’s law is a reduced version of the Phillips regularity, more precisely, of
the segment pertaining to the research of the relation between unemployment and output. Okun’s
law has been used for specific projections of economic growth. When there are no vacancies for
those willing to work, potential output is irrevocably lost. Unrealized output is measured by shift
from the long-term tendency of GDP growth and it is called ‘GDP gap’. When GDP follows trend
line, economy trends can be projected and then there is natural unemployment rate. A higher the
unemployment rate propels greater shifts of GDP from its trend Popovic and Popovic, (2009). The
Okun’s law and the Phillips postulate are the basis for the analysis of the effect of unemployment
and inflation on growth as used in this thesis.
Yelwa, M. et al. (2015) investigated the relationship between unemployment, inflation and
economic growth in Nigeria. Utilizing secondary data with OLS regression method, their results
confirmed that interest rate and total public expenditure bares significant impact on economic
growth in the long run whereas on the contrary, inflation and unemployment has inverse effects
on growth in the Nigerian economy. They clarify further that this increase is likely due to
interruptions in the supply chain of goods both from the domestic and foreign supply outlets other
than the suspected aggregate demand pressure. The study concludes with a confirmative note on
the existence of a causal linkage between inflation, unemployment and economic growth in the
Nigerian economy recommending among others the need for government to improve the
macroeconomic policy instruments to the attainment of sustainable and enabling environment in
order to propel domestic output.
Furthermore, in Shahid, M. (2014) study on the impact of inflation and unemployment on the
economic growth of Pakistan via the ARDL model approach found that a long run relationship
between the variables existed.
International Journal of Developing and Emerging Economies
Vol.5, No.1, pp.26-39, April 2017
Published by European Centre for Research Training and Development UK (www.eajournals.org)
28 ISSN 2055-608X(Print), ISSN 2055-6098(Online)
In line with the above, Mohseni, M. et al (2016) takes into account a re-examination of the role of
inflation and unemployment on economic growth using the ARDL regression model. The results
showed a long run negative effect of inflation and unemployment on economic growth. In the
study of Bakere (2012), the OLS method of regression was adopted in examining the stabilization
policy, unemployment crises and economic growth in the Nigerian economy. Their findings
showed negative relationship inflation, unemployment and economic growth in Nigeria were
negative.
Using OLS, ADF and Granger causality, Aminu and Anono (2012) also studied the effect of
inflation on economic growth and development in Nigeria. Even though the results indicated that
the coefficient of inflation is statistically insignificant, it was consistence with the theoretical
expectation, causation runs from GDP to inflation implying that inflation does not Granger causes
GDP but GDP does. In all their study showed that there is a positive relation between inflation and
economic growth in the Nigerian economy.
Following the variant of Aminu and Anono (2012), Rafindadi (2012) further investigates the nexus
using OLS and Threshold model. He found a negative nonlinear relationship between output and
unemployment. The current attempt contributes to the existing literature on the effects of inflation
and unemployment on economic growth in Iraq. It will however attempt to answer key questions
such as; is there a relationship between inflation and unemployment on economic growth in Iraq?
And also is there a trade-off between inflation and unemployment by the Philip based curve
analysis in the economy of Iraq? Furthermore the findings of this study are relevant to highlighting
new strategies to improve the inflation and unemployment situation in Iraq.
METHODOLOGY
This study adopts multiple regression analysis where the rate of growth (ECGR) serves as the
dependent variable, while unemployment rates (UN), inflation rates (INF), serve as the explanatory
variables in the formulation of the models which captures the relationship among the variables of
interest. This is followed with analysis of data and interpretation of major findings for policy
implications. The study employs Vector Autoregressive (VAR) Model Approach using annual
time series data spanning from 1990-2014 obtained for the following variables: inflation rate,
money supply, Gross Domestic Product (GDP), Unemployment, a percentage of total labour force
and interest rate with data obtained from Central Bank of Iraq (CBI) Statistical Bulletin of Iraq,
2015 and World Data Bank (World Economic Indicators).
Model Specification
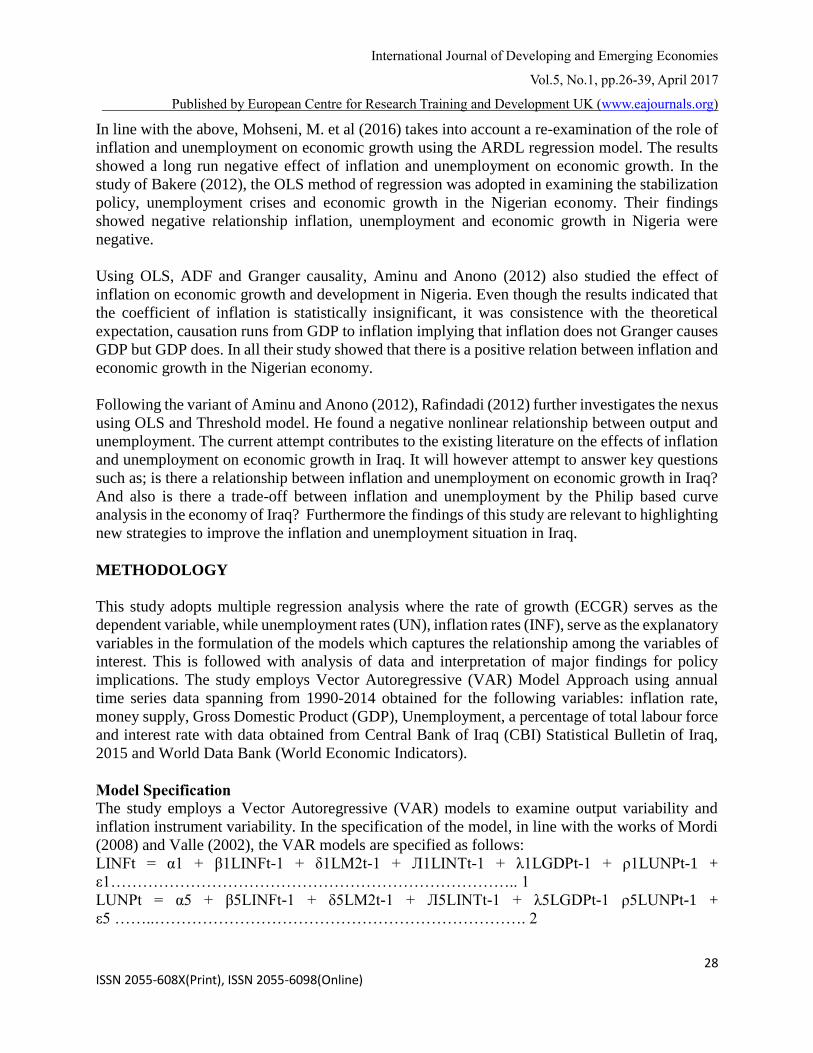
The study employs a Vector Autoregressive (VAR) models to examine output variability and
inflation instrument variability. In the specification of the model, in line with the works of Mordi
(2008) and Valle (2002), the VAR models are specified as follows:
LINFt = α1 + β1LINFt-1 + δ1LM2t-1 + Л1LINTt-1 + λ1LGDPt-1 + ρ1LUNPt-1 +
ε1………………………………………………………………….. 1
LUNPt = α5 + β5LINFt-1 + δ5LM2t-1 + Л5LINTt-1 + λ5LGDPt-1 ρ5LUNPt-1 +
ε5 ……..……………………………………………………………. 2

International Journal of Developing and Emerging Economies
Vol.5, No.1, pp.26-39, April 2017
Published by European Centre for Research Training and Development UK (www.eajournals.org)
29 ISSN 2055-608X(Print), ISSN 2055-6098(Online)
LGDPt = α4 + β4LINFt-1 + δ4LM2t-1 + Л4LINTt-1 + λ4LGDPt-1 + ρ4LUNPt-1 +
ε4………….…………………………………………………………3
LM2t = α2 + β2LINFt-1 + δ2LM2t-1 + Л2LINTt-1 + λ2LGDPt-1 + ρ2LUNPt-1 +
ε2…………………………………………………………………….4
LINTt = α3 + β3LNFt-1 + δ3LM2t-1 + Л3LINTt-1 + λ3LGDPt-1 + ρ3LUNPt-1 +
ε3………….…………………………………………………………5
Where LINF is the log of inflation rate, LM2 is the log of broad money supply, LINT is the log of
interest rate, LGDP is the log of gross domestic product, and LUNP is the log of unemployment.
Data Analysis and Interpretation of Results and Findings
Ordering of Variables The selection of the variables is done in order to build multivariate models which can be used to
target inflation and as a forecasting instruments. Obviously, one of the basic issues to address when
using VAR is the ordering of the variables. In ordering our variables, we assumed that monetary
policy variables M2 and INT would transmit into price and GDP through inflation rate while
unemployment is the most exogenous variable in the model. For the selection of lag length, a lag
length of one is selected based on Schwarz information criteria because it takes into consideration
the parsimoniousness of the model and has stringer theoretical backing (Serrato, 2006).
Roots of characteristic Polynomial Test The result of this test in Table 1 when LINF, LUNP, LGDP, LINT and LM2 are endogenous
variables while the constant is the exogenous variable shows that no root lies outside the unit circle.
The VAR satisfies the stability condition. The result is shown in table 1.
Table 1:
Table 1: Roots of Characteristic Polynomial
Endogenous variables: INF UNP GDP M2 INT
Exogenous variables: C
Lag specification: 1 1
Root Modulus
0.760903 - 0.235783i 0.796597
0.760903 + 0.235783i 0.796597
0.528405 0.528405
0.018775 - 0.298203i 0.298794
0.018775 + 0.298203i 0.298794
No root lies outside the unit circle.
VAR satisfies the stability condition.
Block Exogeneity Test
Block exogeneity tests are to determine how these variables enter the model. It has as its null
hypothesis that the lags of a set of variables do not enter the equation of the other variables, and,
thus, it is exogenous to the model.
The block exogeneity test result in table 1 indicates that none of the variables at lag one should
International Journal of Developing and Emerging Economies
Vol.5, No.1, pp.26-39, April 2017
Published by European Centre for Research Training and Development UK (www.eajournals.org)
30 ISSN 2055-608X(Print), ISSN 2055-6098(Online)
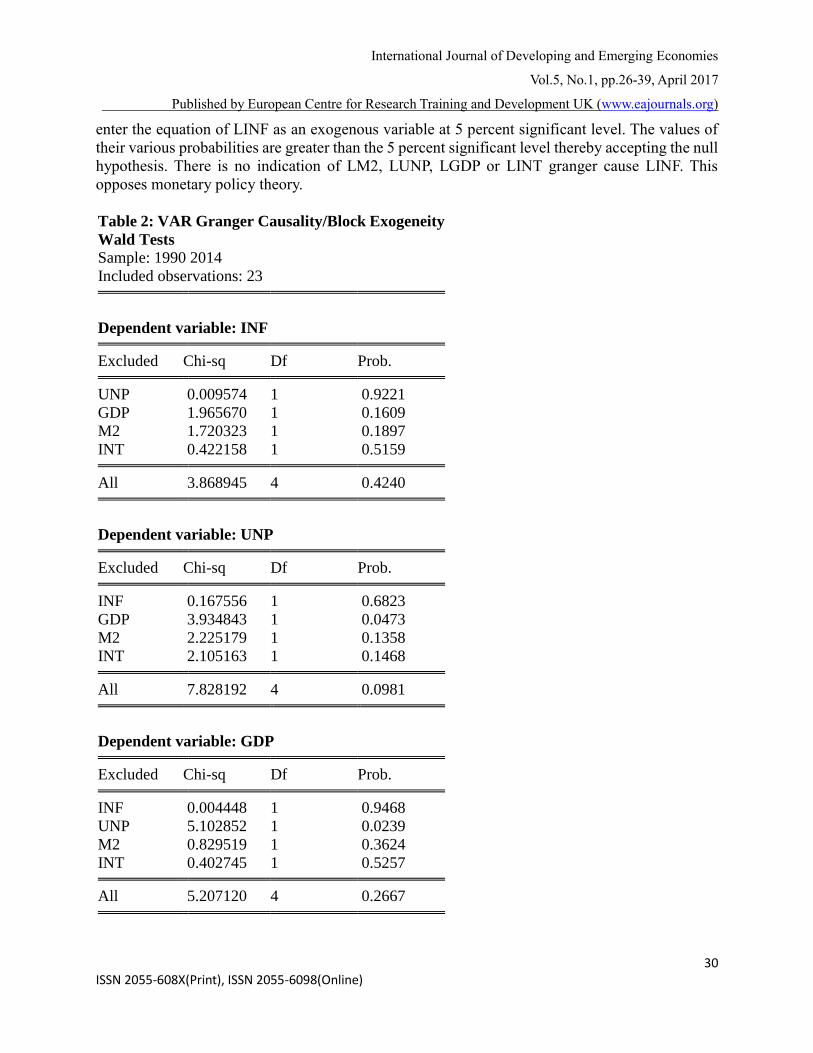
enter the equation of LINF as an exogenous variable at 5 percent significant level. The values of
their various probabilities are greater than the 5 percent significant level thereby accepting the null
hypothesis. There is no indication of LM2, LUNP, LGDP or LINT granger cause LINF. This
opposes monetary policy theory.
Table 2: VAR Granger Causality/Block Exogeneity
Wald Tests
Sample: 1990 2014
Included observations: 23
Dependent variable: INF
Excluded Chi-sq Df Prob.
UNP 0.009574 1 0.9221
GDP 1.965670 1 0.1609
M2 1.720323 1 0.1897
INT 0.422158 1 0.5159
All 3.868945 4 0.4240
Dependent variable: UNP
Excluded Chi-sq Df Prob.
INF 0.167556 1 0.6823
GDP 3.934843 1 0.0473
M2 2.225179 1 0.1358
INT 2.105163 1 0.1468
All 7.828192 4 0.0981
Dependent variable: GDP
Excluded Chi-sq Df Prob.
INF 0.004448 1 0.9468
UNP 5.102852 1 0.0239
M2 0.829519 1 0.3624
INT 0.402745 1 0.5257
All 5.207120 4 0.2667
International Journal of Developing and Emerging Economies
Vol.5, No.1, pp.26-39, April 2017
Published by European Centre for Research Training and Development UK (www.eajournals.org)
31 ISSN 2055-608X(Print), ISSN 2055-6098(Online)
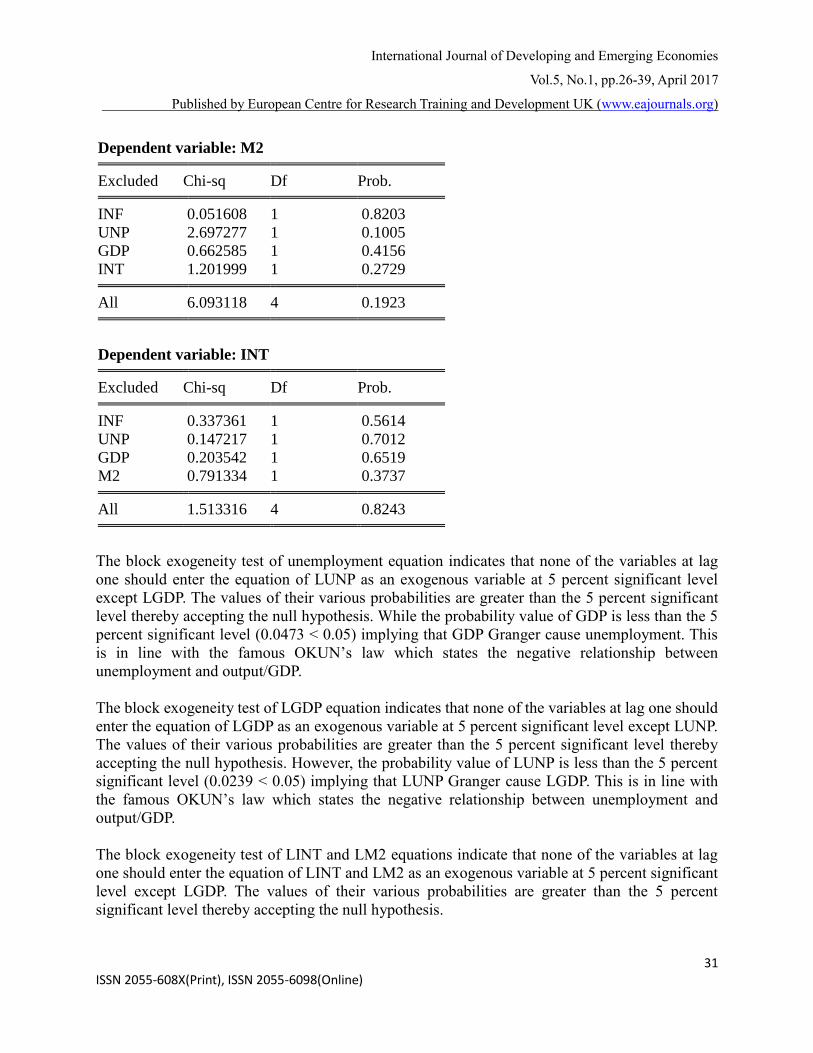
Dependent variable: M2
Excluded Chi-sq Df Prob.
INF 0.051608 1 0.8203
UNP 2.697277 1 0.1005
GDP 0.662585 1 0.4156
INT 1.201999 1 0.2729
All 6.093118 4 0.1923
Dependent variable: INT
Excluded Chi-sq Df Prob.
INF 0.337361 1 0.5614
UNP 0.147217 1 0.7012
GDP 0.203542 1 0.6519
M2 0.791334 1 0.3737
All 1.513316 4 0.8243
The block exogeneity test of unemployment equation indicates that none of the variables at lag
one should enter the equation of LUNP as an exogenous variable at 5 percent significant level
except LGDP. The values of their various probabilities are greater than the 5 percent significant
level thereby accepting the null hypothesis. While the probability value of GDP is less than the 5
percent significant level (0.0473 < 0.05) implying that GDP Granger cause unemployment. This
is in line with the famous OKUN’s law which states the negative relationship between
unemployment and output/GDP.
The block exogeneity test of LGDP equation indicates that none of the variables at lag one should
enter the equation of LGDP as an exogenous variable at 5 percent significant level except LUNP.
The values of their various probabilities are greater than the 5 percent significant level thereby
accepting the null hypothesis. However, the probability value of LUNP is less than the 5 percent
significant level (0.0239 < 0.05) implying that LUNP Granger cause LGDP. This is in line with
the famous OKUN’s law which states the negative relationship between unemployment and
output/GDP.
The block exogeneity test of LINT and LM2 equations indicate that none of the variables at lag
one should enter the equation of LINT and LM2 as an exogenous variable at 5 percent significant
level except LGDP. The values of their various probabilities are greater than the 5 percent
significant level thereby accepting the null hypothesis.
International Journal of Developing and Emerging Economies
Vol.5, No.1, pp.26-39, April 2017
Published by European Centre for Research Training and Development UK (www.eajournals.org)
32 ISSN 2055-608X(Print), ISSN 2055-6098(Online)
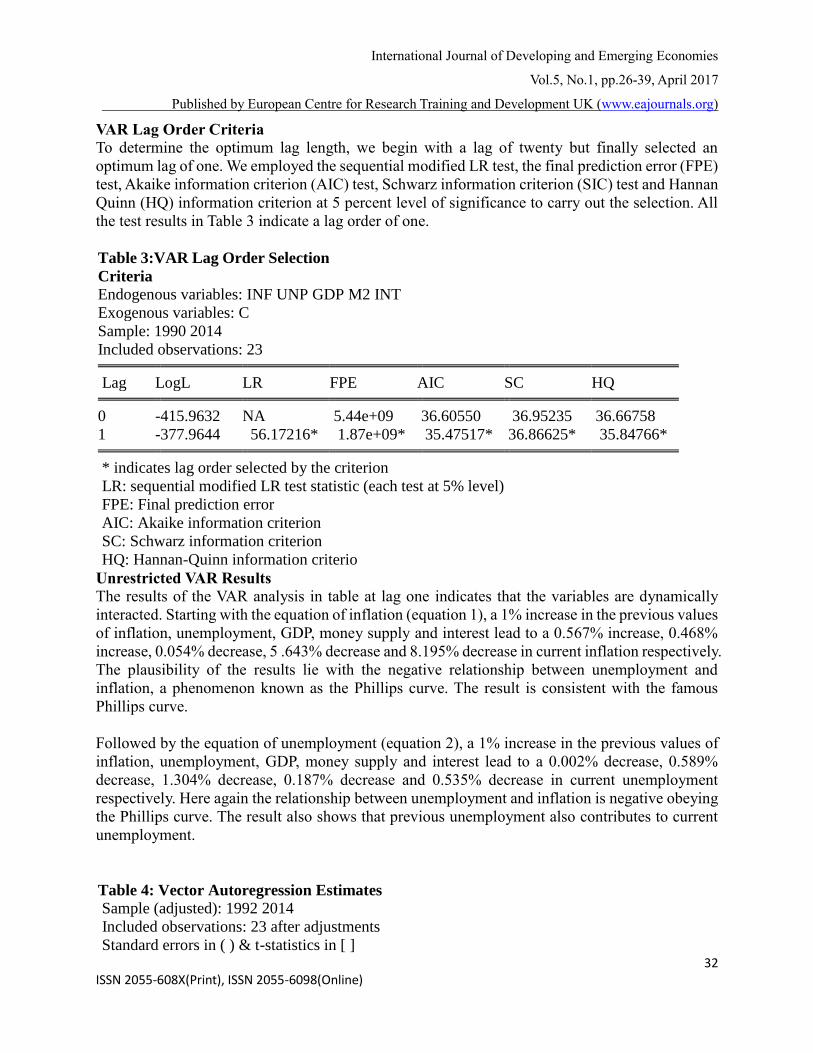
VAR Lag Order Criteria
To determine the optimum lag length, we begin with a lag of twenty but finally selected an
optimum lag of one. We employed the sequential modified LR test, the final prediction error (FPE)
test, Akaike information criterion (AIC) test, Schwarz information criterion (SIC) test and Hannan
Quinn (HQ) information criterion at 5 percent level of significance to carry out the selection. All
the test results in Table 3 indicate a lag order of one.
Table 3:VAR Lag Order Selection
Criteria
Endogenous variables: INF UNP GDP M2 INT
Exogenous variables: C
Sample: 1990 2014
Included observations: 23
Lag LogL LR FPE AIC SC HQ
0 -415.9632 NA 5.44e+09 36.60550 36.95235 36.66758
1 -377.9644 56.17216* 1.87e+09* 35.47517* 36.86625* 35.84766*
* indicates lag order selected by the criterion
LR: sequential modified LR test statistic (each test at 5% level)
FPE: Final prediction error
AIC: Akaike information criterion
SC: Schwarz information criterion
HQ: Hannan-Quinn information criterio
Unrestricted VAR Results
The results of the VAR analysis in table at lag one indicates that the variables are dynamically
interacted. Starting with the equation of inflation (equation 1), a 1% increase in the previous values
of inflation, unemployment, GDP, money supply and interest lead to a 0.567% increase, 0.468%
increase, 0.054% decrease, 5 .643% decrease and 8.195% decrease in current inflation respectively.
The plausibility of the results lie with the negative relationship between unemployment and
inflation, a phenomenon known as the Phillips curve. The result is consistent with the famous
Phillips curve.
Followed by the equation of unemployment (equation 2), a 1% increase in the previous values of
inflation, unemployment, GDP, money supply and interest lead to a 0.002% decrease, 0.589%
decrease, 1.304% decrease, 0.187% decrease and 0.535% decrease in current unemployment
respectively. Here again the relationship between unemployment and inflation is negative obeying
the Phillips curve. The result also shows that previous unemployment also contributes to current
unemployment.
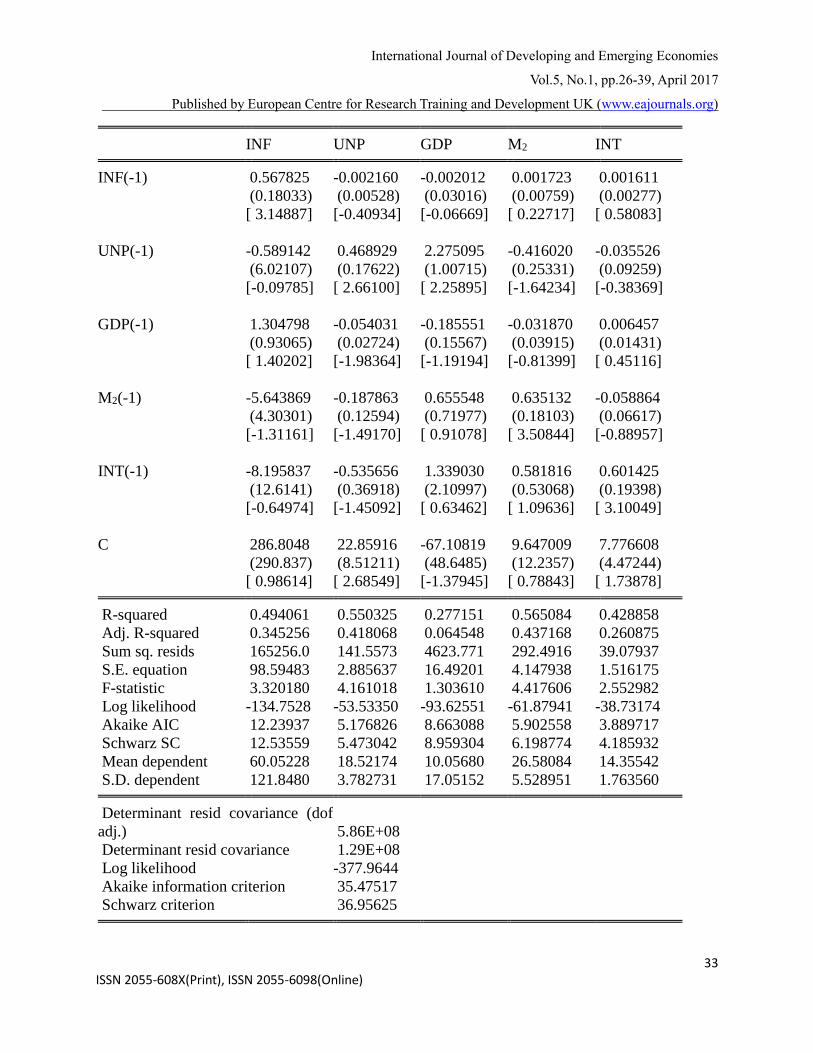
Table 4: Vector Autoregression Estimates
Sample (adjusted): 1992 2014
Included observations: 23 after adjustments
Standard errors in ( ) & t-statistics in [ ]
International Journal of Developing and Emerging Economies
Vol.5, No.1, pp.26-39, April 2017
Published by European Centre for Research Training and Development UK (www.eajournals.org)
33 ISSN 2055-608X(Print), ISSN 2055-6098(Online)
INF UNP GDP M2 INT
INF(-1) 0.567825 -0.002160 -0.002012 0.001723 0.001611
(0.18033) (0.00528) (0.03016) (0.00759) (0.00277)
[ 3.14887] [-0.40934] [-0.06669] [ 0.22717] [ 0.58083]
UNP(-1) -0.589142 0.468929 2.275095 -0.416020 -0.035526
(6.02107) (0.17622) (1.00715) (0.25331) (0.09259)
[-0.09785] [ 2.66100] [ 2.25895] [-1.64234] [-0.38369]
GDP(-1) 1.304798 -0.054031 -0.185551 -0.031870 0.006457
(0.93065) (0.02724) (0.15567) (0.03915) (0.01431)
[ 1.40202] [-1.98364] [-1.19194] [-0.81399] [ 0.45116]
M2(-1) -5.643869 -0.187863 0.655548 0.635132 -0.058864
(4.30301) (0.12594) (0.71977) (0.18103) (0.06617)
[-1.31161] [-1.49170] [ 0.91078] [ 3.50844] [-0.88957]
INT(-1) -8.195837 -0.535656 1.339030 0.581816 0.601425
(12.6141) (0.36918) (2.10997) (0.53068) (0.19398)
[-0.64974] [-1.45092] [ 0.63462] [ 1.09636] [ 3.10049]
C 286.8048 22.85916 -67.10819 9.647009 7.776608
(290.837) (8.51211) (48.6485) (12.2357) (4.47244)
[ 0.98614] [ 2.68549] [-1.37945] [ 0.78843] [ 1.73878]
R-squared 0.494061 0.550325 0.277151 0.565084 0.428858
Adj. R-squared 0.345256 0.418068 0.064548 0.437168 0.260875
Sum sq. resids 165256.0 141.5573 4623.771 292.4916 39.07937
S.E. equation 98.59483 2.885637 16.49201 4.147938 1.516175
F-statistic 3.320180 4.161018 1.303610 4.417606 2.552982
Log likelihood -134.7528 -53.53350 -93.62551 -61.87941 -38.73174
Akaike AIC 12.23937 5.176826 8.663088 5.902558 3.889717
Schwarz SC 12.53559 5.473042 8.959304 6.198774 4.185932
Mean dependent 60.05228 18.52174 10.05680 26.58084 14.35542
S.D. dependent 121.8480 3.782731 17.05152 5.528951 1.763560
Determinant resid covariance (dof
adj.) 5.86E+08
Determinant resid covariance 1.29E+08
Log likelihood -377.9644
Akaike information criterion 35.47517
Schwarz criterion 36.95625

International Journal of Developing and Emerging Economies
Vol.5, No.1, pp.26-39, April 2017
Published by European Centre for Research Training and Development UK (www.eajournals.org)
34 ISSN 2055-608X(Print), ISSN 2055-6098(Online)
On the equation of GDP (equation 3), a 1% increase in the previous values of inflation,
unemployment, GDP, money supply and interest lead to a 0.002% decrease, 2.275% increase,
0.185% decrease, 0.655% increase and 0.133% increase in current GDP respectively. Here, GDP
and money are positively related.
The equation of money supply (equation 4) shows that a 1% increase in the previous values of
inflation, unemployment, GDP, money supply and interest lead to a 0.001% increase, 0.416%
decrease, 0.031% decrease, 0.635% increase and 0.581% increase in current money supply
respectively. The result is consistent with monetary policy given that the relationship between
money supply and inflation. A situation known as demand pull inflation or too much money
pursuing too few goods and the result is inflation.
The equation of interest rate (equation 5) shows that a 1% increase in the previous values of
inflation, unemployment, GDP, money supply and interest lead to a 0.001% increase, 0.035%
decrease, 0.006% increase, 0.058% decrease and 0.601% increase in current interest rate
respectively.
The overall goodness of fit shows that 49.4% variation in inflation is caused by the variations in
the previous values of inflation inertia, unemployment, GDP, money supply and interest rate.
While 55.0% variation in unemployment is caused by the joint variation in the previous values of
inflation inertia, unemployment, GDP, money supply and interest rate. The equation of GDP
indicates that 27.7% variation in GDP is caused by the joint variation in the previous values of
inflation inertia, unemployment, GDP, money supply and interest rate. While 56.5% variation in
money supply is caused by the joint variation in the previous values of inflation inertia,
unemployment, GDP, money supply and interest rate. And 42.8% variation in interest rate is caused
by the joint variation in the previous values of inflation inertia, unemployment, GDP, money
supply and interest rate.
Variance Decomposition
This section has to do with assessing the relative contribution of the variables to the fluctuation in
in inflation, unemployment, GDP, money supply and interest rate. This is done by decomposing
the forecast variance of the inflation rate and unemployment over different horizons. The statistics
in Table 5 and 6 indicate the percentage contribution of innovations in each of the variables to the
variance decomposition of inflation and unemployment.
International Journal of Developing and Emerging Economies
Vol.5, No.1, pp.26-39, April 2017
Published by European Centre for Research Training and Development UK (www.eajournals.org)
35 ISSN 2055-608X(Print), ISSN 2055-6098(Online)
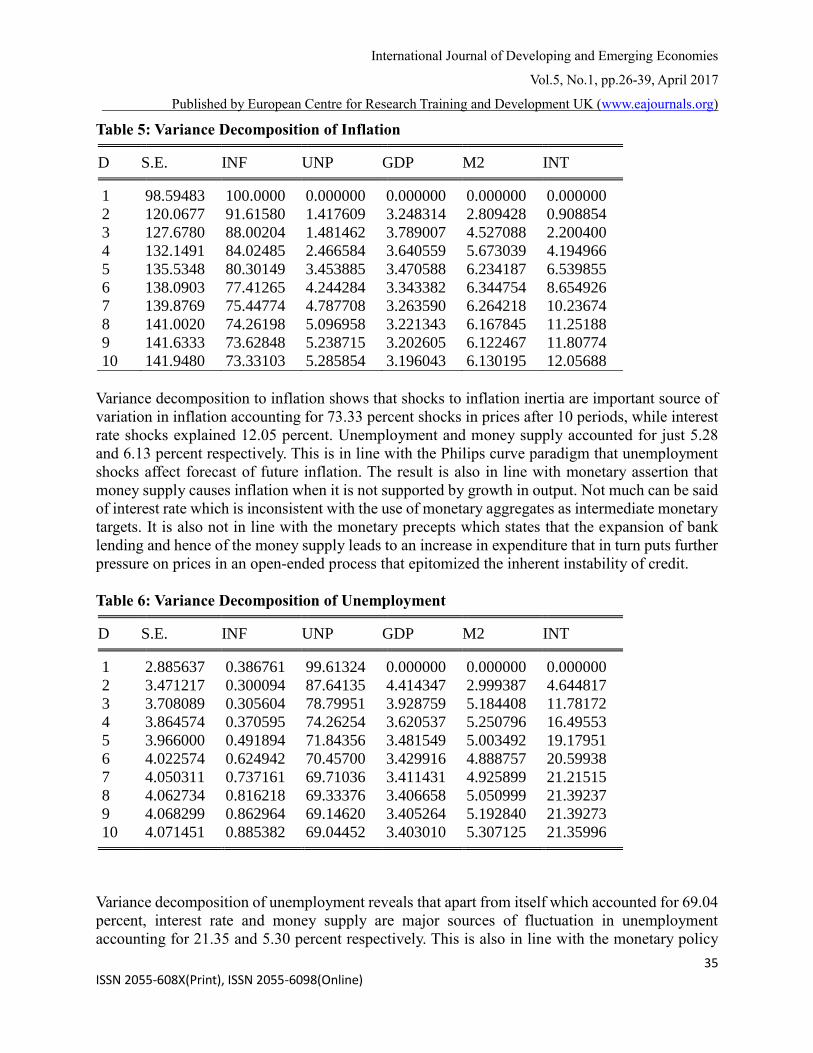
Table 5: Variance Decomposition of Inflation
D S.E. INF UNP GDP M2 INT
1 98.59483 100.0000 0.000000 0.000000 0.000000 0.000000
2 120.0677 91.61580 1.417609 3.248314 2.809428 0.908854
3 127.6780 88.00204 1.481462 3.789007 4.527088 2.200400
4 132.1491 84.02485 2.466584 3.640559 5.673039 4.194966
5 135.5348 80.30149 3.453885 3.470588 6.234187 6.539855
6 138.0903 77.41265 4.244284 3.343382 6.344754 8.654926
7 139.8769 75.44774 4.787708 3.263590 6.264218 10.23674
8 141.0020 74.26198 5.096958 3.221343 6.167845 11.25188
9 141.6333 73.62848 5.238715 3.202605 6.122467 11.80774
10 141.9480 73.33103 5.285854 3.196043 6.130195 12.05688
Variance decomposition to inflation shows that shocks to inflation inertia are important source of
variation in inflation accounting for 73.33 percent shocks in prices after 10 periods, while interest
rate shocks explained 12.05 percent. Unemployment and money supply accounted for just 5.28
and 6.13 percent respectively. This is in line with the Philips curve paradigm that unemployment
shocks affect forecast of future inflation. The result is also in line with monetary assertion that
money supply causes inflation when it is not supported by growth in output. Not much can be said
of interest rate which is inconsistent with the use of monetary aggregates as intermediate monetary
targets. It is also not in line with the monetary precepts which states that the expansion of bank
lending and hence of the money supply leads to an increase in expenditure that in turn puts further
pressure on prices in an open-ended process that epitomized the inherent instability of credit.
Table 6: Variance Decomposition of Unemployment
D S.E. INF UNP GDP M2 INT
1 2.885637 0.386761 99.61324 0.000000 0.000000 0.000000
2 3.471217 0.300094 87.64135 4.414347 2.999387 4.644817
3 3.708089 0.305604 78.79951 3.928759 5.184408 11.78172
4 3.864574 0.370595 74.26254 3.620537 5.250796 16.49553
5 3.966000 0.491894 71.84356 3.481549 5.003492 19.17951
6 4.022574 0.624942 70.45700 3.429916 4.888757 20.59938
7 4.050311 0.737161 69.71036 3.411431 4.925899 21.21515
8 4.062734 0.816218 69.33376 3.406658 5.050999 21.39237
9 4.068299 0.862964 69.14620 3.405264 5.192840 21.39273
10 4.071451 0.885382 69.04452 3.403010 5.307125 21.35996
Variance decomposition of unemployment reveals that apart from itself which accounted for 69.04
percent, interest rate and money supply are major sources of fluctuation in unemployment
accounting for 21.35 and 5.30 percent respectively. This is also in line with the monetary policy

International Journal of Developing and Emerging Economies
Vol.5, No.1, pp.26-39, April 2017
Published by European Centre for Research Training and Development UK (www.eajournals.org)
36 ISSN 2055-608X(Print), ISSN 2055-6098(Online)
paradigm and economic theory of interest rate, money supply and growth. Not much can be
attributed to inflation and GDP.
Table 6: Variance Decomposition of GDP
Perio
d S.E. INF UNP GDP M2
1 16.49201 0.984326 11.04377 87.97190 0.000000
2 18.88696 0.793244 27.01106 69.81321 1.402055
3 19.01571 0.811325 27.11897 69.53816 1.526774
4 19.04859 0.811352 27.03309 69.30533 1.675289
5 19.06422 0.812575 27.01905 69.19341 1.691145
6 19.07623 0.815453 27.02803 69.10798 1.690433
7 19.08322 0.818703 27.02647 69.05887 1.689214
8 19.08680 0.821501 27.02298 69.03369 1.689838
9 19.08848 0.823566 27.02023 69.02195 1.692344
10 19.08922 0.824865 27.01839 69.01680 1.695505
Variance decomposition of GDP reveals that apart from itself which accounted for 69.01 percent,
unemployment and money supply are major sources of fluctuation in GDP accounting for 27.01
and 1.69 percent respectively. This is also in line with the monetary policy paradigm and economic
theory of interest rate, money supply and growth. Not much can be attributed to inflation.
DISCUSSION
Several reasons account to why governments might want to achieve low inflation, perhaps the
most compelling being the potential for faster output growth. Indeed, among the factors that are
likely to affect growth, perhaps none is as readily changed in the short run as the inflation rate.
Few would doubt the negative growth effects of high inflation for about 40 percent per year but
there has been much less consensus on the effect of less severe inflation. Yet from a policy
perspective it is the moderate or intermediate inflation range perhaps 5 to 30 percent per year—
that is of greatest interest.
The results presented here suggest a negative relationship between Unemployment and Inflation
and its impact on growth in the economy of Iraq which is statistically and economically significant.
The relationship is non-linear, in two senses:
First, at very low inflation rates, the relationship is positive; second, at all other inflation rates, the
apparent marginal effect of inflation on growth becomes less important as higher inflation rates
are considered. Failure to take account of both these non-linearities can seriously bias results
toward finding only a slight marginal effect, giving the misleading impression that inflation must
become quite high before its cumulative effect becomes important.
The study additionally tried to find the impact of inflation and unemployment on economic growth
and also, test for evidence of Philips curve in Iraq using the New Keynesian Philips curve model,

International Journal of Developing and Emerging Economies
Vol.5, No.1, pp.26-39, April 2017
Published by European Centre for Research Training and Development UK (www.eajournals.org)
37 ISSN 2055-608X(Print), ISSN 2055-6098(Online)
analysis from the VAR approach. For the selection of lag length, a lag length of one is selected
based on Schwarz information criteria because it takes into consideration the parsimoniousness of
the model and has stringer theoretical backing (Serrate, 2006). Under the Roots of characteristic
Polynomial Test, results shows that no root lies outside the unit circle and hence the VAR satisfies
the stability condition.
In sum, the entire test results of the VAR analysis in table at lag one indicates that the variables are
dynamically interacted. Starting with the equation of inflation (equation 1), a 1% increase in the
previous values of inflation, unemployment, GDP, money supply and interest lead to a 0.567%
increase, 0.468% increase, 0.054% decrease, 5 .643% decrease and 8.195% decrease in current
inflation respectively. The plausibility of the results lies with the negative relationship between
unemployment and inflation, a phenomenon known as the Phillips curve. The result is consistent
with the famous Phillips curve.
Followed by the equation of unemployment (equation 2), a 1% increase in the previous values of
inflation, unemployment, GDP, money supply and interest lead to a 0.002% decrease, 0.589%
decrease, 1.304% decrease, 0.187% decrease and 0.535% decrease in current unemployment
respectively. Here again the relationship between unemployment and inflation is negative obeying
the Phillips curve. The result also shows that previous unemployment also contributes to current
unemployment.
Using the impulse response to measure unemployment, it is realized that as unemployment
increases, inflation decreases initially, increases and later decreases. This phenomenon depicts the
non-accelerated inflation rate of unemployment (NAIRU) postulated by Milton Friedman who said
“the Phillips curve is to the best of knowledge a short run phenomenon where as in the long run,
it does not exist”.
The result shows clearly that there is a sure impact of inflation and unemployment on economic
growth in the economy of Iraq.
CONCLUSION
With regards and emphasis on the above data analysis and summary, this manuscript concludes
that the nature of inflation in the country was cost-push attributed to the method of technology
adopted and the level of unemployment in the country. This will make it possible for inflation rates
if regressed along to behave abnormally to growth rates of output in Iraq. A historical analysis of
monetary policy in Iraq within this framework suggests that monetary conditions might have been
less accommodative and, hence, inflation in Iraq might have been lower and less volatile than what
was observed in recent past had Iraq followed prescriptions based on a rule consistent with price
stability. In conclusion therefore, fight against unemployment and inflation in Iraq is not going to
be easy or a short run affair, this was because what brought about high unemployment rates also
brought about reduction in the growth rates of output in the country and what brought about high
inflation rates also brought about improvement in the growth rates of output in Iraq. This study
concludes by saying that combating the challenges of the rising inflation and unemployment level
in Iraq is not a small task for policy makers and economic managers in Iraq. The consequences of
International Journal of Developing and Emerging Economies
Vol.5, No.1, pp.26-39, April 2017
Published by European Centre for Research Training and Development UK (www.eajournals.org)
38 ISSN 2055-608X(Print), ISSN 2055-6098(Online)
a growing inflation and unemployment phenomenon are so damning that Iraq cannot afford them.
Such implications are glaring in the economy of Iraq where many negative developments were
traceable to the non-availability of jobs for the teaming population of energetic youths with a
frequent rise in general price level coupled with frequent violence and wars. Therefore, the need
to aptly address this ugly development becomes paramount.
REFERENCES
Almsafir, M( 1993 P-3)” Inflation in an Iraqi economy for the time 1980-1992 impacts and
manipulations” unpublished master thesis, Baghdad University, Iraq.
Aminu, U. and Anono, A.Z. (2012).Effect of Inflation on the Growth and Development of the
Nigerian Economy (An Empirical Analysis).International Journal of Business and Social
Science. Vol.3 No.10 [Special Issue- May 2012].
Aminu, U. and Manu, D. and Salihu, M. (2013). An Empirical Investigation into the Effect of
Unemployment and Inflation on the Growth in Nigerian. Interdisplinary Journal of Research
in Business. Vol.2 Issue.12
Bakare, A.S. (2012) Stabilization policy, Unemployment Crises and Economic Growth in
Nigeria.Universal Journal of Management and Social Sciences.Vol.2, No.4.
Comparative Analysis of Phillips Regularity.UDK 336.748.12, 331.56
Dr. Hasan Latif Kathim al-Zubaydi - economic story of National Decline
Keynes, J. M. (1936). The General Theory of Employment, Interest, and Money, Harvest Brace
Jovanovich, New York and London (reprinted in 1964 edition).
Mankiw, N. Gregory (2001). "The inexorable and mysterious tradeoff between inflation and
unemployment." The Economic Journal, Vol.111, no. 471, pp.45-61.
McConnell, B. W. (1996). New wine in old wineskins: US government information in a networked
world. Journal of Government Information, 23(3), 217-225.
Mordi, C.N.O. (2008). Overview of Monetary Policy Framework in Nigeria. 13 Seminar for
Financial Correspondence, Abuja: CBN.
Mohseni, M., & Jouzaryan, F. (2016). Examining the Effects of Inflation and Unemployment on
Economic Growth in Iran (1996-2012). Procedia Economics and Finance, 36, 381-389.
Phillips, A. W. (1958). The Relationship between Unemployment and the Rate of Change of
Money Wage in the United Kingdom, 1861-1957, Economica, 25 (100): 283-299.
Popovic, G. and Popovic, J. (2009) Inflation and Unemployment in the EU:
Rafindadi, A.S. (2012) Macroeconomic Policy, Output and Unemployment Dynamics in Nigeria:
Is There Evidence of Jobless Growth? Paper presented at the 53th Annual conference of the
Nigerian economic society on „„Youth Employment and Poverty Reduction in Nigeria‟‟.
NICON Luxury Hotel, Abuja.
Serrate, J.C.S. (2006). Forecasting Mexico’s Inflation: The Effects of an Inflation Targeting
Regime. Trinity University, 1-23.
Shahid, M. (2014). Effects of inflation and unemployment on economic growth in Pakistan'.
Journal of economics and sustainable development, 5, 15.
Valle, H.A.S. (2002). Inflation Forecast with ARIMA and VAR Models in Guatemala, Economic
Research Department Working Paper, May, 2002, Banco DR Guatemala.

International Journal of Developing and Emerging Economies
Vol.5, No.1, pp.26-39, April 2017
Published by European Centre for Research Training and Development UK (www.eajournals.org)
39 ISSN 2055-608X(Print), ISSN 2055-6098(Online)
Yelwa, M., David, O. O., & Awe, E. O. (2015). Analysis of the Relationship between Inflation,
Unemployment and Economic Growth in Nigeria: 1987-2012. Applied Economics and
Finance, 2(3), 102-109.
Top Related