


Languages
Pages
Legal


INELASTIC PANEL ZONE DEFORMATION DEMANDS IN STEEL MOMENT
RESISTING FRAMES
A THESIS SUBMITTED TO THE GRADUATE SCHOOL OF NATURAL AND APPLIED SCIENCES
OF MIDDLE EAST TECHNICAL UNIVERSITY
BY
MEHMET TUNA
IN PARTIAL FULFILLMENT OF THE REQUIREMENTS FOR
THE DEGREE OF MASTER OF SCIENCE IN
CIVIL ENGINEERING
MAY 2012
Approval of the thesis:
INELASTIC PANEL ZONE DEFORMATION DEMANDS IN STEEL MOMENT RESISTING FRAMES
Submitted by MEHMET TUNA in partial fulfillment of the requirements for the degree of Master of Science in Civil Engineering Department, Middle East Technical University, by
Prof. Dr. Canan Özgen _____________________ Dean, Graduate School of Natural and Applied Sciences Prof. Dr. Güney Özcebe _____________________ Head of Department, Civil Engineering Prof. Dr. Cem Topkaya _____________________ Supervisor, Civil Engineering Dept., METU Examining Committee Members: Prof. Dr. Mehmet Utku _____________________ Civil Engineering Dept., METU Prof. Dr. Cem Topkaya _____________________ Civil Engineering Dept., METU Assoc. Prof. Dr. Afşin Sarıtaş _____________________ Civil Engineering Dept., METU Asst. Prof. Dr. Özgür Kurç _____________________ Civil Engineering Dept., METU Asst. Prof. Dr. Eray Baran _____________________ Civil Engineering Dept., Atılım Universiy
Date: 28.05.2012
iii
I hereby declare that all information in this document has been obtained and presented in accordance with academic rules and ethical conduct. I also declared that, as required by these rules and conduct, I have fully cited and referenced all material and results that are not original to this work.
Name, Last name: Mehmet Tuna
Signature:
iv
ABSTRACT
INELASTIC PANEL ZONE DEFORMATION DEMANDS IN STEEL MOMENT
RESISTING FRAMES
Tuna, Mehmet
M.Sc., Department of Civil Engineering
Supervisor : Prof. Dr. Cem Topkaya
May 2012 , 67 pages
Panel zone is one of the significant parts of beam-column connections in steel
structures. Until the 1994 Northridge Earthquake, a few experimental research and
parametric studies had been carried out to understand the behavior of the panel
zones. However, after the Northridge Earthquake, it was observed that beam-
column connections were unable to show presumed seismic performance.
Therefore, current design codes needed to be revised to improve seismic
performance of connections in general and panel zones in particular. In this
research, panel zone deformation demands are examined using explicit three
dimensional finite element models and considering different parameters. For this
purpose, a frame model with two different beam-column configurations was
developed in order to observe the effects of beam depth, the axial load level and the
level of seismicity. The frame models were analyzed under twenty different ground
motion records. Local strain demands at the panel zones as well as the global frame
deformation demands are evaluated. Analysis results revealed that AISC
Specification designs allowed panel zone yielding; however, panel zones designed
according to FEMA 355D showed minimal yielding for both shallow and deep beam
configurations. Based on the analysis results, local shear strain demands in panel
zones were expressed as a function of interstory drifts and normalized panel zone
thicknesses.
Keywords: Steel Frames, Panel Zone, Finite Element Analysis, Seismic Design,
Beam Depth
v
ÖZ
MOMENT AKTARAN ÇELİK ÇERÇEVELERDE İNELASTİK KAYMA BÖLGESİ
DEFORMASYON TALEBLERİ
Tuna, Mehmet
Yüksek Lisans, İnşaat Mühendisliği Bölümü
Tez Yöneticisi : Prof. Dr. Cem Topkaya
Mayıs 2012 , 67 sayfa
Çelik yapılarda kayma bölgesi kolon kiriş bağlantılarında önem teşkil eden
elemanlardan biridir. 1994 Northridge depremine kadar, kayma bölgesi davranışını
anlamak için birkaç deneysel ve parametrik çalışmalar yapılmıştır. Fakat, Northridge
depreminden sonra, kolon kiriş bağlantılarının öngörülen sismik performansı
gösteremedikleri gözlemlenmiştir. Bundan dolayı, mevcut yapı şartnamelerinin genel
olarak bağlantı elemanlarının ve özellikle kayma bölgelerinin sismik performansını
geliştirmek için revize edilmesine ihtiyaç duyulmuştur. Bu çalışmada, belirgin üç
boyutlu sonlu eleman modeli kullanarak ve farklı değişkenler altında kayma bölgeleri
deformasyon talepleri incelenmiştir. Bu doğrultuda, kiriş derinliği, eksenel yük
seviyesi ve depremsellik etkilerini gözlemlemek için iki farklı kolon kiriş
yapılandırılmasına sahip bir çerçeve sistemi oluşturulmuştur. Çerçeve modeli yirmi
farklı yer hareketi kaydı kullanılarak zaman tanım aralığı analizlerine tabii
tutulmuştur. Kayma bölgelerindeki bölgesel gerilme talepleri yanı sıra genel çerçeve
deformasyon talepleri değerlendirilmiştir. Analiz sonuçları şunu göstermiştir ki AISC
şartnamesi kayma bölgesinin akmasına izin verirken, FEMA 355D kriterlerine göre
dizayn edilmiş kayma bölgeleri hem kısa hem derin kiriş konfigürasyonunda en az
akma değerleri göstermiştir. Analiz sonuçlarına dayanarak, kayma bölgerindeki
bölgesel kesme gerilmesi talepleri katlar arası ötelenme ve birimlenmiş kayma
bölgesi kalınlığının fonksiyonu olarak ifade edilmiştir.
Anahtar Kelimeler: Çelik Çerçeveler, Kayma Bölgesi, Sonlu Elemanlar Analizi,
Sismik Dizayn, Kiriş Derinliği
vi
ACKNOWLEDGMENTS
The author wishes to express his gratitude to his supervisor Prof. Dr. Cem Topkaya
for his invaluable asistance and guidance throughout this study.
Many thanks to all of his graduate friends for their support and kind friendship.
The author wishes to express his gratitude to his family, his father, Civil Engineer
Levent Tuna, his mother Semiha Tuna, his sister Begüm Tuna, and his brother Erkut
Tuna for their everlasting love and encouragement.
Lastly, the author would like to give his special thanks to his love Haleh for the moral
support she provided throughout his research.
This study was supported by the Scientific & Technological Research Council of
Turkey (TÜBİTAK – 105M242). Opinions expressed in this thesis are those of the
author and do not reflect the views of the sponsor.
vii
TABLE OF CONTENTS
ABSTRACT ............................................................................................................ iv
ÖZ ........................................................................................................................... v
ACKNOWLEDGMENTS ......................................................................................... vi
TABLE OF CONTENTS ......................................................................................... vii
LIST OF FIGURES ................................................................................................. ix
LIST OF TABLES ................................................................................................... xi
CHAPTER
1. INTRODUCTION ................................................................................................ 1
1.1 Description of a Panel Zone ....................................................................... 1
1.2 Importance and Behavior of Panel Zones .................................................. 2
1.3 Background ............................................................................................... 3
1.3.1 Experimental Studies .......................................................................... 3
1.3.2 Numerical Studies .............................................................................. 4
1.4 Scope of the Thesis ..................................................................................10
2. DESING OF PANEL ZONES ACCORDING TO VARIOUS NORMS ...................12
2.1 Panel Zone Shear Force Demand ............................................................12
2.1.1 Turkish Seismic Code (2007) .............................................................12
2.1.2 AISC Specification (2010) and AISC Seismic Provision (2005) ..........13
2.1.3 FEMA 355D (2000) ............................................................................14
2.1.4 Eurocode 3: Design of Steel Structures (2005) ..................................15
2.2 Panel Zone Shear Strength Capacity ........................................................15
2.2.1 Turkish Seismic Code (2007) .............................................................15
2.2.2 AISC Seismic Provision (2005) and AISC Specification (2010) ..........16
2.2.3 FEMA 355D (2000) ............................................................................17
2.2.4 Eurocode 3: Design of Steel Structures (2005) ..................................18

viii
3. FINITE ELEMENT MODELING AND VERIFICATION .........................................20
3.1 Benchmark Experiments of Krawinkler et al. (1971) .................................21
3.2 Finite Element Modeling Details ...............................................................23
4. PARAMETRIC STUDY .......................................................................................27
4.1 Results of Analysis for Shallow Beam Case .............................................30
4.1.1 Axial Load Level = 0.0 Py ...................................................................30
4.1.2 Axial Load Level = 0.3 Py ...................................................................42
4.2 Results of Analysis for Deep Beam Case .................................................44
4.2.1 Axial Load Level = 0.0 Py ...................................................................44
4.2.2 Axial Load Level = 0.3 Py ...................................................................53
4.3 Estimation of Inelastic Panel Zone Shear Deformation Demands .............55
5. CONCLUSIONS .................................................................................................59
REFERENCES ......................................................................................................62
APPENDICES .......................................................................................................64

ix
LIST OF FIGURES
FIGURES
Figure 1.1 Panel Zone Region ..................................................................................1
Figure 1.2 Excessive Joint Distortion (Adopted from AISC) ......................................2
Figure 1.3 Mathematical model for panel zone .........................................................5
Figure 2.1 LRFD forces and moments in panel zone .............................................. 14
Figure 2.2 Shear forces and moments in web panel ............................................... 15
Figure 3.1 The test set up (dimensions in mm) ....................................................... 22
Figure 3.2 The loading program .............................................................................. 22
Figure 3.3 Finite element modelling ........................................................................ 24
Figure 3.4 Test results by Krawinkler, et al.(1971) .................................................. 25
Figure 3.5 LS- Dyna Analysis Results ..................................................................... 25
Figure 4.1 A single bay steel moment frame model ................................................ 28
Figure 4.2 2 % Damped Response Spectra ........................................................... 30
Figure 4.3 Analysis results of exterior columns with unreinforced panel zones ...... 31
Figure 4.4 Normalized Shear Strain vs Interstory Disp. for interior columns ............ 32
Figure 4.5 Base Shear vs Top Story Drift relationship ............................................. 32
Figure 4.6 Normalized Shear Strain vs Interstory Disp. for exterior columns ........... 33
Figure 4.7 Normalized Shear Strain vs Interstory Disp. for interior columns ............ 34
Figure 4.8 Base Shear vs Top Story Drift Relationship ........................................... 34
Figure 4.9 Normalized Shear Strain vs Interstory Disp. for exterior columns ........... 35
Figure 4.10 Normalized Shear Strain vs Interstory Disp. for interior columns .......... 36
Figure 4.11 Base Shear vs Top Story Drift Relationship ......................................... 36
Figure 4.12 Normalized Shear Strain vs Interstory Disp. for exterior columns ......... 37
Figure 4.13 Normalized Shear Strain vs Interstory Disp. for interior columns .......... 38
Figure 4.14 Base Shear vs Top Story Disp. Relationship ........................................ 38
Figure 4.15 Normalized Shear Strain vs Interstory Disp. for exterior columns ......... 39
Figure 4.16 Normalized Shear Strain vs Interstory Disp. for interior columns .......... 40
Figure 4.17 Base Shear vs Top Story Disp. Relationship ........................................ 40
Figure 4.18 Plastic Hinge Formation ....................................................................... 41
Figure 4.19 Normalized Shear Strain vs Interstory Disp. for exterior columns ......... 45

x
Figure 4.20 Normalized Shear Strain vs Interstory Disp. for interior columns .......... 45
Figure 4.21 Base Shear vs Top Story Disp. Relationship ........................................ 46
Figure 4.22 Normalized Shear Strain vs Interstory Disp. for exterior columns ......... 47
Figure 4.23 Normalized Shear Strain vs Interstory Disp. for interior columns .......... 47
Figure 4.24 Base Shear vs Top Story Displacement relationship ............................ 48
Figure 4.25 Normalized Shear Strain vs. Interstory Disp. for exterior columns ........ 49
Figure 4.26 Normalized Shear Strain vs. Interstory Disp. for interior columns ......... 49
Figure 4.27 Base Shear vs. Top Story Displacement relationship ........................... 50
Figure 4.28 Normalized Shear Strain vs. Interstory Disp. for exterior columns ........ 51
Figure 4.29 Normalized Shear Strain vs. Interstory Disp. for interior columns ......... 51
Figure 4.30 Base Shear vs. Top Story Displacement relationship ........................... 52
Figure 4.31 The 0.4 Case Panel Zone Shear Deformation Demands Curve ........... 56
Figure 4.32 The 0.5 PZref Case Panel Zone Shear Deformation Demands Curve ... 56
Figure 4.33 The 0.6 PZref Case Panel Zone Shear Deformation Demands Curve ... 57
Figure 4.34 The 0.8 PZref Case Panel Zone Shear Deformation Demands Curve ... 57
Figure 4.35 The 1.0 PZref Case Panel Zone Shear Deformation Demands Curve ... 58

xi
LIST OF TABLES
TABLES
Table 3.1 Geometric Properties of Beam-Column Sections .................................... 21
Table 4.1 Ground Motion Records List .................................................................... 29
Table 4.2 Comparision between 0.0 Py and 0.3 Py axial load on columns cases ..... 43
Table 4.3 Comparision between 0.0 Py and 0.3 Py axial load on columns cases ..... 54
1
CHAPTER 1
INTRODUCTION
1.1 Description of a Panel Zone
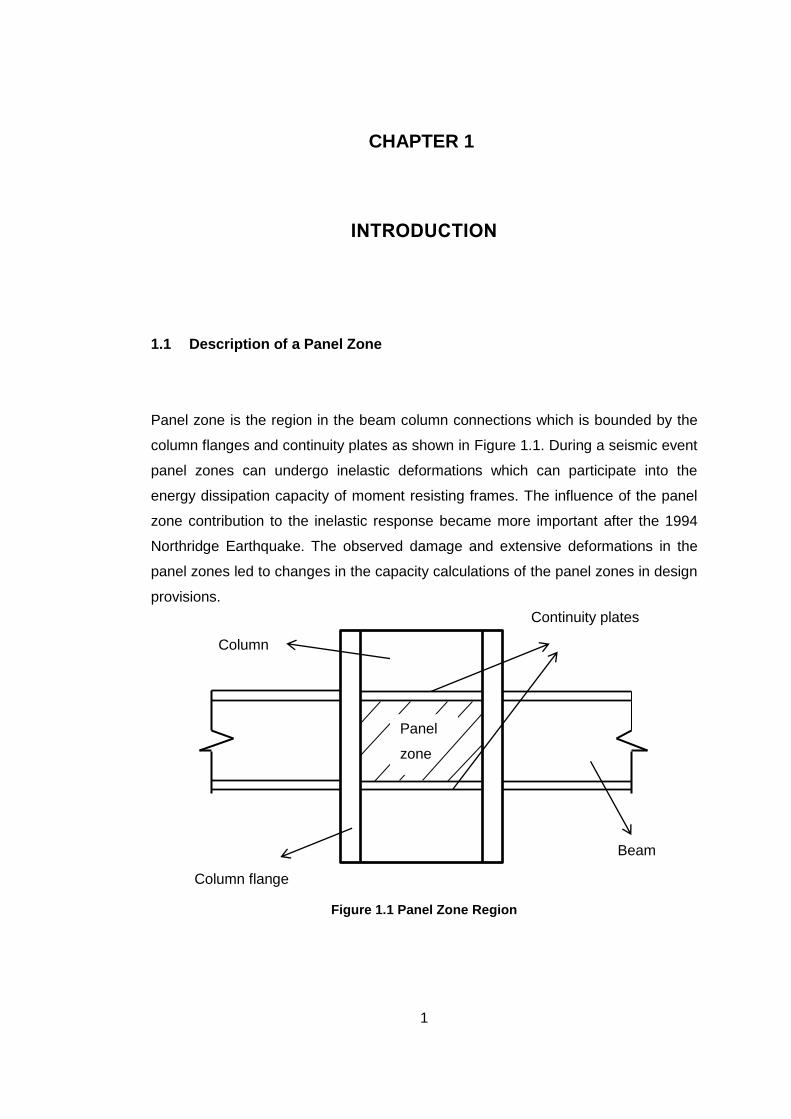
Panel zone is the region in the beam column connections which is bounded by the
column flanges and continuity plates as shown in Figure 1.1. During a seismic event
panel zones can undergo inelastic deformations which can participate into the
energy dissipation capacity of moment resisting frames. The influence of the panel
zone contribution to the inelastic response became more important after the 1994
Northridge Earthquake. The observed damage and extensive deformations in the
panel zones led to changes in the capacity calculations of the panel zones in design
provisions.
Figure 1.1 Panel Zone Region
Panel
zone
Beam
Continuity plates
Column flange
Column
2
1.2 Importance and Behavior of Panel Zones
Steel moment resisting frames are designed to exhibit inelastic behavior during
seismic events. Majority of the yielding is expected to take place at beam ends by
plastic hinge formation. This yielding mechanism is controlled by applying weak
beam strong column concept at the design stage. Panel zones are subjected to very
high shear forces which can potentially cause yielding in these regions. In fact
moderate yielding of the panel zones participates to the energy dissipation capacity
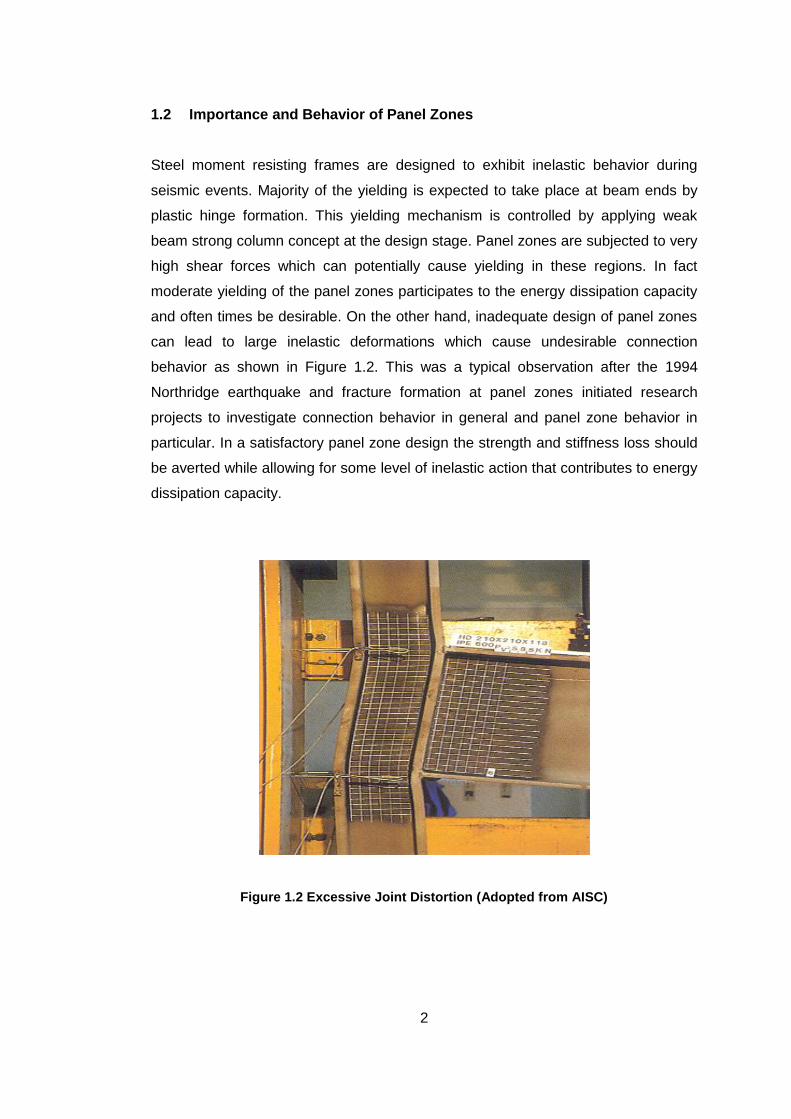
and often times be desirable. On the other hand, inadequate design of panel zones
can lead to large inelastic deformations which cause undesirable connection
behavior as shown in Figure 1.2. This was a typical observation after the 1994
Northridge earthquake and fracture formation at panel zones initiated research
projects to investigate connection behavior in general and panel zone behavior in
particular. In a satisfactory panel zone design the strength and stiffness loss should
be averted while allowing for some level of inelastic action that contributes to energy
dissipation capacity.
Figure 1.2 Excessive Joint Distortion (Adopted from AISC)

3
1.3 Background
A thorough literature survey on panel zone has been performed as a part of this
thesis. Experimental studies and numerical studies are presented separately for
clarity.
1.3.1 Experimental Studies
Bertero (1968) stated that there were insufficient data to predict the inelastic
behavior of the multistory steel framed structures under dynamic actions. In the light
of the test results carried out in Japan, Bertero concluded that it was necessary to
investigate the panel zone deformations for predicting the behavior of a structure.
He suggested a testing program which covers beam,column and panel zone and
their contribution to the inelastic deformations. A subassemblage that represents the
interior beam-to-column connection was selected. Gravity loads on the beams and
axial force in the column were applied to the test set-up simultaneously. The loading
program was applied quasi-statically in order to make the rate of strain high enough
to introduce significant variations. Bertero drew conclusions from the available test
data as the panel zone yielding led to a decrease in the subassamblage stiffness
and, although, reinforcing of the panel zone increased the yielding and ultimate
strength of this region, there was a reduction in stiffness under cyclic loading.
Krawinkler H., et al., (1971) conducted experimental and analytical studies on
beam-to-column sub-assemblages to obtain quantitative information regarding the
lateral stiffness-story displacement relationships for unbraced steel frames. For this
purpose, four specimens, two of which are from identical shapes were prepared to
simulate a typical upper story and a lower story of the 20 story 4 bay office building.
The samples have been tested under both vertical and lateral forces. To simulate
the characteristic action of a severe earthquake, quasi-static loading had been
applied. In the light of the experiment results, Krawinkler, et al. concluded the
following;
4
Connections should be designed to provide a balance between the inelastic
deformations taking place in connection and beam. It would lead too large
demand on beam rotation capacities. Designing the panel zone rigid in order
to behave elastic under severe earthquake is not advantageous.
The connections showed a large reverse strength beyond yielding.
The panel zone distortions had to be limited to a ductility ratio of six to avoid
local and weld failures.
The panel distortions have led to a significant reduction in the elastic and
inelastic stiffness of the sub-assemblage.
Tsai, et al. (1995) performed ten seismic beam to column connection tests in order
to examine seismic design of moment resisting steel frame connections.
Experimental set up were prepared by placing the column horizontally and
connecting the beam to column vertically. Four different beam sections which had
various plastic section modulus ratio of beam flange to entire beam section were
selected. A36 steel grade was used for all beam specimens. All beam lengths were
2.11 m long. All columns were selected as W 14x159 with A572 Grade 50 steel.
Eight mm doubler plates were welded to the panel zones. Cyclically increasing
displacements were applied to the specimens during the test until failure was
observed. Tsai, et al (1995) concluded that when the panel zones were reinforced
properly, they increase the overall inelastic deformation capacity of the connections.
1.3.2 Numerical Studies
Krawinkler H. (1978) pointed out that shear force effects in joints have to be taken
into account in the design of steel frames. Because, joints were able to transmit the
high shear forces through a column. In the light of his past experimental data,
Krawinkler claimed that shear stresses were the highest at the center of the panel
zone and reduces toward to the four corners. So, a mathematical model was
prepared for strength and stiffness calculations. This model consisted of an elastic-
perfectly plastic shear panel surrounded by rigid boundaries with springs at four

5
γ
corners which were representing the stiffness of elements surrounding the panel
zone (Figure 1.3).
Figure 1.3 Mathematical model for panel zone
The elastic stiffness was defined as;
where, V = design shear force in joint, = angle of shear distortion, dc = column
depth, t = column web thickness, G = shear modulus of steel
This equation was valid until √ ,where Fy = yield strength of column.
After yielding the spring stiffness surrounding by panel zone is expressed;
where, M = moment in beam at face of column, = curvature, E = modulus of
elasticity of steel, bc = width of column, tcf = thickness of column flange
The post elastic stiffness can be expressed;
V
V
0.95 db
0.95 dc
γ
Rigid
Boundaries
6
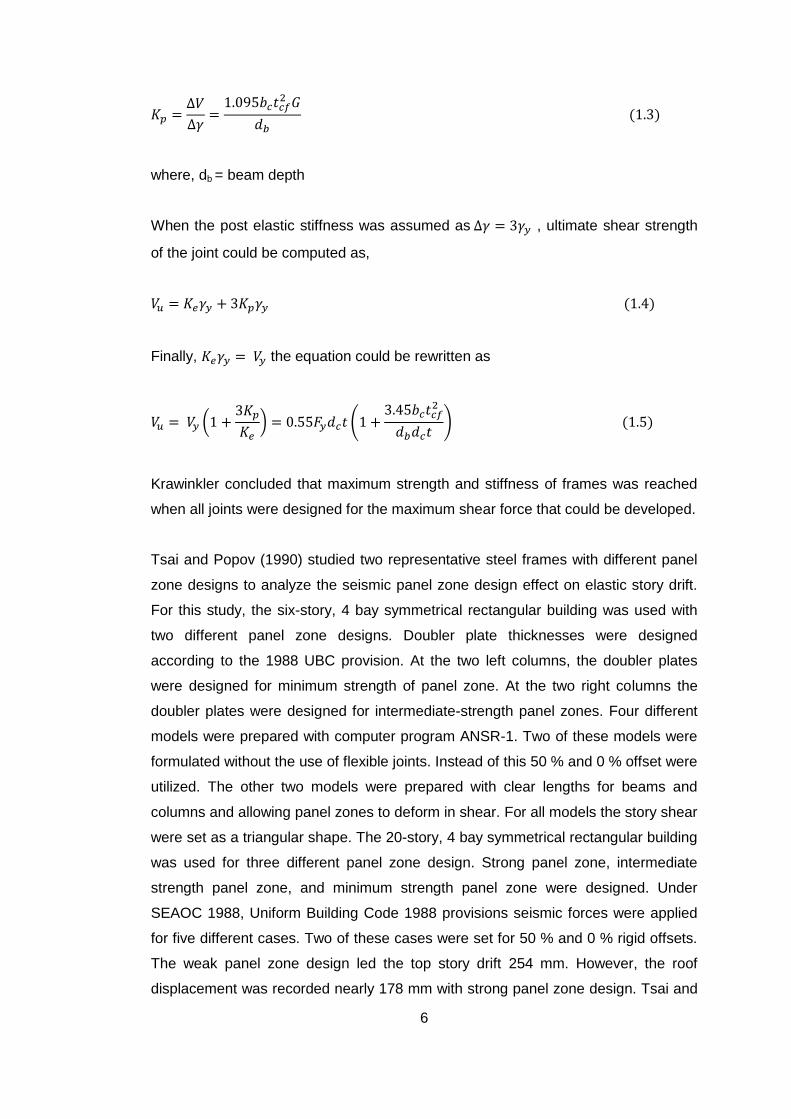
where, db = beam depth
When the post elastic stiffness was assumed as , ultimate shear strength
of the joint could be computed as,
Finally, the equation could be rewritten as
(
) (
)
Krawinkler concluded that maximum strength and stiffness of frames was reached
when all joints were designed for the maximum shear force that could be developed.
Tsai and Popov (1990) studied two representative steel frames with different panel
zone designs to analyze the seismic panel zone design effect on elastic story drift.
For this study, the six-story, 4 bay symmetrical rectangular building was used with
two different panel zone designs. Doubler plate thicknesses were designed
according to the 1988 UBC provision. At the two left columns, the doubler plates
were designed for minimum strength of panel zone. At the two right columns the
doubler plates were designed for intermediate-strength panel zones. Four different
models were prepared with computer program ANSR-1. Two of these models were
formulated without the use of flexible joints. Instead of this 50 % and 0 % offset were
utilized. The other two models were prepared with clear lengths for beams and
columns and allowing panel zones to deform in shear. For all models the story shear
were set as a triangular shape. The 20-story, 4 bay symmetrical rectangular building
was used for three different panel zone design. Strong panel zone, intermediate
strength panel zone, and minimum strength panel zone were designed. Under
SEAOC 1988, Uniform Building Code 1988 provisions seismic forces were applied
for five different cases. Two of these cases were set for 50 % and 0 % rigid offsets.
The weak panel zone design led the top story drift 254 mm. However, the roof
displacement was recorded nearly 178 mm with strong panel zone design. Tsai and
7
Popov concluded that while the seismic design codes permit thinner column webs
and reduced the panel zone doubler plate thickness, the weak panel zone would
lead to larger story drifts.
El-Tawil S., et al., (1999), has prepared a finite element model to examine inelastic
panel zone behavior, the effect of the panel zone yielding on the connections, and
make a comparison between current design provisions. For this purpose, three
different configuration of an exterior beam-to-column connection were analyzed. In
the first series, the effect of column web thickness on inelastic behavior of the
connection was examined. In the second series, the effect of beam depth and in the
last series, the effect of column flange thickness was examined. For the all series,
A36 Gr. Steel was used for beams and A572 Gr. 50 steel was used for columns. El-
Tawil, et al., used a mixture of 4-node shell and 8-node brick reduced integration
elements to model the panel zone in this study. The 8-node brick elements were
used at the intersection between the beam bottom flange and column. The rest of
the sub assemblage was modeled with shell elements. Multipoint constraints were
used to provide compatibility between the shell and brick elements. All analyses
were done with a computer program, ABAQUS. El-Tawil concluded that weak panel
zones made beam plastic rotation demands smaller, but at higher plastic connection
rotations, the shear stress conditions were more critical. Therefore, weak panel
zones could cause brittle or ductile fracture at higher connection plastic rotations. El-
Tawil added that FEMA 267A (1997) design provision estimated the panel zone
strength reasonable with different beam depths, but overestimates the strength of
connection with very thick column flanges.
Kim and Engelhardt (2002) prepared mathematical models for describing monotonic
and cyclic load-deformation response of the panel zone. They indicated that the
panel zone yield moment and elastic stiffness were proportioned with increase of the
ratio of the column flange thickness to column depth. In previous studies, just shear
deformation mode was included in the panel zone model (Krawinkler, 1978). In their
study, for monotonic loading both bending and shear deformations modes were
included in the panel zone model. This model was based on quadri-linear panel
zone moment deformation relationship. Dafalias’ bounding surface theory combined
with Cofie’s rule for movement of the bound line was adopted for the cyclic loading
model. For all models available experimental data were compared with findings.
They concluded that the models explained the effects of material yielding and strain
8
hardening. After yielding and strain hardening, the panel zone strength would
decrease due to shear buckling of panel zone or fracture of the column or beam
flanges at the corners of the panel zone. Kim and Engelhardt also mentioned about
the effectiveness of the doubler plates. Based on their models and experimental
data comparison, the doubler plates were not so efficient in panel zone strength and
stiffness. The researchers also added that in many past experiments the doubler
plate effect was less than 50 % percent.
Hsiao K.J., et al. (2007), proposed that the 2003 International Building Code (IBC)
suggested that contribution of the panel zone deformations to overall story drifts
must be included in the mathematical model of the steel moment resisting frame
systems. To do so, two types of models, finite element model and line-element
model were evaluated in this study in order to compare the differences between two
models. A total of 16 beam-column combinations, both exterior and interior sub-
assemblages, were prepared for each type of models. The finite element models for
nonlinear static analysis of exterior and interior frame with welded flange plate
connection was constructed by a computer program NISA/DISPLAY. The models
were consisted of brick and wedge elements. The line elements were set analyzed
with computer program SAP2000. A point load was applied to the tip of the columns
for both finite element model and line-element model. Hsai, et al., concluded that the
finite element model could accurately calculate the overall story drifts by taking the
panel zone deformations into account. Moreover, the line element with point sized
joint model also computed the elastic story drifts fairly accurately if the beam depth
was less or equal to 530 mm. However, the line element model calculated the story
drift more than the finite element model at the usage of deeper beams.
Castro J.M., et al. (2008), presented the main differences between the European
and the U.S. design provisions for panel zones in this study. Castro, et al., indicated
that AISC, FEMA and, Eurocode had differences in calculating panel zone strength,
the evaluation of panel zone demand and contribution of the axial and shear force in
the column. Cruciform and multistory sub-structure models were prepared to
investigate the design provisions. Both models consisted of IPE 400 beams and HE
340A columns. Panel zone strength varied from 70-110 % of the total plastic
capacity of the connecting beams. The sub-structures were modeled with
OpenSees v 1.7.3 using different types of finite elements. Beams and columns were
modeled with a refined mesh. For the panel zone, a new model, 4 external nodes

9
with 13 independent springs were utilized. All springs were assigned rigid except
panel zone springs which behaved according to tri-linear behavior based on
Krawinkler model. Nonlinear static pushover analyses were conducted by controlling
the top node to a target drift to 4% of the story height. Castro, et al., indicated that
strong panel zone reduced the plastic hinge rotation in the beams and weak panel
zone resulted in high distortional demands. He concluded that Eurocode and AISC
design provisions could result to weak panel zones. This was the result of
calculating the panel zone strength with overestimating flexural contribution of the
column flanges. However, FEMA-350 calculated panel zone strength based on the
shear capacity of the column cross-section. The panel zone design according to
FEMA-350 resulted in better outcomes.
Brandonisio G., et al. (2011), studied a limit value of geometric slenderness of panel
zones, the ratio of panel zone width (b) to panel zone thickness (t), beyond that the
panel zone did not buckle under shear forces. They prepared a finite element model
by varied aspect ratios and increasing panel zone slenderness, and then the
findings were compared with American and European design provisions. For this
purpose, 52 finite element models have been prepared with computer program
ABAQUS 6.7. Four node shell elements have been utilized for the specimens, with
the number of integration points through the element thickness equal to five. The
panel zone area was meshed densely, however other parts of the external sub-
assemblage was meshed coarsely. The nonlinear finite element analyses have been
done by using the modified Riks method. The sub-assemblage was loaded through
eight nodes at the tip of the beam by applying a monotonic displacement history.
The target displacement of the beam tip was arranged to 250 mm which
corresponded to 25 % of the interstory drift. Brandonisio concluded that U.S. codes’
limitations to the panel zone slenderness were capable of avoid panel zone shear
buckling. On the other hand, Eurocode 3 limitations were not at the safe side. The
result of finite element analyses and the available experimental data showed that
the panel zone slenderness should be lower than 0.3 for avoiding shear buckling of
the panel zone.
10
Brandonisio G., et al. (2012), worked on the mechanical behavior of the panel zone
and discussed the European and American code differences about panel zone
design. For this purpose, a nonlinear finite element analysis was performed and
experimental test results carried on by different researchers were compared. The
parametric finite element analysis was conducted on ten models of beam to columns
connections. Panel zone aspect ratios varied from 0.29 to 1.29. A finite element
program, ABAQUS 6.7 was used for the nonlinear analysis. Four node shell
elements have been utilized for the specimen models. The panel zone area was
meshed densely, however other parts of the external sub-assemblage was meshed
coarsely. The nonlinear finite element analyses have been done by using the
modified Riks method. The beam end was displaced through eight nodes by
applying a monotonic displacement history. The analysis was performed until the
target displacement of 250 mm was reached. Brandonisio, et al., concluded that
American design code was good at panel zone shear strength prediction. However,
European practice overestimated the panel zone strength up to 60 %. The authors
also added that continuity plates should not be included in the panel zone capacity
calculations.
1.4 Scope of the Thesis
The main objective of this thesis is to investigate panel zone behavior in steel
moment resisting frames. The Northridge earthquake of January 17, 1994
challenged the design provisions. Pre-Northridge connections were believed that
they were capable of developing large plastic rotations without significant strength
loss. However, brittle fractures were experienced at beam-to-column connections.
So, after 1994 Northridge earthquake design codes revised connection capacity
calculations. The AISC Specification, FEMA 355 D recommendations, studied
throughout the thesis, suggest different panel zone design. This situation might lead
to different connection performance under seismic loads. Hence, it is important to
know how the differences between these codes affect panel zone behavior.
11
Majority of the studies completed so far concentrated on the behavior of sub-
assemblages and isolated connections with panel zones. The key question that
needs to be answered is the level of demand on panel zones during seismic actions.
Past research have only focused on the elastic frame behavior and identified the
influence on panel zone deformations on the lateral drifts. There is a clear need for a
study that focuses on the inelastic behavior of moment resisting frames with yielding
panel zones. In this thesis, a finite element parametric study has been undertaken to
evaluate the level of demands under seismic actions. A three story five bay frame
with different beam and column sizes were analyzed using explicit dynamic finite
element method to address these issues.
In Chapter 2, the panel zone design concepts according to Turkish Seismic Code,
AISC Specifications, FEMA 355 D, and Eurocode 3 are studied to indicate
similarities and differences among them. In Chapter 3, finite element modeling
details are presented and the results of the experimental research conducted by
Krawinkler (1971) are used for verification of the finite element model. In Chapter 4,
the details and results of the parametric study are presented. Finally, conclusions
are presented in Chapter 5.
12
CHAPTER 2
DESIGN OF PANEL ZONES ACCORDING TO VARIOUS
NORMS
A literature survey which covers provisions of Turkish Seismic Code, AISC
Specification and AISC Seismic Provision, FEMA 355D, and Eurocode 3 for sizing
panel zones was conducted. These specifications have provisions for determining
the shear force demand on the panel zone and the resistance provided by the panel
zone. First, panel zone shear force demand calculations according to these
provisions are presented and explained individually. Then, panel zone shear
strength capacity calculations are given.
2.1 Panel Zone Shear Force Demand
The panel zone shear force demand is defined differently according to Turkish
Seismic code, AISC specification, FEMA 355D, and Eurocode 3. The following
sections present how the shear force demand is calculated for panel zones.
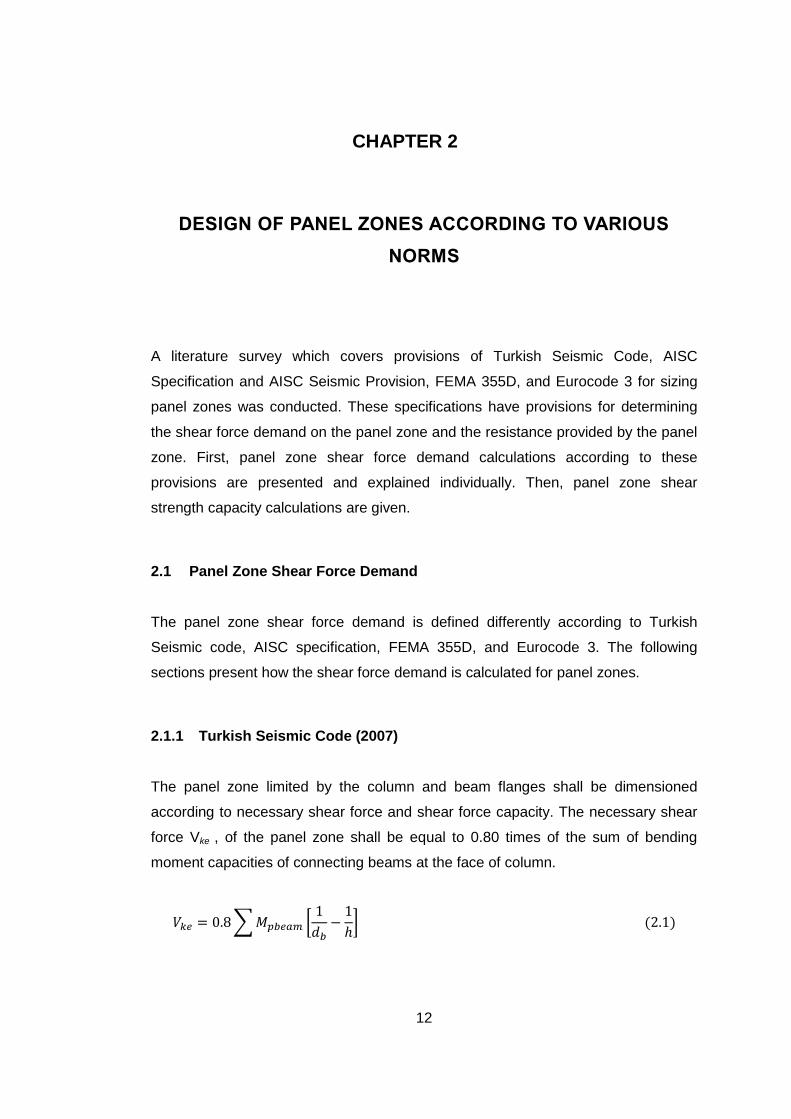
2.1.1 Turkish Seismic Code (2007)
The panel zone limited by the column and beam flanges shall be dimensioned
according to necessary shear force and shear force capacity. The necessary shear
force Vke , of the panel zone shall be equal to 0.80 times of the sum of bending
moment capacities of connecting beams at the face of column.
∑ [
]
13
where Mpbeam = plastic moment capacity of connecting beam, db = beam depth,
dc = column depth, h = average story height on above and below the joint.
The application of the moments at column face to determine shear strength of the
panel zone recognizes that beam hinging will take place at a location away from the
beam to column connection which will result in amplified effects on the panel zone
shear, despite this a reduction factor of 0.8 on the beam yielding effects is included
to the calculation of the necessary shear force of panel zone. However, El Tawil
(1999) indicated that in some cases gravity loads might inhibit the development of
plastic hinges on both sides of a column. However, this is not a case especially for
one sided connections and at perimeter frames where gravity loads may be
relatively small.
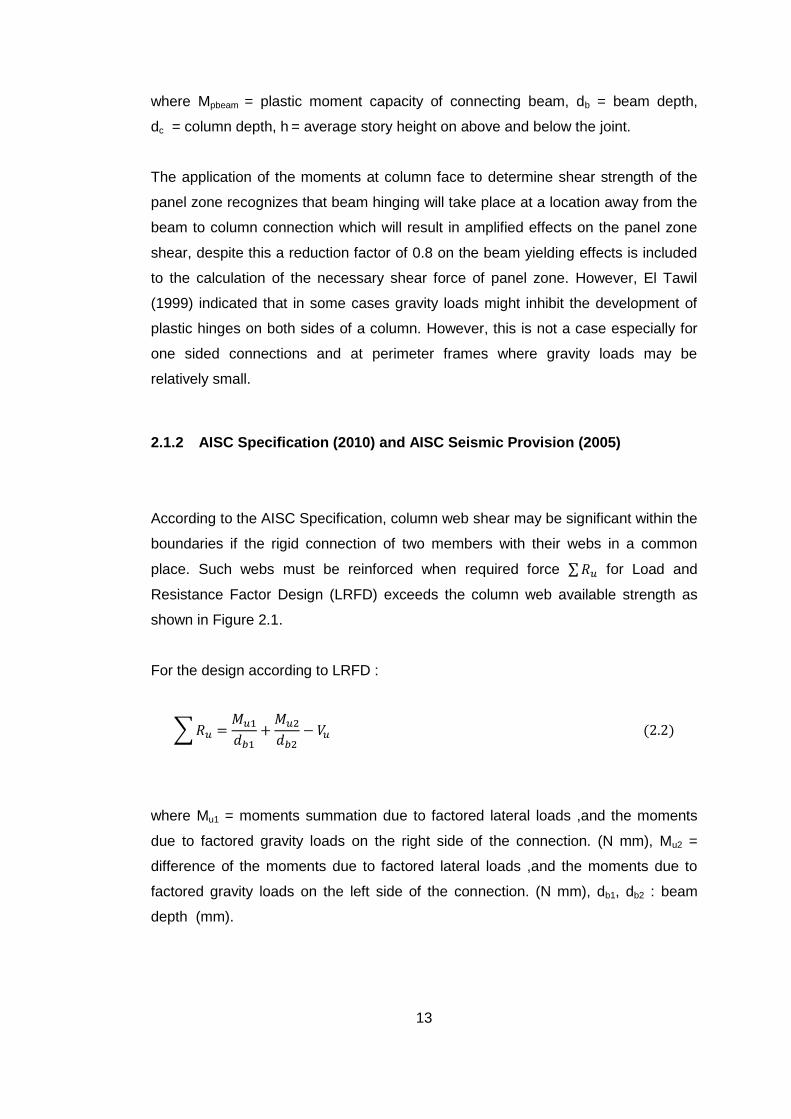
2.1.2 AISC Specification (2010) and AISC Seismic Provision (2005)
According to the AISC Specification, column web shear may be significant within the
boundaries if the rigid connection of two members with their webs in a common
place. Such webs must be reinforced when required force ∑ for Load and
Resistance Factor Design (LRFD) exceeds the column web available strength as
shown in Figure 2.1.
For the design according to LRFD :
∑
where Mu1 = moments summation due to factored lateral loads ,and the moments
due to factored gravity loads on the right side of the connection. (N mm), Mu2 =
difference of the moments due to factored lateral loads ,and the moments due to
factored gravity loads on the left side of the connection. (N mm), db1, db2 : beam
depth (mm).

14
Conservatively 0.95 times the beam depth has been used for db . Krawinkler (1978)
indicated that the effective shear area was not beam depth times web thickness (db
x tw ) since the shear stress distribution was not uniform across the depth of the web
and did not decrease linearly to zero through the column flanges, so it was
conservative to multiply the actual shear area (db x tw) by 0.95.
Figure 2.1 LRFD forces and moments in panel zone
2.1.3 FEMA 355D (2000)
Panel Zone Shear Force is calculated as follows according to FEMA 355D ;
∑
(
) (
)
where Vpz = panel zone shear force, L = span length.
db1
∑Ru
dc
db2
Story Shear, Vu
Vu
Mu1
Mu2

15
2.1.4 Eurocode 3: Design of Steel Structures (2005)
The resulting shear force Vwp,Ed in the web panel should be obtained using:
( )
where, Mb1,Ed , Mb2,Ed = bending moments, Vc1,Ed , Vc2,Ed = column shear forces, z =
lever arm (beam depth).
Figure 2.2 Shear forces and moments in web panel
2.2 Panel Zone Shear Strength Capacity
The panel zone strength capacity definitions are presented as follows:
2.2.1 Turkish Seismic Code (2007)
Shearing force capacity, Vp, shall be calculated with the following equation:
*
+
In order for the panel zone to have necessary shearing strength the following
condition has to be provided:
Mb1,Ed Mb2,Ed
Vc1,Ed
Vc2,Ed
z
16
Minimum thicknesses, tmin, of the each web plates of column and reinforcing plates,
if used, shall be provided with the following condition:
where bcf = flange width of column section, Fy = specified minimum yield stress of
the column web (MPa), tcf = flange thickness of column section, tw = total plate
thickness in the panel zone including the reinforcing plates, u = length of the
periphery of reinforcing plate, Vp = Shearing force capacity.
2.2.2 AISC Seismic Provision (2005) and AISC Specification (2010)
The available strength of the web panel zone for the limit state of shear yielding
shall be determined as follows for Intermediate Moment Frames (IMF) and Ordinary
Moment Frames (OMF):
for Special Moment Frames (SMF) :
The nominal strength, Rn, shall be determined as follows:
(a) When the effect of panel zone deformation on frame stability is not considered
in the analysis :
(i) For
(ii) For
(
)
17
(b) When frame stability, including plastic panel zone deformation, is considered
in the analysis:
(i) For
(
)
(ii) For
(
) (
)
where A = column cross sectional area (mm2), Pc = Py (N) (LRFD), Pc = 0.6Py (N)
(ASD), Pr = required strength (N), Py = Fy A, axial yield strength of the column (N)
If adequate connection ductility is provided and the frame analysis considers the
inelastic panel zone deformations, the additional shear strength is provided by the
factor (
) . Krawinkler (1978) pointed out that when the panel zone web
has completely yielded in shear, the column flanges increase panel zone strength.
The post elastic stiffness of the joint is valid for a range Δγ=3γy.
2.2.3 FEMA 355D (2000)
FEMA 355D recommends that maximum plastic rotational capacity of panel zone
was achieved at the balanced condition. The balanced condition is shear yielding of
panel zone and flexural yielding of connecting beam at nearly the same load level.
Experiments done by Lee et al. (2000) and Roeder (1996) have showed that the
best performance would be achieved in a balance design of panel zone. Panel zone
yielding is a yield mechanism not a failure mode. Moreover, ductile performance is
more likely if the yield capacity of the panel zone is balanced with flexural yielding in
the beam.
Flexural yielding of beam is calculated as:

18
where, Fyb = yield strength of beam, S = elastic section modulus of the beam
Panel zone yielding is calculated as follows:
√
Recommended balance condition for maximum plastic rotational capacity:
Where, Fy = yield strength of column, dc = column depth, tw = column web thickness.
2.2.4 Eurocode 3: Design of Steel Structures (2005)
(1) The design methods are valid if d / tw < 69
(2) For a single-sided joint, or for double-sided joint in which the beam
depths are similar, the shear resistance Vwp,Rd of an unstiffened column
web panel, subject to a design shear Vwp,Ed should be obtained using:
√
where, fy,wc = column yield strength, Avc = shear area, bc = width of column,
A = column area, tcf = column flange thickness, tcw = column web thickness, r: root
radius of the column flange, γM0 = partial safety factor
19
(3) The shear resistance may be increased by the use of stiffeners or
supplementary web plates.
(4) Where transverse web stiffeners are used in the compression and the
tension zone, the plastic shear resistance of the column web panel Vwp,Rd
may be increased by Vwp,add,Rd given by:
where, Mp,fc,Rd = the plastic moment resistance of a column flange, Mp,st,Rd =
the plastic moment resistance of a stiffener, ds = the distance between the
centerlines of the stiffeners

20
CHAPTER 3
FINITE ELEMENT MODELING DETAILS AND VERIFICATION
In this chapter the finite element modeling details are introduced with the verification
of the model. Understanding of elastic and inelastic behavior of the steel
connections has importance on efficient earthquake resistant design of steel frames.
For this purpose, many studies have been conducted to understand the behavior of
these elements. However, there are a few experimental studies performed to date
on panel zones which can be employed for finite element model verification. The
experimental study performed by Krawinkler et al. (1971) is considered as a
benchmark in this thesis and the test results of this experiment are used in adjusting
the finite element models.
At the beginning of 1970’s Krawinkler et al. (1971), conducted an experiment to
investigate inelastic behavior of panel zones. The researchers stated that it was
important to appraise the strength, stiffness, ductility and energy absorption capacity
of the structural elements of unbraced moment resisting frames. For this purpose, a
subassemblage consisted of a column with two beams framing into it was prepared
for experimental investigation. Four specimens were prepared and subjected to two
different cyclic loadings in this research. However, only B-1 specimen test results
were used for verification purpose of the finite element model in this thesis.
Following section demonstrates the details of the experimental study carried out by
Krawinkler et al. (1971).

21
3.1 Benchmark Experiments of Krawinkler et al. (1971)
The researchers selected a 20 story – 4 bay office building prototype to simulate the
real structure behavior and the prototype frame was designed according to “working
or allowable stress design” philosophy and followed the requirements of the U.B.C
(1967) and AISC specification (1969). Krawinkler et al. (1971) decided to prepare
two different sub-assemblages in order to represent upper story and lower story
behavior. The dimensions of the test set-up members were assigned by scaling
down the prototype design. Since just the B-1 specimen test results are used in
verification this specimen dimensions are presented in Table 3.1.
Table 3.1 Geometric Properties of Beam-Column Sections
Column Beam
Prototype Specimen Scale
Prototype Specimen Scale
14 WF 228 8 WF 67 24 WF 68 14 B 22
b (mm) 403.10 209.55 1.91 227.58 127.00 1.79
d (mm) 406.40 228.60 1.78 602.23 348.49 1.73
tw (mm) 26.54 14.61 1.82 10.57 5.84 1.81
tf (mm) 42.88 23.70 1.81 14.78 8.51 1.74
A (mm2) 1703.32 500.38 3.4 508.00 164.34 3.1
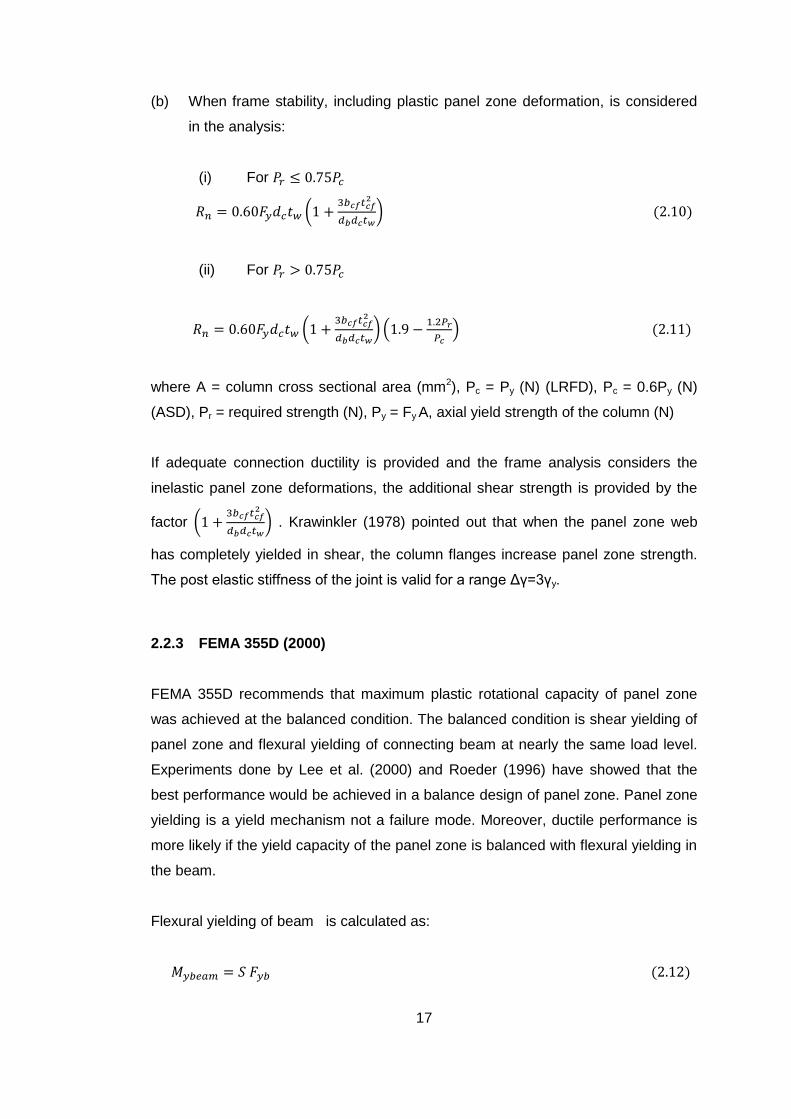
The test set-up used in B-1 and B-2 specimens is illustrated in Figure 3.1. In this test
set-up, steel grade was selected as 250 MPa (36 ksi) for all members. Full
penetration groove welds were used to connect the beams directly to the column
flanges. The effect of the floor system on the strength and stiffness of the
subassemblage was not simulated. Out of plane movement was prevented. The
lateral load, H, was applied at lower column tip. The gravity loads on column and
beams were kept constant during the cyclic loading. The gravity loads applied
throughout the experiment were 1509 kN (339.2 kips) on column and 52.6 kN (12
kips) on beams. The upper column tip was connected to a hinge support and the
beam ends were supported by rollers.
22
Figure 3.1 The test set up (dimensions in mm)
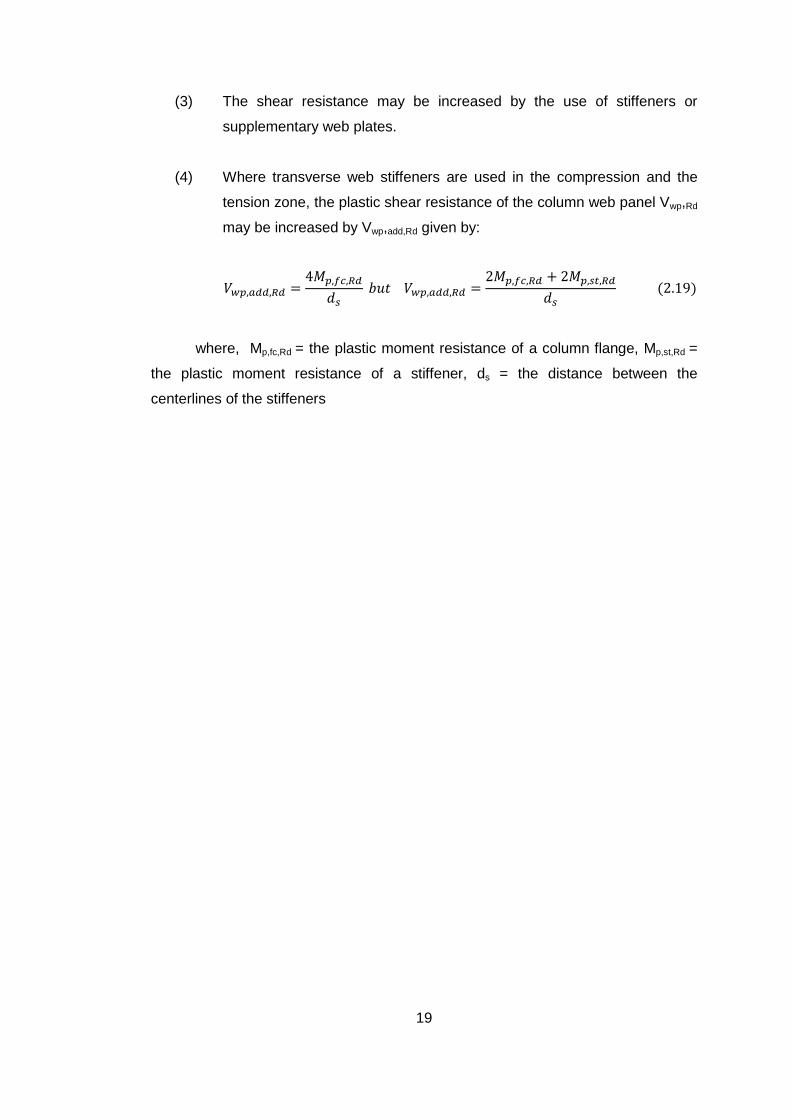
The specimens were subjected to two different loading programs. Loading program
1 was utilized for B-1 specimen (Figure 3.2). This program was prepared in order to
investigate low cycle fatigue problem. Applied lateral load was increased by step
wise manner with four symmetric cycles per step. The cyclic loading was continued
until the specimen had failed.
Figure 3.2 The loading program
-100
-50
0
50
100
150
0 5 10 15
Co
lum
n D
isp
. (m
m)
Cycle number
Specimen B-1
23
The researchers indicated that there was a leakage problem in the hydraulic system
during the loading program. This situation caused problems in keeping the lateral
load at exact values. It could lead some errors while taking data records. Moreover,
the test duration was two days, so strain aging might affect the response of the
specimen.
Krawinkler et al. (1971) concluded that B-1 specimen stress level decreased from
the center of the panel zone towards to the four corner. No local kinking was
observed at the column flanges. The connection showed a high reserve strength
after first yielding. The researchers added that inelastic deformations took place in
the plastic hinge regions of the beam at the B-1 specimen.
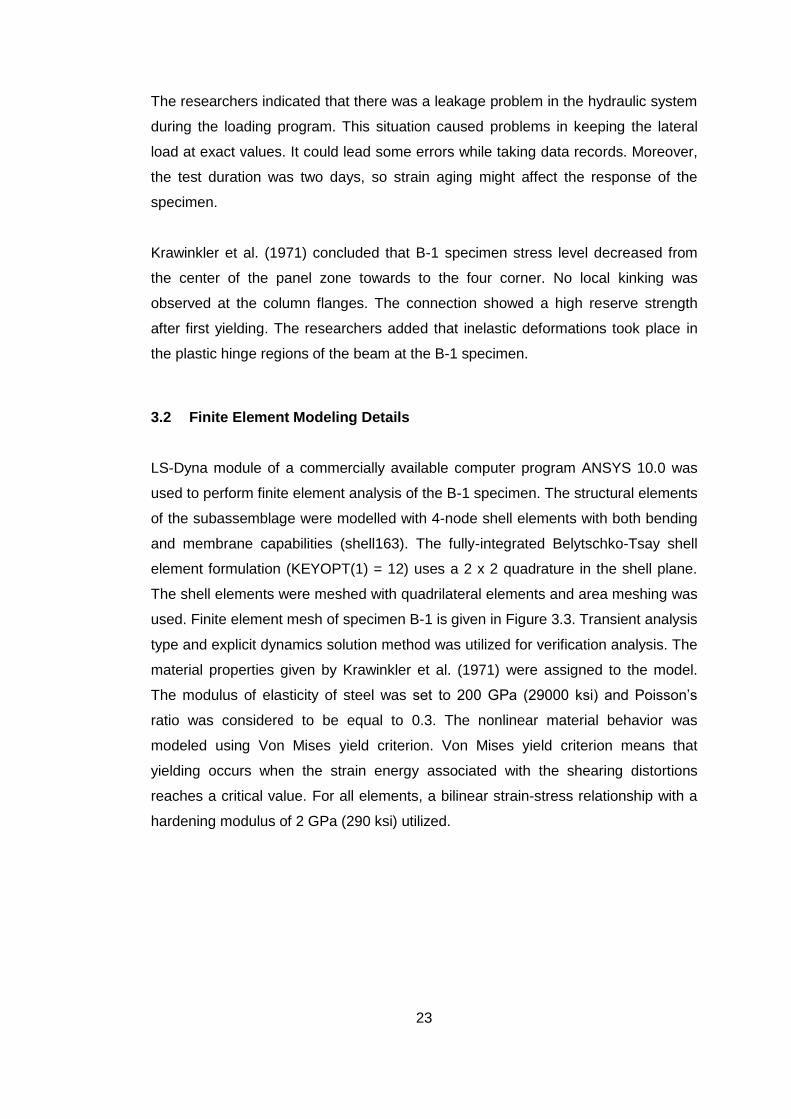
3.2 Finite Element Modeling Details
LS-Dyna module of a commercially available computer program ANSYS 10.0 was
used to perform finite element analysis of the B-1 specimen. The structural elements
of the subassemblage were modelled with 4-node shell elements with both bending
and membrane capabilities (shell163). The fully-integrated Belytschko-Tsay shell
element formulation (KEYOPT(1) = 12) uses a 2 x 2 quadrature in the shell plane.
The shell elements were meshed with quadrilateral elements and area meshing was
used. Finite element mesh of specimen B-1 is given in Figure 3.3. Transient analysis
type and explicit dynamics solution method was utilized for verification analysis. The
material properties given by Krawinkler et al. (1971) were assigned to the model.
The modulus of elasticity of steel was set to 200 GPa (29000 ksi) and Poisson’s
ratio was considered to be equal to 0.3. The nonlinear material behavior was
modeled using Von Mises yield criterion. Von Mises yield criterion means that
yielding occurs when the strain energy associated with the shearing distortions
reaches a critical value. For all elements, a bilinear strain-stress relationship with a
hardening modulus of 2 GPa (290 ksi) utilized.
24
Figure 3.3 Finite element modelling
Out of plane movement of the beam ends and column tips were prevented by
applying displacement boundary condition (uz = 0). Vertical movement of the beams
far ends was prevented to simulate roller support and vertical and horizontal
movements of the upper column end were prevented to simulate hinge supports.
The gravity loads on beams and column were applied at a single node as they were
point loads. The lateral load on lower column end was also introduced at just a
single node. Quasi-static analysis was appropriate to simulate the Krawinkler et al.
(1971) experiment. Since LS-Dyna module of ANSYS 10.0 software was used for
the finite element model, lateral loads were applied with time intervals between each
other to simulate the quasi-static analysis and avoid oscillations. Moreover, an
arbitrary 30 tons (66.14 Ibs) mass was distributed equally through 3 nodes at the
lower column end to overcome oscillation problem. Five percent of critical damping
was assigned as global damping of the subassemblage.
Numerical results and experimental observations were compared in Figure 3.4 and
Figure 3.5. The results were presented on the different graphs to evaluate the
findings well. The experimental data is plotted by digitizing the B-1 graph of lateral
load (H) versus column displacement (δ) presented by Krawinkler et al. (1971). It is

25
evident from comparisons that finite element analysis findings conforms the
experimental results.
Figure 3.4 Test results by Krawinkler, et al.(1971)
Figure 3.5 LS- Dyna Analysis Results
-150
-100
-50
0
50
100
150
-150 -100 -50 0 50 100 150
Fo
rce (
kN
)
Displacement (mm)
H vs δ
-150
-100
-50
0
50
100
150
-150 -100 -50 0 50 100 150
Fo
rce (
kN
)
Displacement (mm)
H vs δ
26
Based on comparison of the actual and predicted behavior of the subassemblage, it
can be concluded that finite element models for parametric studies are able to
simulate the response of structural elements.
27
CHAPTER 4
PARAMETRIC STUDY
Panel zone deformation demands are investigated in this chapter. A representative
steel moment resisting frame was analyzed under twenty different ground motions to
observe the demands. The panel zones were proportioned using the provisions
given in different specifications and the demands for particular panel zone designs
were obtained. Local strain demands at the panel zones as well as the global frame
deformation demands are evaluated.
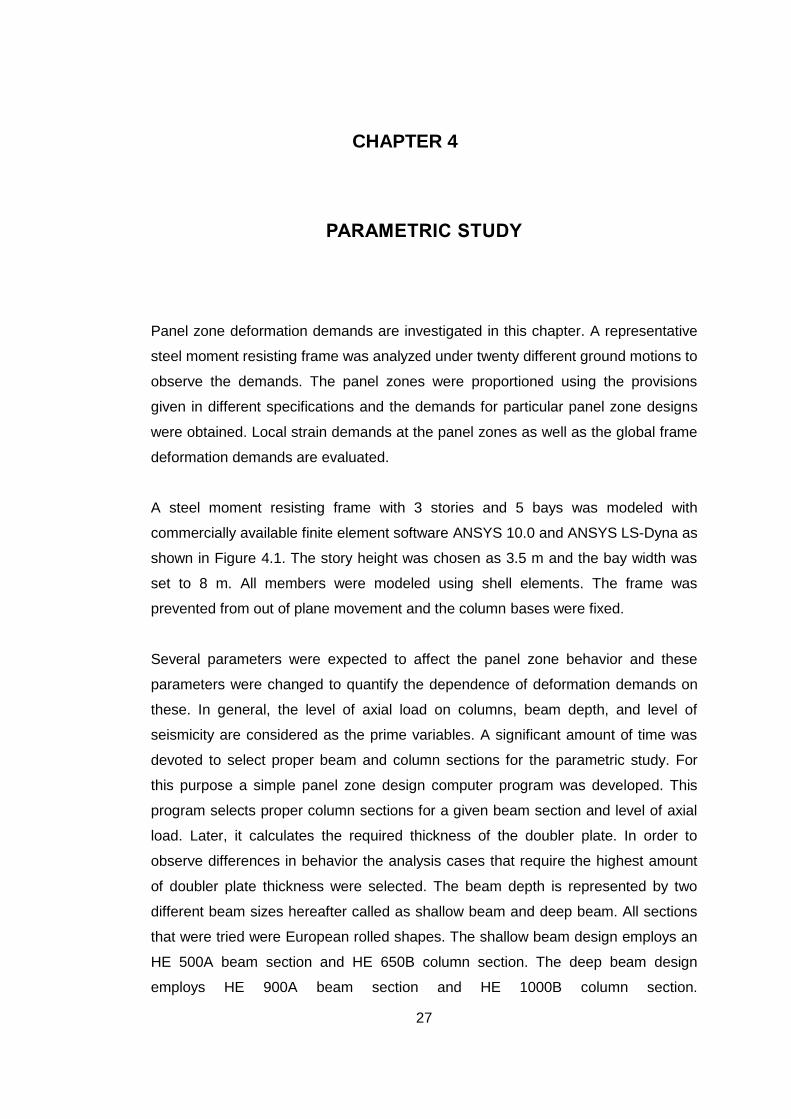
A steel moment resisting frame with 3 stories and 5 bays was modeled with
commercially available finite element software ANSYS 10.0 and ANSYS LS-Dyna as
shown in Figure 4.1. The story height was chosen as 3.5 m and the bay width was
set to 8 m. All members were modeled using shell elements. The frame was
prevented from out of plane movement and the column bases were fixed.
Several parameters were expected to affect the panel zone behavior and these
parameters were changed to quantify the dependence of deformation demands on
these. In general, the level of axial load on columns, beam depth, and level of
seismicity are considered as the prime variables. A significant amount of time was
devoted to select proper beam and column sections for the parametric study. For
this purpose a simple panel zone design computer program was developed. This
program selects proper column sections for a given beam section and level of axial
load. Later, it calculates the required thickness of the doubler plate. In order to
observe differences in behavior the analysis cases that require the highest amount
of doubler plate thickness were selected. The beam depth is represented by two
different beam sizes hereafter called as shallow beam and deep beam. All sections
that were tried were European rolled shapes. The shallow beam design employs an
HE 500A beam section and HE 650B column section. The deep beam design
employs HE 900A beam section and HE 1000B column section.
28
In all cases the steel grade was assumed to be S355 with a yield stress of 355 MPa.
In finite element modeling a bilinear stress-strain curve with a hardening modulus of
2 GPa was adopted.
Concentrated masses were placed at every story at joint locations. The 600 tons
story mass for shallow beam case and 1000 tons story mass for deep beam case
were equally distributed over the each column tip at each story.
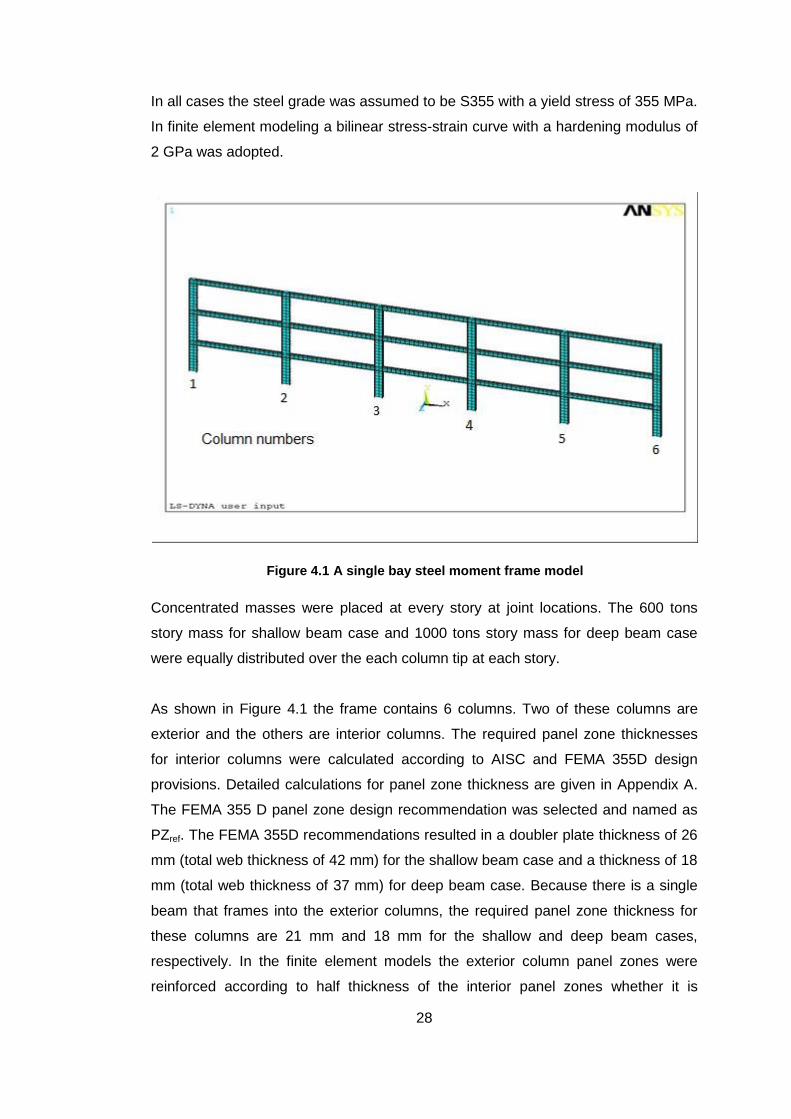
As shown in Figure 4.1 the frame contains 6 columns. Two of these columns are
exterior and the others are interior columns. The required panel zone thicknesses
for interior columns were calculated according to AISC and FEMA 355D design
provisions. Detailed calculations for panel zone thickness are given in Appendix A.
The FEMA 355 D panel zone design recommendation was selected and named as
PZref. The FEMA 355D recommendations resulted in a doubler plate thickness of 26
mm (total web thickness of 42 mm) for the shallow beam case and a thickness of 18
mm (total web thickness of 37 mm) for deep beam case. Because there is a single
beam that frames into the exterior columns, the required panel zone thickness for
these columns are 21 mm and 18 mm for the shallow and deep beam cases,
respectively. In the finite element models the exterior column panel zones were
reinforced according to half thickness of the interior panel zones whether it is
Figure 4.1 A single bay steel moment frame model

29
required. The column web thicknesses are 16 mm and 19 mm for HE 650B and HE
1000B columns, respectively.
The total shear strain of the joints, interstory drifts, and the top story displacement
results of the frame were collected during a typical finite element analysis. The
shear strain values were normalized with respect to yield shear strain of the panel
zone. The yield shear strain of the panel zone is calculated with following formula:
√
where, Fycolumn is the yield strength of the column taken as 355 MPa and G is the
shear modulus taken as 79.3 x 10³ MPa. The shear strain of the panel zone is
calculated as 0.002585.
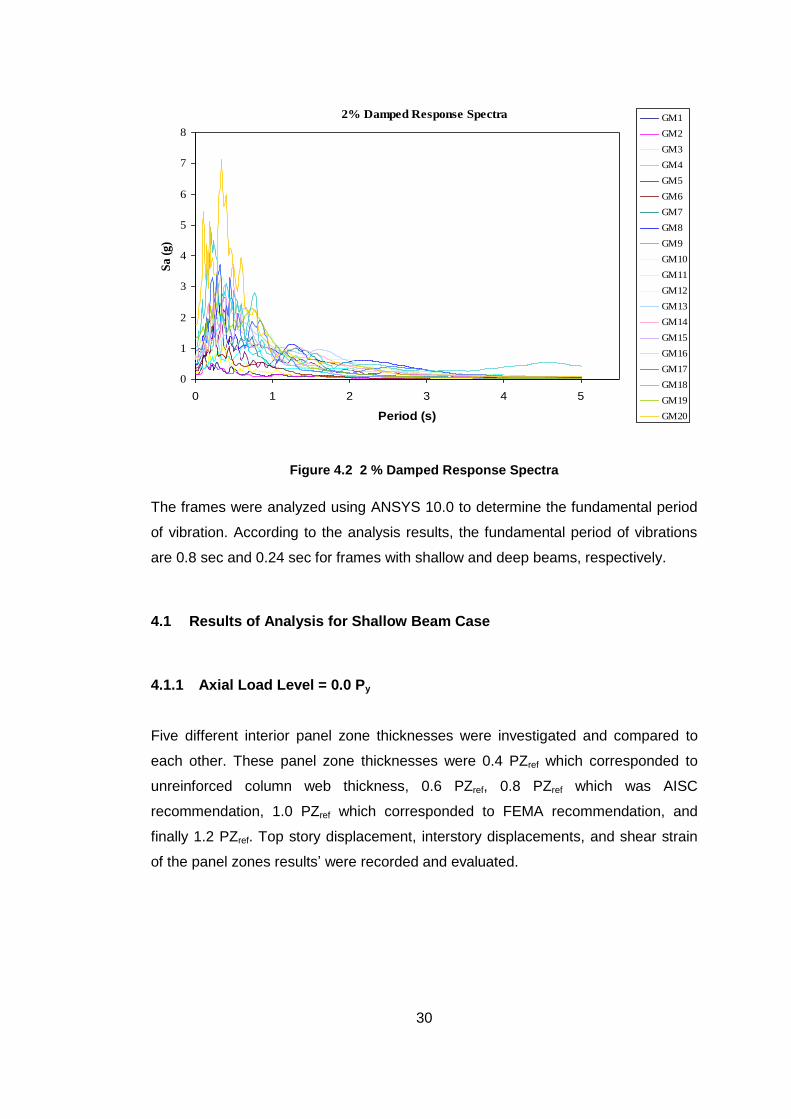
Twenty ground motion records listed in Table 4.1 were used for time history
analyses. Acceleration response spectra for these ground motion records are given
in Figure 4.2.
Table 4.1 Ground Motion Records List
Folder Name
Earthquake Country Location Site Geology Mw PGA
(g)
gm1 Imperial Valley USA El Centro Array #1, Borchard Ranch Alluvium 6.5 0.141
gm2 Morgan Hill USA Gilroy Array #2 (Hwy 101 & Bolsa Rd) Alluvium 6.1 0.157
gm3 Northridge USA Downey County Maint. Bldg. Alluvium 6.7 0.223
gm4 Imperial Valley USA Meloland Overpass Alluvium 6.5 0.314
gm5 Northridge USA Saticoy Alluvium 6.7 0.368
gm6 Whittier Narrows
USA Cedar Hill Nursery, Tarzana Alluvium / Siltstone 6.1 0.405
gm7 Loma Prieta USA Capitola Fire Station Alluvium 7.0 0.472
gm8 Northridge USA Rinaldi Receiving Station Alluvium 6.7 0.480
gm9 Northridge USA Katherine Rd, Simi Valley Alluvium 6.7 0.513
gm10 Imperial Valley USA El Centro Array #5, James Road Alluvium 6.5 0.550
gm11 Chi Chi Taiwan CHY028 USGS(C) 7.6 0.653
gm12 Cape
Mendocino USA Petrolia, General Store Alluvium 7.0 0.662
gm13 Kobe Japan Takarazu USGS (D) 6.9 0.693
gm14 Kobe Japan Takarazu USGS (D) 6.9 0.694
gm15 Northridge USA Katherine Rd, Simi Valley Alluvium 6.7 0.727
gm16 Düzce Turkey Bolu Soil 7.1 0.754
gm17 Northridge USA Sepulveda VA Hospital Alluvium 6.7 0.939
gm18 Tabas Iran Tabas Stiff Soil _ 1.065
gm19 Morgan Hill USA Coyote Lake Dam Rock 6.1 1.298
gm20 Northridge USA Tarzana Cedar Hill Nursery Alluvium 6.7 1.778
30
Figure 4.2 2 % Damped Response Spectra
The frames were analyzed using ANSYS 10.0 to determine the fundamental period
of vibration. According to the analysis results, the fundamental period of vibrations
are 0.8 sec and 0.24 sec for frames with shallow and deep beams, respectively.
4.1 Results of Analysis for Shallow Beam Case
4.1.1 Axial Load Level = 0.0 Py
Five different interior panel zone thicknesses were investigated and compared to
each other. These panel zone thicknesses were 0.4 PZref which corresponded to
unreinforced column web thickness, 0.6 PZref, 0.8 PZref which was AISC
recommendation, 1.0 PZref which corresponded to FEMA recommendation, and
finally 1.2 PZref. Top story displacement, interstory displacements, and shear strain
of the panel zones results’ were recorded and evaluated.
2% Damped Response Spectra
0
1
2
3
4
5
6
7
8
0 1 2 3 4 5
Period (s)
Sa (
g)
GM1
GM2
GM3
GM4
GM5
GM6
GM7
GM8
GM9
GM10
GM11
GM12
GM13
GM14
GM15
GM16
GM17
GM18
GM19
GM20

31
4.1.1.1 Results for Panel Zone Thickness Equal to 0.4 PZref
The interior panel zones were set according to the 0.4 PZref, which was actual
column web thickness. The results for the case of 0.4 PZref are illustrated in Figures
4.3 through 4.5.
The FEMA 355D requirement for exterior panel zones corresponds to a thickness of
21 mm. Since the actual column web thickness of HE 650B column is 16 mm, the
actual column thickness divided by the required thickness ratio corresponds to 0.76.
Figure 4.3 shows the deformation demands (shear strain divided by the yield shear
strain) as a function of maximum interstory drifts. The exterior columns panel zones
experienced up to 5.4 times the yield strain.
Figure 4.3 Analysis results of exterior columns with unreinforced panel zones
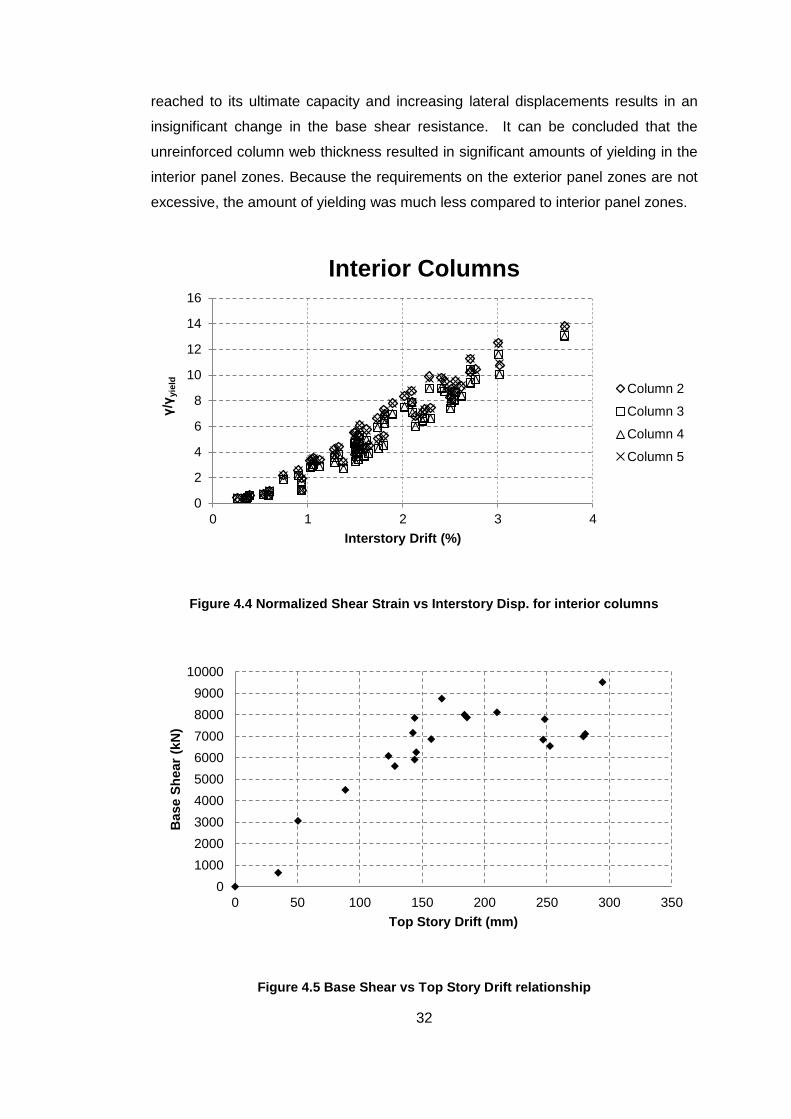
Interior columns of the frame highly yielded. All interior columns showed almost the
same pane zone behavior. Actually, column 2 and 5 panel zones had almost the
same records for both interstory drifts and normalized shear strains. These panel
zones experienced a maximum of 13.8 times the shear yield strain as shown in
Figure 4.4. However, column 3 and 4 panel zones shear yield strains were 6 % less
than column 2 and column 5. The maximum top story displacement was recorded as
295 mm which corresponds to 3.7 % lateral drift. The base shear lateral
displacement response is given in Figure 4.5. As shown in this figure the frame
0
1
2
3
4
5
6
0 1 2 3 4
γ/γ
yie
ld
Interstory Drift (%)
Exterior Columns
Column 1
Column 6
32
reached to its ultimate capacity and increasing lateral displacements results in an
insignificant change in the base shear resistance. It can be concluded that the
unreinforced column web thickness resulted in significant amounts of yielding in the
interior panel zones. Because the requirements on the exterior panel zones are not
excessive, the amount of yielding was much less compared to interior panel zones.
Figure 4.4 Normalized Shear Strain vs Interstory Disp. for interior columns
Figure 4.5 Base Shear vs Top Story Drift relationship
0
2
4
6
8
10
12
14
16
0 1 2 3 4
γ/γ
yie
ld
Interstory Drift (%)
Interior Columns
Column 2
Column 3
Column 4
Column 5
0
1000
2000
3000
4000
5000
6000
7000
8000
9000
10000
0 50 100 150 200 250 300 350
Base S
hear
(kN
)
Top Story Drift (mm)

33
4.1.1.2 Results for Panel Zone Thickness Equal to 0.6 PZref
The analyses set were repeated by reinforcing the interior panel zones to 0.6 PZref,
which corresponds to 25 mm. No change was applied to the exterior panel zones;
these were kept at the thickness equal to 0.76 PZref. The following results were
obtained;
Exterior columns experienced nearly 6 times the yield strain. When compared with
the previous case the behavior is similar. This is due to the fact that no change was
applied to the exterior panel zones. The maximum interstory displacements were
nearly 3.5 %. The interstory displacements and normalized shear strains were
almost the same with respect to previous case as shown in Figure 4.6.
Figure 4.6 Normalized Shear Strain vs Interstory Disp. for exterior columns
All interior panel zones showed almost the same behavior. The shear strains of the
panel zones experienced 10 times the yield shear strain as shown in Figure 4.7. The
normalized shear strains of the interior panel zones decreased 30 % with respect to
previous analysis set. The maximum top story displacement was recorded as 313
mm which was 6 % more than the previous analyses. The maximum base shear
force decreased by 12 %, and recorded as 8400 kN as shown in Figure 4.8.
0
1
2
3
4
5
6
0 0.5 1 1.5 2 2.5 3 3.5 4
γ/γ
yie
ld
Interstory Drift (%)
Exterior Columns
Column 1
Column 6

34
Figure 4.7 Normalized Shear Strain vs Interstory Disp. for interior columns
Figure 4.8 Base Shear vs Top Story Drift Relationship
0
2
4
6
8
10
12
0 1 2 3 4
γ/γ
yie
ld
Interstory Drift (%)
Interior Columns
Column 2
Column 3
Column 4
Column 5
0
1000
2000
3000
4000
5000
6000
7000
8000
9000
0 50 100 150 200 250 300 350
Base S
hear
(kN
)
Top Story Drift (mm)

35
4.1.1.3 Results for Panel Zone Thickness Equal to 0.8 PZref
The analyses set were continued with reinforcing the panel zones according to 0.8
PZref, which corresponds to 33 mm. This panel zone thickness corresponded to
AISC Specification panel zone design. The exterior panel zones remained 16 mm
and the interior panel zones were set to 33 mm. The following results were obtained;
Exterior columns experienced up to 4 times the yield strain as shown in Figure 4.9.
The maximum interstory displacements were nearly 2.75 %. The interstory
displacements decreased by 35 % according to unreinforced column web thickness
results. The normalized shear strain values decreased by 37.5 %. The decrease in
normalized shear strain can be attributed to the overall decrease in the frame lateral
drifts.
Figure 4.9 Normalized Shear Strain vs Interstory Disp. for exterior columns
Interior panel zones of the frame experienced 6.5 times the yield strain as shown in
Figure 4.10. The normalized shear strains of the interior columns decreased by 50%
when compared with the case 0.4 PZref. The base shear lateral displacement
response was given in Figure 4.11. The maximum top story was recorded 277 mm
which was 7 % less than the previous analyses set. The maximum base shear was
obtained as 9800 kN.
0
0.5
1
1.5
2
2.5
3
3.5
4
4.5
0 0.5 1 1.5 2 2.5 3
γ/γ
yie
ld
Interstory Drift (%)
Exterior Columns
Column 1
Column 6

36
Figure 4.10 Normalized Shear Strain vs Interstory Disp. for interior columns
Figure 4.11 Base Shear vs Top Story Drift Relationship
0
1
2
3
4
5
6
7
0 0.5 1 1.5 2 2.5 3
γ/γ
yie
ld
Interstory Drift (%)
Interior Columns
Column 2
Column 3
Column 4
Column 5
0
2000
4000
6000
8000
10000
12000
0 50 100 150 200 250 300
Base S
hear
(kN
)
Top Story Drift (%)

37
4.1.1.4 Results for Panel Zone Thickness Equal to 1.0 PZref
The panel zones were reinforced according to 1.0 PZref, 42 mm which is the FEMA
355D recommendation for panel zone design. The exterior panel zones were 21 mm
and the interior panel zones were 42 mm. The following results were obtained;
Exterior panel zones shear strain values were nearly equal to the yield shear strain
or less as shown in Figure 4.12. The maximum recorded interstory displacement
was 2.7 % which is very close to the previous results with 0.8 PZref. However, the
shear strain values decreased by 86 % with respect to 0.8 PZref; and 93 % with
respect to 0.4 PZref which was unreinforced column web thickness. This decrease is
due to the reinforcement applied to the exterior panel zones.
Figure 4.12 Normalized Shear Strain vs Interstory Disp. for exterior columns
The same situation at the exterior panel zones behavior was also observed at the
interior panel zones. All shear strain values were less than or equal to the yield
shear strain value as shown in Figure 4.13. The base shear lateral displacement
response is given in Figure 4.14. The maximum top story displacement was
obtained as 268 mm which decreased by 3 % with respect to previous analysis and
the maximum base shear was 10460 kN.
0
0.2
0.4
0.6
0.8
1
1.2
1.4
0 0.5 1 1.5 2 2.5 3
γ/γ
yie
ld
Interstory Drift (%)
Exterior Columns
Column 1
Column 6

38
Figure 4.13 Normalized Shear Strain vs Interstory Disp. for interior columns
Figure 4.14 Base Shear vs Top Story Disp. Relationship
0
0.2
0.4
0.6
0.8
1
1.2
0 0.5 1 1.5 2 2.5 3
γ/γ
yie
ld
Interstory Drift (%)
Interior Columns
Column 2
Column 3
Column 4
Column 5
0
2000
4000
6000
8000
10000
12000
0 50 100 150 200 250 300
Base S
hear
(kN
)
Top Story Disp. (mm)

39
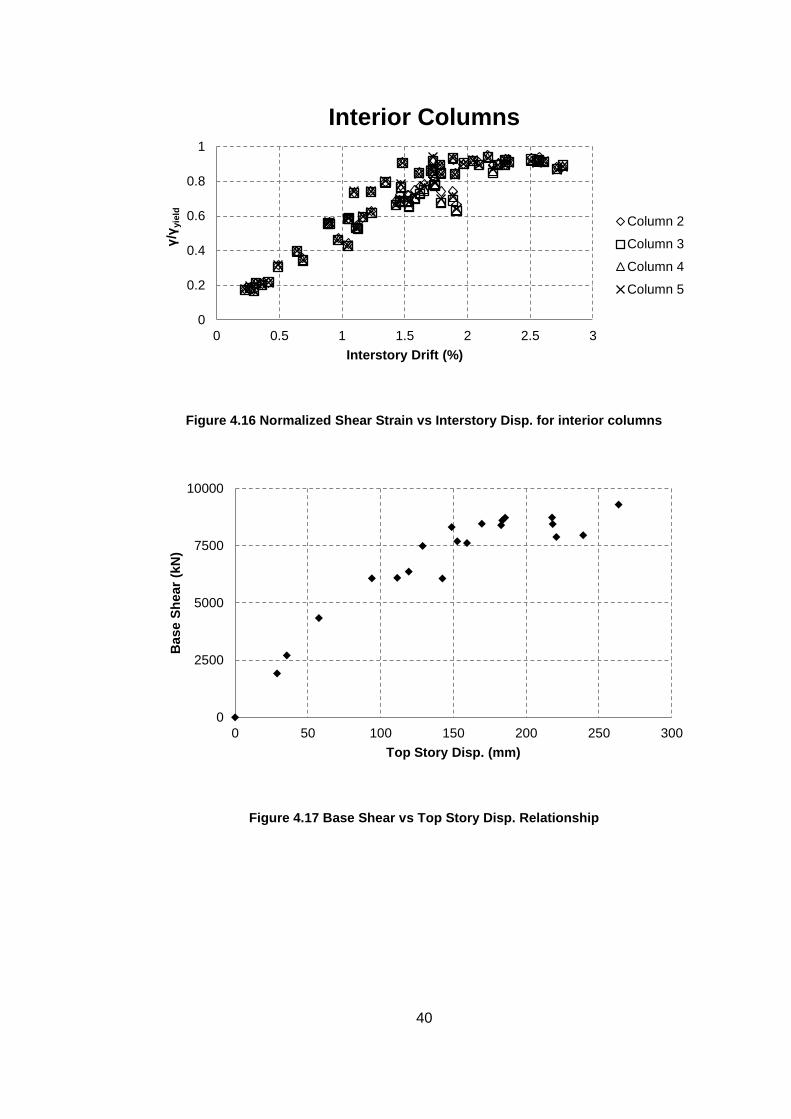
4.1.1.5 Results for Panel Zone Thickness Equal to 1.2 PZref
In order to observe the behavior for cases with a large panel zone thickness beyond
the FEMA 355D requirement, the panel zones were reinforced according to 1.2
PZref, 50 mm. The exterior panel zones were 25 mm and the interior panel zones
were 50 mm. The following results were obtained;
Exterior and interior panel zone shear strain values were less than the yield shear
strain as shown in Figure 4.15 and 4.16. The maximum recorded interstory
displacement was 2.7 % which was same as the previous results. The shear strain
values decreased 7 % with respect to 1.0 PZref. Plastic hinges were formed at the
beam ends as predicted as shown in Figure 4.18. This figure shows the equivalent
plastic strain values. The maximum top story displacement was 264 mm which was
almost same as the previous result. The maximum base shear force decreased to
9300 kN as shown in Figure 4.17.
Figure 4.15 Normalized Shear Strain vs Interstory Disp. for exterior columns
0
0.2
0.4
0.6
0.8
1
1.2
0 0.5 1 1.5 2 2.5 3
γ/γ
yie
ld
Interstory Drift (%)
Exterior Columns
Column 1
Column 6
40
Figure 4.16 Normalized Shear Strain vs Interstory Disp. for interior columns
Figure 4.17 Base Shear vs Top Story Disp. Relationship
0
0.2
0.4
0.6
0.8
1
0 0.5 1 1.5 2 2.5 3
γ/γ
yie
ld
Interstory Drift (%)
Interior Columns
Column 2
Column 3
Column 4
Column 5
0
2500
5000
7500
10000
0 50 100 150 200 250 300
Base S
hear
(kN
)
Top Story Disp. (mm)
41
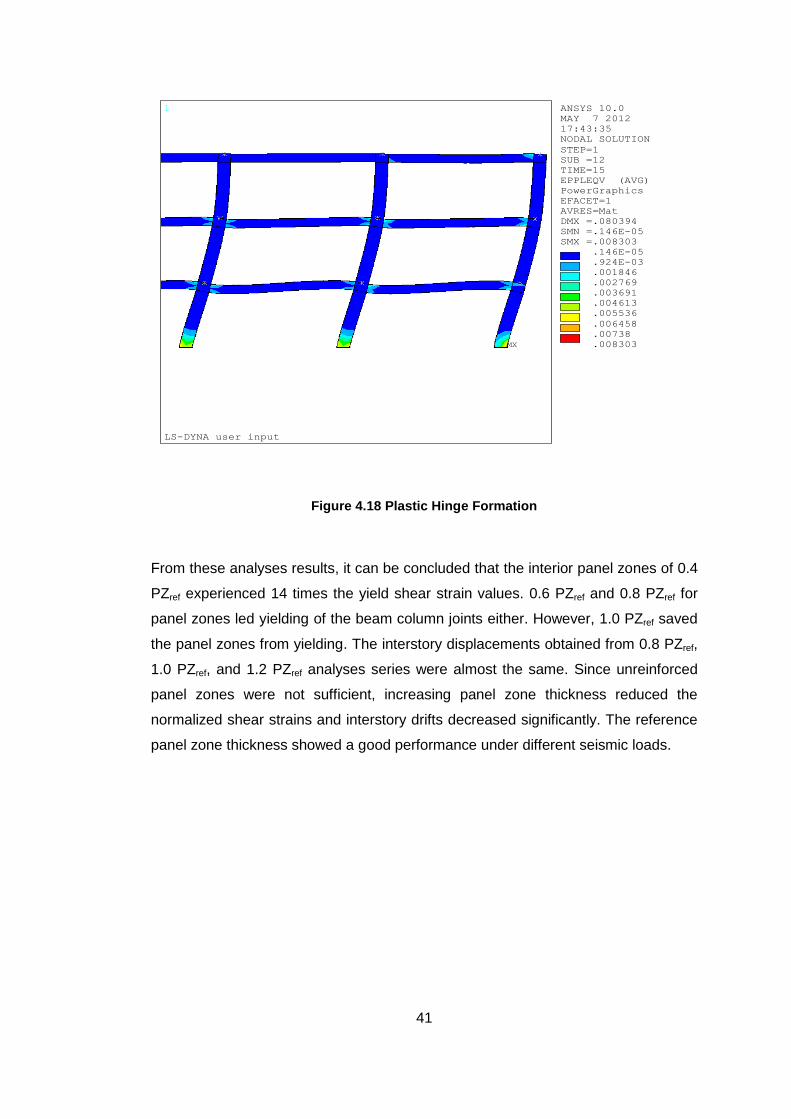
Figure 4.18 Plastic Hinge Formation
From these analyses results, it can be concluded that the interior panel zones of 0.4
PZref experienced 14 times the yield shear strain values. 0.6 PZref and 0.8 PZref for
panel zones led yielding of the beam column joints either. However, 1.0 PZref saved
the panel zones from yielding. The interstory displacements obtained from 0.8 PZref,
1.0 PZref, and 1.2 PZref analyses series were almost the same. Since unreinforced
panel zones were not sufficient, increasing panel zone thickness reduced the
normalized shear strains and interstory drifts decreased significantly. The reference
panel zone thickness showed a good performance under different seismic loads.
ANSYS 10.0
MAY 7 2012
17:43:35
NODAL SOLUTION
STEP=1
SUB =12
TIME=15
EPPLEQV (AVG)
PowerGraphics
EFACET=1
AVRES=Mat
DMX =.080394
SMN =.146E-05
SMX =.008303
1
MX
.146E-05
.924E-03
.001846
.002769
.003691
.004613
.005536
.006458
.00738
.008303
LS-DYNA user input
42
4.1.2 Axial Load Level = 0.3 Py
The previous analysis did not consider the presence of axial loads on columns. The
same analysis was repeated to investigate the effect of axial load on the columns.
For this purpose axial loads were placed at the top story which will subject the
columns at all stories the same level of axial force. A force level of 30 percent of the
axial yield load (0.3 Py) was considered.
The results of the two sets of analysis are compared in Table 4.2. In this table, the
maximums of the investigated quantities are presented. In general, there was no
difference in the maximum level of base shear obtained. The level of axial load had
an influence on the level of lateral displacements and panel zone shear demands. It
is evident from the results that as the panel zone is designed to be weaker the
influence of axial loads is more pronounced. When the panel zone thickness is
equal to 0.4 or 0.6 PZref for interior panel zones, the interstory drifts increase by 22
and 35 percent, respectively due to addition of axial load. This is also reflected by a
change in panel zone deformation demands. The deformation demands (γ / γyield)
increase by 23 and 10 percent for these cases, respectively. When the panel zone
thickness approaches to the thickness level proposed by FEMA 355D the influence
of axial load on the columns become less pronounced. The panel zone demands as
a function of the interstory drifts will be evaluated in later sections of this Chapter.
The results for different levels of axial load will be combined to come up with
demand curves.

43
Table 4.2 Comparision between 0.0 Py and 0.3 Py axial load on columns cases
PZref
(γ / γyield)max Max. Interstory Disp.
(%) Max. Top Story Drift
(mm) Max. Base Shear (kN)
0.0Py 0.3Py Diff. (%)
0.0Py 0.3Py Diff. (%)
0.0Py 0.3Py Diff. (%)
0.0Py 0.3Py Diff. (%)
Inte
rio
r P
an
el
Zo
ne
0.4 13 16 23 3.7 4.5 22 295 385 31 9518 9276 -3
0.6 10 11 10 3.1 4.2 35 313 333 6 8370 8670 4
0.8 6.5 7 8 2.8 2.8 0 277 280 1 10242 10240 0
1.0 1.2 1.3 8 2.7 2.8 4 268 272 1 10457 10547 1
1.2 0.93 1 8 2.7 2.8 4 264 270 2 10294 10894 6
Exte
rio
r P
an
el
Zo
ne
0.76 5.4 8.4 56 3.7 4.5 22 295 385 31 9518 9276 -3
0.76 5.7 6 5 3.1 4.2 35 313 333 6 8370 8670 4
0.76 4.2 5.5 31 2.8 2.8 0 277 280 1 10242 10240 0
1.0 1 1.25 25 2.7 2.8 4 268 272 1 10457 10547 1
1.2 0.96 1 4 2.7 2.8 4 264 270 2 10294 10894 6

44
4.2 Results of Analysis for Deep Beam Case
4.2.1 Axial Load Level = 0.0 Py
The same type of analysis was conducted to investigate the effect of beam depth on
the panel zone deformation demands. For this purpose, the analyses were repeated
using a deeper beam section and an associated column section.
Four different interior panel zone thicknesses were investigated and compared to
each other. These panel zone thicknesses were 0.5 PZref which corresponded to
unreinforced column web thickness as 19 mm, 0.8 PZref which was AISC
recommendation, 1.0 PZref which corresponded to FEMA recommendation, and
finally 1.2 PZref. Top story displacement, interstory displacements, and shear strain
of the panel zones results’ were recorded and evaluated.
4.2.1.1 Results for Panel Zone Thickness Equal to 0.5 PZref
The interior panel zones were set according to the 0.5 PZref, which was the actual
column web thickness. The results for the case 0.5 PZref are illustrated in Figures
4.36 through 4.38.
The FEMA 355D documents do not require doubler plates for exterior panel zones.
Since the actual web thickness of HE 1000B column is 19 mm, the actual column
thickness divided by the required thickness ratio corresponds to 1.0. The exterior
columns panel zones experienced up to 1 times the yield strain as shown in Figure
4.19.

45
Figure 4.19 Normalized Shear Strain vs Interstory Disp. for exterior columns
Interior panel zones experienced 6.5 times the yield shear strain as shown in Figure
4.20. The maximum interstory drift was 195 mm and the base shear was 20700 kN
as shown in Figure 4.21.
Figure 4.20 Normalized Shear Strain vs Interstory Disp. for interior columns
0
0.2
0.4
0.6
0.8
1
1.2
0 0.5 1 1.5 2 2.5
γ/γ
yie
ld
Interstory Drift (%)
Exterior Columns
Column 1
Column 6
0
1
2
3
4
5
6
7
0 0.5 1 1.5 2 2.5
γ/γ
yie
ld
Interstory Drift (%)
Interior Columns
Column 2
Column 3
Column 4
Column 5
46
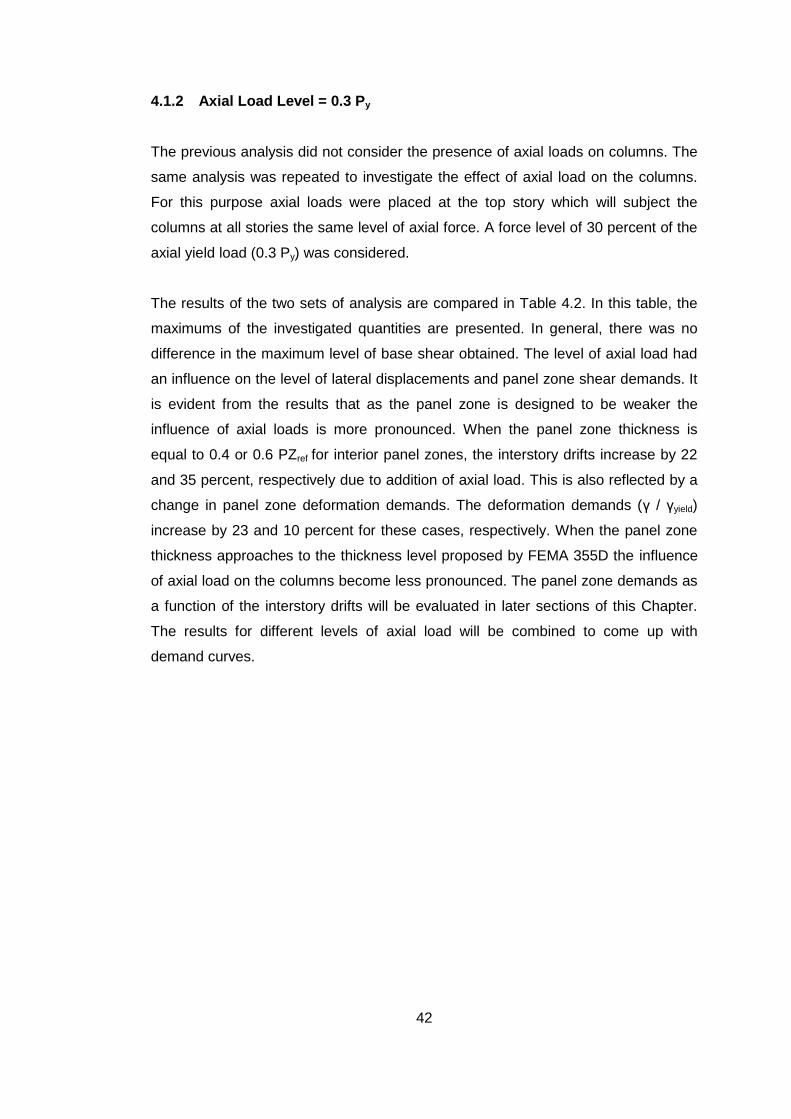
Figure 4.21 Base Shear vs Top Story Disp. Relationship
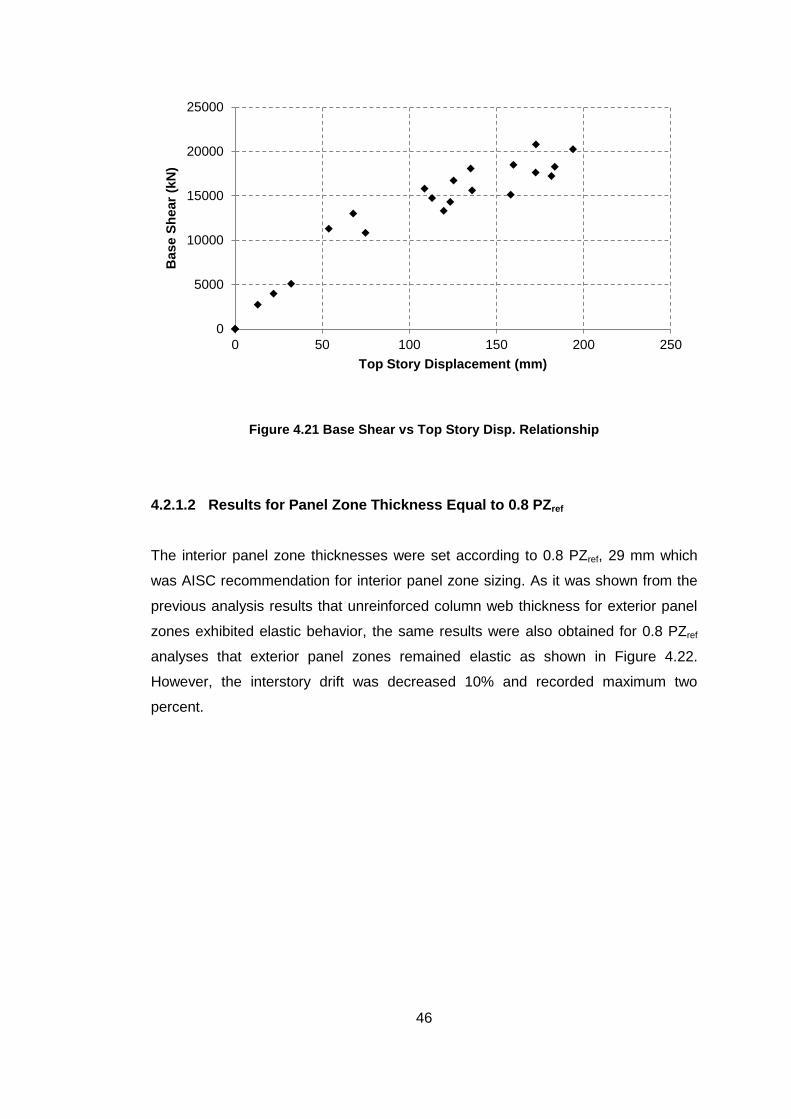
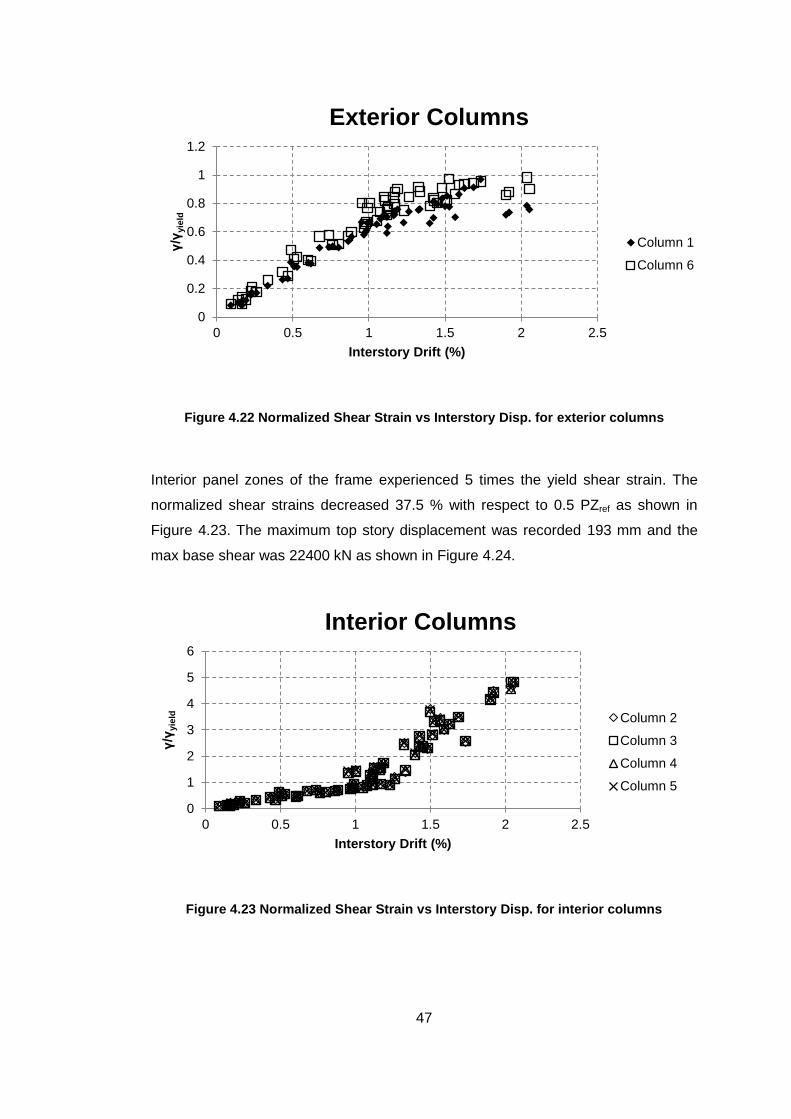
4.2.1.2 Results for Panel Zone Thickness Equal to 0.8 PZref
The interior panel zone thicknesses were set according to 0.8 PZref, 29 mm which
was AISC recommendation for interior panel zone sizing. As it was shown from the
previous analysis results that unreinforced column web thickness for exterior panel
zones exhibited elastic behavior, the same results were also obtained for 0.8 PZref
analyses that exterior panel zones remained elastic as shown in Figure 4.22.
However, the interstory drift was decreased 10% and recorded maximum two
percent.
0
5000
10000
15000
20000
25000
0 50 100 150 200 250
Base S
hear
(kN
)
Top Story Displacement (mm)
47
Figure 4.22 Normalized Shear Strain vs Interstory Disp. for exterior columns
Interior panel zones of the frame experienced 5 times the yield shear strain. The
normalized shear strains decreased 37.5 % with respect to 0.5 PZref as shown in
Figure 4.23. The maximum top story displacement was recorded 193 mm and the
max base shear was 22400 kN as shown in Figure 4.24.
Figure 4.23 Normalized Shear Strain vs Interstory Disp. for interior columns
0
0.2
0.4
0.6
0.8
1
1.2
0 0.5 1 1.5 2 2.5
γ/γ
yie
ld
Interstory Drift (%)
Exterior Columns
Column 1
Column 6
0
1
2
3
4
5
6
0 0.5 1 1.5 2 2.5
γ/γ
yie
ld
Interstory Drift (%)
Interior Columns
Column 2
Column 3
Column 4
Column 5

48
Figure 4.24 Base Shear vs Top Story Displacement relationship
4.2.1.3 Results for Panel Zone Thickness Equal to 1.0 PZref
The interior panel zones reinforced according to 1.0 PZref, 39 mm which was FEMA
355D recommendations for interior panel zones. The following results were
obtained;
Exterior panel zones showed elastic behavior as predicted. However, interstory
drifts were recorded maximum 2.5 % which there was a 20 % increase with respect
to 0.8 PZref analyses as shown in Figure 4.25.
0
5000
10000
15000
20000
25000
0 50 100 150 200 250
Base S
hear
(kN
)
Top Story Displacement (mm)

49
Figure 4.25 Normalized Shear Strain vs. Interstory Disp. for exterior columns
Unlike the shallow beam case, interior panel zones which were sized according to
FEMA 355D recommendation experienced yielding. The maximum normalized
shear strain was 1.7. However, the maximum shear strain decreased 66 % with
respect to previous case as shown in Figure 4.26. The maximum top story
displacement was 190 mm and the maximum base shear was 22670 kN as shown
in Figure 4.27.
Figure 4.26 Normalized Shear Strain vs. Interstory Disp. for interior columns
0
0.2
0.4
0.6
0.8
1
1.2
0 0.5 1 1.5 2 2.5 3
γ/γ
yie
ld
Interstory Drift (%)
Exterior Columns
Column 1
Column 6
0
0.4
0.8
1.2
1.6
2
0 0.5 1 1.5 2 2.5 3
γ/γ
yie
ld
Interstory Drift (%)
Interior Columns
Column 2
Column 3
Column 4
Column 5

50
Figure 4.27 Base Shear vs. Top Story Displacement relationship
4.2.1.4 Results for Panel Zone Thickness Equal to 1.2 PZref
In order to observe the behavior for cases with a large panel zone thickness beyond
the FEMA 355D requirements, the panel zones were reinforced according to 1.2
PZref, 44 mm. The exterior panel zones were 22 mm and the interior panel zones
were 44 mm. The following results were obtained;
Exterior and interior panel zone shear strain values were less than the yield shear
strain as shown in Figure 4.28 and 4.29. The maximum recorded interstory
displacement was 2.5 % which was same as the previous results. The shear strain
values decreased by 48 % with respect to 1.0 PZref. The maximum top story
displacement was 190 mm which was almost same as the previous result. The
maximum base shear force decreased to 22670 kN as shown in Figure 4.30.
0
5000
10000
15000
20000
25000
0 50 100 150 200
Base S
hear
(kN
)
Top Story Displacement (mm)

51
Figure 4.28 Normalized Shear Strain vs. Interstory Disp. for exterior columns
Figure 4.29 Normalized Shear Strain vs. Interstory Disp. for interior columns
0
0.2
0.4
0.6
0.8
1
0 0.5 1 1.5 2 2.5 3
γ/γ
yie
ld
Interstory Drift (%)
Exterior Columns
Column 1
Column 6
0
0.2
0.4
0.6
0.8
1
0 0.5 1 1.5 2 2.5 3
γ/γ
yie
ld
Interstory Drift (%)
Interior Columns
Column 2
Column 3
Column 4
Column 5

52
Figure 4.30 Base Shear vs. Top Story Displacement relationship
From these analyses results, it can be concluded that the unreinforced column web
thickness, 0.5 PZref was not sufficient for interior panel zones but enough for exterior
ones. The panel zones have yielded up to 8 times of the yield shear strain values.
There were no plastic hinge formations at the beam ends. 0.8 PZref which was AISC
recommendation for panel zones led yielding of the beam column joints. FEMA
355D specifications, 1.0 PZref also led the panel zones yielding. The plastic hinges
perfectly formed at the beam ends like the shallow beam case as shown in Figure
4.18. However, the interstory displacements obtained from 1.0 PZref, and 1.2 PZref
analyses series were almost the same. Since unreinforced panel zones were not
sufficient, increasing panel zone thickness reduced the normalized shear strains and
interstory drifts decreased significantly.
0
5000
10000
15000
20000
25000
0 50 100 150 200
Base S
hear
(kN
)
Top Story Displacement (mm)
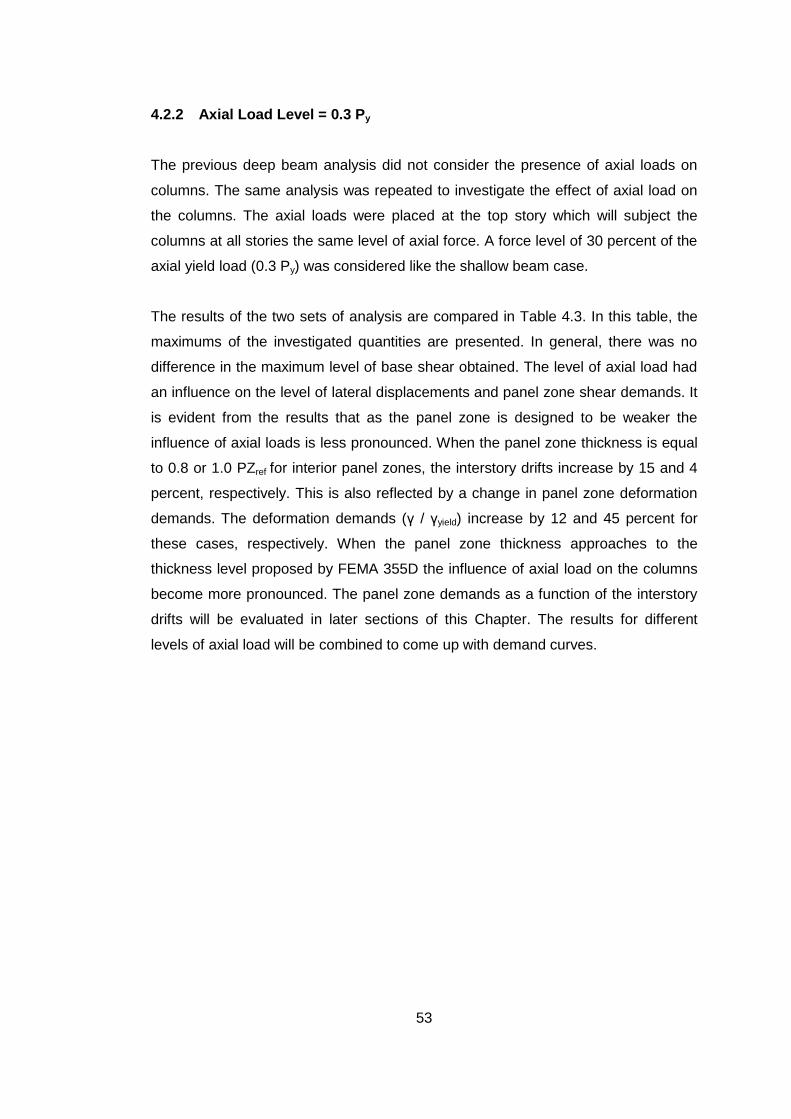
53
4.2.2 Axial Load Level = 0.3 Py
The previous deep beam analysis did not consider the presence of axial loads on
columns. The same analysis was repeated to investigate the effect of axial load on
the columns. The axial loads were placed at the top story which will subject the
columns at all stories the same level of axial force. A force level of 30 percent of the
axial yield load (0.3 Py) was considered like the shallow beam case.
The results of the two sets of analysis are compared in Table 4.3. In this table, the
maximums of the investigated quantities are presented. In general, there was no
difference in the maximum level of base shear obtained. The level of axial load had
an influence on the level of lateral displacements and panel zone shear demands. It
is evident from the results that as the panel zone is designed to be weaker the
influence of axial loads is less pronounced. When the panel zone thickness is equal
to 0.8 or 1.0 PZref for interior panel zones, the interstory drifts increase by 15 and 4
percent, respectively. This is also reflected by a change in panel zone deformation
demands. The deformation demands (γ / γyield) increase by 12 and 45 percent for
these cases, respectively. When the panel zone thickness approaches to the
thickness level proposed by FEMA 355D the influence of axial load on the columns
become more pronounced. The panel zone demands as a function of the interstory
drifts will be evaluated in later sections of this Chapter. The results for different
levels of axial load will be combined to come up with demand curves.

54
Table 4.3 Comparision between 0.0 Py and 0.3 Py axial load on columns cases
PZref
(γ/γyield)max Max. Interstory disp.
(%) Max. Top Story Drift
(mm) Max Base Shear (kN)
0.0Py 0.3Py
Diff. (%) 0.0Py 0.3Py
Diff. (%) 0.0Py 0.3Py
Diff. (%) 0.0Py 0.3Py
Diff. (%)
Inte
rio
r P
an
el
Zo
ne
0.5 6.5 7.4 14 2.3 2.4 4 194 197 2 20698 20727 0
0.8 5 5.6 12 2 2.3 15 193 190 -2 20404 20416 0
1.0 1.65 2.4 45 2.5 2.6 4 189 190 1 22668 22668 0
1.2 0.86 1.02 18 2.5 2.5 0 185 189 2 22665 22758 0
Exte
rio
r P
an
el
Zo
ne
1.0 0.98 1.1 12 2.3 2.4 4 197 207 5 20698 20727 0
1.0 0.93 1 8 2 2.3 15 193 190 -2 20404 20416 0
1.0 0.9 0.95 6 2.5 2.6 4 189 190 1 22668 22668 0
1.2 0.82 0.93 13 2.5 2.5 0 185 189 2 22665 22758 0

55
4.3 Estimation of Inelastic Panel Zone Shear Deformation Demands
The analysis results presented in the following section revealed that panel zone
deformation demands are related to several parameters. The results are not
significantly affected by the level of axial load. Therefore, the dependence of shear
strain demands on the axial load can be neglected. Other parameters such as the
panel zone thickness and interstory drift ratio are found to influence the demands
significantly. An equation used to predict the deformation demands were developed
as a part of this study. In order to develop such an equation data points for different
axial load levels were combined. Separate plots were prepared for shear
deformation demands for different normalized panel zone thickness ratios. These
plots are given in Figure 4.31 through 4.35. The analysis results revealed that the
demands increase as the interstory drift ratio increases. The level of normalized
shear strain demand changes with the level of normalized panel zone thickness
ratio. A single equation that represents the data was developed and can be
expressed as follows:
(
)
(
)
where, tw = column web thickness, twref = reference column web thickness (FEMA
355D), ISD = interstory drift (%).
Comparisons of the estimates are also provided in Figures 4.31 through 4.35. From
these relationships it can be concluded that for typical interstory drifts of 2 percent
and higher the normalized panel zone thickness should be at least 0.6 to satisfy the
recommendations given by Krawinkler et al. (1971).
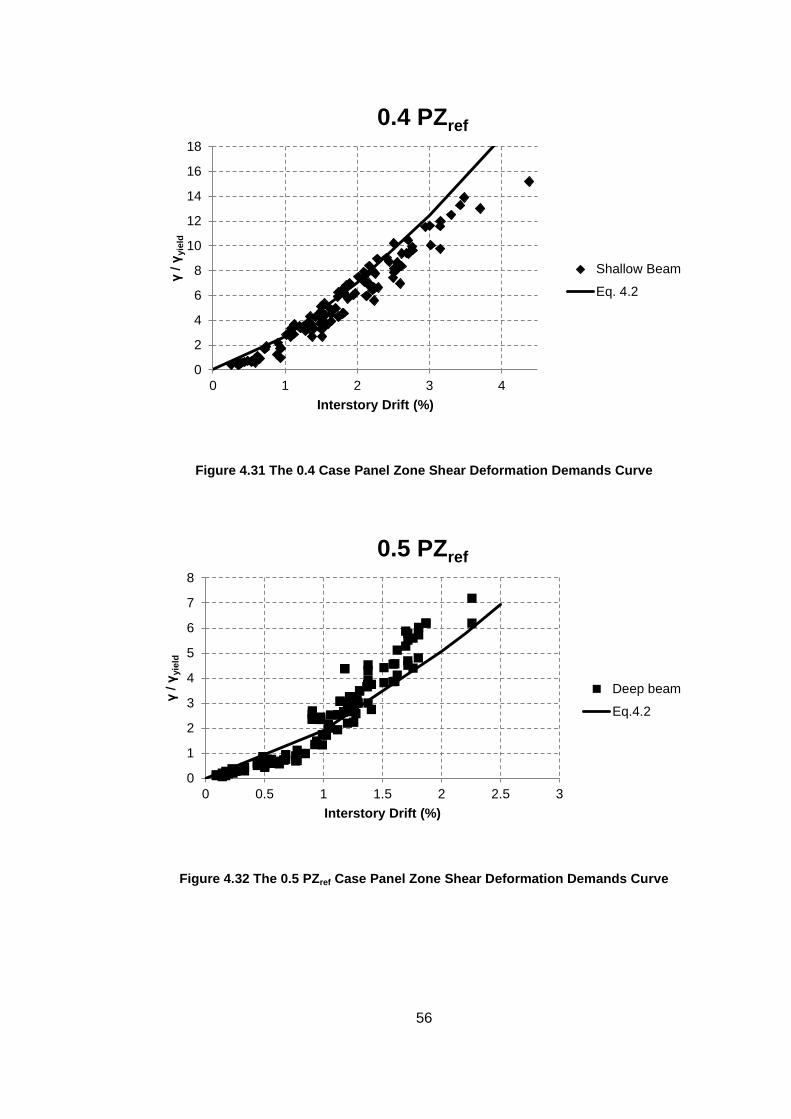
56
Figure 4.31 The 0.4 Case Panel Zone Shear Deformation Demands Curve
Figure 4.32 The 0.5 PZref Case Panel Zone Shear Deformation Demands Curve
0
2
4
6
8
10
12
14
16
18
0 1 2 3 4
γ / γ
yie
ld
Interstory Drift (%)
0.4 PZref
Shallow Beam
Eq. 4.2
0
1
2
3
4
5
6
7
8
0 0.5 1 1.5 2 2.5 3
γ / γ
yie
ld
Interstory Drift (%)
0.5 PZref
Deep beam
Eq.4.2
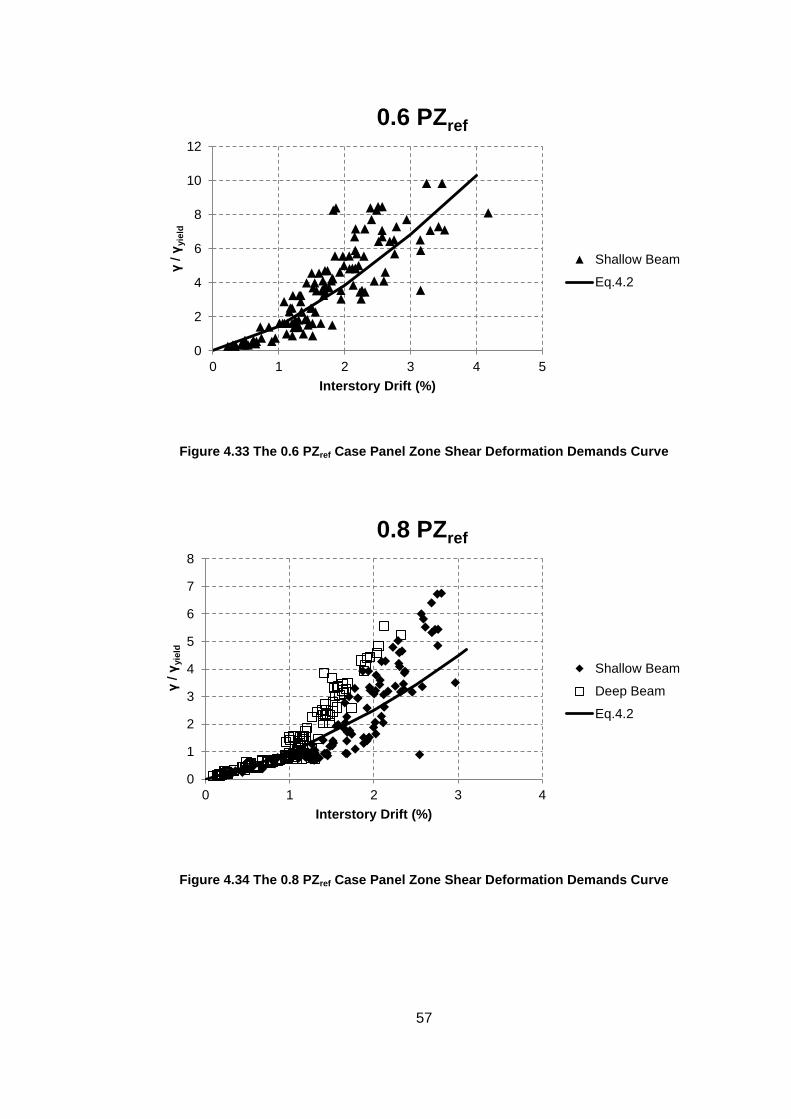
57
Figure 4.33 The 0.6 PZref Case Panel Zone Shear Deformation Demands Curve
Figure 4.34 The 0.8 PZref Case Panel Zone Shear Deformation Demands Curve
0
2
4
6
8
10
12
0 1 2 3 4 5
γ / γ
yie
ld
Interstory Drift (%)
0.6 PZref
Shallow Beam
Eq.4.2
0
1
2
3
4
5
6
7
8
0 1 2 3 4
γ / γ
yie
ld
Interstory Drift (%)
0.8 PZref
Shallow Beam
Deep Beam
Eq.4.2

58
Figure 4.35 The 1.0 PZref Case Panel Zone Shear Deformation Demands Curve
0
0.5
1
1.5
2
2.5
3
0 0.5 1 1.5 2 2.5 3
γ / γ
yie
ld
Interstory Drift (%)
1.0 PZref
Deep beam
Eq.4.2
59
CHAPTER 5
CONCLUSIONS
Panel zone deformation demands in steel moment resisting frames were studied
using numerical analysis. A representative steel frame was analyzed to understand
how the level of axial load on columns, beam depth, and the level of seismicity
influence the deformation demands. The study encompassed different panel zone
thicknesses that were determined using the provisions of different design
specifications. Local shear strain demands at panel zones and the global frame
deformation demands were evaluated in detail. The following can be concluded from
this study:
In this study, the actual column web thickness for the interior panel
zones experienced significant amounts of yielding at both the shallow
beam and the deep beam cases. However, since the requirements
on the exterior panel zones are not excessive, the amount of yielding
was much less compared to interior panel zones. Furthermore, the
reference interior panel zone thickness responds differently to the
shear strain demands at the shallow beam case and the deep beam
case. At the shallow beam case, the interior panel zones remained
elastic, but the interior panel zones showed inelastic behavior at the
deep beam case. Because, the ratio of the beam depths is not same
as the ratio of the shear force demands of these two beam sections.
It must be also taken into consideration that the column properties
except its depth do not participate in the shear force demand
calculations for FEMA 355D, AISC Specification and Eurocode 3
design provisions. This situation results in smaller doubler plate
thickness in deep beam sections compared to the shallow beam
sections.
60
The level of axial load had an influence on the level of lateral
displacements and panel zone shear demands. It is evident from the
results that as the panel zone is designed to be weaker the influence
of axial load is more pronounced. However, when the panel zone
thickness approaches to the thickness level proposed by FEMA 355D
the influence of axial load on the columns become less pronounced.
The shear force demand calculations between Eurocode 3, AISC
Specifications and FEMA 355D are close to each other, but the panel
zone capacity calculations are different as shown in Appendix A.
AISC Specification and Eurocode 3 add the contribution of the
column flanges to the capacity calculations, but FEMA does not. The
panel zones designed according to FEMA 355D recommendations
experienced the less yielding compared with the ones designed
according to AISC Specification and Eurocode 3. Castro J.M., et al.
(2008) also claimed that panel zone design recommendations of
AISC and Eurocode lead to weak panel zone. It is recommended that
at the high seismic zones, FEMA 355D provisions should be used for
the design of panel zones of steel moment resisting frames.
Panel zone deformation demands are quantified as a part of this
study and these demands are represented by simple mathematical
relationships that depend on the panel zone thickness and interstory
drift ratio. The analysis results revealed that panel zones designed
according to the FEMA 355D recommendations displayed elastic
behavior. On the other hand, panel zones designed according to the
AISC and Eurocode specifications showed inelastic behavior. The
level of inelasticity is dependent on the level of lateral drift. In general
panel zones designed according to AISC Specification experienced
5-6 times the yield shear strain at the interstory drifts of about 2
percent. While this level of inelasticity may be acceptable according
to the study of Krawinkler et al. (1971), it may lead to premature
failure of some type of beam-column connections. To avoid inelastic
behavior, the recommendations of FEMA 355D can be followed.
While some inelastic action takes place in the panel zones that are
sized according to AISC Specification, the global force and

61
displacement demands for frames with weak and strong panel zones
are similar.
This study is limited to the design space developed by the methods explained in
Chapter 2. Future research should consider the different connection types of panel
zones. The reduced beam sections should also be studied in the future.
62
REFERENCES
American Institute of Steel Construction (AISC), Seismic provisions for structural
steel buildings, American Institute of Steel Construction, Chicago, 2005.
American Institute of Steel Construction (AISC) , Specification for Structural Steel
Buildings (ANSI/AISC 360-10), American Institute of Steel Construction, Chicago,
2010.
ANSYS. Version 10.0 on-line user’s manual, 2005.
Bertero, V., Inelastic behavior of beam-to-column subassemblages under repeated
loading, Earthquake Engineering Research Center, Report no: 68-2, California,
1968
Brandonisio, G., De Luca, A., Mele, E., Shear instability of panel zone in beam-to-
columns connections, Journal of Constructional Steel Research Vol. 67, pp. 891-
903, 2011
Brandonisio, G., De Luca, A., Mele, E., Shear strength of panel zone in beam-to-
columns connections, Journal of Constructional Steel Research Vol. 71, pp. 129-
142, 2012
Castro, J.M., Davila-Arbona,F.J., Elghazouli, A.Y., Seismic desing approaches for
panel zones in steel moment frames., Journal of Earthquake Engineering, Vol.12,
No. SUPPL. 1, pp. 34-51, 2008.
EN, EN 1998–1–3, Eurocode 8: Design provisions for earthquake resistance of
structures, Part 1–3: General rules – Specific rules for various materials and
elements, European Committee for Standardization, CEN, Brussels, 1995.

63
EN, EN 1993–1–8, Eurocode 3: Design of steel structures - Part 1.8: Design of
joints, European Committee for Standardization, Brussels, CEN, 2005
El-Tawil, S., Vidarsson, E., Mikesell, T., and Kunnath, S. K., Inelastic behavior and
design of steel panel zones, J. Struct. Eng., Vol. 125(12), pp. 183–193, 1999.
FEMA 355D, State of the Art Report on Connection Performance, prepared by the
SAC Joint Venture for the Federal Emergency Management Agency, Washington,
DC, 2000.
Hsiao, Kent J., Schultz, W., Peterson, T., Vaicik, S., Computation of story drifts
considering panel zone deformations for multistory steel moment frames with
welded flange plate connections, Struct. Design Tall Spec. Build. 17: 419-443, 2007
Kim, Kee D., Engelhardt, Michael D., Monotonic and cyclic loading models for panel
zones in steel moment frames, Journal of Constructional Steel Research, Vol. 58,
No. 5-8: pp. 605-635, 2002.
Krawinkler, H., Inelastic behavior of steel beam-to-column subassemblages,
Engineering Research Center, University of California, California, 1971.
Krawinkler, H., Shear in Beam-Column Joints in Seismic Design of Steel Frames,
AISC, Engineering Journal, Vol. 15, No. 3, pp. 82-91, 1978.
Tsai, K., Popov, Egor P., Seismic panel zone design effect on elastic story drift in
steel frames, Journal of Structural Engineering Vol. 116, No. 12, pp. 3285-3301,
New York, 1990.
Tsai, K., Wu, S., Popov, Egor P., Experimental performance of seismic steel beam-
column moment joints, Journal of Structural Engineering, pp. 925-931, New York,
1995.

64
APPENDICES
APPENDIX A : Panel Zone Shear Demand and Capacity Calculations
1) Panel zone design calculations for the shallow beam case are as follows:
According to AISC LRFD Design:
∑
∑ (
)
Where Mpbeam = beam plastic moment capacity (kNm), db = beam depth (m),
h = Story height (m)
(
)
Required panel zone thickness:
(
)
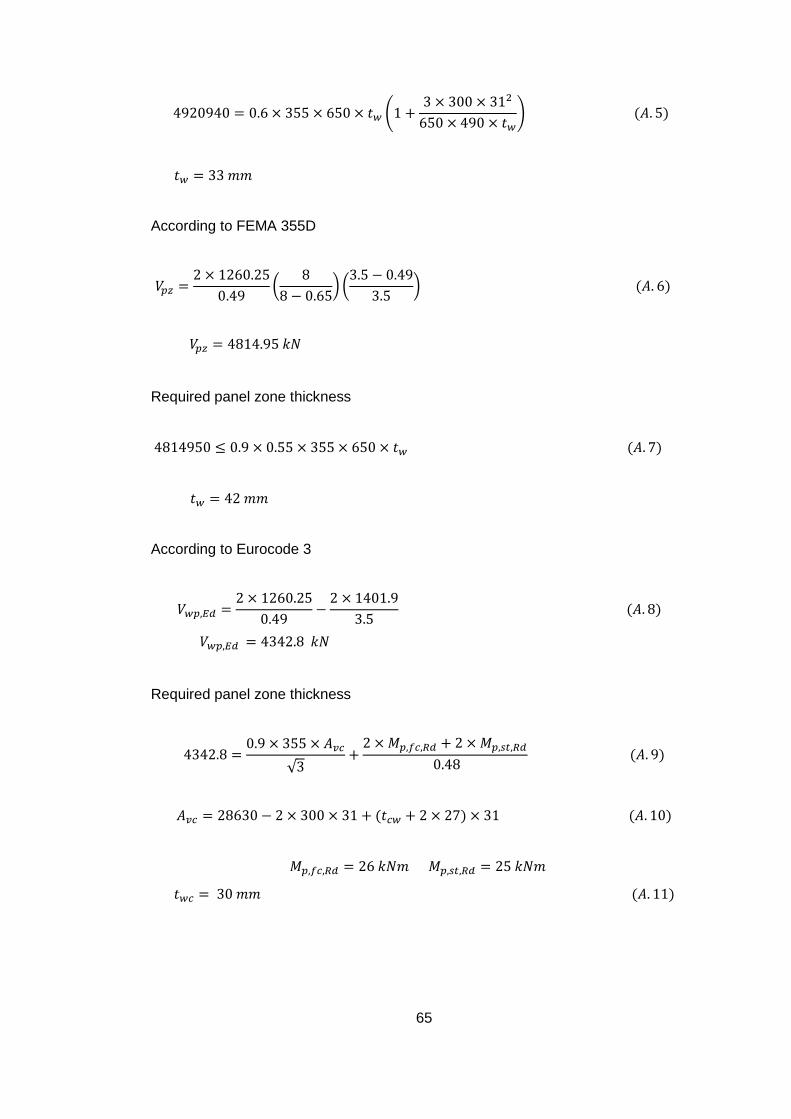
65
(
)
According to FEMA 355D
(
) (
)
Required panel zone thickness
According to Eurocode 3
Required panel zone thickness
√

66
2) Panel zone design calculations for the deep beam case are as follows:
According to AISC LRFD Design:
(
)
Required panel zone thickness:
(
)
According to FEMA 355D
(
) (
)
Required panel zone thickness
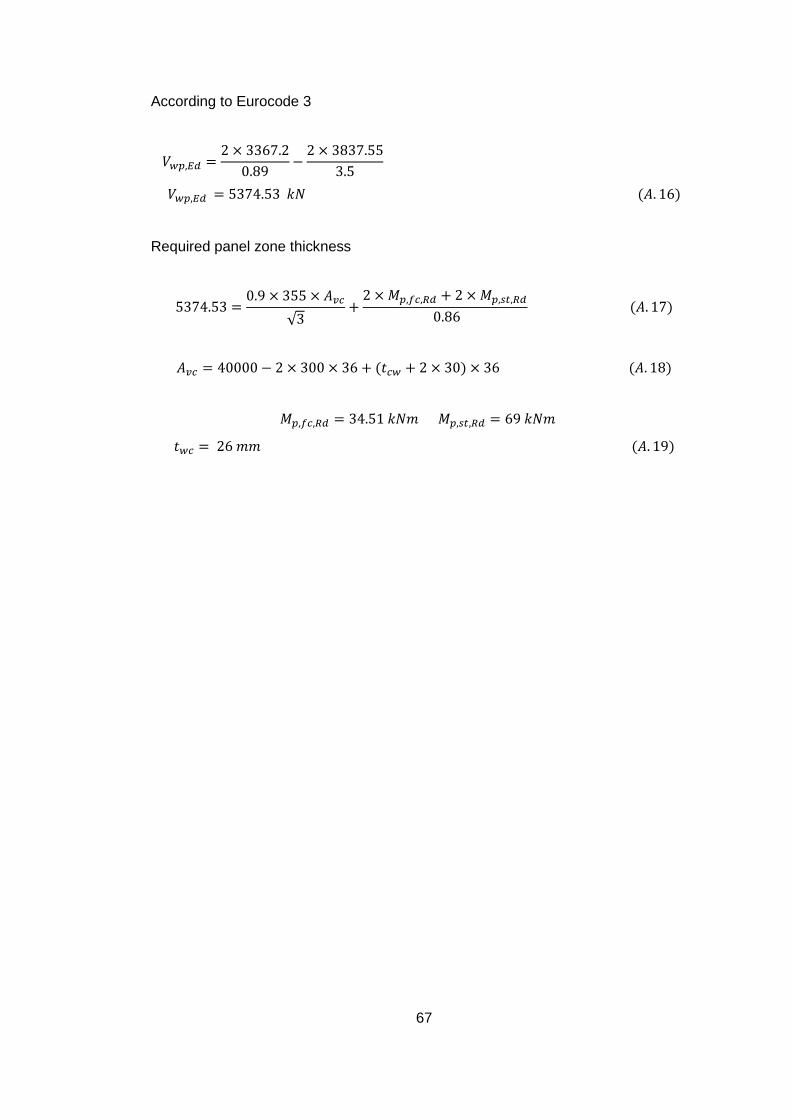
67
According to Eurocode 3
Required panel zone thickness
√
Top Related