


Languages
Pages
Legal


Industry Position on the RIA Failure Limit
Robert MontgomeryANATECH Corp.
NRC – Industry Workshop RIA Criteria
October 16, 2007
Washington, DC

2© 2006 Electric Power Research Institute, Inc. All rights reserved.
Discussion Topics
•Summary of Interim Failure Criteria• Industry methodology to adjust experimental data
•Data adjustment approaches– Pulse width effects for BWRs– Temperature Scaling of NSRR tests– MOX effects
•Summary

3© 2006 Electric Power Research Institute, Inc. All rights reserved.
NRR Interim RIA Failure Criteria:
• Fuel Cladding Failure Criteria– Enthalpy thresholds defined for both PCMI and post-DNB failure
modes
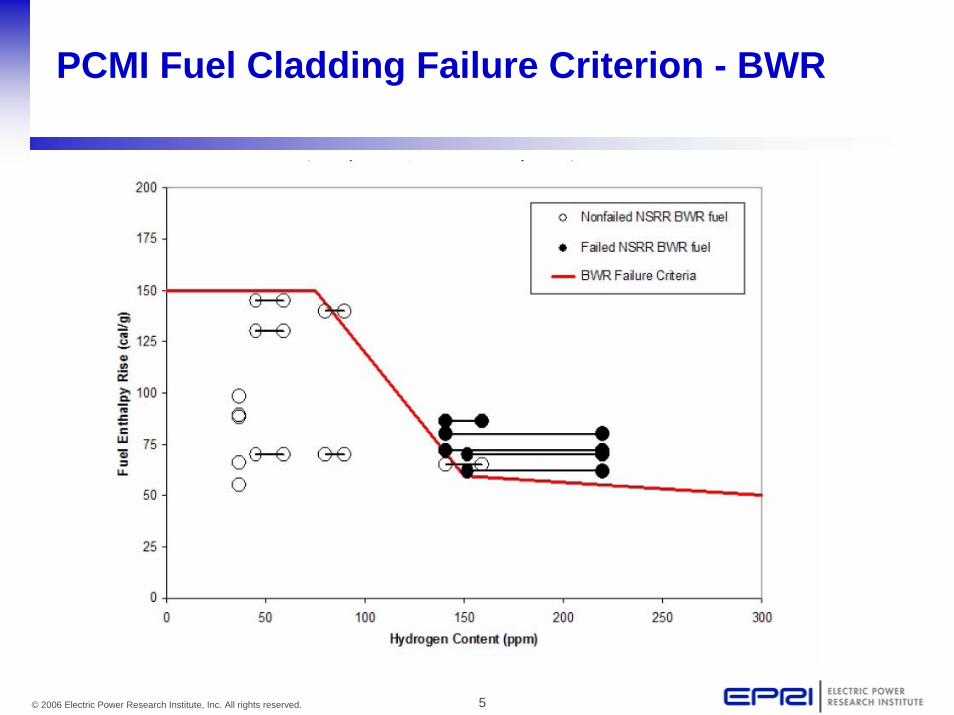
• Pellet-Cladding Mechanical Interaction (PCMI) Failure– Threshold on prompt fuel enthalpy rise (ΔH) – Function of corrosion layer thickness (PWRs) or hydrogen content
(BWRs)
• High temperature failure– Threshold on peak enthalpy as a function of rod pressure in
HZP/HCP cases (170 cal/gm→150 cal/gm)– DNBR/CPRR for at-power conditions

4© 2006 Electric Power Research Institute, Inc. All rights reserved.
PCMI Fuel Cladding Failure Criterion - PWR
5© 2006 Electric Power Research Institute, Inc. All rights reserved.
PCMI Fuel Cladding Failure Criterion - BWR
6© 2006 Electric Power Research Institute, Inc. All rights reserved.
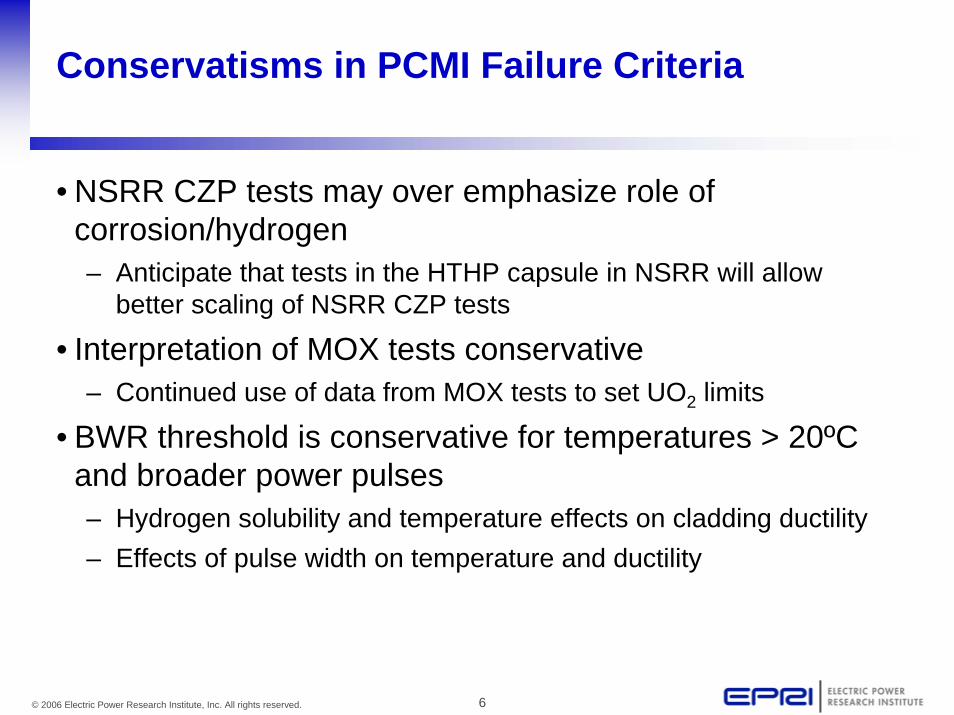
Conservatisms in PCMI Failure Criteria
• NSRR CZP tests may over emphasize role of corrosion/hydrogen– Anticipate that tests in the HTHP capsule in NSRR will allow
better scaling of NSRR CZP tests
• Interpretation of MOX tests conservative– Continued use of data from MOX tests to set UO2 limits
• BWR threshold is conservative for temperatures > 20ºC and broader power pulses– Hydrogen solubility and temperature effects on cladding ductility– Effects of pulse width on temperature and ductility
7© 2006 Electric Power Research Institute, Inc. All rights reserved.
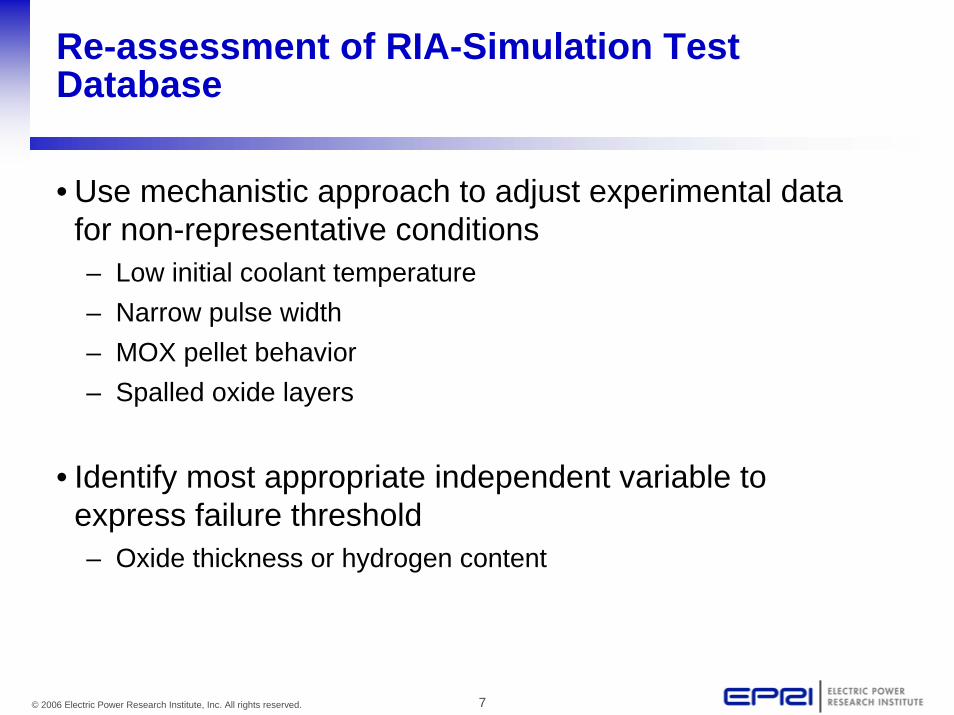
Re-assessment of RIA-Simulation Test Database
• Use mechanistic approach to adjust experimental data for non-representative conditions– Low initial coolant temperature– Narrow pulse width– MOX pellet behavior– Spalled oxide layers
• Identify most appropriate independent variable to express failure threshold– Oxide thickness or hydrogen content

8© 2006 Electric Power Research Institute, Inc. All rights reserved.
Methodology to Adjust RIA Experimental Data
• Validated analytical model that represents fundamental thermal and mechanical behavior of fuel rod under rapid heating– Transient heat generation, storage, and conduction in pellet, gap,
and cladding– Thermal expansion of pellet and cladding– Pellet-cladding mechanical interaction– Pellet and cladding elastic and plastic deformation
• Parameter/method to assess cladding failure– Function of cladding condition (fluence, temperature, hydrogen
content and morphology, etc.)– Compatible with failure mechanism observed

9© 2006 Electric Power Research Institute, Inc. All rights reserved.
FALCON-SCANAIR (and FRAPTRAN) Comparison
0
10
20
30
40
50
60
70
0 10 20 30 40 50 60 70SED - SCANAIR (MJ/m3)
SE
D -
FALC
ON
(MJ/
m3)
Unfailed UO2 Rods
Failed UO2 Rods
0.00
1.00
2.00
3.00
4.00
5.00
6.00
7.00
8.00
0.00 1.00 2.00 3.00 4.00 5.00 6.00 7.00 8.00Measured Hoop Strain (%)
Pre
dict
ed H
oop
Stra
in (%
)
CABRI UO2 - Falcon
CABRI UO2 - Scanair
CABRI UO2 - FRAPTRAN
Permanent Hoop Strain
Strain Energy Density
Reasonable agreement between the codesSome differences noted at higher strains

10© 2006 Electric Power Research Institute, Inc. All rights reserved.
Cladding Failure Model
• Cladding performance indicators from mechanical testing– Yield stress or ultimate tensile stress– Uniform or total strain– Critical strain energy density (CSED) or fracture toughness
• Choose CSED to develop failure model– Energy approach can accommodate the multi-axial stress state
failure mode observed in RIA experiments– Put different mechanical test methods on similar basis to
maximize use of irradiated cladding database

11© 2006 Electric Power Research Institute, Inc. All rights reserved.
Stress-Strain Curve Nomenclature
CSED – Area Under the Stress-Strain Curve
σy
σu
σt
εe εe + εue εe + εte
εue εte
True Strain
True Stress

12© 2006 Electric Power Research Institute, Inc. All rights reserved.
CSED Model Develop/Application
• Derived from mechanical property tests on irradiated cladding material– Ring tension, axial tension, and burst tests– Correlated with corrosion thickness or hydrogen content, alloy type and
temperature– Model validated using results from non-failed and failed CABRI and NSRR tests
• Recent focus on burst test results correlated as function of local hydrogen content in fracture region
– Reduces data scatter and separate treatment of spalled/non-spalled oxide thickness samples
– Working to improve temperature dependency
• Mechanical property data overpredicts failure potential for PCMI loading– Difficult to reproduce PCMI conditions in mechanical property tests– Inconsistencies in loading conditions, frictional effects, and active gauge section

13© 2006 Electric Power Research Institute, Inc. All rights reserved.
Original CSED Database and Model
Oxide/Cladding Thickness Ratio
0.00 0.05 0.10 0.15 0.20 0.25
Crit
ical
Stra
in E
nerg
y D
ensi
ty, M
Pa
0
10
20
30
40
50
60 Ring Tension 280 - 400 C Burst 300 - 350 C Best Fit to Non-SpalledBest Fit to Spalled
Note: Solid symbols are spalled data
Data scatter caused variations in test and material conditions
Oxide/Cladding Thickness Ratio
0.00 0.05 0.10 0.15 0.20 0.25
Crit
ical
Stra
in E
nerg
y D
ensi
ty (M
J/m
3 )0
2
4
6
8
10
12
14
16
18Temperature < 150ºC

14© 2006 Electric Power Research Institute, Inc. All rights reserved.
Validation of Best-Fit CSED/SED Approach
CSED/SED Methodology Able to Separate Failed and Non-Failed Tests
O xide /C ladd ing T h ick ness R a tio (-)
0 .00 0 .05 0 .10 0 .15 0 .20 0 .25 0 .30
Stra
in E
nerg
y D
ensi
ty (M
J/m
3 )
0
5
10
15
20
25
30
35
40
45
N on-S pa lled C S E D M ode lS pa lled C ladd ing C S E D M ode l
R E P N a-2
R E P N a-3R E P N a -5
C IP 0 -2R E P N a -4R E P N a -10 R E P N a-8
C IP 0 -1
Spalled Rods
CABRI Test Rods (T > 280°C)
Solid symbol - test rods with cladding failure
HBO 2
HBO 1
HBO 4
HBO 5
HBO 3 HBO 7HBO 6
TK 2
TK 7
TK 5TK 4
TK 3
TK 6TK 1
0
5
10
15
20
25
30
35
0.00 0.02 0.04 0.06 0.08 0.10Oxide/Cladding Thickness Ratio
SE
D a
t Fai
lure
of A
fter P
ulse
(MJ/
m3)
Best Fit Non-Spalled CSED Model (T < 150°C)
NSRR-PWR Test Rods (T < 150°C)

15© 2006 Electric Power Research Institute, Inc. All rights reserved.
Cladding Failure Model – PWR
0 200 400 600 800 1000 1200 1400 1600 1800 20000
5
10
15
20
25
30
35
40
Burst Tests
Best-Fit to Burst DataSpalled
Local Hydrogen Content (ppm)
CSE
D (M
J/m
3 )Burst Tests from Zr-4 Cladding
TE < 3%300-350ºC
16© 2006 Electric Power Research Institute, Inc. All rights reserved.
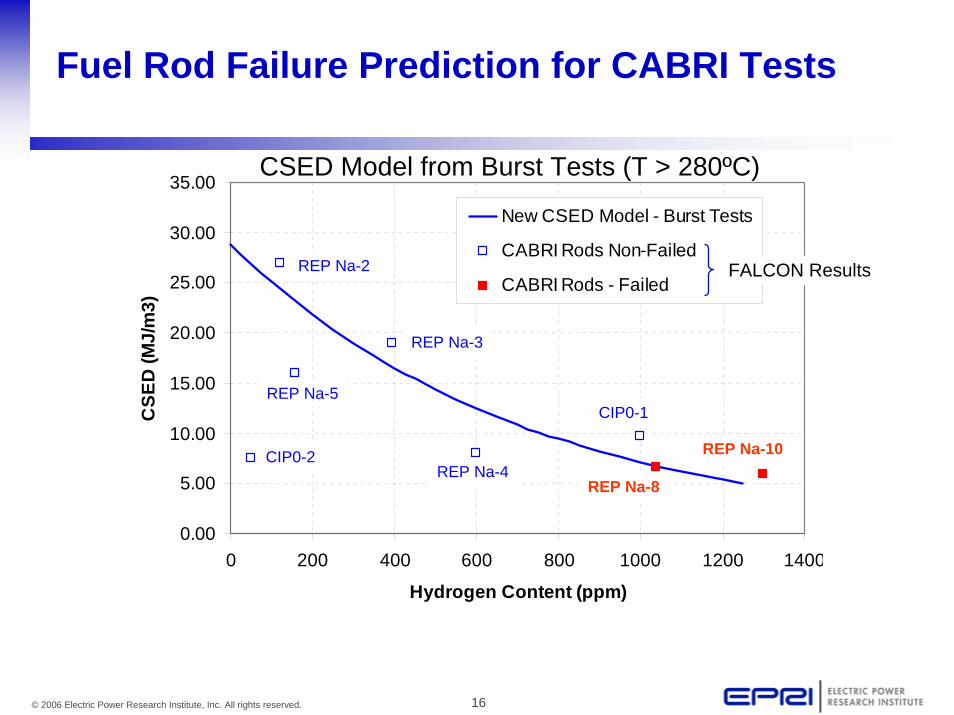
0.00
5.00
10.00
15.00
20.00
25.00
30.00
35.00
0 200 400 600 800 1000 1200 1400
Hydrogen Content (ppm)
CSE
D (M
J/m
3)
New CSED Model - Burst Tests
CABRI Rods Non-Failed
CABRI Rods - Failed
Fuel Rod Failure Prediction for CABRI Tests
REP Na-2
REP Na-3
REP Na-5
CIP0-2REP Na-4
CIP0-1
REP Na-8
REP Na-10
CSED Model from Burst Tests (T > 280ºC)
FALCON Results
17© 2006 Electric Power Research Institute, Inc. All rights reserved.
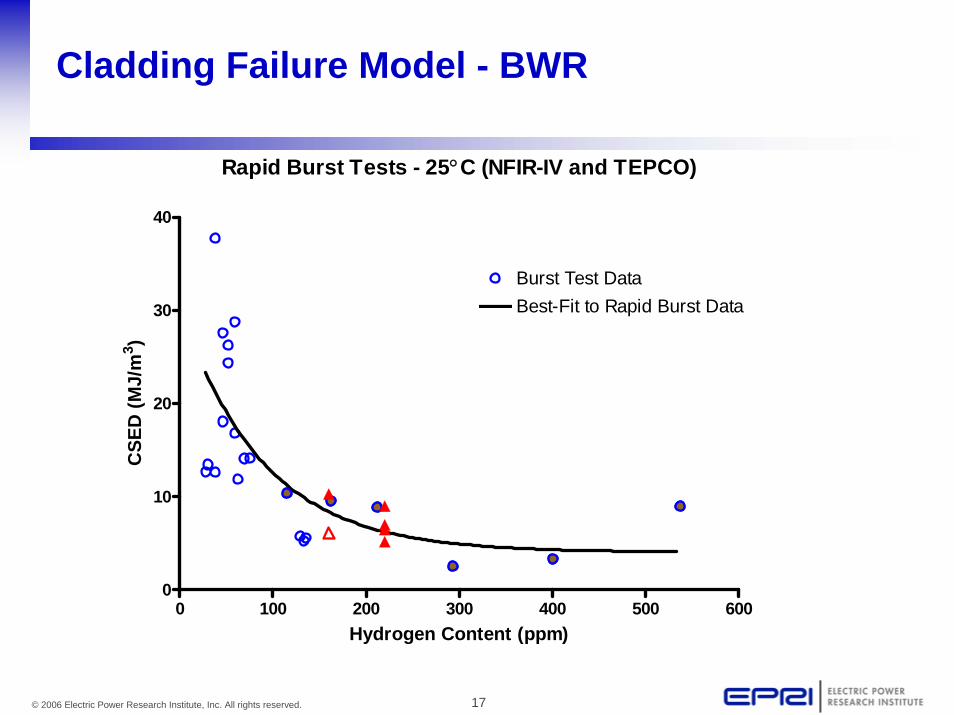
Cladding Failure Model - BWR
Rapid Burst Tests - 25°C (NFIR-IV and TEPCO)
0 100 200 300 400 500 6000
10
20
30
40
Burst Test DataBest-Fit to Rapid Burst Data
Hydrogen Content (ppm)
CSE
D (M
J/m
3 )
18© 2006 Electric Power Research Institute, Inc. All rights reserved.
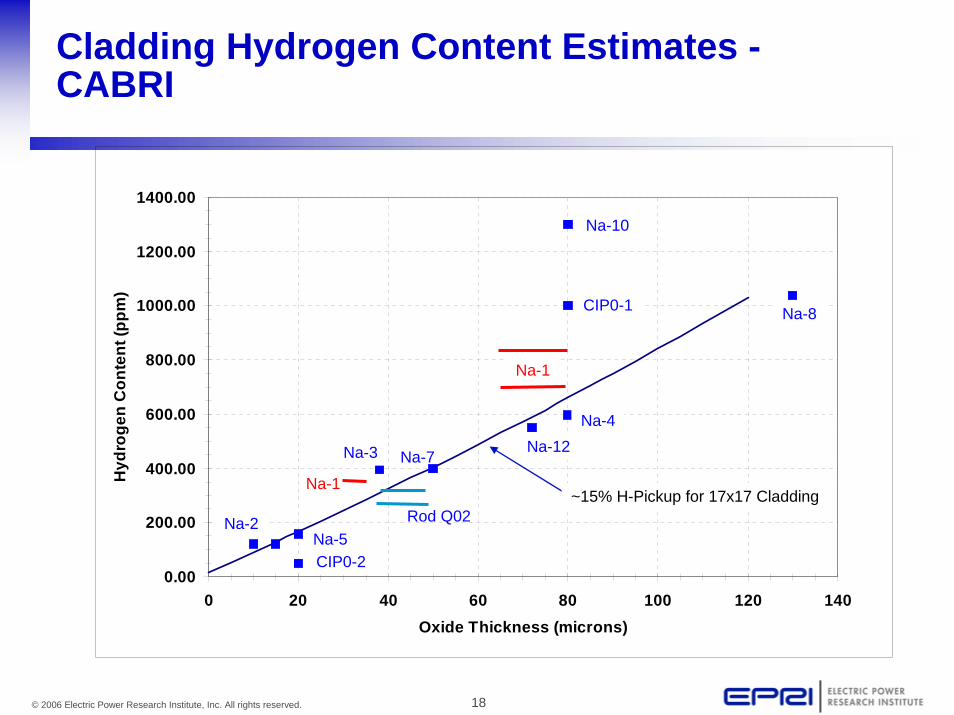
0.00
200.00
400.00
600.00
800.00
1000.00
1200.00
1400.00
0 20 40 60 80 100 120 140Oxide Thickness (microns)
Hyd
roge
n C
onte
nt (p
pm)
Cladding Hydrogen Content Estimates -CABRI
Na-2Na-5CIP0-2
Na-4
~15% H-Pickup for 17x17 Cladding
Na-3
Na-8
Na-10
CIP0-1
Na-7 Na-12
Na-1
Na-1
Rod Q02
19© 2006 Electric Power Research Institute, Inc. All rights reserved.
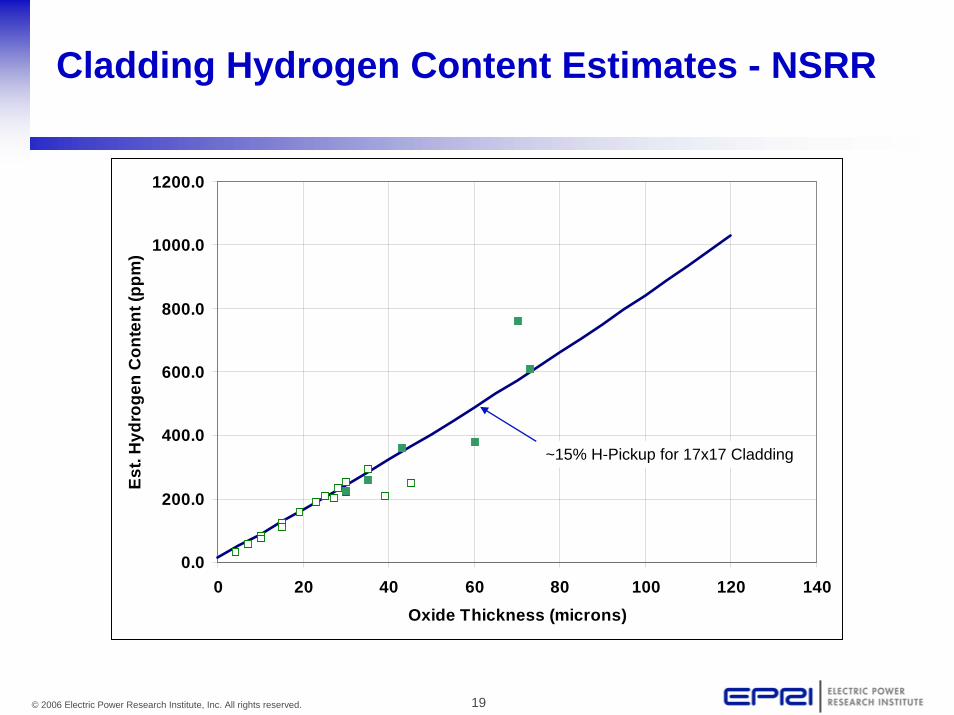
0.0
200.0
400.0
600.0
800.0
1000.0
1200.0
0 20 40 60 80 100 120 140Oxide Thickness (microns)
Est.
Hyd
roge
n C
onte
nt (p
pm)
Cladding Hydrogen Content Estimates - NSRR
~15% H-Pickup for 17x17 Cladding

20© 2006 Electric Power Research Institute, Inc. All rights reserved.
0
20
40
60
80
100
120
140
160
180
200
0 200 400 600 800 1000 1200 1400Estimated Test Rod Hydrogen Content (ppm)
Fuel
Ent
halp
y R
ise
(cal
/gm
)
CABRI UO2 Non-FailedCABRI UO2 - FailedCABRI MOX Non-FailedCABRI MOX FailedNSRR - Non-FailedNSRR FailedNSRR MOX Failed
PWR RIA Database as Function of Hydrogen

21© 2006 Electric Power Research Institute, Inc. All rights reserved.
Improvement for the Final PCMI Failure Criteria
• Account for the effect of pulse width on BWR failure threshold at CZP conditions
• Improve temperature scaling of the CZP NSRR experiments based on upcoming HTHP capsule results
• Improve MOX scaling using new NSRR tests and CABRI results
• Reformulate PWR PCMI criteria into hydrogen space to address oxide spallation/high hydrogen conditions
• Perform assessment and comparison of analytical methodologies to determine best approach for improved temperature scaling
22© 2006 Electric Power Research Institute, Inc. All rights reserved.
Pulse Width Effects for BWRs

23© 2006 Electric Power Research Institute, Inc. All rights reserved.
BWR-Specific Issues in Control Rod Drop Accident
• Accident can initiate at temperatures well below 280ºC• Power pulse shapes significantly non-gaussian,
especially at low temperature with large fraction of non-prompt energy deposition
• Assessment is required to justify interim BWR threshold or develop new failure threshold for BWR CRDA

24© 2006 Electric Power Research Institute, Inc. All rights reserved.
Ways to Improve the BWR PCMI Failure Criterion
• Interim failure criterion uses lower bound of NSRR tests on BWR rods– Include consideration of pulse width differences (4 ms versus 30
ms) between experiments and postulated rod drop accident
• Overly conservative when combined with most limiting accident analysis– Include heat conduction impact on cladding properties
• Awaiting HZP test in NSRR (LS-2) and CABRI (?)

25© 2006 Electric Power Research Institute, Inc. All rights reserved.
Schematic of BWR CRDA Power PulseLo
g Fu
el R
od P
ower
Time
Prompt Pulse Delayed Pulse
Pulse Width
DepositionEnergyTotalDepositionEnergyomptPrFP =
( )K,T,DH,BuFPW coolmax1=
( )K,T,DH,BuFF coolmax2p =
( )213 F,F,tF)t(P =

26© 2006 Electric Power Research Institute, Inc. All rights reserved.
Pulse Width versus Dynamic Control Blade Worth
0.000
0.020
0.040
0.060
0.080
0.100
0.120
0.140
1.10 1.20 1.30 1.40 1.50 1.60 1.70 1.80 1.90 2.00
Dynamic Control Blade Worth ($)
Puls
e W
idth
(sec
)
20C-BOC 20C-EOC 20C-BOC 20C 20C BOCFRG Rpts Literature 20C BOC APEX 20C20C 20C 100C 100C 160C 160C286C 286C 286C
Dynamic blade worth is defined as the peak reactivity during the transient.
Most blades have a dynamic worth less than $1.60.
BWR Pulse Widths versus Control Blade Worth

27© 2006 Electric Power Research Institute, Inc. All rights reserved.
Action Plan to Develop BWR Specific Failure Threshold
• Develop BWR-specific Power Pulse Shapes
• Develop CSED model for BWR Cladding
• Validate BWR-specific CSED model and FALCON
• Construct BWR-Specific Failure Threshold
28© 2006 Electric Power Research Institute, Inc. All rights reserved.
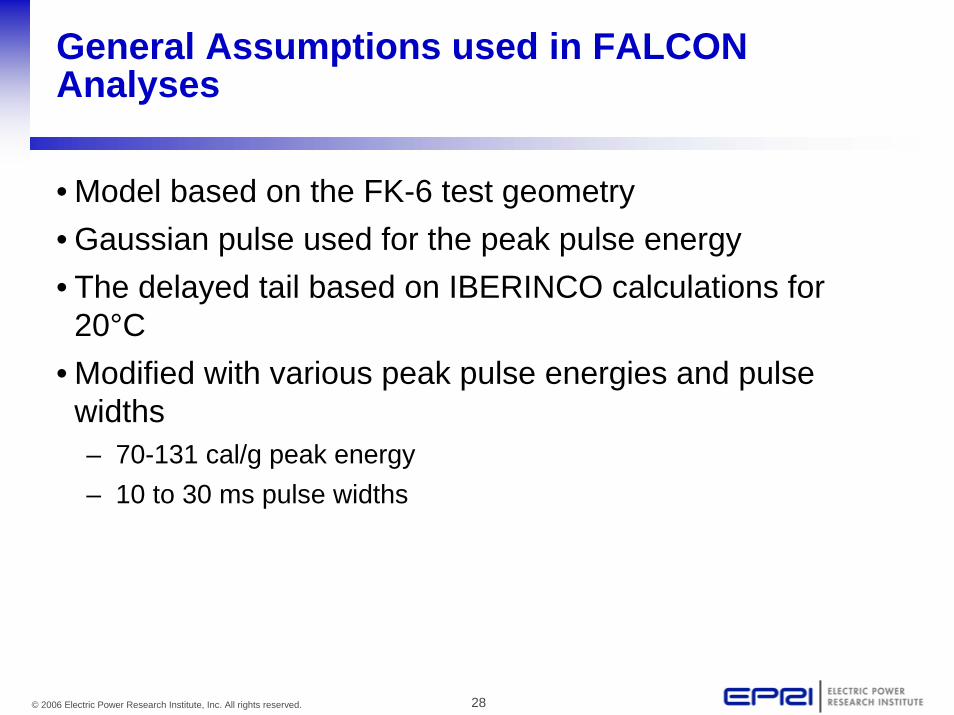
General Assumptions used in FALCON Analyses
• Model based on the FK-6 test geometry• Gaussian pulse used for the peak pulse energy• The delayed tail based on IBERINCO calculations for
20°C • Modified with various peak pulse energies and pulse
widths– 70-131 cal/g peak energy– 10 to 30 ms pulse widths

29© 2006 Electric Power Research Institute, Inc. All rights reserved.
0
20000
40000
60000
80000
100000
120000
0 0.1 0.2 0.3 0.4 0.5 0.6 0.7 0.8 0.9 1
Time (secs)
Line
ar P
ower
(KW
/M) FK-6 (4.3 ms)
131 cal/g @ 30 ms
Example of the Power Pulse Shape used in FALCON Analyses
0
1000
2000
3000
4000
5000
6000
7000
8000
9000
10000
0.3 0.8 1.3 1.8 2.3 2.8Time (secs)
Line
ar P
ower
(KW
/M) FK-6 (4.3 ms)
131 cal/g @ 30 ms
30© 2006 Electric Power Research Institute, Inc. All rights reserved.
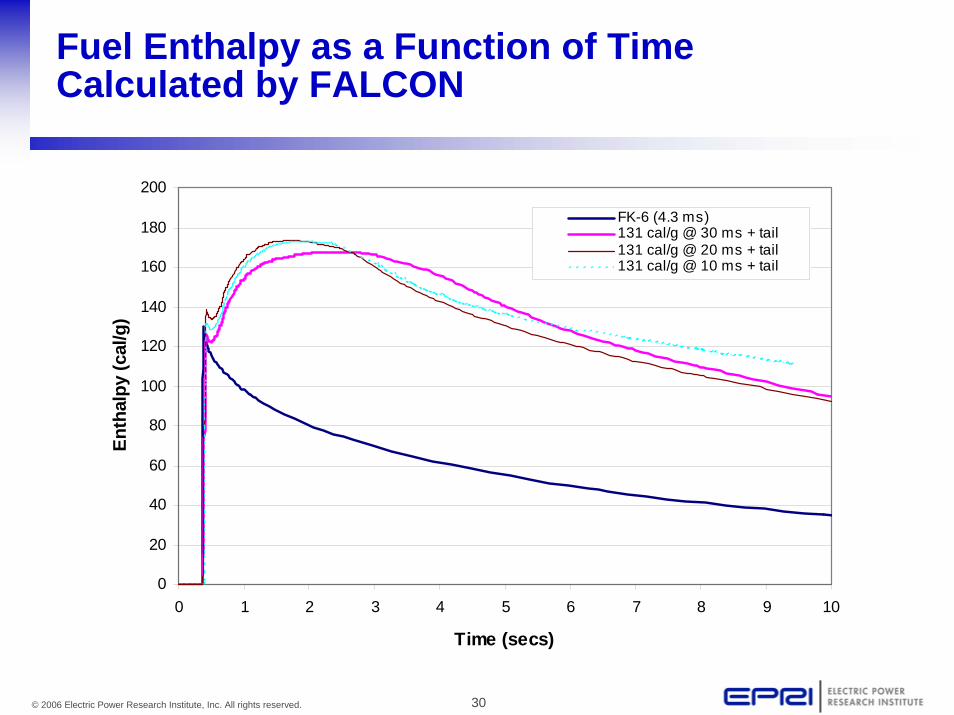
Fuel Enthalpy as a Function of Time Calculated by FALCON
0
20
40
60
80
100
120
140
160
180
200
0 1 2 3 4 5 6 7 8 9 10
Time (secs)
Enth
alpy
(cal
/g)
FK-6 (4.3 ms)131 cal/g @ 30 ms + tail131 cal/g @ 20 ms + tail131 cal/g @ 10 ms + tail

31© 2006 Electric Power Research Institute, Inc. All rights reserved.
FALCON Calculated Strain Energy Density as a Function of Cladding Mid-Wall Temperature
0
5
10
15
20
25
30
20 40 60 80 100 120 140 160 180 200
Cladding Mid-Wall Temperature (C)
Cla
ddin
g St
rain
Ene
rgy
Den
sity
(MJ/
M3)
30 ms pulse + tail
FK-6 (4.3 ms pulse)
20 ms pulse + tail
10 ms pulse + tail
Failure Point
For FK-6
32© 2006 Electric Power Research Institute, Inc. All rights reserved.
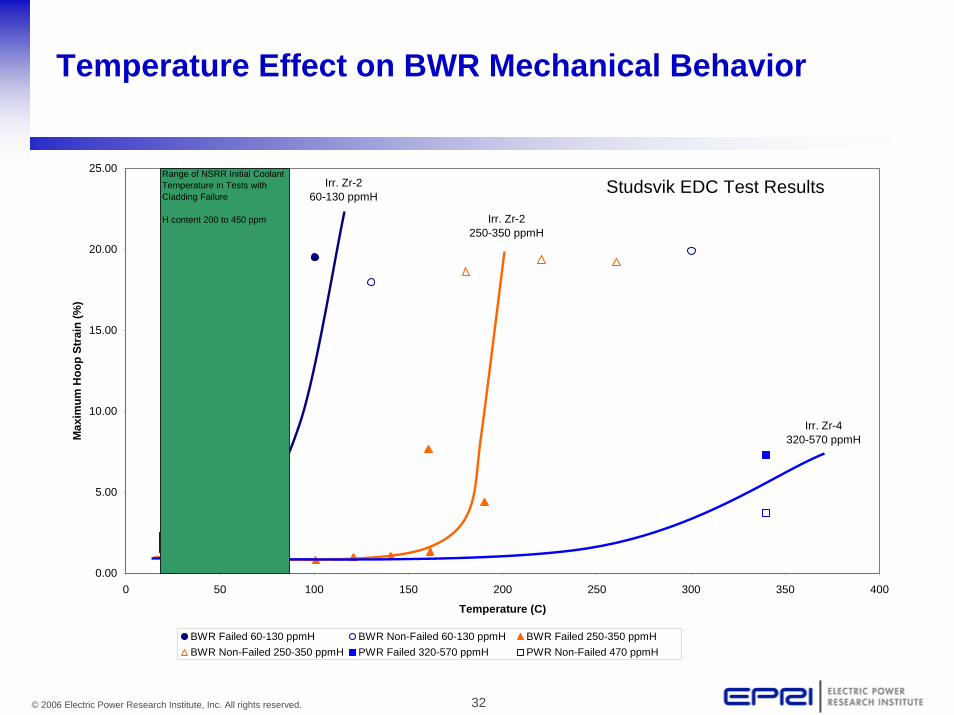
Temperature Effect on BWR Mechanical Behavior
0.00
5.00
10.00
15.00
20.00
25.00
0 50 100 150 200 250 300 350 400
Temperature (C)
Max
imum
Hoo
p St
rain
(%)
BWR Failed 60-130 ppmH BWR Non-Failed 60-130 ppmH BWR Failed 250-350 ppmHBWR Non-Failed 250-350 ppmH PWR Failed 320-570 ppmH PWR Non-Failed 470 ppmH
Irr. Zr-2 60-130 ppmH
Irr. Zr-2 250-350 ppmH
Irr. Zr-4 320-570 ppmH
Studsvik EDC Test ResultsRange of NSRR Initial Coolant Temperature in Tests with Cladding Failure
H content 200 to 450 ppm

33© 2006 Electric Power Research Institute, Inc. All rights reserved.
Temperature Dependent CSED Model for BWRs
Rapid Burst Tests - (NFIR-IV and TEPCO)
0 100 200 300 400 500 6000
10
20
30
40
50
Burst Test Data 25°CBurst Test Data 150°CBurst Test Data 250°CBurst Test Data 300°C
300°C
200°C150°C25°C
Hydrogen Content (ppm)
CSE
D (M
J/m
3 )
[ ]04.4e5.26)T,H(FCSED )(H0113.0(T +⋅∗= ⋅−
FT > 1.0 for H>Hcrit
FT = 1.0 for H<Hcrit
FT = 1.0 for T<25ºC

34© 2006 Electric Power Research Institute, Inc. All rights reserved.
Observations
• FALCON calculations demonstrate improvement in cladding ductility with increased temperature for characteristic BWR power pulse shape
• Potential increase in fuel enthalpy at failure – BWR PCMI hydrogen contents between 75 and 250 ppm
• An Action Plan has been developed for generating a BWR specific failure threshold that includes the characteristic BWR pulse shape

35© 2006 Electric Power Research Institute, Inc. All rights reserved.
Alternative BWR PCMI Failure Criteria –Improved Consideration for NSRR Tests
NSRR Database of BWR rods
0 50 100 150 200 250 300
Fuel
Ent
halp
y R
ise
(cal
/gm
)
200
0
175
150
125
100
75
50
25
Nonfailed NSRR BWR Fuel
Failed NSRR BWR Fuel
BWR Failure Criteria
Hydrogen Content (ppm)
- Pulse Width Adjustment
36© 2006 Electric Power Research Institute, Inc. All rights reserved.
Improved Temperature Scaling

37© 2006 Electric Power Research Institute, Inc. All rights reserved.
Improvement for Final Failure Criteria–Temperature Scaling
• Interim failure criteria use a lower bound of adjusted RIA-simulation test results – Adjustments developed using FRAPTRAN– Adjustments were made assuming no difference exists between:
• Room temperature and hot-zero power cladding ductility
• Newer experimental data and fully qualified analytical methods can improve data adjustments to account for;– Improved cladding ductility with increase in temperature and
hydrogen solubility effects
• Results dependent on the analytical methods used
38© 2006 Electric Power Research Institute, Inc. All rights reserved.
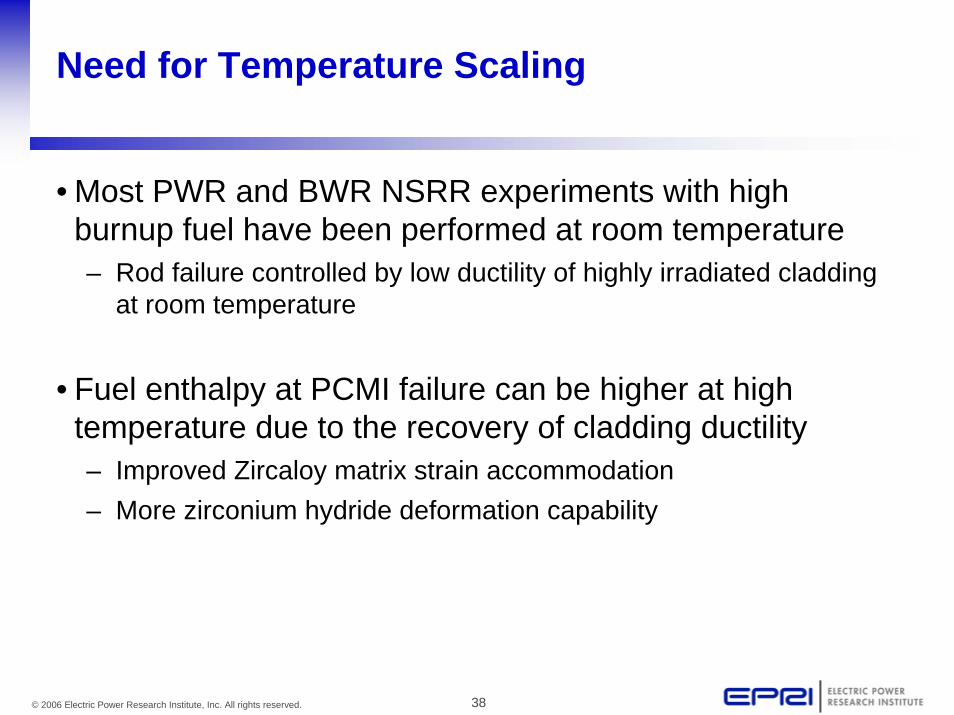
Need for Temperature Scaling
• Most PWR and BWR NSRR experiments with high burnup fuel have been performed at room temperature– Rod failure controlled by low ductility of highly irradiated cladding
at room temperature
• Fuel enthalpy at PCMI failure can be higher at high temperature due to the recovery of cladding ductility– Improved Zircaloy matrix strain accommodation– More zirconium hydride deformation capability
39© 2006 Electric Power Research Institute, Inc. All rights reserved.
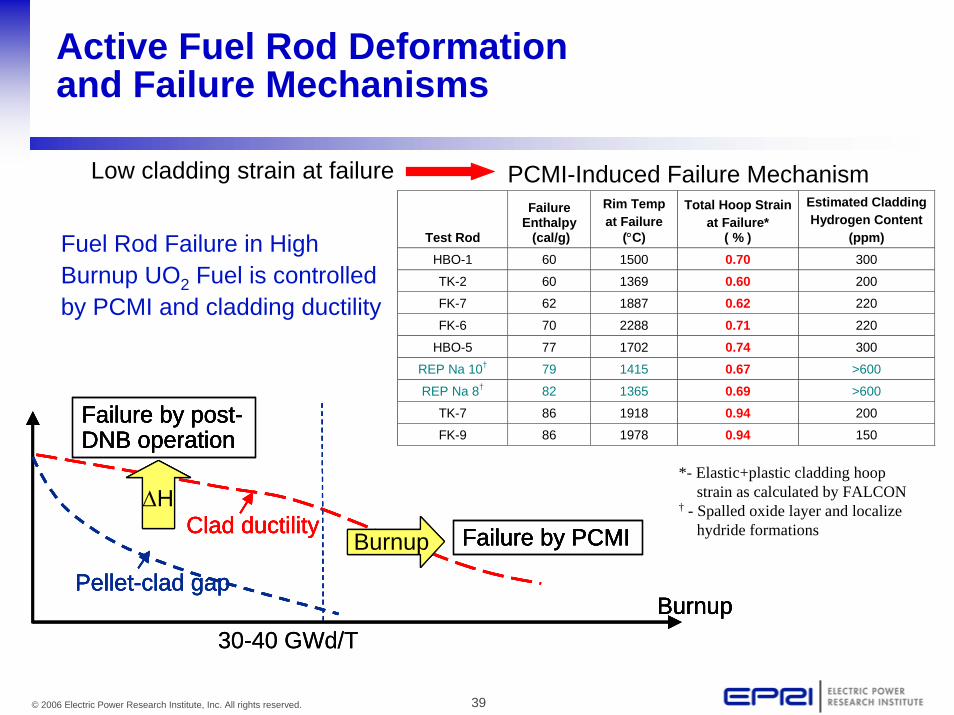
Active Fuel Rod Deformation and Failure Mechanisms
Test Rod
Failure Enthalpy (cal/g)
Rim Temp at Failure
(°C)
Total Hoop Strainat Failure*
( % )
Estimated Cladding Hydrogen Content
(ppm) HBO-1 60 1500 0.70 300
TK-2 60 1369 0.60 200
FK-7 62 1887 0.62 220
FK-6 70 2288 0.71 220
HBO-5 77 1702 0.74 300
REP Na 10† 79 1415 0.67 >600
REP Na 8† 82 1365 0.69 >600
TK-7 86 1918 0.94 200
FK-9 86 1978 0.94 150
*- Elastic+plastic cladding hoop strain as calculated by FALCON
† - Spalled oxide layer and localize hydride formations
Low cladding strain at failure PCMI-Induced Failure Mechanism
Pellet-clad gap
Clad ductility
Burnup
ΔH
Burnup
Failure by post-DNB operation
Failure by PCMI
30-40 GWd/T
Pellet-clad gap
Clad ductility
Burnup
ΔH
Burnup
Failure by post-DNB operation
Failure by PCMI
Pellet-clad gap
Clad ductility
Burnup
ΔH
Burnup
Failure by post-DNB operation
Failure by PCMI
Pellet-clad gap
Clad ductility
Burnup
ΔH
Burnup
Failure by post-DNB operation
Failure by PCMI
30-40 GWd/T
Fuel Rod Failure in High Burnup UO2 Fuel is controlled by PCMI and cladding ductility

40© 2006 Electric Power Research Institute, Inc. All rights reserved.
Temperature Effect on Ductility of Hydrided Cladding
NFIR Burst Tests
0 50 100 150 200 250 300 350 400 4500.0
0.5
1.0
1.5
2.0
2.5
3.0
H = 450 - 930 ppm
H = 430 - 640 ppm
Temperature (C)
Tota
l Pla
stic
Elo
ngat
ion
(%)
Irradiated Zr-4 tubes

41© 2006 Electric Power Research Institute, Inc. All rights reserved.
Temperature Increases Strain to Fracture
Higher temperature has twice the fracture strain
Recrystallized Cladding - 25°C - 300 °CCold-Work Stress-Relieved Cladding - 25°C - 300 °C
300°C Trend Line
25°C Trend Line
Plane-Strain Ring Tests on Unirradiated, Pre-hydrided Cladding
42© 2006 Electric Power Research Institute, Inc. All rights reserved.
Action Plan to Adjust CZP NSRR Tests
• Confirm HZP CSED model using HTHP tests at NSRR– Identify adjustments for 4 ms pulse width– May require detailed modeling to account for small rodlet
geometry– Results expected in 2008
• Use CSED model for HZP conditions to calculate enthalpy at failure for CZP NSRR PWR tests– Develop ΔH adjustment as function of hydrogen content to be
added to CZP NSRR test results

43© 2006 Electric Power Research Institute, Inc. All rights reserved.
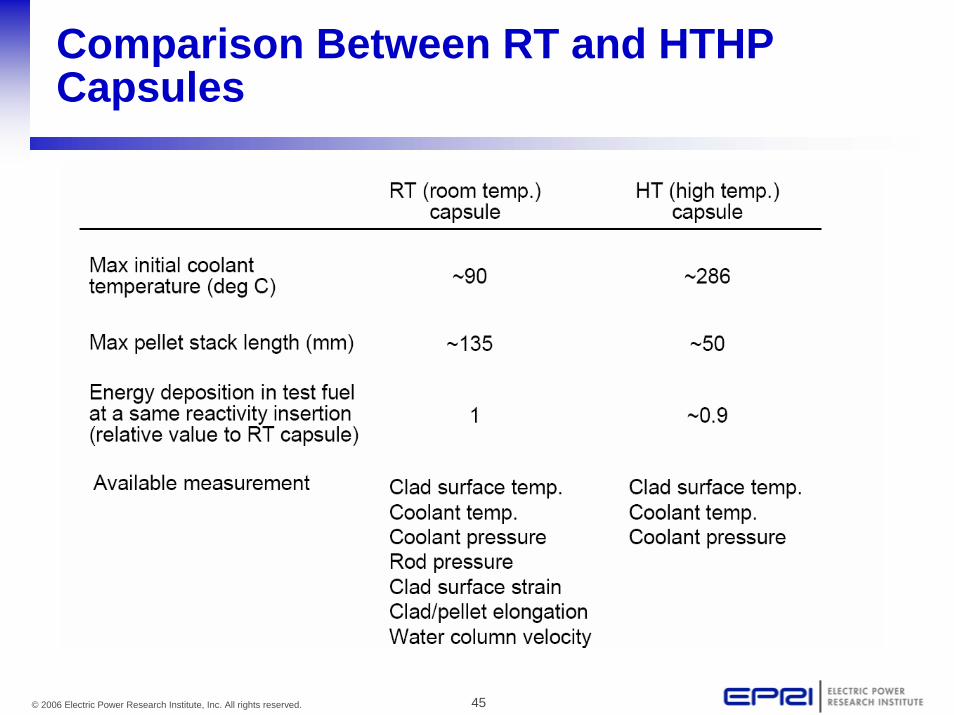
HTHP Capsule Tests
• A new type of NSRR test capsule was developed to confirm the high temperature effect on PCMI failure limit– High Temperature/High Pressure enables tests at LWR
operation / hot startup conditions
• Total of 5 tests are planned in the HTHP capsule– Only one test reported at this time (RH-2)

44© 2006 Electric Power Research Institute, Inc. All rights reserved.
High Temperature / High Pressure Test Capsule
45© 2006 Electric Power Research Institute, Inc. All rights reserved.
Comparison Between RT and HTHP Capsules

46© 2006 Electric Power Research Institute, Inc. All rights reserved.
Planned High Temperature Tests in 2007-2008
Fuel Type, Cladding, BurnupRoom
Temperature Tests*
High Temperature
tests **Corrosion/Hydrogen
PWR-UO2, MDA, 78 GWd/t VA-1 VA-3 ~70 μm / 760 ppm
PWR-UO2, ZIRLO, 79 GWd/t VA-2 VA-4 ~70 μm / 660 ppm
BWR-UO2, Zry-2, 69 GWd/t LS-1 LS-2 ~25 μm / 300 ppm
PWR-MOX, Zry-4, 59 GWd/t BZ-2 BZ-3 ~20 μm / 150 ppm
* The 4 RT tests resulted in PCMI Failure
** Corresponding RT and HTHP Test fuel rods were sampled from an identical fuel segment
4Q 2007
2Q 2008
3Q 2008
1Q 2008
47© 2006 Electric Power Research Institute, Inc. All rights reserved.
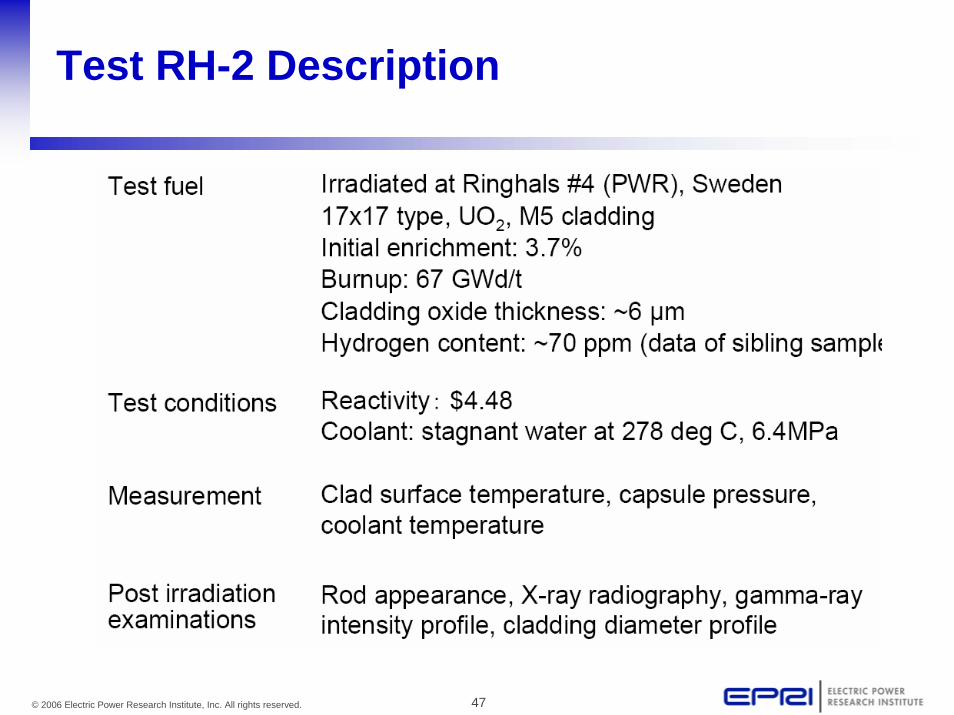
Test RH-2 Description
48© 2006 Electric Power Research Institute, Inc. All rights reserved.
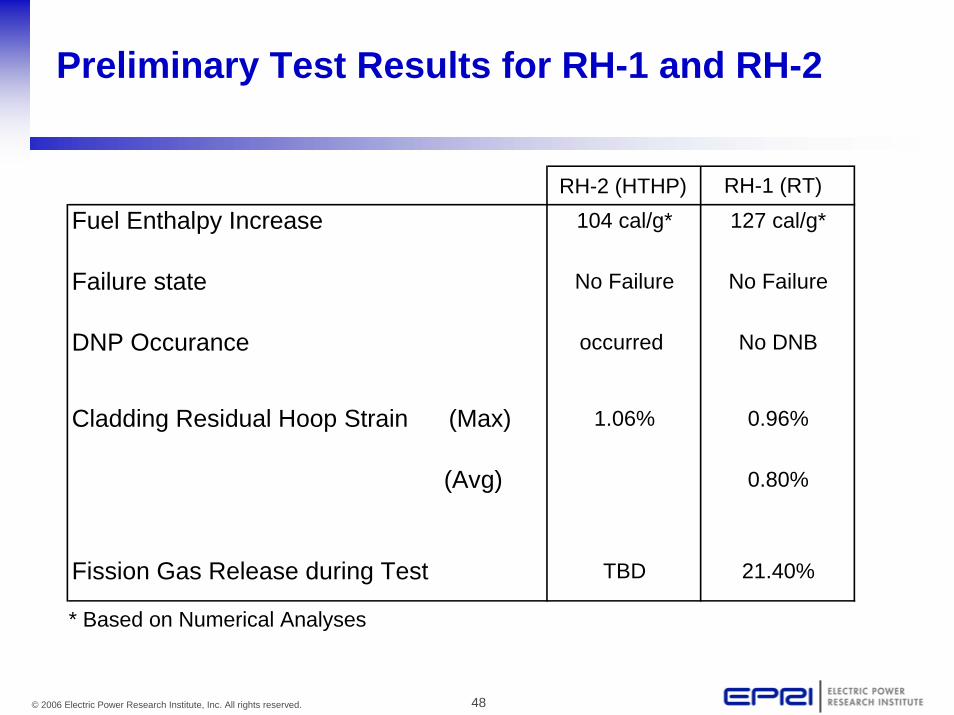
Preliminary Test Results for RH-1 and RH-2
* Based on Numerical Analyses
RH-2 RH-1Fuel Enthalpy Increase 104 cal/g* 127 cal/g*
Failure state No Failure No Failure
DNP Occurance occurred No DNB
Cladding Residual Hoop Strain (Max) 1.06% 0.96%
(Avg) 0.80%
Fission Gas Release during Test TBD 21.40%
RH-2 (HTHP) RH-1 (RT)

49© 2006 Electric Power Research Institute, Inc. All rights reserved.
FALCON Comparisons for RH-2
9.4
9.42
9.44
9.46
9.48
9.5
9.52
9.54
9.56
9.58
9.6
0 20 40 60 80 100 120 140Axial Position (mm)
Cla
d O
uter
Dia
met
er (m
m)
Measured BeforeMeasured AfterFALCON
0
0.2
0.4
0.6
0.8
1
1.2
0 20 40 60 80 100 120 140Axial Position (mm)
Res
idua
l Hoo
p St
rain
(%)
Measured
FALCON

50© 2006 Electric Power Research Institute, Inc. All rights reserved.
FALCON Comparisons for RH-1
9.4
9.42
9.44
9.46
9.48
9.5
9.52
9.54
9.56
9.58
9.6
0 50 100 150 200Axial Position (mm)
Cla
d O
uter
Dia
met
er (m
m)
Measured Before
Measured After
FALCON
0
0.2
0.4
0.6
0.8
1
1.2
0 50 100 150 200
Axial Position (mm)
Res
idua
l Hoo
p St
rain
(%)
Measured
FALCON

51© 2006 Electric Power Research Institute, Inc. All rights reserved.
Effect of Temperature on FALCON Calculated Strain Energy Density
0.0
2.0
4.0
6.0
8.0
10.0
12.0
14.0
16.0
18.0
0 20 40 60 80 100 120 140Enthalpy (cal/g)
SED
(MJ/
m3)
RH-1RH-2

52© 2006 Electric Power Research Institute, Inc. All rights reserved.
Conclusions Based on RH-2 HTHP Capsule Test
• Test RH-2 showed an as-predicted level of cladding residual hoop strain in comparison with the room temperature test RH-1.
• Calculations show improved cladding ductility at higher initial temperatures compared to room temperature tests.– Potential increase in fuel enthalpy at failure – PWR PCMI oxide thickness levels between 25 and 60 μm
• Temperature effect on PCMI failure limit will be confirmed in coming tests.

53© 2006 Electric Power Research Institute, Inc. All rights reserved.
Alternative PWR PCMI Failure Criteria –Improved Consideration for MOX and NSRR Tests
-Temperature adjustment
Temperature Considerations
0.00 0.04 0.08 0.12 0.16 0.20
50
100
150
200
250
300
350
Oxide/Wall Thickness
Adj
uste
d Fu
el E
ntha
lpy
Ris
e (c
al/g
)
BIGRCABRI UO2
IGRNSRRPBFSPERT
CABRI MOX
Filled Symbols – Cladding Failure

54© 2006 Electric Power Research Institute, Inc. All rights reserved.
Discussion of MOX Effects
55© 2006 Electric Power Research Institute, Inc. All rights reserved.
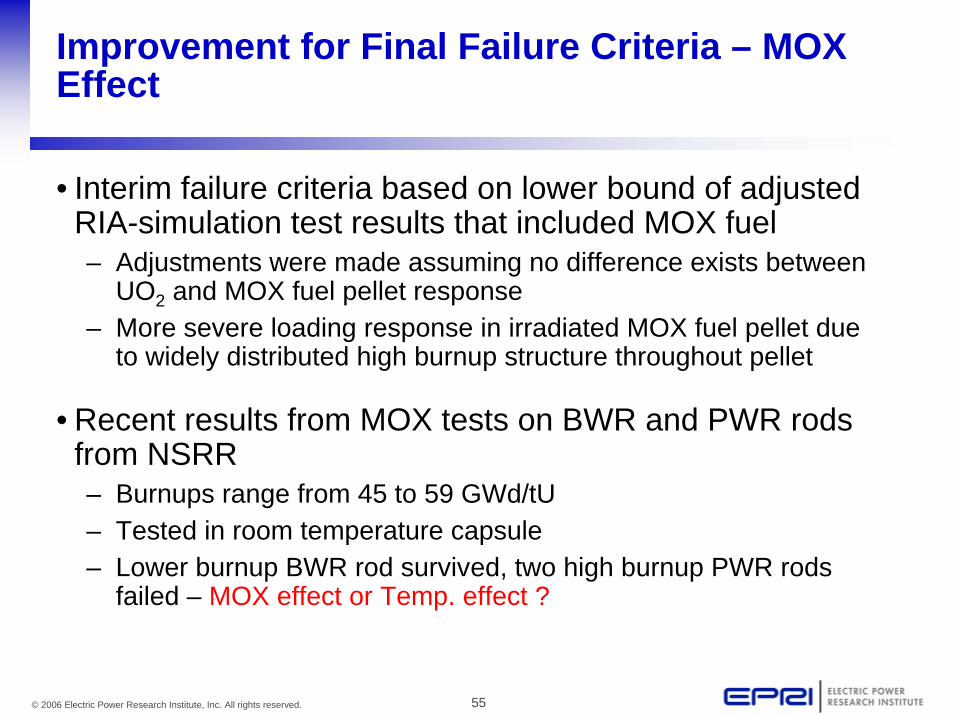
Improvement for Final Failure Criteria – MOX Effect
• Interim failure criteria based on lower bound of adjusted RIA-simulation test results that included MOX fuel – Adjustments were made assuming no difference exists between
UO2 and MOX fuel pellet response– More severe loading response in irradiated MOX fuel pellet due
to widely distributed high burnup structure throughout pellet
• Recent results from MOX tests on BWR and PWR rods from NSRR – Burnups range from 45 to 59 GWd/tU– Tested in room temperature capsule– Lower burnup BWR rod survived, two high burnup PWR rods
failed – MOX effect or Temp. effect ?
56© 2006 Electric Power Research Institute, Inc. All rights reserved.
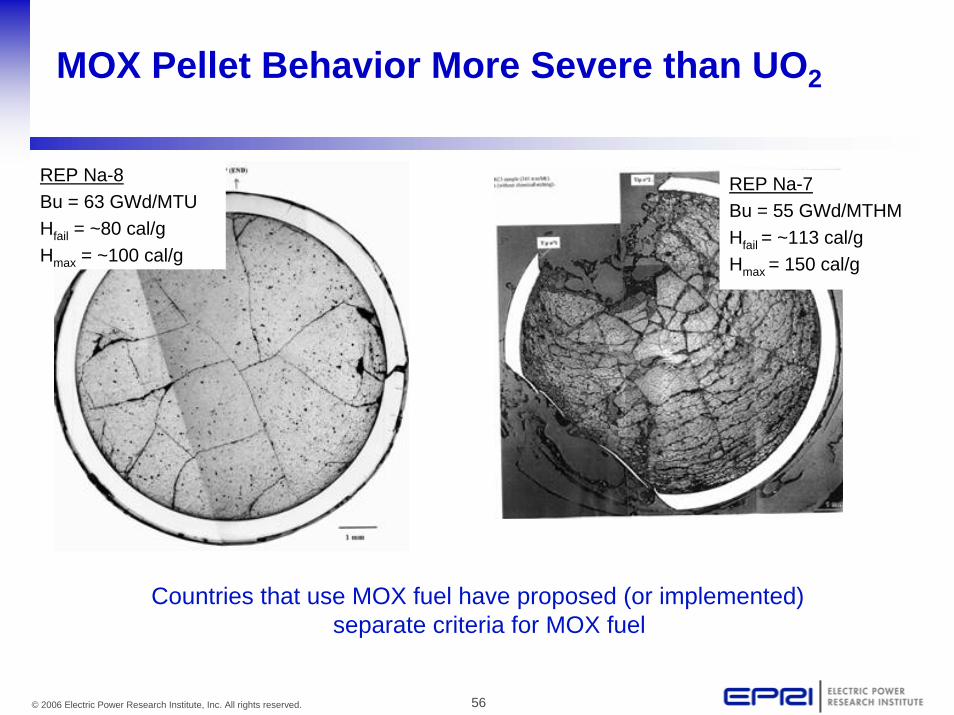
MOX Pellet Behavior More Severe than UO2
REP Na-8Bu = 63 GWd/MTUHfail = ~80 cal/gHmax = ~100 cal/g
REP Na-7Bu = 55 GWd/MTHMHfail = ~113 cal/gHmax = 150 cal/g
Countries that use MOX fuel have proposed (or implemented) separate criteria for MOX fuel

57© 2006 Electric Power Research Institute, Inc. All rights reserved.
MOX Effect on Fuel Rod Expansion
y = 0.026x - 0.5265R2 = 0.9999
y = 0.0118x - 0.2674R2 = 0.9871
0
0.1
0.2
0.3
0.4
0.5
0.6
0.7
0.8
0.9
1
20 25 30 35 40 45 50 55 60 65 70
Test Rod Burnup (GWd/tU)
Dis
plac
ed S
odiu
m V
olum
e (c
m3 )
UO2 Fuel
MOX Fuel
Trend Line - MOX
Trend Line - UO2
Fuel rod volume expansion in MOX fuel 2-3 times larger than UO2 fuel
@ fuel enthalpy = 70 cal/gm

58© 2006 Electric Power Research Institute, Inc. All rights reserved.
MOX Tests DW-1, BZ-1 and BZ-2
First NSRR experiments with MOX fuel irradiated in commercial plants

59© 2006 Electric Power Research Institute, Inc. All rights reserved.
BWR Cladding Deformation UO2 – MOX Comp.
Different ?
Below Burnup for Strong PCMI Effect in FALCON MOX model
45 GWd/tU

60© 2006 Electric Power Research Institute, Inc. All rights reserved.
Fuel Enthalpy at Failure
61© 2006 Electric Power Research Institute, Inc. All rights reserved.
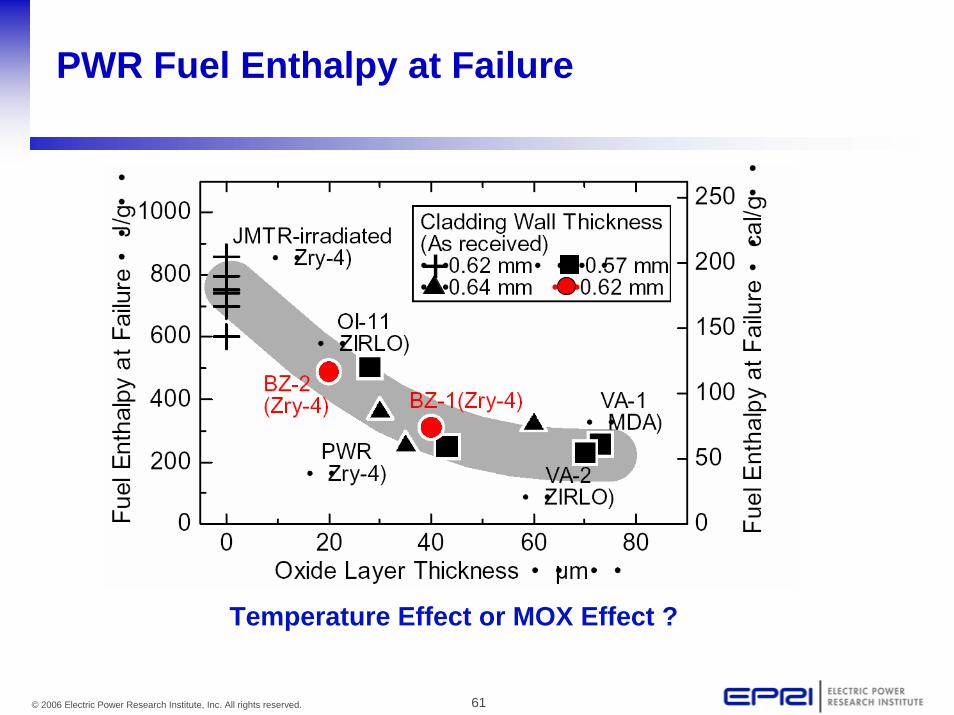
PWR Fuel Enthalpy at Failure
+
Temperature Effect or MOX Effect ?
62© 2006 Electric Power Research Institute, Inc. All rights reserved.
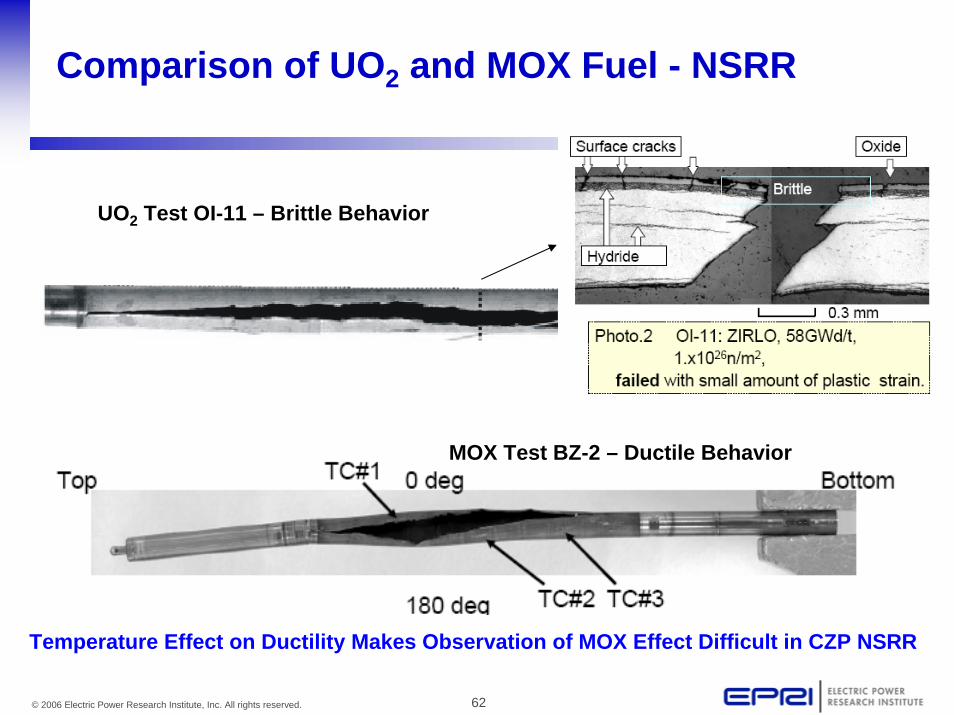
Comparison of UO2 and MOX Fuel - NSRR
UO2 Test OI-11 – Brittle Behavior
MOX Test BZ-2 – Ductile Behavior
Temperature Effect on Ductility Makes Observation of MOX Effect Difficult in CZP NSRR
63© 2006 Electric Power Research Institute, Inc. All rights reserved.
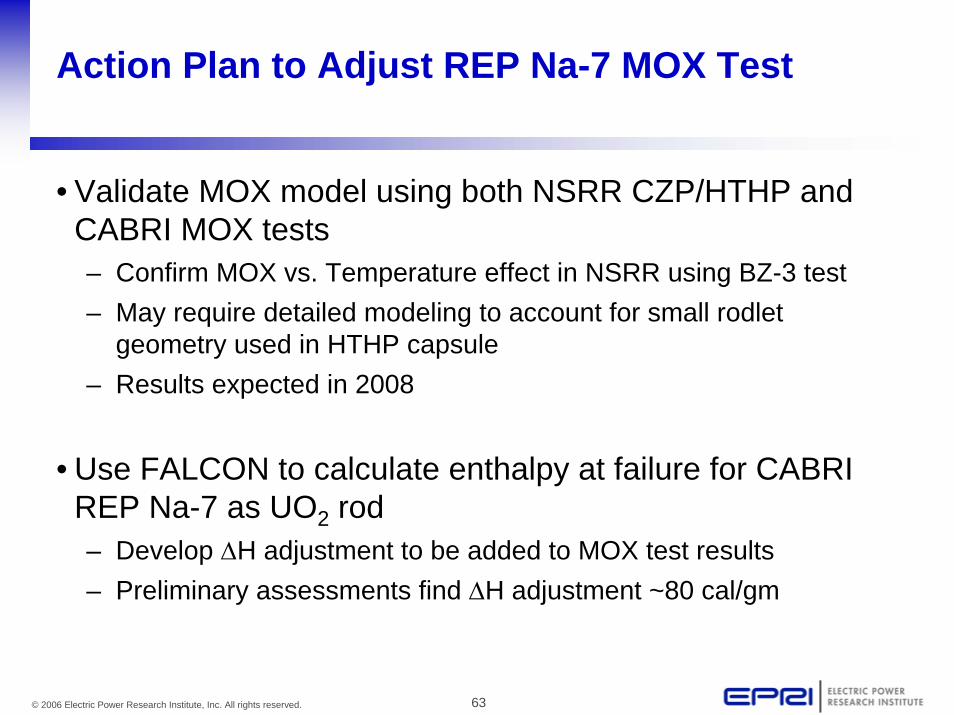
Action Plan to Adjust REP Na-7 MOX Test
• Validate MOX model using both NSRR CZP/HTHP and CABRI MOX tests– Confirm MOX vs. Temperature effect in NSRR using BZ-3 test– May require detailed modeling to account for small rodlet
geometry used in HTHP capsule– Results expected in 2008
• Use FALCON to calculate enthalpy at failure for CABRI REP Na-7 as UO2 rod– Develop ΔH adjustment to be added to MOX test results– Preliminary assessments find ΔH adjustment ~80 cal/gm

64© 2006 Electric Power Research Institute, Inc. All rights reserved.
Summary

65© 2006 Electric Power Research Institute, Inc. All rights reserved.
Areas of Improvement for Final Failure Criteria
• Newer experimental data and fully qualified analytical methods can improve data adjustments to account for;– BWR pulse width effects– Improved cladding ductility with increase in temperature and hydrogen
solubility effects– More severe loading response in irradiated MOX fuel pellet– Improved cladding mechanical response at higher oxide thickness levels
• Perform assessment and comparison of analytical methodologies todetermine best approach for improved temperature scaling
• Reformulate PWR PCMI criteria into hydrogen space to address oxide spallation/high hydrogen conditions
• Potential increase in fuel enthalpy at failure – PWR PCMI oxide thickness levels between 25 and 60 μm– BWR PCMI hydrogen contents between 75 and 250 ppm

66© 2006 Electric Power Research Institute, Inc. All rights reserved.
Alternative BWR PCMI Failure Criteria –Improved Consideration for NSRR Tests
NSRR Database of BWR rods
0 50 100 150 200 250 300
Fuel
Ent
halp
y R
ise
(cal
/gm
)
200
0
175
150
125
100
75
50
25
Nonfailed NSRR BWR Fuel
Failed NSRR BWR Fuel
BWR Failure Criteria
Hydrogen Content (ppm)
- Pulse Width Adjustment
67© 2006 Electric Power Research Institute, Inc. All rights reserved.
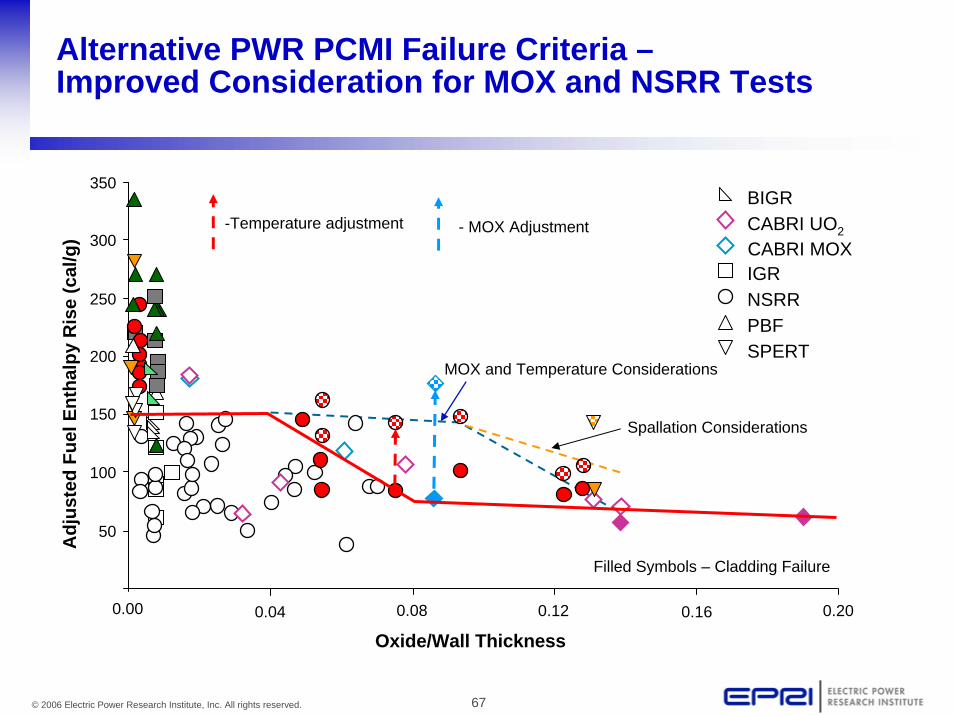
Alternative PWR PCMI Failure Criteria –Improved Consideration for MOX and NSRR Tests
-Temperature adjustment - MOX Adjustment
MOX and Temperature Considerations
Spallation Considerations
0.00 0.04 0.08 0.12 0.16 0.20
50
100
150
200
250
300
350
Oxide/Wall Thickness
Adj
uste
d Fu
el E
ntha
lpy
Ris
e (c
al/g
)
BIGRCABRI UO2
IGRNSRRPBFSPERT
CABRI MOX
Filled Symbols – Cladding Failure

68© 2006 Electric Power Research Institute, Inc. All rights reserved.
Backup Slides
69© 2006 Electric Power Research Institute, Inc. All rights reserved.
FRAPTRAN-FALCON Comparison:FRAPCON 3.3/FRAPTRAN 1.3 Capabilities
• FRAPCON/FRAPTRAN are NRC licensed fuel codes• Based on finite difference methods• 1-D thermal solution• Rigid pellet and thin-shell clad• Uses modified MATPRO to reflect the burnup
dependency of thermal and mechanical properties• Includes behavior models for fission gas, clad corrosion,
etc.

70© 2006 Electric Power Research Institute, Inc. All rights reserved.
FRAPTRAN-FALCON Comparison:Input Deck Construction
• Comparisons made for steady-state, power ramp, and RIA cases
• Input decks were prepared by converting FRAPCON/FRAPTRAN input decks for use in FALCON
• Comparisons of temperature and mechanical performance for RIA cases presented to demonstrate differences between the codes– FK-2 and FK-4 modeled
71© 2006 Electric Power Research Institute, Inc. All rights reserved.
FRAPTRAN-FALCON Comparison:FK2 Test Case
0.00 0.50 1.00 1.50 2.00 2.50 3.00 0
500
1000
1500
2000
TIME (S)
TEM
PER
ATU
RE
(K)
FUEl SURFACE TEMP
FALCON_1029 FRAPTRAN_1.3
0.00 0.50 1.00 1.50 2.00 2.50 3.00 250
300
350
400
450
TIME (S)
TEM
PER
ATU
RE
(K)
CLAD TEMP
FALCON_1029FRAPTRAN_1.3
72© 2006 Electric Power Research Institute, Inc. All rights reserved.
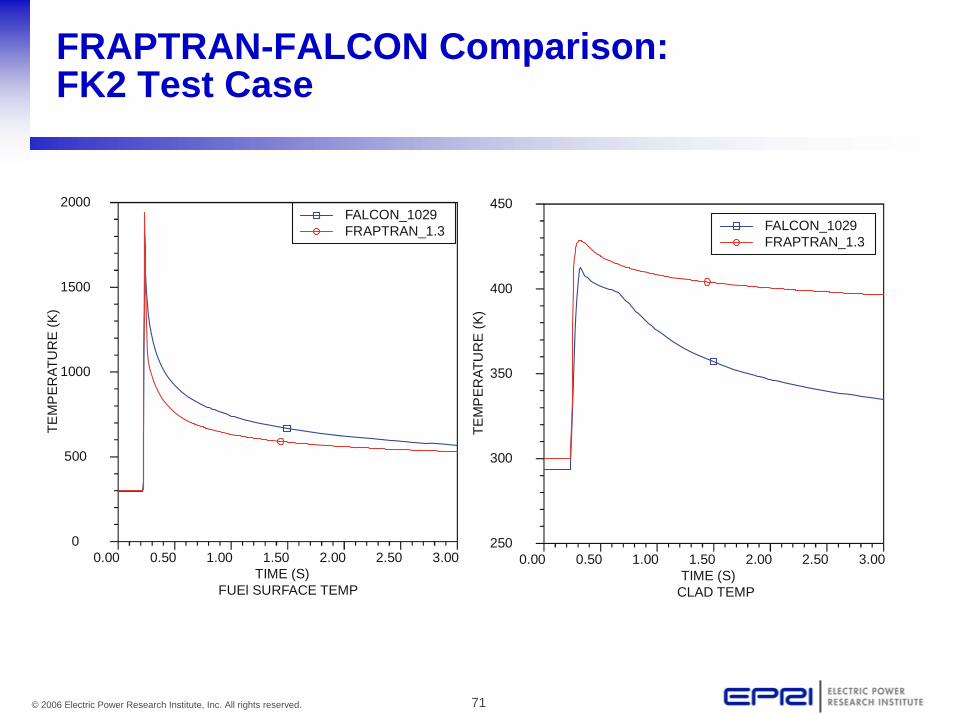
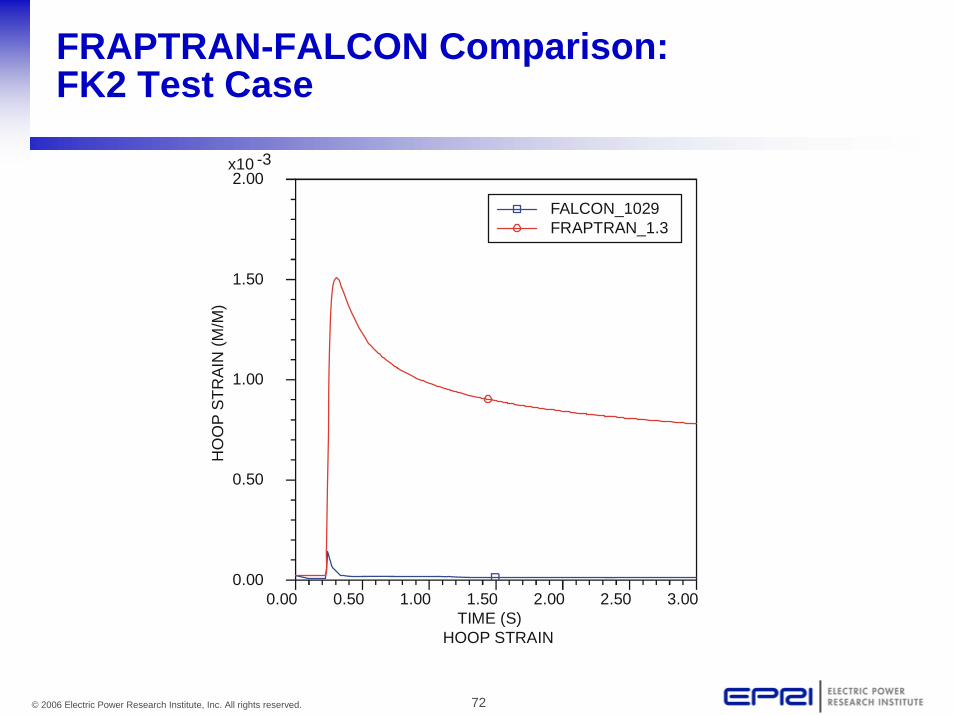
FRAPTRAN-FALCON Comparison:FK2 Test Case
0.00 0.50 1.00 1.50 2.00 2.50 3.00 0.00
0.50
1.00
1.50
2.00
TIME (S)
HO
OP
STR
AIN
(M/M
)
x10 -3
HOOP STRAIN
FALCON_1029FRAPTRAN_1.3

73© 2006 Electric Power Research Institute, Inc. All rights reserved.
FRAPTRAN-FALCON Comparison:FK4 Test Case
0.00 0.50 1.00 1.50 2.00 2.50 3.00 0
5
10
15
20
TIME (S)
FIS
SIO
N G
AS R
ELE
ASE
(%)
FISSION GAS RELEASE
FALCON_1029 FRAPCON_3.3
0.00 0.50 1.00 1.50 2.00 2.50 3.00 0
500
1000
1500
2000
2500
TIME (S)
MA
X FU
EL T
EMPE
RAT
UR
E (K
)
FALCON_1029 FRAPCON_3.3
MAXIMUM FUEL ROD CENTERLINE TEMPERATURE
74© 2006 Electric Power Research Institute, Inc. All rights reserved.
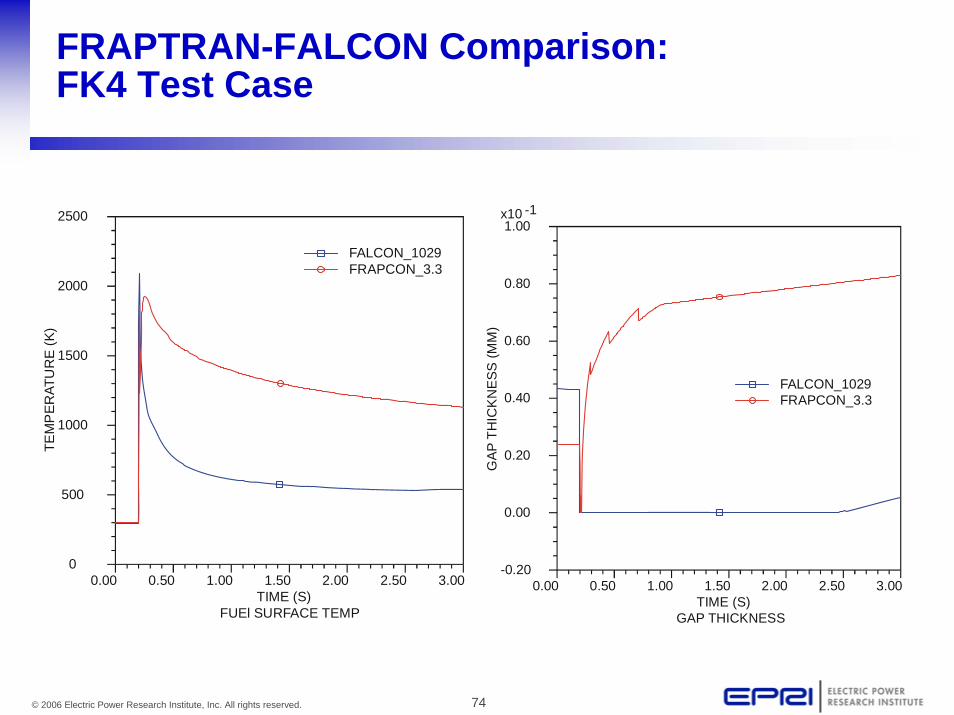
FRAPTRAN-FALCON Comparison:FK4 Test Case
0.00 0.50 1.00 1.50 2.00 2.50 3.00 0
500
1000
1500
2000
2500
TIME (S)
TEM
PER
ATU
RE
(K)
FUEl SURFACE TEMP
FALCON_1029 FRAPCON_3.3
0.00 0.50 1.00 1.50 2.00 2.50 3.00-0.20
0.00
0.20
0.40
0.60
0.80
1.00
TIME (S)
GAP
TH
ICK
NES
S (M
M)
x10 -1
GAP THICKNESS
FALCON_1029 FRAPCON_3.3
75© 2006 Electric Power Research Institute, Inc. All rights reserved.
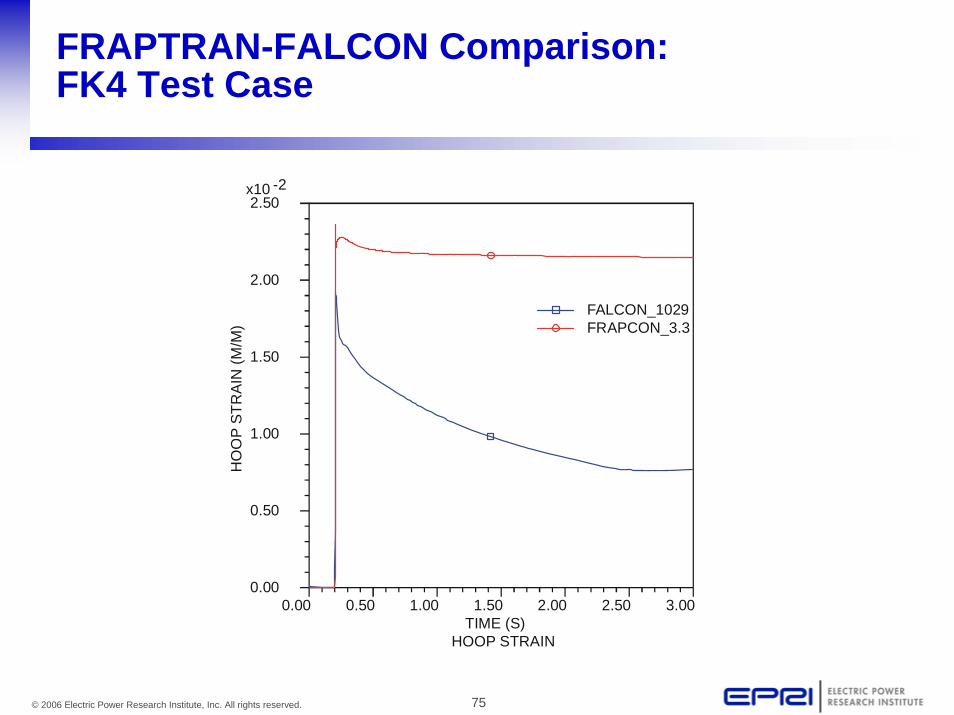
FRAPTRAN-FALCON Comparison:FK4 Test Case
0.00 0.50 1.00 1.50 2.00 2.50 3.00 0.00
0.50
1.00
1.50
2.00
2.50
TIME (S)
HO
OP
STR
AIN
(M/M
)
x10 -2
HOOP STRAIN
FALCON_1029 FRAPCON_3.3
76© 2006 Electric Power Research Institute, Inc. All rights reserved.
FRAPTRAN-FALCON Comparison:Summary
• Comparisons for steady-state and slow power ramp cases so good agreement between codes
• For the RIA cases (FK-2 and FK-4) peak fuel temperature predictions were similar
• Mechanical deformations were similar for the low energy disposition case (FK-2)
• Large variance in mechanical performance for the high energy disposition case (FK-4)– Sensitive to how the fuel-cladding gap is modeled
• Results highly sensitive to input modeling parameters
Top Related