


Languages
Pages
Legal


Indústrias Romi S.A. Quarterly information (ITR) at
March, 31 2017
and reporting on review of quarterly information


INDÚSTRIAS ROMI S.A.
BALANCE SHEETIn thousands of reais unless otherwise stated
Company Consolidated Company Consolidated
March December March December March December March DecemberASSETS Note 31, 2017 31, 2016 31, 2017 31, 2016 LIABILITIES Note 31, 2017 31, 2016 31, 2017 31, 2016
CURRENT CURRENTCash and cash equivalents 3 54.305 60.671 87.214 101.510 Borrowings 12 94.739 96.221 94.952 99.435 Financial investments 3 21.365 20.831 21.365 20.831 FINAME manufacturer financing 13 62.025 67.177 62.025 67.177 Trade accounts receivable 4 79.397 60.227 113.469 94.216 Trade accounts payable 19.940 28.165 26.828 34.482 Onlending of FINAME manufacturer financing 5 95.668 102.356 95.668 102.356 Payroll and related taxes 16.227 15.548 21.765 19.013 Inventories 6 165.509 182.215 250.036 264.587 Taxes payable 888 1.172 1.759 2.596 Related parties 8 36.130 36.566 - - Advances from customers 7.227 8.318 53.665 53.787 Taxes recoverable 18.089 21.980 21.879 24.402 Dividends and interes on capital 232 158 232 158 Other receivables 13.876 12.852 16.193 14.472 Other payables 5.778 5.713 13.621 14.241
Related parties 8 889 758 - - 484.339 497.698 605.824 622.374
207.945 223.230 274.847 290.889
NONCURRENTTrade accounts receivable 4 11.466 11.996 11.466 11.996 Onlending of FINAME manufacturer financing 5 58.447 67.323 58.447 67.323 Taxes recoverable 671 777 671 777 NONCURRENTDeferred income tax and social contribution 15 55.681 56.232 57.040 58.053 Borrowings 12 81.694 87.761 93.621 100.338 Judicial deposits 14 2.087 2.115 2.087 2.115 FINAME manufacturer financing 13 54.406 62.953 54.406 62.953 Other receivables 9.215 8.806 9.462 9.065 Taxes payable 539 539 539 539
Provision for tax, labor and divil risks 14 609 713 1.439 1.920 137.567 147.249 139.173 149.329 Other payables 18 - 113 96
Deferred income tax and social contribution 15 - - 25.331 25.853
Investment in subsidiary and associated companies 7 118.471 122.505 - - 137.266 151.966 175.449 191.699 Property, plant and equipment 10 190.719 193.721 246.344 252.033 Investment properties 9 13.227 13.227 18.588 17.538 TOTAL LIABILITIES 345.211 375.196 450.296 482.588 Intangible assets 11 1.313 758 42.298 42.846
EQUITY461.297 477.460 446.403 461.746 Capital 16 492.025 492.025 492.025 492.025
Profit reserve 16 90.243 90.243 90.243 90.243 Profit for the period 16 2.015 - 2.015 - Cumulative translation adjustments 16 16.142 17.694 16.142 17.694
600.425 599.962 600.425 599.962
NON CONTROLLING INTEREST - - 1.506 1.570
TOTAL EQUITY 600.425 599.962 601.931 601.532
TOTAL ASSETS 945.636 975.158 1.052.227 1.084.120 TOTAL LIBILITIES AND EQUITY 945.636 975.158 1.052.227 1.084.120
The accompanying notes are an integral part of these Interim financial statements.

INDÚSTRIAS ROMI S.A.
STATEMENT OF INCOMEQUARTERS ENDED MARCH 31In thousands of reais unless otherwise stated (a free translation of the original in Portuguese)
Company Consolidated
Note 2017 2016 2017 2016
Net Operating revenue 22 108.070 95.334 146.525 129.810 Cost of sales and services 23 (83.418) (76.498) (110.281) (103.582)
Gross profit 24.652 18.836 36.244 26.228
Operation income (expenses)Selling 23 (8.139) (9.033) (14.659) (14.978) General and administrative 23 (6.919) (9.202) (12.906) (19.162) Research and development 23 (4.052) (4.134) (4.052) (4.134) Management profit sharing and fees 8 (1.430) (1.163) (1.453) (1.186) Equity income 7 (954) (6.629) - - Other operating income, net 25 150 697 142 661
(21.344) (29.464) (32.928) (38.799) Operating profit (loss)Operating profit (loss) 3.308 (10.628) 3.316 (12.571) Financial income (expenses)Financial income
Financial income 24 3.764 3.915 4.285 4.192 Financial expenses 24 (3.713) (3.619) (4.067) (3.741) Foreign exchange gains, net 24 (738) (1.415) (735) (1.777)
(687) (1.119) (517) (1.326) Profit (loss) before taxationProfit (loss) before taxation 2.621 (11.747) 2.799 (13.897) Income tax and social contributionIncome tax and social contribution (606) 1.782 (735) 3.988
Profit (loss) for the period 2.015 (9.965) 2.064 (9.909)
Attributable to:Controlling interests 2.015 (9.965) Non-controlling interests 49 56
2.064 (9.909)
Basic and diluted earnings (loss) per share (R$) 16 0,03 (0,14)
The accompanying notes are an integral part of these Interim financial statements.
INDÚSTRIAS ROMI S.A. INDÚSTRIAS ROMI S.A.
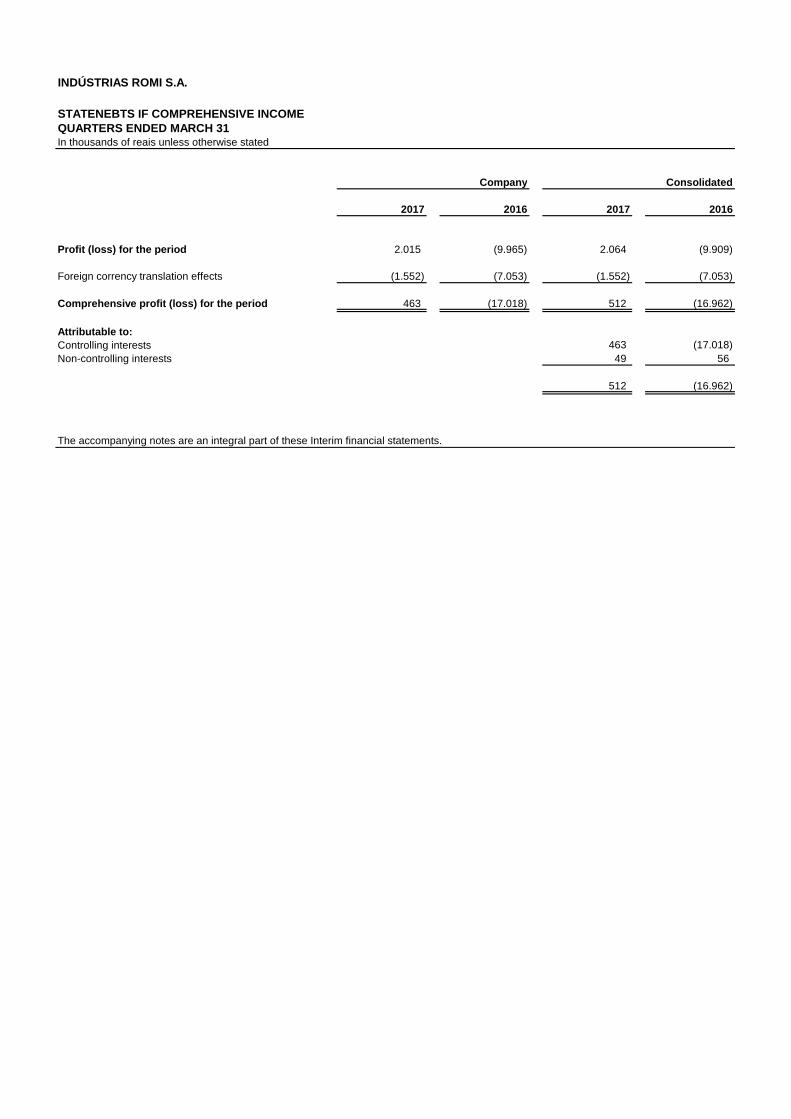
STATENEBTS IF COMPREHENSIVE INCOMEQUARTERS ENDED MARCH 31In thousands of reais unless otherwise stated
Company Consolidated
2017 2016 2017 2016
Profit (loss) for the period 2.015 (9.965) 2.064 (9.909)
Foreign corrency translation effects (1.552) (7.053) (1.552) (7.053)
Comprehensive profit (loss) for the period 463 (17.018) 512 (16.962)
Attributable to:Controlling interests 463 (17.018) Non-controlling interests 49 56
512 (16.962)
The accompanying notes are an integral part of these Interim financial statements.

INDÚSTRIAS ROMI S.A.
STATEMENT OF CHANGES IN SHAREHOLDERS EQUITYIn thousands of reais unless otherwise stated
ReitanedOther earnings Non-
Capital Capital Theasuty Reitaned legal comprehensive profit (loss) controllingsocial reserve share Earning reserve Total income accumulated Total Interests Total
At January 1, 2016 492.025 2.052 (5.078) 98.966 41.755 140.721 43.051 - 670.719 2.276 672.995
Profit (loss) for the period - - - - - - - (9.965) (9.965) 56 (9.909) Foreign currency translantion effects - - - - - - (7.053) - (7.053) (7.053) Total comprehensive income for the period - - - - - - (7.053) (9.965) (17.018) 56 (16.962) Purchase of theasury shares - - (522) - - - - - (522) - (522) Proposed dividends - - - - - - - - - (819) (819) Total contributtions by and distribuitions to controlling interests (522) - - - - (522) (819) (1.341) At March 31, 2016 492.025 2.052 (5.600) 98.966 41.755 140.721 35.998 (9.965) 653.179 1.513 654.692
At January 1, 2017 492.025 - - 48.488 41.755 90.243 17.694 - 599.962 1.570 601.532
Profit for the period - - - - - - - 2.015 2.015 49 2.064 Foreign currency translantion effects - - - - - - (1.552) - (1.552) - (1.552) Total comprehensive income for the period - - - - - - (1.552) 2.015 463 49 512 Proposed dividends - - - - - - - - - (113) (113) Total contributtions by and distribuitions to controlling interests - - - - - - - - (113) (113) At March 31, 2017 492.025 - - 48.488 41.755 90.243 16.142 2.015 600.425 1.506 601.931
The accompanying notes are an integral part of these Interim financial statements.
Attributable to he controlling interests
Profit reserve

INDÚSTRIAS ROMI S.A.
STATEMENT OF CASH FLOWSQUARTERS ENDED MARCH 31In thousands of reais unless otherwise stated
Company Consolidated
2017 2016 2017 2016
Cash flows from operating activities
Profit (loss) before the taxation 2.621 (11.747) 2.799 (13.897)
Adjustments from:
(Revenue), finance expenses and exchange rate 2.673 4.735 2.478 3.434
Depreciation and amortization 6.040 6.959 7.513 8.942 Allowance for doubtful accounts and for other receivable 407 316 420 975 Provision for inventory losses (1.963) 1.254 (2.475) 309
Cost of property, plant and equipment and disposals of intangible assets (383) (422) (297) (269)
Equity pickup 954 6.629 - -
Provision for contingent liabilities (3.150) (233) (3.511) (16)
Change in operating assets and liabilities
Financial investments (534) (16.437) (534) (16.437)
Trade accounts receivables (18.034) (3.267) (18.130) 14.118
Related parties (assets and liabilities) 580 5.358 - -
Onlendinf of FINAME manufacturer financing 16.305 10.711 16.305 10.711
Inventories 18.669 (6.400) 17.028 (2.410)
Taxes recovable 3.960 2.301 3.642 (1.567)
Judicial deposits (578) (71) (578) (71)
Other receivables (745) 4.380 (1.430) 3.659
Trade accounts payable (8.090) 10.229 (7.519) 7.626
Payroll and related taxes 2.568 2.434 4.641 3.556
Taxes payable 309 (723) (1.252) 86
Advances from customers (1.091) (2.954) (122) (9.100)
Other payables 1.720 (645) 1.043 (3.772)
Cash provided by operations 22.238 12.407 20.021 5.877
Income tax and social contribuition paid (593) - (842) (629)
Net cashprovided by operating activities 21.645 12.407 19.179 5.248
Cash flow investiment actvitiesPurchases of property, plant and equipment (3.091) (1.357) (3.394) (2.425)
Intangibles increase (613) - (671) (87)
Disposals of property, plant and equipment 494 664 494 664
Dividends received 1.528 11.002 - -
Net cash provided (used) by investment actvities (1.682) 10.309 (3.571) (1.848)
Cash flow from financing activitiesInterest on capital and dividends paid - - (113) (819)
Purchase of theasury shares - (522) - (522)
New borrowing 1.801 4.656 1.801 14.992
Payment of the financing (9.841) (9.886) (12.823) (13.312)
Interest paid (2.894) (3.274) (3.363) (3.518)
New FINAME - manufacturer financing 4.759 7.018 4.759 7.018
Payment of FINAME - manufacturer financing (18.497) (24.275) (18.497) (24.275)
Interest paid - FINAME manufacturer financing (1.657) (1.994) (1.657) (1.994)
Net cash used in financing activities (26.329) (28.277) (29.893) (22.430)
Decrease in cash and cash equivalents (6.366) (5.561) (14.285) (19.030)
Cash and cash equivalents at the beginning of the p eriod 60.671 99.917 101.510 141.918
Foreign exchange losses of cash equivalents of fore ign subsidiaries - - (11) (290)
Cash and cash equivalents at the end of the period 54.305 94.356 87.214 122.598
The accompanying notes are an integral part of these Interim financial statements.

INDÚSTRIAS ROMI S.A.
STATEMENT OF VALUE ADDEDQUARTERS ENDED MARCH 31In thousands of reais unless otherwise statedXX Company Consolidated
x 2017 2016 2017 2016
RevenuesSales of products and services 123.934 110.871 162.406 145.460 Allowance for doubtful accounts and for the other receivables (482) (281) (482) (281)
123.452 110.590 161.924 145.179
Inputs acquired from third partiesMaterials used (55.101) (48.844) (69.271) (60.163) Others costs of products and services (5.082) (4.547) (7.777) (8.798) Electricity, third party services and other expenses (6.448) (6.822) (8.487) (8.794)
(66.631) (60.213) (85.535) (77.755)
Gross value added 56.821 50.377 76.389 67.424 Depreciation and amortization (6.040) (6.959) (7.513) (8.942)
Net value added generated by the Company 50.781 43.418 68.876 58.482
Value added received through transfersEquity in the earnings of subsidiaries (954) (6.629) - -
Financial income and net foreign exchange gaion (688) (1.119) (517) (1.326)
Total value added to distribute 49.139 35.670 68.359 57.156
Distribuition of value addedEmployees
Payroll and related changes 28.109 28.058 46.600 49.104 Sales commision 889 930 889 930 Managment profit sharing and fess 1.430 1.163 1.453 1.186 Pensions plans 199 83 199 83 Taxes
Federal 11.675 10.493 11.940 10.788 State 17 274 17 274 Municipal 541 432 628 432 Interests 3.713 3.619 4.067 3.741 Rentals 551 583 551 583 Non-controlling interests - - (49) (56)
Profit (loss) for the period 2.015 (9.965) 2.064 (9.909)
Value added distributed 49.139 35.670 68.359 57.156
The accompanying notes are an integral part of these Interim financial statements.

Indústrias Romi S.A.
Notes to the quarterly information (ITR)
At March 31, 2017 In thousands of reais, unless otherwise stated
1 of 27
1 General information
Indústrias Romi S.A. (Company) and its subsidiaries (together referred to as Consolidated), has
been listed on the "New Market" of the São Paulo Stock Exchange (BM&FBOVESPA since March
23, 2007, and is headquartered in Santa Bárbara d’Oeste, São Paulo. The Company is engaged in
the manufacture and sale of capital goods in general, including machine tools, plastic injection
molding machines, industrial equipment and accessories, tools, castings and parts, as well as
providing system analysis and developing data processing software related to the production,
sale, and use of machine tools and plastic injectors; the manufacture and sale of raw cast parts
and machined cast parts; the export, import and representation on its own account or on behalf
of third parties; and the provision of related services. It also holds interest in other companies as
partner, shareholder or member in other civil or business entities, business ventures of any
nature, in Brazil or abroad, as well as well as the management of its own and/or third party assets.
The Company's industrial facilities consist of 11 plants in three units located in the city of Santa
Bárbara d’Oeste, in the State of São Paulo, and one located in the city of Reutlingen, Germany.
The latter is a high precision tooling machine manufacturer. The Company also holds investments
in subsidiaries in Brazil and abroad.
This quarterly information was approved by the Company’s Board of Directors and authorized for
issue on April 25, 2017.
2 Basis of preparation and accounting policies
The financial information for the quarter ended March 31, 2017 for the Company has been
prepared in accordance with CVM Ruling No. 673, dated October 20, 2011, which approved
accounting standard CPC 21 (R1) and IAS 34 Interim Financial Reporting issued by the
International Accounting Standards Board (IASB).
The accounting policies adopted by the Company in the preparation of the Company and
consolidated quarterly financial information are the same as those used in the preparation of the
financial statements for the year ended December 31, 2016 and, therefore, should be read in
conjunction with those financial statements.
The Company and consolidated quarterly financial information has been prepared in accordance
with the accounting practices adopted in Brazil, including the pronouncements issued by Brazil’s
FASB (CPC), as well as in accordance with the International Financial Reporting Standards (IFRS)
issued by the International Accounting Standards Board (IASB), and contains all material
information specific to the quarterly information, which is consistent with that used by
management.
The Company’s management has reassessed its criteria for classification of financial instruments
that are pledged as collateral for borrowing transactions and concluded that the best
presentation of these assets would be as financial investments and no longer as cash and cash

Indústrias Romi S.A.
Notes to the quarterly information (ITR)
At March 31, 2017 In thousands of reais, unless otherwise stated
2 of 27
equivalents. Therefore, the amounts that meet the aforementioned criteria have been classified
as financial investments in the quarterly financial information and the comparative periods have
been reclassified for a better comparability between them.
As there is no difference between the consolidated equity and consolidated profit and loss (P&L)
attributable to Company shareholders, disclosed in the consolidated quarterly information
prepared in accordance with IFRS and accounting practices adopted in Brazil, and the Company’s
equity and P&L disclosed in the its individual, quarterly financial information prepared in
accordance with accounting practices adopted in Brazil, the Company elected to present
Company and consolidated quarterly information in a single set of statements
The purpose of the statement of value added is to disclose the wealth created by the Company
and its distribution during a certain period, and is presented by the Company, as required by
Brazilian Corporate Law, as an integral part of its individual quarterly information, and as
supplementary information to the consolidated financial statements. That statement is not
provided for, or required by IFRS.
(a) Notes included in the financial statements as at December 31, 2016, not included in this
quarterly information
The quarterly information is presented in accordance with accounting pronouncements CPC 21
and IAS 34 Interim Financial Reporting issued by the International Accounting Standards Board
(IASB). The preparation of this quarterly information involves judgment by the Company's
management on the relevance and changes that should be disclosed in the accompanying notes.
Accordingly, this quarterly information includes selected notes and does not comprise all notes
presented in the year ended December 31, 2016. As permitted by Circular Letter 03/2011 of the
Brazilian Securities Commission (CVM), the following notes are not presented:
• Basis of preparation and accounting policies (Note 2);
• Pension plan (Note 17);
• Insurance (Note 18);
• Financial instruments and operating risks (Note 19):
• Net operating revenue (Note 22);
• Expenses by nature (Note 23);
• Finance income (expenses) (Note 24); and
• Other operating income, net (Note 25).

Indústrias Romi S.A.
Notes to the quarterly information (ITR)
At March 31, 2017 In thousands of reais, unless otherwise stated
3 of 27
3 Cash and cash equivalents and financial investments
Company
Consolidated
March
December
March
December
31,
31,
31,
31,
2017
2016
2017
2016
Cash and banks
1,742
3,474
16,061
19,594
Bank deposit certificates (“CDBs”) (a)
18,256
25,854
34,849
43,431
Short-term investments backed by debentures (a)
22,675
21,435
24,634
23,491
Investment funds DI and fixed income
11,277
7,913
11,277
7,913
Short-term investments in foreign currency - US$ (Time
deposit)
317
1,955
317
7,025
Other
37
40
76
56
Total cash and cash equivalents
54,305
60,671
87,214
101,510
Bank deposit certificates (“CDBs”) (b)
3,004
17,841
3,004
17,841
Short-term investments backed by debentures (b)
18,361
2,990
18,361
2,990
Total assets held for trading
21,365
20,831
21,365
20,831
(a) These investments are substantially pegged to the Interbank Deposit Certificate (“CDI”) rate.
(b) These investments are substantially pegged to the Interbank Deposit Certificate (“CDI”) rate and
are pledged as guarantee of commitments assumed.
Indústrias Romi S.A.
Notes to the quarterly information (ITR)
At March 31, 2017 In thousands of reais, unless otherwise stated
4 of 27
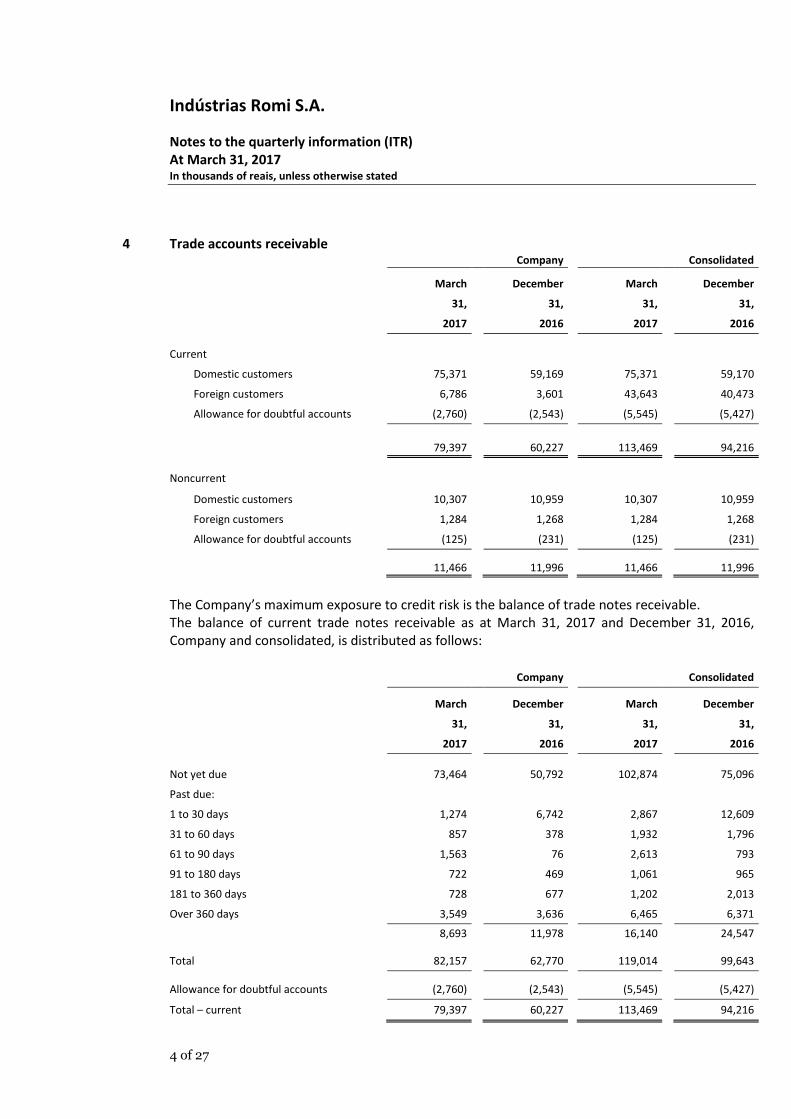
4 Trade accounts receivable
Company
Consolidated
March
December
March
December
31,
31,
31,
31,
2017
2016
2017
2016
Current
Domestic customers
75,371
59,169
75,371
59,170
Foreign customers
6,786
3,601
43,643
40,473
Allowance for doubtful accounts
(2,760)
(2,543)
(5,545)
(5,427)
79,397
60,227
113,469
94,216
Noncurrent
Domestic customers
10,307
10,959
10,307
10,959
Foreign customers
1,284
1,268
1,284
1,268
Allowance for doubtful accounts
(125)
(231)
(125)
(231)
11,466
11,996
11,466
11,996
The Company’s maximum exposure to credit risk is the balance of trade notes receivable.
The balance of current trade notes receivable as at March 31, 2017 and December 31, 2016,
Company and consolidated, is distributed as follows:
Company
Consolidated
March
December
March
December
31,
31,
31,
31,
2017
2016
2017
2016
Not yet due
73,464
50,792
102,874
75,096
Past due:
1 to 30 days
1,274
6,742
2,867
12,609
31 to 60 days
857
378
1,932
1,796
61 to 90 days
1,563
76
2,613
793
91 to 180 days
722
469
1,061
965
181 to 360 days
728
677
1,202
2,013
Over 360 days
3,549
3,636
6,465
6,371
8,693
11,978
16,140
24,547
Total
82,157
62,770
119,014
99,643
Allowance for doubtful accounts (2,760)
(2,543)
(5,545)
(5,427)
Total – current
79,397
60,227
113,469
94,216

Indústrias Romi S.A.
Notes to the quarterly information (ITR)
At March 31, 2017 In thousands of reais, unless otherwise stated
5 of 27
The balance of noncurrent trade accounts receivable as at March 31, 2017, Company and
consolidated, is distributed as follows:
Company and
consolidated
Not yet due:
2018 (9 months)
8,995
2019
2,439
2020
157
Allowance for doubtful accounts (125)
Total - noncurrent
11,466
The changes in the allowance for doubtful accounts, Company and consolidated, are as follows:
Company
Consolidated
As at December 31, 2016
2,774
5,658
Allowance recognized in the period
161
165
Receivables written off
(50)
(112)
Foreign exchange gains (losses)
-
(42)
As at March 31, 2017
2,885
5,670

Indústrias Romi S.A.
Notes to the quarterly information (ITR)
At March 31, 2017 In thousands of reais, unless otherwise stated
6 of 27
5 Receivables - onward lending of FINAME manufacturer financing
Company and
Consolidated
March
December
31,
31,
2017
2016
Current
FINAME not yet due
68,561
74,828
FINAME awaiting release (a)
347
339
FINAME past due (b)
40,087
39,622
108,995
114,789
Allowance for doubtful accounts
(13,327)
(12,433)
95,668
102,356
Noncurrent
FINAME not yet due
57,679
67,073
FINAME awaiting release (a)
1,387
1,357
59,066
68,430
Allowance for doubtful accounts
(619)
(1,107)
58,447
67,323
Total
154,115
169,679
The item "Receivables - onward lending of FINAME manufacturing financing" refers to sales to
customers financed by funds from the Brazilian Development Bank (BNDES) (Note 13).
The FINAME manufacturer credit line refers to financing specifically linked to sales transactions
with terms of up to 48 months, with grace periods of up to three months and estimated cost of
13.1% per year, in accordance with the terms defined by the BNDES at the time of the financing.
The financing terms are also based on a customer's characteristics. Funds are released by the
BNDES on identification of a customer and sale, as well as checking that a customer has fulfilled
the terms of Circular 195 dated July 28, 2006 issued by BNDES, through a financial agent, with the
formalization of a financing agreement in the name of the Company and consent of the customer
to be financed. The amounts, periods and charges of the transaction are fully reflected in the
amounts to be received by the Company from the bank mediating the agreement to which the
Company is the debtor. The Company retains title to the financed equipment until the final
settlement of the obligation by the customer.

Indústrias Romi S.A.
Notes to the quarterly information (ITR)
At March 31, 2017 In thousands of reais, unless otherwise stated
7 of 27
The difference between onward lending of FINAME manufacturers’ financing receivables and
payables include:
(a) FINAME transactions awaiting release: refers to FINAME manufacturer financing transactions that
meet the specified terms and have been approved by all parties involved. The preparation of
documentation, the issue of the sales invoice, and the delivery of the equipment to the customer
have all taken place. The crediting of the related funds to the Company’s account by the agent
bank is pending at the end of the reporting period, in view of the normal operating terms of the
agent.
(b) FINAME past due: refers to amounts receivable not settled by customers on their due dates. The
Company records provisions for possible losses on the realization of these balances, at the
amount of the difference between the expected value of the sale of the collateral (machinery)
recovered through enactment of covenant regarding reservation of title over the machinery sold
(security guarantee) and the value of the receivables from defaulting customers. In instances in
which the security guarantee cannot be located, a full loss provision is made for balance of the
receivable.
The machines seized as part of the execution process are recorded at their carrying amount, not
exceeding their fair value, under the category of “Other receivables”, pending a final and
unappealable court decision, after which they are repossessed and transferred to inventories. As
at March 31, 2017, the balance of repossessed machinery, included under the line item of “Other
receivables”, Company and consolidated, amounted to R$ 3,572 (R$ 4,015 as at December 31,
2016) in current assets and R$ 8,650 (R$ 8,246 as at December 31, 2016) in noncurrent assets.

Indústrias Romi S.A.
Notes to the quarterly information (ITR)
At March 31, 2017 In thousands of reais, unless otherwise stated
8 of 27
As at March 31, 2017 and December 31, 2016, the balances of "Receivables - onward lending of
FINAME manufacturer financing Company and consolidated, were as follows:
Company and
Consolidated
March
December
31,
31,
2017
2016
Not yet due
68,908
75,167
Past due:
1 to 30 days
1,678
2,070
31 to 60 days
1,234
1,292
61 to 90 days
1,148
1,346
91 to 180 days
3,190
3,633
181 to 360 days
5,600
5,295
Over 360 days
27,237
25,986
40,087
39,622
Total – current
108,995
114,789
The expected realization of the noncurrent receivables relating to the onward lending of FINAME
manufacturer financing, Company and consolidated, is as follows:
Company and
consolidated
Not yet due:
2018 (9 months)
38,165
2019
16,794
2020
4,070
2021
37
Total - Noncurrent
59,066
Indústrias Romi S.A.
Notes to the quarterly information (ITR)
At March 31, 2017 In thousands of reais, unless otherwise stated
9 of 27
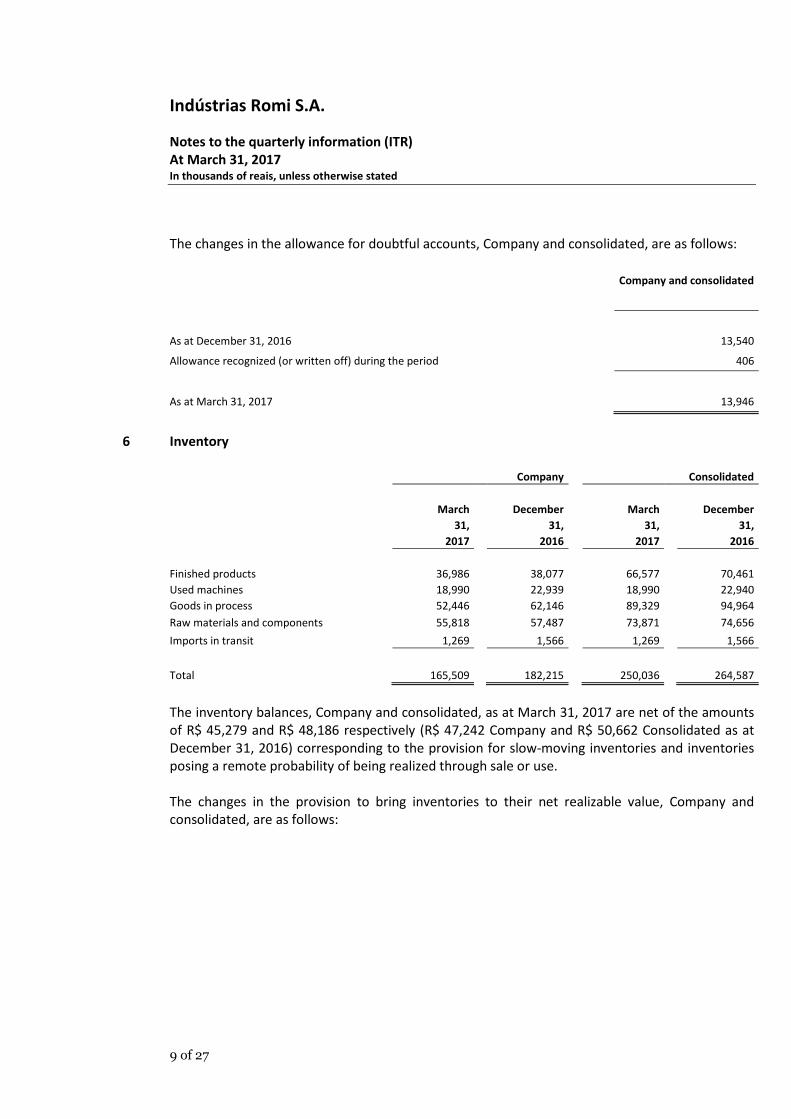
The changes in the allowance for doubtful accounts, Company and consolidated, are as follows:
Company and consolidated
As at December 31, 2016
13,540
Allowance recognized (or written off) during the period
406
As at March 31, 2017
13,946
6 Inventory
Company Consolidated
March December March December
31, 31, 31, 31,
2017 2016 2017 2016
Finished products 36,986 38,077 66,577 70,461
Used machines 18,990 22,939 18,990 22,940
Goods in process 52,446 62,146 89,329 94,964
Raw materials and components 55,818 57,487 73,871 74,656
Imports in transit 1,269 1,566 1,269 1,566
Total 165,509 182,215 250,036 264,587
The inventory balances, Company and consolidated, as at March 31, 2017 are net of the amounts
of R$ 45,279 and R$ 48,186 respectively (R$ 47,242 Company and R$ 50,662 Consolidated as at
December 31, 2016) corresponding to the provision for slow-moving inventories and inventories
posing a remote probability of being realized through sale or use.
The changes in the provision to bring inventories to their net realizable value, Company and
consolidated, are as follows:

Indústrias Romi S.A.
Notes to the quarterly information (ITR)
At March 31, 2017 In thousands of reais, unless otherwise stated
10 of 27
Company Consolidated
As at January 1, 2017 47,242 50,662
Inventory sold or written off (6,311) (6,371)
Provision recorded 3,500 4,015
Foreign exchange gains (losses) - (968)
Transfer of provisions resulting from machines
repossessed during the period 848 848
As at March 31, 2017 45,279 48,186
The changes in the provision for inventory losses by class of inventory are as follows:
Company Consolidated
March December March December
31, 31, 31, 31,
2017 2016 2017 2016
Finished products 3,633 2,894 6,541 6,314
Used machines 16,413 19,565 16,413 19,565
Goods in process 5,434 5,602 5,434 5,602
Raw materials and components 19,799 19,181 19,799 19,181
Total 45,279 47,242 48,186 50,662
Indústrias Romi S.A.
Notes to the quarterly information (ITR)
At March 31, 2017 In thousands of reais, unless otherwise stated
11 of 27
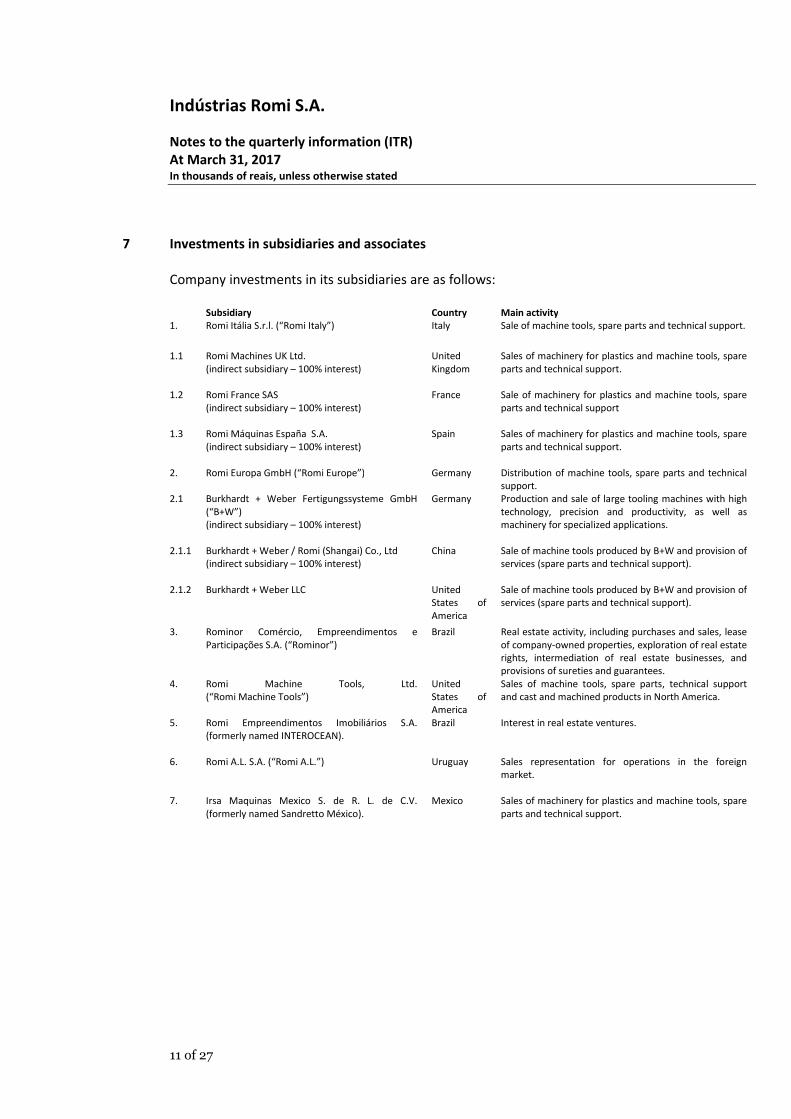
7 Investments in subsidiaries and associates
Company investments in its subsidiaries are as follows:
Subsidiary Country Main activity
1. Romi Itália S.r.l. (“Romi Italy”) Italy Sale of machine tools, spare parts and technical support.
1.1 Romi Machines UK Ltd.
(indirect subsidiary – 100% interest)
United
Kingdom
Sales of machinery for plastics and machine tools, spare
parts and technical support.
1.2 Romi France SAS
(indirect subsidiary – 100% interest)
France Sale of machinery for plastics and machine tools, spare
parts and technical support
1.3 Romi Máquinas España S.A.
(indirect subsidiary – 100% interest)
Spain Sales of machinery for plastics and machine tools, spare
parts and technical support.
2. Romi Europa GmbH (“Romi Europe”) Germany Distribution of machine tools, spare parts and technical
support.
2.1 Burkhardt + Weber Fertigungssysteme GmbH
(“B+W”)
(indirect subsidiary – 100% interest)
Germany Production and sale of large tooling machines with high
technology, precision and productivity, as well as
machinery for specialized applications.
2.1.1 Burkhardt + Weber / Romi (Shangai) Co., Ltd
(indirect subsidiary – 100% interest)
China Sale of machine tools produced by B+W and provision of
services (spare parts and technical support).
2.1.2 Burkhardt + Weber LLC United
States of
America
Sale of machine tools produced by B+W and provision of
services (spare parts and technical support).
3. Rominor Comércio, Empreendimentos e
Participações S.A. (“Rominor”)
Brazil Real estate activity, including purchases and sales, lease
of company-owned properties, exploration of real estate
rights, intermediation of real estate businesses, and
provisions of sureties and guarantees.
4. Romi Machine Tools, Ltd.
(“Romi Machine Tools”)
United
States of
America
Sales of machine tools, spare parts, technical support
and cast and machined products in North America.
5. Romi Empreendimentos Imobiliários S.A.
(formerly named INTEROCEAN).
Brazil Interest in real estate ventures.
6. Romi A.L. S.A. (“Romi A.L.”) Uruguay Sales representation for operations in the foreign
market.
7. Irsa Maquinas Mexico S. de R. L. de C.V.
(formerly named Sandretto México).
Mexico Sales of machinery for plastics and machine tools, spare
parts and technical support.
Indústrias Romi S.A.
Notes to the quarterly information (ITR)
At March 31, 2017 In thousands of reais, unless otherwise stated
12 of 27
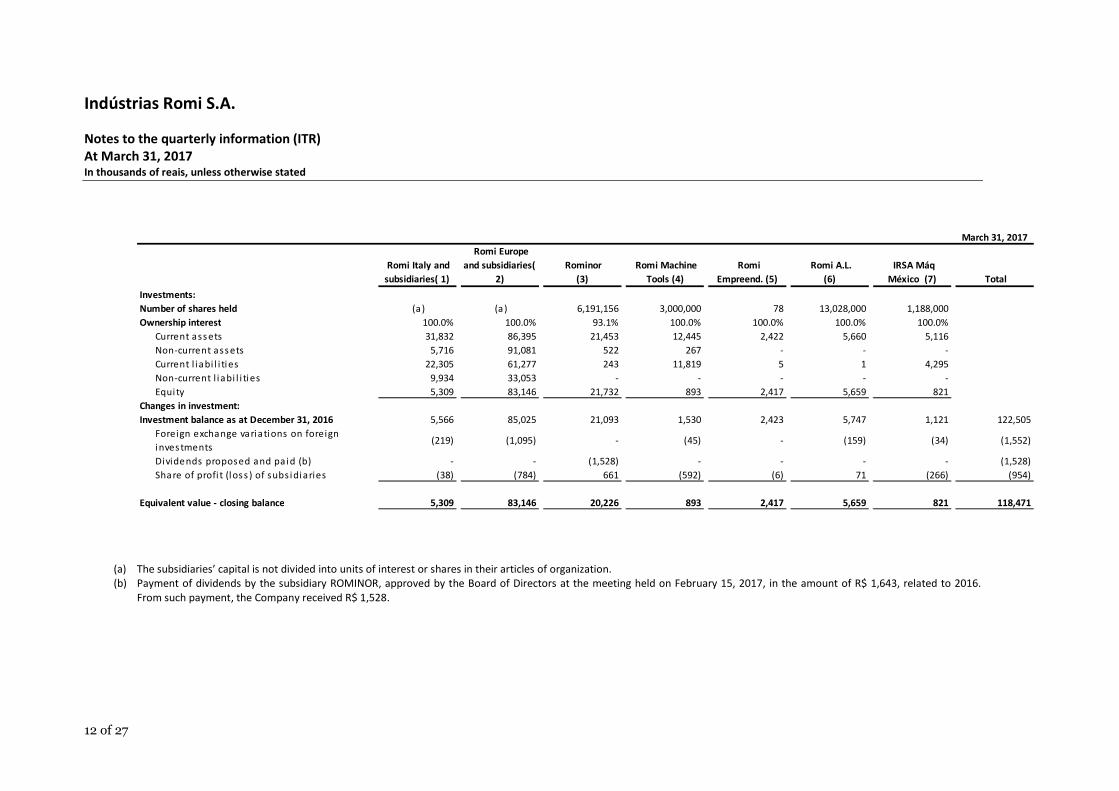
(a) The subsidiaries’ capital is not divided into units of interest or shares in their articles of organization.
(b) Payment of dividends by the subsidiary ROMINOR, approved by the Board of Directors at the meeting held on February 15, 2017, in the amount of R$ 1,643, related to 2016.
From such payment, the Company received R$ 1,528.
March 31, 2017
Romi Italy and
subsidiaries( 1)
Romi Europe
and subsidiaries(
2)
Rominor
(3)
Romi Machine
Tools (4)
Romi
Empreend. (5)
Romi A.L.
(6)
IRSA Máq
México (7) Total
Investments:
Number of shares held (a ) (a ) 6,191,156 3,000,000 78 13,028,000 1,188,000
Ownership interest 100.0% 100.0% 93.1% 100.0% 100.0% 100.0% 100.0%
Current ass ets 31,832 86,395 21,453 12,445 2,422 5,660 5,116
Non-current ass ets 5,716 91,081 522 267 - - -
Current l iabi l i ties 22,305 61,277 243 11,819 5 1 4,295
Non-current l iabi l i ties 9,934 33,053 - - - - -
Equi ty 5,309 83,146 21,732 893 2,417 5,659 821
Changes in investment:
Investment balance as at December 31, 2016 5,566 85,025 21,093 1,530 2,423 5,747 1,121 122,505
Foreign exchange variations on foreign
inves tments (219) (1,095) - (45) - (159) (34) (1,552)
Dividends proposed and paid (b) - - (1,528) - - - - (1,528)
Share of profi t (los s ) of subsidiaries (38) (784) 661 (592) (6) 71 (266) (954)
Equivalent value - closing balance 5,309 83,146 20,226 893 2,417 5,659 821 118,471

Indústrias Romi S.A.
Notes to the quarterly information (ITR)
at March 31, 2017 All amounts in thousands of reais unless otherwise stated
13 of 27
8 Related party transactions and balances
The balances and transactions with related parties as at March 31, 2017 and December 31, 2016 are
as follows:
(i) Statement of financial position accounts – Company
Receivables Payables
March December March December
31, 31, 31, 31,
2017 2016 2017 2016
Direct subsidiaries
Romi Europe 4,274 4,553 317 168
Romi Italy 3,831 2,273 - -
Romi Machine Tools 11,293 12,326 - -
Romi A.L. - - 572 566
Irsa Máquinas Mexico 2,539 2,663 - -
Rominor 4 3 - 24
Indirect subsidiaries
B+W - Burkhardt+Weber 454 337 - -
Romi France S.A.S. 2,464 2,986 - -
Romi Máquinas España S.A. 1,797 1,578 - -
Romi Machines UK 9,474 9,847 - -
Total 36,130 36,566 889 758
(ii) Transactions
The main balances and transactions with the aforementioned related parties refer to trading
transactions between the Company and its subsidiaries.
The subsidiary Rominor is the guarantor of some of the FINAME manufacturer financing transactions
involving the Company, and the financing is collateralized by promissory notes and sureties (Note 13).
The Company has property lease agreements with its subsidiary Rominor, involving four properties,
which are used by the sales branch operations in Brazil. These rentals were priced according to
market practices.

Indústrias Romi S.A.
Notes to the quarterly information (ITR)
at March 31, 2017 All amounts in thousands of reais unless otherwise stated
14 of 27
The Company entered into trading transactions with certain subsidiaries for the supply and purchase
of equipment, parts and pieces, but does not have material transactions with related parties other
than those described above. Decisions regarding transactions between the Company and its
subsidiaries are made by management. Trade notes mature in the short term.
The Company provides administrative services, mainly accounting and legal services, to its parent
company Fênix Empreendimentos S.A. The accumulated revenue until March 2017 was R$ 39 (2016 –
R$ 48).
The Company makes donations to Romi Foundation at amounts set in the agreement approved by the
State Prosecutor Office. Donations in 2017 totaled R$ 223 (2016 – R$ 211).
As from 2014, the Company adopted the Policy for Transactions with Related Parties (available at
www.romi.com) the main purpose of which is to ensure transparency and compliance with market
practices in these transactions.
Management compensation for the periods ended March 31, 2017 and 2016 was as follows:

Indústrias Romi S.A.
Notes to the quarterly information (ITR)
at March 31, 2017 All amounts in thousands of reais unless otherwise stated
15 of 27
March
March
31,
31,
2017
2016
Fees and charges
1,257
1,078
Profit sharing
75
-
Private pension plan
56
50
Healthcare plan
42
35
Parent company
1,430
1,163
Fees and charges of subsidiaries
23
23
Consolidated
1,453
1,186
The amounts shown above comply with the limits established by the Board of Directors and approved
at the Annual General Meeting of Shareholders held on March 14, 2017.
9 Investment property
During the year ended December 31, 2012, Management decided, based on the completion of the
property register review and regularization, as well as the perspectives of short and medium term
expansion of operations, to classify certain property as "Investment Property" for future rental
income and capital appreciation. The amounts classified as investment property are R$ 13,227 (R$
13,227 – as at December 31, 2016) at the Company and R$ 18,588 (R$ 17,538 – as at December 31,
2016) in the consolidated statements.
The investment property is stated at historical cost, and for fair value disclosure purposes the
Company contracted an independent expert, who applied a methodology accepted by the Brazilian
Institute of Engineering Appraisals which also uses market evidence related to transaction prices for
similar property and assessed the fair value less cost to sell that property at R$ 50,245 at the
Company and R$ 143,048 consolidated.

Indústrias Romi S.A.
Notes to the quarterly information (ITR)
at March 31, 2017 All amounts in thousands of reais unless otherwise stated
16 of 27
10 Property, plant and equipment
Changes in property, plant and equipment Company and consolidated are as follows:
Company Consolidated
Net book amount at December 31, 2016 193,721 252,033
Additions 3,091 3,394
Disposals (111) (124)
Transfers, net
-
(1,051)
Depreciation (5,982) (7,251)
Foreign exchange gains (losses) - (657)
Net book amount at March 31, 2017 190,719 246,344
As at March 31, 2017
Total cost 502,762 599,973
Accumulated depreciation (312,043) (353,629)
Net book amount
190,719
246,344
Due to the financing agreements with the BNDES for investments in property, plant and equipment,
the Company pledged as collateral machinery and equipment amounting to R$ 163,297 as at March
31, 2017 (R$ 168,228 as at December 31, 2016). These items refer to land, buildings, facilities,
machinery and equipment.
11 Intangible assets
Changes in intangible assets Company and consolidated are as follows:
Company
Consolidated
Net book amount as at December 31, 2016
758
42,846
Additions
613
671
Disposals
-
(73)
Amortization
(58)
(262)
Foreign exchange gains (losses)
-
(884)
Net book amount as at March 31, 2017
1,313
42,298
Total cost
9,228
62,508
Accumulated amortization
(7,914)
(20,210)
Net book amount
1,313
42,298

Indústrias Romi S.A.
Notes to the quarterly information (ITR)
at March 31, 2017 All amounts in thousands of reais unless otherwise stated
17 of 27
12 Borrowings
Changes in borrowings Company and consolidated are as follows:
Company
Consolidated
Local
Local
Foreign
currency
currency
currency
Total
Borrowing balances at
December 31, 2016
183,982
183,982
15,791
199,773
New borrowing
1,801
1,801
-
1,801
Repayment of principal
(9,841)
(9,841)
(2,982)
(12,823)
Payment of interest
(2,894)
(2,894)
(469)
(3,363)
Exchange and monetary variations (principal
and interest)
462
462
(200)
262
Interest at the end of the period
2,923
2,923
-
2,923
Borrowing balances at
March 31, 2017
176,433
176,433
12,140
188,573
Current
94,739
94,739
213
94,952
Noncurrent
81,694
81,694
11,927
93,621
176,433
176,433
12,140
188,573

Indústrias Romi S.A.
Notes to the quarterly information (ITR)
at March 31, 2017 All amounts in thousands of reais unless otherwise stated
18 of 27
The maturities of financing recorded in noncurrent liabilities as at March 31, 2017, in the Company
and consolidated are as follows:
Company
Consolidated
2018 (9 months) 48,177
48,802
2019 12,456
13,620
2020 8,102
18,240
2021 6,035
6,035
2022 onwards 6,924
6,924
Total 81,694
93,621
13 FINAME manufacturer financing
Company and consolidated
March
December
31,
31,
2017
2016
Current
FINAME manufacturer financing
62,025
67,177
Noncurrent
FINAME manufacturer financing
54,406
62,953
Total
116,431
130,130
The agreements related to FINAME Manufacturer Financing are guaranteed by promissory notes and
sureties, and the main guarantor is the subsidiary Rominor. The balances are directly related to the
balances of "Receivables - onward lending of FINAME manufacturer financing" (Note 5), considering
that the loans are directly linked to sales to specific customers. The contractual terms related to the
amounts, charges and periods financed under the program are onlent in full to the financed
customers and amounts received on a monthly basis under the heading Amounts receivable –
onlending FINAME Manufacturer Financing are fully used for the repayment of the related financing
agreements. The Company, therefore, acts as an agent for the financing, but remains as the main
debtor in these transactions.

Indústrias Romi S.A.
Notes to the quarterly information (ITR)
at March 31, 2017 All amounts in thousands of reais unless otherwise stated
19 of 27
The balances of the line item “FINAME manufacturer financing” and, consequently, of the line item
“Receivables - onward lending of FINAME manufacturer financing” as at March 31, 2017 and
December 31, 2016, were adjusted for inflation up to the end of the reporting period. The difference
of R$ 37,684 between these line items as at March 31, 2017 (R$ 39,549 as at December 31, 2016)
refers to past-due trade notes, renegotiations in progress, and FINAME transactions not yet released
by the agent bank. Management understands that there are no risks to the realization of these
receivables, in addition to the amount of the allowance for doubtful accounts already recorded, since
the amounts are collateralized by the financed machinery.
The noncurrent maturities of the FINAME manufacturer financing as at March 31, 2017, Company and
consolidated were as follows:
Company and consolidated
2018 (9 months)
28,646
2019
19,341
2020
6,245
2021
174
Total
54,406

Indústrias Romi S.A.
Notes to the quarterly information (ITR)
at March 31, 2017 All amounts in thousands of reais unless otherwise stated
20 of 27
14 Provision for tax, labor and civil contingencies
Company management based on the opinion of legal counsel, classified the legal proceedings in
accordance with the likelihood of loss as follows:
Company
Consolidated
March
December
March
December
31,
31,
31,
31,
2017
2016
2017
2016
Tax 51,780
51,278
52,459
51,965
Civil 2,241
2,177
2,392
2,380
Labor 2,315
4,204
2,315
4,513
( - ) Judicial deposits (51,171)
(50,565)
(51,171)
(50,565)
Total 5,165
7,094
5,995
8,293
Current liabilities 4,556
6,381
4,556
6,373
Noncurrent liabilities 609
713
1,439
1,920
5,165
7,094
5,995
8,293
For legal proceedings classified as probable losses, Management recognized a provision for losses.
The changes in the provision in the period ended March 31, 2016 are as follows:
December
March
31,
Utilizations/
Monetary
31,
2016
Additions reversals restatement 2017
Tax 51,278
606
(113)
9
51,780
Civil 2,177
2 (3)
65
2,241
Labor 4,204
183
(2,120)
48
2,315
( - ) Judicial deposits (50,565)
(606)
-
-
(51,171)
Total Company 7,094
185
(2,237)
123
5,165
Proceedings at subsidiaries 1,199
-
(361)
(8)
830
Total Consolidated 8,293
185
(2,598)
114
5,995

Indústrias Romi S.A.
Notes to the quarterly information (ITR)
at March 31, 2017 All amounts in thousands of reais unless otherwise stated
21 of 27
As at March 31, 2017, the main legal proceedings which were classified by management as probable
losses based on the opinion of its legal counsel and, therefore, included in the provision for
contingencies are as follows:
(a) Tax proceedings
Refer to the provisions for:
(i) Social Contribution Tax on Gross Revenue for Social Integration Program (PIS) and Social
Contribution Tax on Gross Revenue for Social Security Financing (COFINS) related to State
VAT (ICMS) on sales, which amounted to R$ 9,128 (R$ 9,020 as at December 31, 2016)
and R$ 42,043 (R$ 39,532 as at December 31, 2016), respectively.
(ii) The other tax proceedings total R$ 609 (R$ 713 as at December 31, 2016).
(b) Civil proceedings
These refer to civil proceedings in which the Company is defendant related mainly to the following
claims: (i) revision/termination of contracts; (ii) damages; and (iii) annulment of protest of notes with
losses and damages, among others.
(c) Labor claims
The Company has recorded a provision for contingencies for labor claims in which it is the defendant,
the main causes are as follows: (i) additional overtime due to reduction of lunch break; (ii) health
hazard premium/hazardous duty premium; (iii) stability prior to retirement; (iv) damages for work
related accident/disease; and (v) jointly liability over outsourced companies, among others.
The tax and civil proceedings and labor claims assessed as representing possible losses involve
matters similar to those above. The Company’s management believes that the outcomes of ongoing
legal proceedings shall not result in disbursements higher than those recognized in the provision. The
amounts involved do not qualify as legal obligations.
(d) Judicial deposits
The Company has judicial deposits amounting to R$ 48,560 (R$ 48,588 as at December 31, 2016), of
which R$ 46,473 (R$ 46,473 as at December 31, 2016) refers to PIS and COFINS levied on ICMS on
sales, as mentioned in item (a), and (i) the other deposits are of a different nature and are classified in
noncurrent assets.

Indústrias Romi S.A.
Notes to the quarterly information (ITR)
at March 31, 2017 All amounts in thousands of reais unless otherwise stated
22 of 27
15 Income and social contribution taxes
Income tax is calculated at the rate of 15% on the taxable profits plus a 10% surcharge on taxable
profit exceeding R$240, and social contribution tax is calculated at the rate of 9% on taxable profits.
The subsidiary Rominor pays income tax and social contribution on a presumed profit basis.
The reconciliation of the tax effect on the Company’s profit (loss) before income tax and social
contribution through application of the prevailing tax rates as at March 31, 2017 and 2016 is as
follows:
Company Consolidated
March March March March
31, 31, 31, 31,
2017 2016 2017 2016
Income (loss) before income and social contribution
taxes
2,621
(11,747)
2,799
(13,897)
Statutory rates (income and social contribution taxes) 34% 34% 34% 34%
Income and social contribution tax expenses at
statutory rates
(891)
3,994
(952)
4,725
Reconciliation with the effective rate:
Equity pickup
(324)
(2,254)
-
-
Unrecorded deferred income and social contribution
taxes at subsidiaries
-
-
(494)
(1,028)
Research and development
597
-
597
-
Provision for inventory losses
(668)
427
(668)
427
Management profit sharing
(25)
-
(25)
-
Other additions (deductions), net (a)
(510)
(385)
807
(136)
Current and deferred income and social contribution
tax income (expense)
(606)
1,782
(735)
3,988
(a) The amounts in the Consolidated financial statements refer basically to the differences in the
calculation of income and social contribution taxes between taxable profit based on accounting
Indústrias Romi S.A.
Notes to the quarterly information (ITR)
at March 31, 2017 All amounts in thousands of reais unless otherwise stated
23 of 27
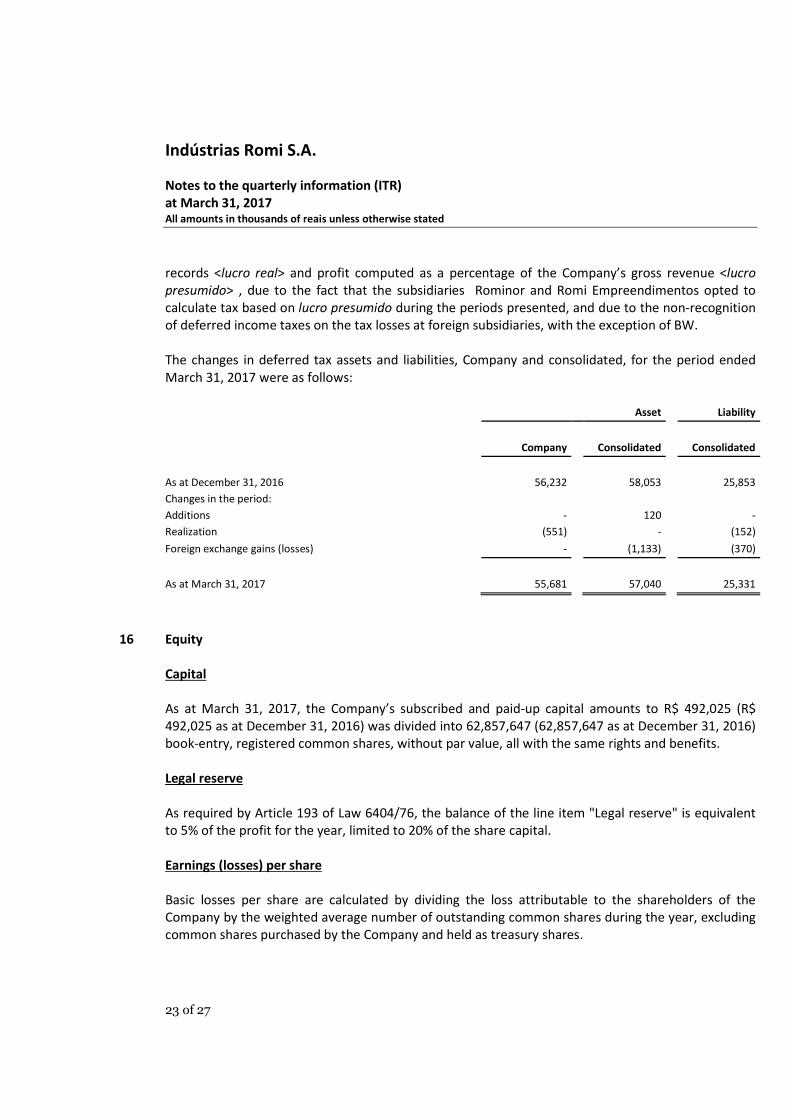
records <lucro real> and profit computed as a percentage of the Company’s gross revenue <lucro
presumido> , due to the fact that the subsidiaries Rominor and Romi Empreendimentos opted to
calculate tax based on lucro presumido during the periods presented, and due to the non-recognition
of deferred income taxes on the tax losses at foreign subsidiaries, with the exception of BW.
The changes in deferred tax assets and liabilities, Company and consolidated, for the period ended
March 31, 2017 were as follows:
Asset Liability
Company Consolidated Consolidated
As at December 31, 2016 56,232 58,053 25,853
Changes in the period:
Additions - 120 -
Realization (551) - (152)
Foreign exchange gains (losses) - (1,133) (370)
As at March 31, 2017 55,681 57,040 25,331
16 Equity
Capital
As at March 31, 2017, the Company’s subscribed and paid-up capital amounts to R$ 492,025 (R$
492,025 as at December 31, 2016) was divided into 62,857,647 (62,857,647 as at December 31, 2016)
book-entry, registered common shares, without par value, all with the same rights and benefits.
Legal reserve
As required by Article 193 of Law 6404/76, the balance of the line item "Legal reserve" is equivalent
to 5% of the profit for the year, limited to 20% of the share capital.
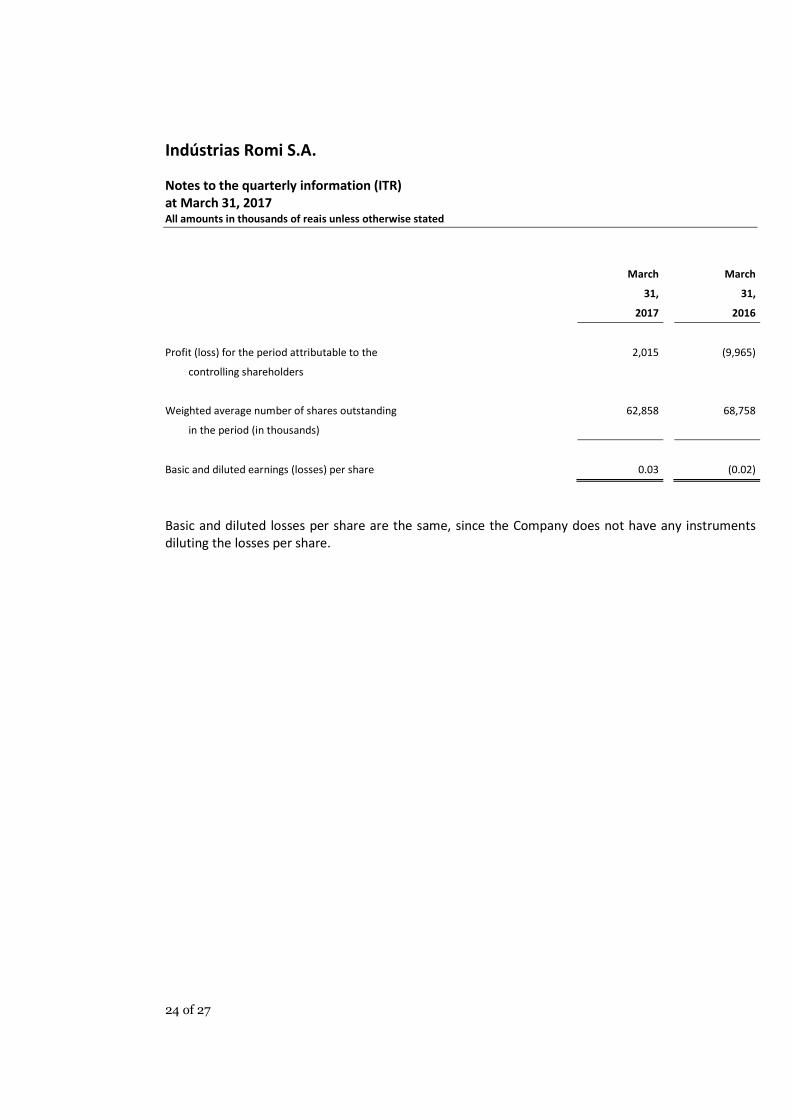
Earnings (losses) per share
Basic losses per share are calculated by dividing the loss attributable to the shareholders of the
Company by the weighted average number of outstanding common shares during the year, excluding
common shares purchased by the Company and held as treasury shares.
Indústrias Romi S.A.
Notes to the quarterly information (ITR)
at March 31, 2017 All amounts in thousands of reais unless otherwise stated
24 of 27
March
March
31,
31,
2017
2016
Profit (loss) for the period attributable to the
2,015
(9,965)
controlling shareholders
Weighted average number of shares outstanding
62,858
68,758
in the period (in thousands)
Basic and diluted earnings (losses) per share
0.03
(0.02)
Basic and diluted losses per share are the same, since the Company does not have any instruments
diluting the losses per share.
Indústrias Romi S.A.
Notes to the quarterly information (ITR)
at March 31, 2017 All amounts in thousands of reais unless otherwise stated
25 of 27
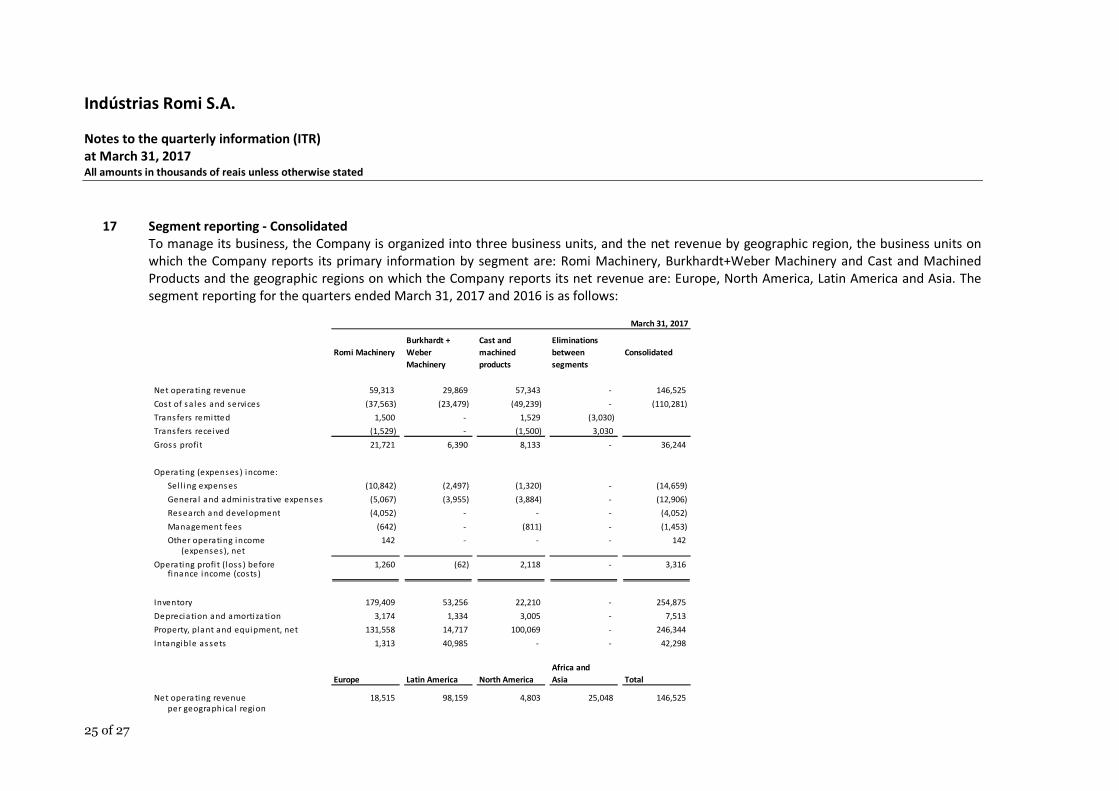
17 Segment reporting - Consolidated
To manage its business, the Company is organized into three business units, and the net revenue by geographic region, the business units on
which the Company reports its primary information by segment are: Romi Machinery, Burkhardt+Weber Machinery and Cast and Machined
Products and the geographic regions on which the Company reports its net revenue are: Europe, North America, Latin America and Asia. The
segment reporting for the quarters ended March 31, 2017 and 2016 is as follows:
March 31, 2017
Romi Machinery
Burkhardt +
Weber
Machinery
Cast and
machined
products
Eliminations
between
segments
Consolidated
Net opera ting revenue 59,313 29,869 57,343 - 146,525
Cost of s a les and services (37,563) (23,479) (49,239) - (110,281)
Trans fers remitted 1,500 - 1,529 (3,030)
Trans fers received (1,529) - (1,500) 3,030
Gros s profi t 21,721 6,390 8,133 - 36,244
Operating (expenses ) income:
Sel l ing expens es (10,842) (2,497) (1,320) - (14,659)
Genera l and adminis tra tive expenses (5,067) (3,955) (3,884) - (12,906)
Res earch a nd development (4,052) - - - (4,052)
Management fees (642) - (811) - (1,453)
Other operating income 142 - - - 142
(expenses), net
Operating profi t (loss ) before 1,260 (62) 2,118 - 3,316 finance income (costs )
Inventory 179,409 53,256 22,210 - 254,875
Depreciation and amortiza tion 3,174 1,334 3,005 - 7,513
Property, plant and equipment, net 131,558 14,717 100,069 - 246,344
Intangible as sets 1,313 40,985 - - 42,298
Europe Latin America North America
Africa and
Asia Total
Net opera ting revenue 18,515 98,159 4,803 25,048 146,525
per geographica l region

Indústrias Romi S.A.
Notes to the quarterly information (ITR)
at March 31, 2017 All amounts in thousands of reais unless otherwise stated
26 of 27
March 31, 2016
Romi Machinery
Burkhardt +
Weber
Machinery
Cast and
machined
products
Eliminations
between
segments Consolidated
Net opera ting revenue 67,573 21,727 40,510 - 129,810
Cost of s a les and services (44,562) (21,420) (37,600) - (103,582)
Transfers remitted 1,450 - 3,324 (4,774) -
Transfers received (3,324) - (1,450) 4,774 -
Gross profit 21,138 307 4,784 - 26,228
Opera ting (expens es) income:
Sel l ing expens es (11,309) (2,830) (839) - (14,978)
General and administrative expenses (10,247) (5,932) (2,983) - (19,162)
Research a nd development (4,134) - - - (4,134)
Ma nagement fees (808) - (378) - (1,186)
Other operating income 661 - - - 661
(expens es), net
Opera ting profit (los s) before (4,699) (8,455) 584 - (12,571)finance income (costs)
Inventory 204,196 40,454 25,238 - 269,888
Depreciation and amorti zation 3,791 1,807 3,344 - 8,942
Property, pla nt a nd equipment, net 107,809 63,385 96,541 - 267,735
Inta ngible a ss ets 366 51,488 - - 51,854
Europe Latin America North America
Africa and
Asia Total
Net opera ting revenue 24,227 86,528 3,290 15,765 129,810
per geogra phical region

Indústrias Romi S.A.
Notes to the quarterly information (ITR)
at March 31, 2017 All amounts in thousands of reais unless otherwise stated
27 of 27
18 Future commitments
On June 15, 2014, the Company and Centrais Elétricas Cachoeira Dourada S.A. - CDSA, belonging to
Endesa, decided to amend the agreement for the supply of electric energy entered into on May 1,
2007, which intended to contract a volume of electric energy according to the current needs of the
Company. As a result, the supply of electric energy has been extended for another four years, up to
December 31, 2018, and reflects the following commitments that will be adjusted annually by the
Extended Consumer Price Index (IPCA):
Year of supply Amount
2017 (9 months) 7,274
2018 7,607
Total 14,881
The Company's management believes that this agreement is compatible with the electric energy
requirements for the contracted period.
* * *

1
1Q17 Earnings Release – Indústrias Romi S.A.
April 25, 2017 1Q17 Earnings Release
March 31, 2017
Share Price ROMI3 - R$3.66 per share (on 04/24/2017)
Market capitalization R$230.1 million US$72.6 million
Number of shares Common: 62,857,647 Total: 62,857,647
Free Float = 45.7%
Investor Relations Contact
Fábio B. Taiar Investor Relations Officer Telephone: +55 (19) 3455-9418 [email protected]
017)
April 26, 2017
Earnings Conference Call Time: 10:00 am
Dial-in numbers: +55 (11) 3193-1001 or (11) 2820-4001
Access code: Romi
Earnings Conference Call in English Time: 12:00 pm (São Paulo)
4:00 pm (London) 11:00 am (New York)
Dial-in numbers: USA +1 (786) 924-6977
Brazil +55 (11) 3193-1001 Other + 1 (888) 700-0802
Access code: Romi

2
1Q17 Earnings Release – Indústrias Romi S.A.
EBIT grows and EBITDA Margin reaches R$10.8 million in 1Q17
§ The Romi machines unit, in 1Q17, reached a positive EBITDA margin of 7.5%, an improvement of 8.8% compared to 1Q16, as result of the operating adjustments and cost and expense reduction carried out in 2016;
§ The German subsidiary B+W, in 1Q17, reported a growth in gross and operating margins of 20.0 and 38.7 percentage points, respectively, when compared to 1Q16, due to a better volume of production and revenues;
§ In 1Q17, compared to the same period of 2016, the Raw and Machined Cast Iron Parts Business Unit presented a growth of 41.6% in operating revenues, and improvement of 2.4 percentage points in gross margin.
§ The orders entry in 1Q17 compared to 1Q16 posted a growth of 17.3%, especially the Romi Machines Business Unit and the Raw and Machined Cast Iron Parts Business Unit, which posted a growth of 15.0% and 21.4%, respectively.
EBITDA = Earnings before interest, taxes, depreciation and amortization.
Quarter
R$’000 1Q16 4Q16 1Q17 Chg. Chg.
Revenues Volume 1Q17/4Q16 1Q17/1Q16
Machines (units) 170 214 162 -24.3% -4.7%
Burkhardt + Weber (units) 3 7 6 -14.3% 100.0%
Raw and Machined Cast Iron Parts (tons) 4,240 5,174 5,784 11.8% 36.4%
Net Operating Revenue 129,810 153,730 146,525 -4.7% 12.9%
Gross margin (%) 20.2% 16.2% 24.7%
Operating Income (EBIT) (12,571) (20,883) 3,316 -115.9% -126.4%
Operating margin (%) -9.7% -13.6% 2.3%
Net Income (9,909) (20,175) 2,064 -110.2% -120.8%
Net margin (%) -7.6% -13.1% 1.4%
EBITDA (3,629) (12,630) 10,829 -185.7% -398.4%
EBITDA margin (%) -2.8% -8.2% 7.4%
Investments 2,425 3,027 4,065 34.3% 67.7%
Santa Bárbara d’Oeste – SP, April 25, 2017 – Indústrias Romi S.A. ("Romi" or "Company") (BM&FBovespa: ROMI3), domestic market leader in the Machine Tools and Plastic Processing Machines markets, as well as an important producer of Raw and Machined Cast Iron Parts, announces its results for the first quarter of 2017 (“1Q17”). Except where otherwise stated, the Company’s operating and financial information is presented on a consolidated basis, in accordance with International Financial Reporting Standards (IFRS).
Highlights

3
1Q17 Earnings Release – Indústrias Romi S.A.
Romi, founded in 1930, is the leader in the Brazilian industrial machinery and equipment market, and an important manufacturer of raw and machined cast iron parts.
The Company is listed on BM&FBovespa’s “New Market”, which is reserved for companies with a
higher level of corporate governance. Romi manufactures machine tools (Conventional Lathes, CNC (Computerized Numerical Control) Lathes, Lathing Centers, Machining Centers, Vertical and Horizontal Heavy and Extra-Heavy Lathes and Drilling Mills), Plastic Injection or Blow Molding Machines, and ductile or CDI gray cast iron parts, which may be supplied in raw or machined form. The Company’s products and services are sold around the world and used by various industrial segments, such as the automotive (light and heavy), agricultural machinery, capital goods, consumer goods, tools, hydraulic equipment and wind power industries, among many others.
The Company has eleven manufacturing units, four of which are dedicated to the final assembly of industrial machinery, two foundries, three units for component machining, one unit for the manufacture of steel sheet components, and one plant for the assembly of electronic control panels. Of these, nine are located in Brazil and two in Germany. The Company has installed capacity to produce approximately 3,500 industrial machines and 50,000 tons of castings per year.
Corporate Profile

4
1Q17 Earnings Release – Indústrias Romi S.A.
The beginning of 2017 still shows a poor economic activity, however, a few signs of a possible recovery of the Brazilian economy, although slow and gradual, could be noticed, such as the evolution of confidence indexes presented below.
In April 2017, the Industrial Entrepreneur Confidence Index – ICEI reached 53.1, after reaching its lowest index at the beginning of 2016, of 36.5 points, as shown below:
Industrial Entrepreneur Confidence Index - ICEI
Source: CNI – UCI, April 2017.
The index of Installed Capacity Utilization – UCI for Brazilian industry in general, as released by the National Industrial Confederation – CNI, continues at quite low levels, reaching percentages slightly higher than those for 2016, which recorded the lowest percentage of the monthly series (beginning in January 2011), demonstrating the challenging time faced by the Brazilian economy.
Average installed capacity utilization
Source: CNI – ICEI, February 2017.
Current Economic Scenario

5
1Q17 Earnings Release – Indústrias Romi S.A.
This scenario, with a high level of uncertainty and volatility, discourages business expansion and impacts negatively the country's investment levels. However, the perspective of controlled inflation and a more competitive interest rate, which foster an adequate return of investments, start creating a more favorable environment for investments, even in a slow and gradual manner.
On the other hand, the appreciation of the Brazilian Real (R$) against the US Dollar (US$) increased the competitiveness of imported equipment, parts and components when compared to those produced locally, affecting the national industry. Such scenario also impacted export margins and the competitiveness of Romi products, which have as main competitors imported equipment.
With this scenario of uncertainties and high volatility, Romi continues to take actions to streamline its structure and the planning and manufacturing process, and respond quickly to the volatility of demand. In 2016 we performed additional optimizations, mainly in indirect structures, reinforced the focus on cost and expense reduction projects and invested in automation and productivity, with the objective of increasing the profitability in 2017, even in a scenario of poor economic activity. The impacts of these measures can already be noticed in the profitability levels of the Company in this first quarter of 2017.
Romi’s main competitive advantages in the domestic market – products with cutting-edge technology, the company’s own nationwide distribution network, ongoing technical assistance, availability of attractive customer credit packages in local currency, and short-term delivery times – are all recognized by customers, giving the ROMI® brand name a traditional and prestigious reputation.
The volume of orders placed in 1Q17 was 17.3% higher than 1Q16, due to the following main factors: (i) growth of 15.0% in order entries in the Romi Machines Business Unit, from the moderate improvement at the beginning of 2017; and (ii) growth of 21.4% in order entry of the Raw and Machined Cast Iron Parts Business Unit.
* The orders backlog figures do not include parts, service nor resales.
As at March 31, 2017, the orders backlog amounted to R$248.4 million, 5.1% higher than the backlog at the end of 1Q16 and 1.5% below the amount posted in 4Q16. The decrease in the backlog at the end of 1Q17, when compared to 4T16, was mainly due to the German subsidiary B+W, which delivered backlog machines, according to the revenue schedule.
Order Entry (R$ 000)Gross Values, sales taxes included
1Q16 4Q16 1Q17Chg.
1Q17/4Q16
Chg.
1Q17/1Q16
Romi Machines 58,956 55,612 67,773 21.9% 15.0%
Burkhardt+Weber Machines 8,958 30,679 9,711 -68.3% 8.4%
Rough and Machined Cast Iron Parts 52,435 49,194 63,647 29.4% 21.4%
Total 120,349 135,485 141,131 4.2% 17.3%
Order Book (R$ 000)Gross Values, sales taxes included
1Q16 4Q16 1Q17Chg.
1Q17/4Q16
Chg.
1Q17/1Q16
Romi Machines 75,862 53,339 64,304 20.6% -15.2%
Burkhardt+Weber Machines 57,062 125,774 109,251 -13.1% 91.5%
Rough and Machined Cast Iron Parts 103,277 72,943 74,808 2.6% -27.6%
Total * 236,201 252,057 248,363 -1.5% 5.1%
Market

6
1Q17 Earnings Release – Indústrias Romi S.A.
NET OPERATING REVENUES
Net operating revenues posted by the Company in 1Q17 reached R$146.5 million, 12.9% higher than in 1T16. This increase was mainly due to the revenues of the German subsidiary B+W, which ended 2016 with a relevant growth in its backlog of orders, which are being delivered in 2017, and the Raw and Machined Cast Iron Parts Business Unit which has been increasing its revenue volume since the beginning of 2016.
The domestic market accounted for 64% of Romi’s consolidated revenues in 1Q17, very similar to 1Q16 (65%). Regarding the foreign market, Asia represented 17% of revenues in 1Q17 due to a significant delivery of machines from the German subsidiary B+W to China. Considering the revenue obtained in the foreign market, which takes into account the sales by Romi's subsidiaries abroad (Germany, Asia, United States, Italy, United Kingdom, France, Mexico and Spain) the breakdown of Romi's total revenue, by geographical region, was:
1Q16 1Q17
Below, we show the revenues obtained in the foreign market, in Brazilian Reais (R$) and US Dollars (US$):
Foreign Sales Quarter
1Q16 4Q16 1Q17Chg.
1Q17/4Q16
Chg.
1Q17/1Q16
Net Sales (R$ million) 45.5 59.9 52.1 -13.0% 14.7%
Net Sales (US$ million) 12.8 18.4 16.5 -10.5% 28.8%
Operating Performance

7
1Q17 Earnings Release – Indústrias Romi S.A.
Romi Machinery
The net operating revenues of this Business Unit reached R$59.3 million in 1Q17, a decrease of 12.2% compared to 1Q16, showing that the domestic scenario is still presenting a low investment level. Foreign market revenues are still showing expansion, and increased 28.8%, in US Dollars, in 1Q17, when compared to 1T16.
Burkhardt+Weber Machinery
Revenues of the German subsidiary B+W in 1Q17, when compared to 1Q16, increased 37.5%. Such increase in revenue volume is within the expectation and revenue schedule for 2017, which demonstrates a solid backlog order of this subsidiary for 2017.
Raw and Machined Cast Iron Parts
In 1Q17, the net operating revenues of this Business Unit were R$57.3 million, which represents an increase of 41.6% compared to 1Q16, showing a good volume of activity for this Business Unit, driven by large castings and machined parts
OPERATING COSTS AND EXPENSES
The gross margin achieved in 1Q17, of 24.7%, posted an increase of 4.5% compared to 1Q16, as a result of the operating adjustments carried out in 2016. Such adjustments also positively impacted the operating margin (EBIT), which in 1Q17, when compared to 1Q16, presented growth of 11.9 percentage points.
Romi Machinery
The gross and operating margins of this Business Unit, in 1Q17, reported an increase of 5.3 and 9.1 percentage points when compared to 1Q16, due to the operating adjustments carried out in 2016. On the other hand, the appreciation of the Brazilian currency (Real) throughout 2017 impacted the export margins in 1Q17.
Burkhardt+Weber Machinery
In this Business Unit, the gross margin in 1Q17 was 21.4%, which represents an increase of 20.0% in relation to 1Q16, due to the greater operation and revenue volume.
Quarter
Gross Margin 1Q16 4Q16 1Q17Var. p.p.
1Q17/4Q16
Var. p.p.
1Q17/1Q16
Romi Machines 31.3% 19.0% 36.6% 17.6 5.3
Burkhardt+Weber Machines 1.4% 22.7% 21.4% (1.3) 20.0
Raw and Machined Cast Iron Parts 11.8% 8.6% 14.2% 5.6 2.4
Total 20.2% 16.2% 24.7% 8.5 4.5
Quarter
EBIT Margin 1Q16 4Q16 1Q17Var. p.p.
1Q17/4Q16
Var. p.p.
1Q17/1Q16
Romi Machines -7.0% -33.1% 2.1% 35.2 9.1
Burkhardt+Weber Machines -38.9% 7.1% -0.2% (7.3) 38.7
Raw and Machined Cast Iron Parts 1.4% -1.9% 3.7% 5.6 2.3
Total -9.7% -13.6% 2.3% 15.9 11.9

8
1Q17 Earnings Release – Indústrias Romi S.A.
Raw and Machined Cast Iron Parts
The gross margin of this Business Unit in 1Q17 was 14.2%, an increase of 2.4% in relation to 1Q16, mainly due to a greater revenue volume.
EBITDA AND EBITDA MARGIN
In 1Q17, the operating cash generation as measured by EBITDA was R$10.8 million, representing an EBITDA margin of 7.4% in the quarter, as shown in the table below:
PROFIT FOR THE PERIOD
Profit was R$2.1 million in 1Q17.
The main changes in the net debt position during 1Q17 are described below in R$'000:
The balances of “FINAME Manufacturer Financing” are not used to calculate the Company’s net debt.
Inventories
The variation in inventories was caused mainly by the efforts and actions to reduce inventory levels in the Brazilian operation.
Reconciliation of
Net Income to EBITDAQuarter
(R$ 000) 1Q16 4Q16 1Q17Chg.
1Q17/4Q16
Chg.
1Q17/1Q16
Net Income (9,909) (20,175) 2,064 -110.2% -120.8%
Income tax and social contributions (3,988) (2,321) 735 -131.7% -118.4%
Net Financial Income 1,326 1,613 517 -67.9% -61.0%
Depreciation and amortization 8,942 8,253 7,513 -9.0% -16.0%
EBITDA (3,629) (12,630) 10,829 -185.7% -398.4%
EBITDA Margin -2.8% -8.2% 7.4% 0.16 0.10
Total Net Operating Revenue 129,810 153,732 146,525 -4.7% 12.9%
Evolution of net cash (debt) position

9
1Q17 Earnings Release – Indústrias Romi S.A.
Trade accounts receivable
The increase was mainly due to the increase in revenue volume of the Raw and Machine Cast Iron Parts Unit.
Trade accounts payable
Projects of leadtime reduction, with a better production planning, resulted in a decrease in purchase volume.
Short-term investments, including those backed by debentures, are made with financial institutions with low credit risk and their yield is substantially indexed to the interbank deposit rate (“CDI”). The consolidated position of cash and cash equivalents (debt) as at March 31, 2017 was R$80.0 million.
The Company’s borrowings are used mainly in investments in the modernization of the industrial facilities, research and development of new products, and financing of exports and imports. As at March 31, 2017, the financing in local currency amounted to R$176.4 million, and in foreign currency to R$12.1 million, totaling R$188.6 million.
The balances of “FINAME Manufacturer Financing” are not used to calculate the Company’s net debt.
As at March 31, 2017, the Company did not have any derivative transactions.
Financial Position

10
1Q17 Earnings Release – Indústrias Romi S.A.
Source: BM&FBovespa.
At April 24, 2017, Romi’s common shares (ROMI3) were traded at R$3.66, posting appreciation of 38.1% since December 31, 2016 and 136.1% since March 31, 2016. The BM&FBovespa Index posted appreciation of 8.1% and 28.6% in the same period. The Company’s market capitalization as at April 24, 2017 was R$230.1 million. The average daily trading volume in 1Q17 was R$317.5.
Share Performance ROMI3 vs. Ibovespa
From 04/01/2015 to 04/24/2017
0
50
100
150
200
Apr-15 Jun-15 Sep-15 Dec-15 Mar-16 Jun-16 Sep-16 Dec-16 Mar-17
Romi Volume Ibovespa
IBOV: 25.9%
ROMI3: 50.6%
Capital Market
11
1Q17 E
arnin
gs R
elease – Ind
ústrias R
om
i S.A
.
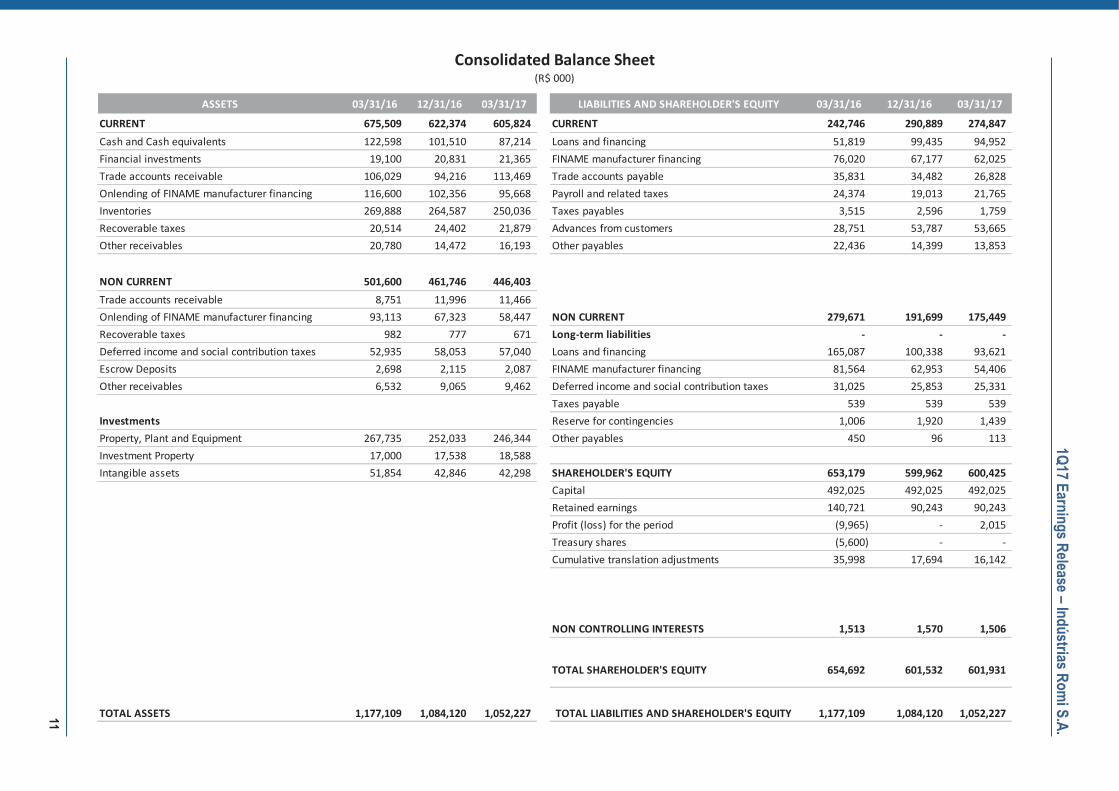
ASSETS 03/31/16 12/31/16 03/31/17 LIABILITIES AND SHAREHOLDER'S EQUITY 03/31/16 12/31/16 03/31/17
CURRENT 675,509 622,374 605,824 CURRENT 242,746 290,889 274,847
Cash and Cash equivalents 122,598 101,510 87,214 Loans and financing 51,819 99,435 94,952
Financial investments 19,100 20,831 21,365 FINAME manufacturer financing 76,020 67,177 62,025
Trade accounts receivable 106,029 94,216 113,469 Trade accounts payable 35,831 34,482 26,828
Onlending of FINAME manufacturer financing 116,600 102,356 95,668 Payroll and related taxes 24,374 19,013 21,765
Inventories 269,888 264,587 250,036 Taxes payables 3,515 2,596 1,759
Recoverable taxes 20,514 24,402 21,879 Advances from customers 28,751 53,787 53,665
Other receivables 20,780 14,472 16,193 Other payables 22,436 14,399 13,853
NON CURRENT 501,600 461,746 446,403
Trade accounts receivable 8,751 11,996 11,466
Onlending of FINAME manufacturer financing 93,113 67,323 58,447 NON CURRENT 279,671 191,699 175,449
Recoverable taxes 982 777 671 Long-term liabilities - - -
Deferred income and social contribution taxes 52,935 58,053 57,040 Loans and financing 165,087 100,338 93,621
Escrow Deposits 2,698 2,115 2,087 FINAME manufacturer financing 81,564 62,953 54,406
Other receivables 6,532 9,065 9,462 Deferred income and social contribution taxes 31,025 25,853 25,331
Taxes payable 539 539 539
Investments Reserve for contingencies 1,006 1,920 1,439
Property, Plant and Equipment 267,735 252,033 246,344 Other payables 450 96 113
Investment Property 17,000 17,538 18,588
Intangible assets 51,854 42,846 42,298 SHAREHOLDER'S EQUITY 653,179 599,962 600,425
Capital 492,025 492,025 492,025
Retained earnings 140,721 90,243 90,243
Profit (loss) for the period (9,965) - 2,015
Treasury shares (5,600) - -
Cumulative translation adjustments 35,998 17,694 16,142
NON CONTROLLING INTERESTS 1,513 1,570 1,506
TOTAL SHAREHOLDER'S EQUITY 654,692 601,532 601,931
TOTAL ASSETS 1,177,109 1,084,120 1,052,227 TOTAL LIABILITIES AND SHAREHOLDER'S EQUITY 1,177,109 1,084,120 1,052,227
Consolidated Balance Sheet(R$ 000)

12
1Q17 Earnings Release – Indústrias Romi S.A.
1Q16 4Q16 1Q17Chg.
1Q17/4Q16
Chg.
1Q17/1Q16
Net Operating Revenue 129,810 153,732 146,525 -4.7% 12.9%
Cost of Goods Sold (103,582) (128,836) (110,281) -14.4% 6.5%
Gross Profit 26,228 24,896 36,244 45.6% 38.2%
Gross Margin % 20.2% 16.2% 24.7% 8.5% 4.5%
Operating Expenses (38,799) (45,779) (32,928) -28.1% -15.1%
Selling expenses (14,978) (20,582) (14,659) -28.8% -2.1%
Research and development expenses (4,134) (6,282) (4,052) -35.5% -2.0%
General and administrative expenses (19,162) (16,445) (12,906) -21.5% -32.6%
Management profit sharing and compensation (1,186) (1,327) (1,453) 9.5% 22.5%
Other operating income, net 661 (1,143) 142 -112.4% -78.5%
Operating Income before Financial Results (12,571) (20,883) 3,316 -115.9% -126.4%
Operating Margin % -9.7% -13.6% 2.3% 15.8% 11.9%
Financial Results, Net (1,326) (1,613) (517) -67.9% -61.0%
Financial income 4,192 4,940 4,285 -13.3% 2.2%
Financial expenses (3,741) (5,248) (4,067) -22.5% 8.7%
Exchance gain (loss), net (1,777) (1,305) (735) -43.7% -58.6%
Operations Operating Income (13,897) (22,496) 2,799 -112.4% -120.1%
Income tax and social contribution 3,988 2,321 (735) -131.7% -118.4%
Net income (9,909) (20,175) 2,064 -110.2% -120.8%
Net Margin % -7.6% -13.1% 1.4% 14.5% 9.0%
Net profit concerning:
Controlling interests (9,965) (20,231) 2,015 -110.0% -120.2%
Non controlling interests 56 56 49 -12.5% -12.5%
EBITDA (3,629) (12,630) 10,829 -185.7% -398.4%
Loss for the period (9,909) (20,175) 2,064 -110.2% -120.8%
Income tax and social contribution (3,988) (2,321) 735 -131.7% -118.4%
Financial income, net 1,326 1,613 517 -67.9% -61.0%
Depreciation and amortization 8,942 8,253 7,513 -9.0% -16.0%
EBITDA Margin % -2.8% -8.2% 7.4% 15.6% 10.2%
Nº of shares in capital stock (th) 68,758 62,858 62,858 0.0% -8.6%
Profit (loss) per share - R$ (0.14) (0.32) 0.03 -110.0% -122.1%
Consolidated Income Statement(R$ thousand)
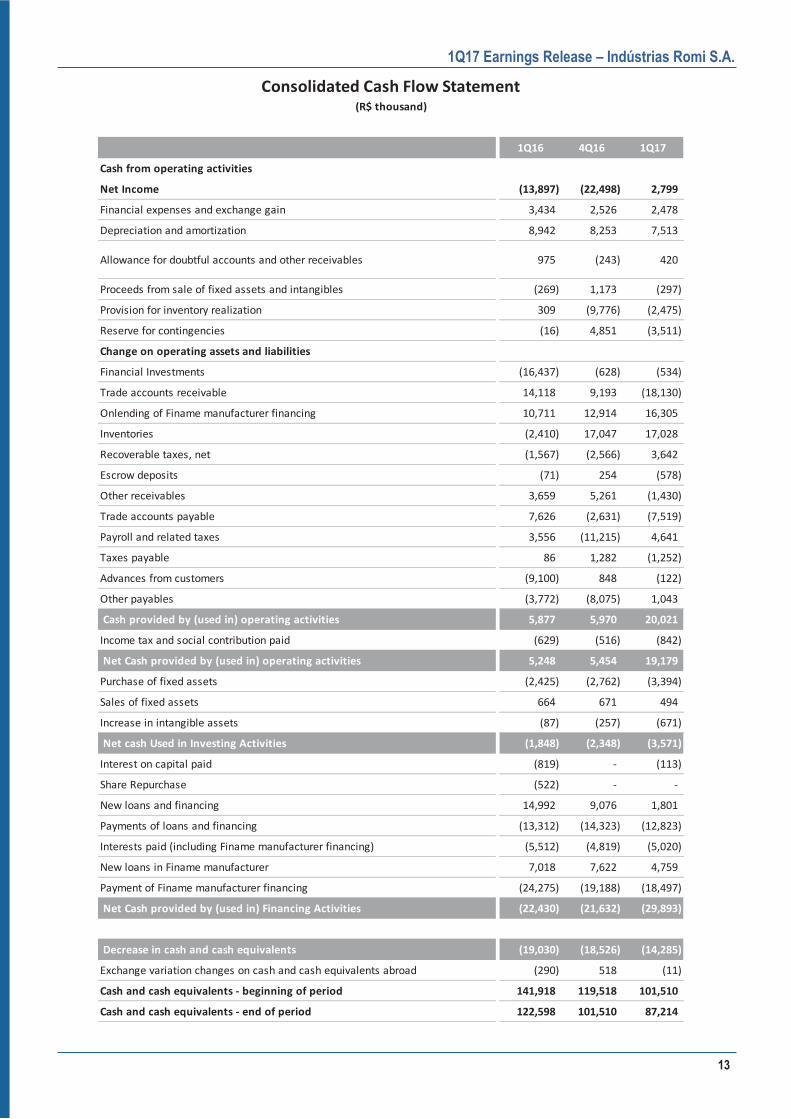
13
1Q17 Earnings Release – Indústrias Romi S.A.
1Q16 4Q16 1Q17
Cash from operating activities
Net Income (13,897) (22,498) 2,799
Financial expenses and exchange gain 3,434 2,526 2,478
Depreciation and amortization 8,942 8,253 7,513
Allowance for doubtful accounts and other receivables 975 (243) 420
Proceeds from sale of fixed assets and intangibles (269) 1,173 (297)
Provision for inventory realization 309 (9,776) (2,475)
Reserve for contingencies (16) 4,851 (3,511)
Change on operating assets and liabilities
Financial Investments (16,437) (628) (534)
Trade accounts receivable 14,118 9,193 (18,130)
Onlending of Finame manufacturer financing 10,711 12,914 16,305
Inventories (2,410) 17,047 17,028
Recoverable taxes, net (1,567) (2,566) 3,642
Escrow deposits (71) 254 (578)
Other receivables 3,659 5,261 (1,430)
Trade accounts payable 7,626 (2,631) (7,519)
Payroll and related taxes 3,556 (11,215) 4,641
Taxes payable 86 1,282 (1,252)
Advances from customers (9,100) 848 (122)
Other payables (3,772) (8,075) 1,043
Cash provided by (used in) operating activities 5,877 5,970 20,021
Income tax and social contribution paid (629) (516) (842)
Net Cash provided by (used in) operating activities 5,248 5,454 19,179
Purchase of fixed assets (2,425) (2,762) (3,394)
Sales of fixed assets 664 671 494
Increase in intangible assets (87) (257) (671)
Net cash Used in Investing Activities (1,848) (2,348) (3,571)
Interest on capital paid (819) - (113)
Share Repurchase (522) - -
New loans and financing 14,992 9,076 1,801
Payments of loans and financing (13,312) (14,323) (12,823)
Interests paid (including Finame manufacturer financing) (5,512) (4,819) (5,020)
New loans in Finame manufacturer 7,018 7,622 4,759
Payment of Finame manufacturer financing (24,275) (19,188) (18,497)
Net Cash provided by (used in) Financing Activities (22,430) (21,632) (29,893)
Decrease in cash and cash equivalents (19,030) (18,526) (14,285)
Exchange variation changes on cash and cash equivalents abroad (290) 518 (11)
Cash and cash equivalents - beginning of period 141,918 119,518 101,510
Cash and cash equivalents - end of period 122,598 101,510 87,214
Consolidated Cash Flow Statement(R$ thousand)

14
1Q17 Earnings Release – Indústrias Romi S.A.
Income Statement by Business Units - 1Q17
R$ 000 Romi
Machines
Burkhardt +
Weber
Machines
Raw and
Machined
Cast Iron
Total
Net Operating Revenue 59,313 29,869 57,343 146,525
Cost of Sales and Services (37,563) (23,479) (49,239) (110,281)
Business Units Transfers 1,500 - 1,529 3,030
Business Units Transfers (1,529) - (1,500) (3,030)
Gross Profit 21,721 6,390 8,133 36,244
Gross Margin % 36.6% 21.4% 14.2% 24.7%
Operating Expenses (20,461) (6,452) (6,015) (32,928)
Selling (10,842) (2,497) (1,320) (14,659)
General and Administrative (5,067) (3,955) (3,884) (12,906)
Research and Development (4,052) - - (4,052)
Management profit sharing (642) - (811) (1,453)
Other operating revenue 142 - - 142
Operating Income before Financial Results 1,260 (62) 2,118 3,316
Operating Margin % 2.1% -0.2% 3.7% 2.3%
Depreciation and amortization 3,174 1,334 3,005 7,513
EBITDA 4,434 1,272 5,123 10,829
EBITDA Margin % 7.5% 4.3% 8.9% 7.4%
Income Statement by Business Units - 1Q16
R$ 000 Romi
Machines
Burkhardt +
Weber
Machines
Raw and
Machined
Cast Iron
Total
Net Operating Revenue 67,574 21,727 40,510 129,810
Cost of Sales and Services (44,562) (21,420) (37,600) (103,582)
Business Units Transfers 1,450 - 3,324 4,774
Business Units Transfers (3,324) - (1,450) (4,774)
Gross Profit 21,138 307 4,784 26,227
Gross Margin % 31.3% 1.4% 11.8% 20.2%
Operating Expenses (25,837) (8,762) (4,200) (38,799)
Selling (11,309) (2,830) (839) (14,978)
General and Administrative (10,247) (5,932) (2,983) (19,162)
Research and Development (4,134) - - (4,134)
Management profit sharing (808) - (378) (1,186)
Other operating revenue 661 - - 661
Operating Income before Financial Results (4,699) (8,455) 584 (12,571)
Operating Margin % -7.0% -38.9% 1.4% -9.7%
Depreciation and amortization 3,791 1,807 3,344 8,942
EBITDA (908) (6,648) 3,928 (3,629)
EBITDA Margin % -1.3% -30.6% 9.7% -2.8%
Annex I – DRE by Business Unit

15
1Q17 Earnings Release – Indústrias Romi S.A.
Balance Sheet B+W
(€ 000)
ASSETS 03/31/16 12/31/16 03/31/17
CURRENT 17,134 23,072 24,567
Cash and Cash equivalents 91 2,897 1,683
Trade accounts receivable 6,773 5,863 6,431
Inventories 9,108 13,193 15,009
Recoverable taxes 966 745 987
Related Parties 34 219 181
Other receivables 162 155 275 - - -
NONCURRENT 28,367 27,201 26,859
Long-Term Assets - - -
Other receivables - - -
Investments
Property, Plant and Equipment, net 15,639 14,911 14,717
Investment in Subsidiaries and Associate Companies 24 46 46
Intangible assets 12,704 12,244 12,096
TOTAL ASSETS 45,501 50,274 51,426
LIABILITIES AND SHAREHOLDER'S EQUITY 03/31/16 12/31/16 03/31/17
CURRENT 9,974 15,935 17,355
Loans and financing 1,799 - -
Trade accounts payable 545 1,166 1,347
Payroll and related taxes 800 551 1,183
Taxes payable 146 157 -
Advances from customers 4,817 12,515 13,084
Other payables 1,844 1,447 1,588
Related Parties 24 98 153 - - -
NON CURRENT 9,313 8,521 8,338
Long-term liabilities - - -
Loans and financing 4,317 3,659 3,520
Deferred income and social contribution taxes 4,996 4,862 4,817 - - -
SHAREHOLDER'S EQUITY 26,213 25,818 25,733
Capital 7,025 7,025 7,025
Capital reserve 505 505 505
Accumulated defict 18,683 18,288 18,203 - - -
TOTAL LIABILITIES AND SHAREHOLDER'S EQUITY 45,501 50,274 51,426
Annex II – Financial Statements of B+W

16
1Q17 Earnings Release – Indústrias Romi S.A.
Statements contained in this release related to Romi’s business outlook, projections of operating and financial results, and references to the Company’s growth potential are mere forecasts and have been based on Management’s expectations regarding its future performance. These expectations are highly dependent upon market behavior, economic conditions in Brazil, the industry and international markets. Therefore, they are subject to changes.
(€ 000)
1Q16 4Q16 1Q17
Net Operating Revenue 5,052 9,360 8,937
Cost of Goods Sold (4,971) (7,238) (7,026)
Gross Profit 81 2,122 1,911
Gross Margin % 1.6% 22.7% 21.4%
Operating Expenses (2,034) (1,454) (1,926)
Selling expenses (665) (593) (747)
General and administrative expenses (1,369) (861) (1,179)
Operating Income before Financial Results (1,953) 668 (15)
Operating Margin % -38.7% 7.1% -0.2%
Financial Results, Net (30) (58) (105)
Operations Operating Income (1,983) 610 (120)
Income tax and social contribution 573 (321) 35
Net income (1,410) 289 (85)
Net Margin % -27.9% 3.1% -1.0%
EBITDA (1,425) 1,175 492
Net income / loss for the period (1,410) 289 (85)
Income tax and social contribution (573) 321 (35)
Financial income, net 30 58 105
Depreciation and amortization 528 507 507
EBITDA Margin % -28.2% 12.6% 5.5%
B+W Income Statement
Top Related