


Languages
Pages
Legal


THIS REPORT CONTAINS ASSESSMENTS OF COMMODITY AND TRADE ISSUES MADE BY
USDA STAFF AND NOT NECESSARILY STATEMENTS OF OFFICIAL U.S. GOVERNMENT
POLICY
-
Date:
GAIN Report Number:
Post:
Report Categories:
Approved By:
Prepared By:
Report Highlights:
Guar gum has emerged as India’s largest agricultural export to the United States on strong demand from
the oil/gas extraction industry for hydraulic fracturing of subsurface shale. India is the world’s largest
producer of guar bean (cluster bean), largely cultivated in semi-arid tracts of Rajasthan under rainfed
conditions. A study by CCS National Institute of Agriculture Marketing (NIAM) reveals that the guar
bean area and productivity shows sharp fluctuation based on the rainfall during sowing (June/July). Guar
prices during the previous season also influence guar planting. Guar beans can be stored for long periods
(3-6 years), and thus, stocks maintained by traders/processors play a vital role in price discovery. The bulk
consumption of guar bean/gum has shifted from food use to industrial use in recent years.
Santosh K Singh
Allan Mustard
Grain and Feed
An Analysis of Guar Crop in India
New Delhi
India
IN4035
5/6/2014
Public Voluntary

General Information:
Background
India is the world’s largest producer of guar bean (cluster bean) with an estimated 80% of guar bean
production, and thus of guar gum. As a result of expansion of the shale oil and gas industry, demand
soared and the value of guar gum exports to the United States rose to nearly a billion dollars in 2011,
further to $3.4 billion in 2012 and then came down to $1.6 billion in 2013. However, guar bean
production, area planted, and yield data are incomplete, and in any current (ongoing) year, production
estimates are nonexistent. The absence of reliable and accurate information is reflected in price swings
that have taken guar prices to a high of INR 320,000 per metric ton (approximately $6,000 per metric ton)
and a low of under INR 50,000 per metric ton in one season.
Recognizing the need for improved market information for this commodity, currently India’s largest
agricultural export to the United States, the Office of Agricultural Affairs, New Delhi, commissioned a
study by the CCS National Institute of Agriculture Marketing, Jaipur, to estimate India’s historical guar
(cluster bean) and guar gum production, supply, and distribution; and to determine factors that can be used
to estimate more accurately current crop area and yield during the course of the vegetative season.
The CCS National Institute of Agriculture Marketing, Jaipur submitted the report “An Analysis of
Performance of Guar Crop in India” in April 2014. The study is reproduced below.

AN ANALYSIS OF PERFORMANCE
OF GUAR CROP IN INDIA
(2013-14)
Prepared by
CCS National Institute of Agricultural Marketing
www.ccsniam.gov.in
Prepared for
United States Department of Agriculture
www.usda.gov

0
AN ANALYSIS OF PERFORMANCE OF
GUAR CROP IN INDIA
April, 2014
Research Coordinators
Hema Yadav, Deputy Director, NIAM
Shalendra, Research Officer, NIAM
Research Associates
Enamul Haque
Ajit Kumar Prasad
Anu Peter V
Manisha Shah
Pratima Goswami
Rahul
Sandesh V Pednekar
Report prepared by NIAM, Jaipur for United States Department of Agriculture
(USDA), New Delhi

i
ACKNOWLEDGEMENT
The research study entitled 'An Analysis of Performance of Guar in India' has been conducted for the
Office of Agriculture Affairs, USDA, American Embassy, New Delhi. The research team is grateful to
Mr Allan Mustard, Minister-Counselor for Agricultural Affairs, USDA, American Embassy, New
Delhi for offering the research assignment to NIAM. The discussions with Mr Mustard and Dr
Santosh Kumar Singh, USDA, New Delhi have been useful in finalizing this report. NIAM
acknowledges the technical and financial support received from USDA, American Embassy, New
Delhi.
We would like to express our thanks to officials of Department of Agriculture, Government of
Rajasthan, Rajasthan State Agricultural Marketing Board, Indian Meteorological Department,
Regional Centre, Rajasthan Agricultural Research Institute for providing relevant information on the
subject.
We would also like to thank NCDEX, Jaipur, Guar Global, Jaipur, Supreme Gum, Jaipur and
various other stakeholders mainly from Ganganager, Jaipur, Sikar, Jodhpur, Bikner, etc for
providing insights of the Industry. We are also thankful to the producers of guar mainly from Jaipur
and Sikar for sharing useful information on marketing and production of guar.
The expert suggestions of Dr D Kumar, Retired Principal Scientist from CAZRI, Jodhpur and Dr Ved
Prakash, Principal Scientist, RARI, Durgapura have been of immense help in understanding
cultivation practices and various research and development undertaken by scientists. The same is
duly acknowledged.
Our sincere thanks are also due to Dr M S Jairath, Director (R&C) for his guidance and support in
completing this research report.
We would also like to take this opportunity to acknowledge the valuable suggestions made by fellow
faculty members in improving the quality of this report.
The authors are also sincerely thankful to the Director General for providing the inspiration and
support to take up the study on such a vital topic.
(Dr Hema Yadav and Dr Shalendra)

ii
Table of Contents
Chapter Page Number
Summary.......................................................................................................... i-iv
Introduction……………………………………………………….………… 1-6
Profile of Guar……………………………………………………….……… 7-16
Guar Cultivation Practices………………………………………………..…. 17-31
Determinants Influencing Guar Supply: An Analysis of Rajasthan………… 32-41
Marketing and Distribution of Guar….…………………...………………… 42-47
Processing and Usage of Guar …………………........................................ 48-54
Price and Trade of Guar ……………………………………..……………… 55-63
Issues in Guar industry and trade in India ………...................................... 64-66
Annexure………………………………………………………………..…… 67-79
References…………………………………………………………………… 80-81

iii
List of Tables
Table
No. Table Name
Page
No.
1 Area, production and yield of Guar in recent past 8
2 Area, production and yield of Guar in Rajasthan 11
3 Leading Guar producing districts in Rajasthan (TE 2011-12) 12
4 Leading Guar producing states in India 13
5 Optimum sowing time for Guar in different seasons 20
6 Plant population with respect to location and rainfall 21
7 Effect of seed rate on yield and quality of Guar seed cv HG 365 21
8 Effect of Iron and Zinc spray on seed yield of Guar 23
9 Region wise high input (HITs) and low input technologies (LITs) for Guar 25
10 Region-wise area, productivity and proposed enhanced productivity of Guar in
Rajasthan through LITs
26
11 Improved varieties of Guar suitable for different cropping regions of
Rajasthan
29
12 Characteristics of different varieties of Guar in terms of maturity, plant height,
pods per plant and seeds per pod
31
13 Regression results for the Guar supply response 35
14 Regression results for the Guar yield supply response 38
15 The rainfall requirement with respect to growth state of guar crop 41
16 The optimum temperature requirement for achieving maximum productivity
of guar
41
17 Major APMC trading centres for Guar seed in India 42
18 Consumption of Guar bean in equivalent-term 46
19 Constituents of Guar grain 48
20 Realization of different product from processing of Guar bean 50
21 Industry-wise applications guar derivatives 51
22 Application-wise global consumption of Guar derivatives 53
23 Volatility in Guar seed prices 56
24 Volume and value of trade on commodity exchange 57
25 High-Low difference in Guar bean prices in India (INR/qt) 57
26 Impact on spot price of Guar due to variation in factors (in short run) 58
27 Export of Guar derivatives from India 59
28 Major exporting countries of mucilages and thickeners 60
29 Major importing countries of mucilages and thickeners 61
30 Share of USA in total export of Guar and its derivatives from India 62
31 Carry over stock of Guar bean over years (million tones) 63
32 Issues and suggestions to strengthen Guar industry in India 65

iv
List of Figures
Figure
No. Figure Name
Page
No
Fig-1 Growth of Guar during last decade 3
Fig-2 India's share in world Guar production 7
Fig-3 Share of different states in Guar bean production in India 8
Fig-4 Area and production of Guar in India 10
Fig-5 Area and production of Guar in Rajasthan 12
Fig-6 Area and production of Guar in Haryana 14
Fig-7 Share of different states in production of Guar 15
Fig-8 Share of different states in area under Guar 15
Fig-9 Crop cycle of Guar 17
Fig-10 Life cycle of Guar 18
Fig-11 Effect of different components on grain yield of Guar FLDs during 2002-07 40
Fig-12 Supply chain of Guar 44
Fig-13 Distribution of Guar seed produced 45
Fig-14 Past and present Guar usage pattern of industries 46
Fig-15 Steps in processing of Guar seed 49
Fig-16 Movement of price determining factors at Sri Ganganagar market 58
Fig-17 Growth of exports to USA vis-a-vis world over years 62
Summary

v
India is the largest producer of Guar and contributes 80 percent of total Guar production in the world.
Guar crop is cultivated mainly during Kharif season. Total production of Guar bean in India is
estimated to have crossed 2.7 million metric tons during the agricultural year 2013-14.
Guar crop has experienced a remarkable journey from a traditional crop grown on marginal lands
mainly for food, animal feed and fodder to a crop with various industrial usages ranging from food,
cosmetics, printing, pharma textile, etc. The unique binding, thickening and emulsifying property of
guar gum powder obtained from guar seed has made it a much sought after product in international
market. The United State of America is the largest importer of Guar and its derivatives from India.
What had been a minor crop with limited business interest and virtually no need for analysis became
in two years India’s largest agricultural export to the United States.
The area, production and yield of the crop are inconsistent due to its overdependence on weather and
production confined to limited geographical area largely arid regions Guar bean yields vary by as
much as 300 percent year on rainfall and weather conditions, making production forecasting
extremely difficult compared to other field crops. The Guar crop does not respond to fertilization or
to irrigation, and excess rainfall can adversely affect yields. Hence there is a need for analysis of
factors influencing yields to enable more accurate estimation of production during the season and
just after harvest.
Guar has also witnessed price volatility and uncertainty owing to limited area of production,
increasing demand, speculation, lack of reliable market information system etc. In order to
understand better the Indian Guar industry this study has been undertaken for the U S Department of
Agriculture with the objective to establish a production, supply and distribution (PS&D) baseline for
Guar bean and gum in India, to determine input factors that can be used to estimate production in a
given crop year before the crop is harvested, and to enumerate the major market actors in the Guar
bean and gum market in India.
The analysis of historical data and of relative share of different states in total production and area
shows that Rajasthan is the leading producer but suffers from high fluctuation in production. On the
other hand Haryana has significant contribution in terms of production based on high productivity.
This has been achieved by using high yielding short duration varieties by farmers and assured
irrigation.
The significantly higher prices of Guar in recent time have helped expand the crop to non-traditional
regions and seasons. The crop is now being cultivated in dry tracts of Madhya Pradesh, Chhattisgarh,
Andhra Pradesh, Karnataka, Tamil Nadu and other parts in kharif as well as in summer season. The
crop has also been able to compete with other kharif crops like groundnuts, pearl millet, sorghum,
cotton, etc. The crop is now grown on black, deep, clay type of soils along with sandy and red soils.
The requirement of region and season based Guar technology is emerging to enhance production
with limited inputs so as to widen the economic returns. The need is also emerging for bridging the
gaps between yields obtained on the experimental farm yields and at farmer’s field. In view of this
the study delves on the cultivation practices, sowing requirements, fertilization, seed treatment,
disease management, row spacing ,impact of weather parameters, impact of input technology and

vi
selection of varieties. They study also highlights the experiments in progress in introducing summer
crop of guar.
The demand of processed Guar in world market is expected to increase with the expansion of shale
oil gas fracking to new countries like China and Russia and scaling up in prominent existing
countries like USA along with other uses in food and textile industries owing to increased food
safety and health concerns. This makes it relevant to study the supply response of Guar crop
particularly when the cultivation of crop is confined to a limited geographical area. The supply
response of a crop may be estimated in terms of area, yield and output response. The study focuses
on area and yield response. In economic analysis of the dynamics of farm supply response, price is
usually considered the most critical factors which influence farmer’s production decisions. However,
acreage under a crop is also influenced by various factors other than prices.
An attempt has been made to work out the response of prices and other factors on farmer’s decisions
in allocating area under Guar crop. The simple Nerlovian lagged adjustment model has been
considered appropriate to study the supply response of Guar. The estimated coefficient for
independent variables included in the model have the signs as predicted theoretically except for
relative productivity. The results show that prices and production lagged by one time period and
rainfall during the sowing time have a positive influence on acreage under Guar crop while risk
associated with the prices and relative productivity of Guar in comparison to other competing crops
has shown negative impact on the area under crop.
The coefficient of prices of Guar in the previous season is positive and significant at 1 percent level,
showing that the prices prevailing in one period will lead to an increase in the area under Guar crop
in the succeeding season. This shows that the farmers are responsive to the market signal which
sometime may not be the case in developing economies characterized by large number of small and
marginal farmers. In addition to lagged prices, the area under Guar crop cultivated mainly under
rain-fed conditions in the states is affected by the rainfall received during sowing time.
The estimate of supply response of a crop depends on acreage and productivity. The acreage under a
crop is allocated based on expected prices while productivity is determined by availability of inputs
and climatic conditions. The farmers may make substantial revisions in the decision in terms of
inputs to enhance yield after allocating land. Hence, it is reasonable to assume that both area and
yield are influenced by the expected output price.
Farmers may respond by adopting better technology of production with no change in area or by using
more or better quality of inputs. Such responses will change the output without changing the area,
something that is hidden in the acreage function. The intensive nature of cultivation will not be
revealed by the input application alone, but will also be reflected in the quality of inputs and the
timing and the method of application. The yield response of Guar is assumed to be affected by prices
and other factors like rain and the production risk association with the crop.
The regression analysis has revealed rainfall as an important factor influencing the productivity of
the crop cultivated under rain-fed conditions. The relationship of productivity with various factors
other than rainfall like temperature, humidity, intensity of rainfall, etc could not be worked out due to
paucity of information and relevant literature required to establish the relationship. However, an

vii
attempt has been made on the basis of review of literature and interaction with the experts to find out
the association of different factors on productivity.
Marketing and distribution of Guar: Agriculture Produce Marketing Committee (APMC) markets
have an important role to play in the supply chain. The APMC market (also called mandis) provides
a platform for aggregation and operation for various players operating at the wholesale level like
traders, stockists, etc. These markets have peak arrivals of Guar seed in the month of November and
December. Majority of the processed product is being exported and only a small quantity is being
consumed in the local markets.
Stocks maintained mainly by traders and processors play a vital role in marketing and price
discovery of Guar as it can be stored for long period without any significant loss to quality and
quantity even under normal conditions. Farmers mainly large and medium have shown some
instances of retaining the commodity at farm level in expectation of price hike as farmers are having
information on the development of market.
Consumption and demand of Guar seed: Considering the importance of Guar as an export crop, an
attempt has been made to work out the quantity of Guar bean (in terms of equivalent of quantity
exported) exported and consumed domestically. An estimate has also been made of the Guar bean
equivalent being exported to USA to assess the size of US Market, and its importance for Guar and
Guar processing industry. The analysis is based on the assumption that the Indian Guar processing
industry is realizing 29.25 percent of Guar gum from the Guar bean. The quantity left unaccounted
after export to US and rest of the world is considered to be consumed in domestic market.
The insights into the industry reveal that there has been a migration of demand from food grade to
industry grade. The emergence of demand of Guar from the US petroleum industry and also the oil
fields of Middle East has changed the scenario. Prior to 2005 the major demand from the industry
was for food grade Guar gum. The consumption of Guar gum by food industry was around 50% of
the total Guar gum consumed. The consumption of Guar gum by oil drilling industry was limited to
around 30 percent. But at present the scenario has change and the major consumer of Guar gum is
from oil drilling industry while the demand from food industry has reduced to around 20 percent.
The Guar crop is mainly cultivated in Rajasthan under rain-fed condition and is thus influenced to a
great extent by the monsoon received in the Guar growing areas during sowing time. Given that guar
beans can be stored for 3-6 years, the stocks maintained at different level in the supply chain play a
vital role in total availably of the crop for processing and export. An attempt has been made to
develop data on carry over stock maintained over year to ensure regular supply of the crop by
compiling information from different sources. The marketing of guar at different level is constraint
by lack of transparency and market information. In spite of the fact that Guar has assumed
importance of stratospheric level, there is no systematic collection and dissemination of market
information to the stakeholders.
Presently there is no dedicated organization performing task of collection and dissemination of
market information to the stakeholders in public domain. There are discrepancies in data collected.
However, the Guar industry is largely driven by private players who have their own mechanism of

viii
survey and collection of information. Such discrete efforts need to be consolidated to from a reliable
mechanism of market information and advisor services.
Value addition and processing of Guar seed are the most important components of the market. There
is lack of technology, proper research and development efforts, skilled manpower, etc. Processing
industry is fragmented and most of the units are operating on small scale. There is a need for
consolidation to achieve economies of scale and a stable market for Guar. Guar gum has emerged as
India's top farm export overtaking traditional heavyweights rice and cotton and looks set to power
into the league of top 10 shipments from the country, due to increasing demand from the US oil and
gas industry. A systematic approach to Guar industry by providing training, market information,
maintaining stock positions, research and development in processing, adopting better technology in
processing and value addition will make India retain its share in international market and remain
profitable for farmers.

1
1. INTRODUCTION
Clusterbean, (Cyamposis tetragomoloba (L.) Taub) commonly known as Guar, is a drought and high
temperature tolerant deep rooted summer annual legume of high social and economic significance.
The qualities of the crop like high adaptation towards erratic rainfall, multiple industrial uses and its
Importance in cropping system for factors such as soil enrichment properties, low input requirement,
etc have made the guar one of the most significant crops for farmers in arid areas in India.
Guar is a native to the Indian subcontinent. The crop is mainly grown in the dry habitats of
Rajasthan, Haryana, Gujarat and Punjab and to limited extent in Uttar Pradesh and Madhya Pradesh.
The crop is also grown in other parts of the world, like, Australia, Brazil and South Africa.
India is the largest producer of Guar and contributes 80 percent of total Guar production in the world.
In India, Guar crop is cultivated mainly during Kharif season, with an annual production of around 2
million metric tons. Guar crop has experienced a remarkable journey from a traditional crop grown
on marginal lands mainly for food, animal feed and fodder to a crop with various industrial usages.
Guar gum is an important ingredient in producing food emulsifier, food additive, food thickener and
other Guar gum products. The unique binding, thickening and emulsifying quality of guar gum
powder obtained from guar seed has made it a much sought after product in international market.
Guar is the source of a natural hydrocolloid, which is cold water soluble and form thick solution at
low concentrations. The guar seed consists of three parts: the seed coat (14-17%), the endosperm
(35-42%), and the germ (43-47%). It is from the endosperm that guar gum is derived, which is the
prime marketable product of the plant. This spherical-shaped endosperm contains significant
amounts of galactomannan gum (19 to 43% of the whole seed), which forms a viscous gel in cold
water. Like other legumes, guar is an excellent soil-building crop with respect to availability of
nitrogen. Root nodules contain nitrogen-fixing bacteria and crop residues, when ploughed under,
improves yields of succeeding crops.
The expansion of uses of guar to new areas like extraction of natural and shale gas has transformed
guar in recent years into an important export crop. India is the largest producer of Guar gum and its
derivatives. Guar gum is largely an export oriented commodity with about 75-80 percent of total
output being exported from the country India was the leading exporter of mucilages and thickeners in
the world with a share of more than 73 percent in value terms during 2011. Guar now accounts for
around 18 percent of India’s total agricultural exports (DGCIS & APEDA, 2012-13).
United States has played a significant role in transforming guar crop and guar processing industry in
the country. States has been the largest importing country of guar gum and mucilages and thickeners
in recent years. Share of USA in total export of Guar gum from India during 2012-13 was reported to
be nearly 60 percent. The same quantity in value terms was more than 81 percent. USA was

2
observed to be the leading importer of mucilages and thickeners with a share of more than 73 percent
in value terms during 2011 (APEDA).
In recent years the crop has acquired great significance due to its use in the oil drilling industry for
hydraulic fracturing of oil shale, mainly by United States for its concern for the environment and
water contamination. United State is the largest producer of shale gas with a huge reservoir of around
665 trillion cubic feet (Energy Information Administration estimates). In recent years, the production
of shale gas has increased many folds in the United States. It increased to 10296572 cubic feet from
around 3958313 cubic feet in 2009, an increase of around 2.6 times over a period of 3 years. The
growth of shale gas industry in US at such a high pace, presence of other major players like Canada
and expansion of shale gas extraction to new territories like China and Russia will push the demand
of Guar to new heights which is used as a thickening agent in the fracking process. The use of fast
hydrated gum as a key ingredient in the process of fracking has helped consolidate the demand of
crop in the international market. Increasing demand of Guar on account of growth in shale gas
industry along with other factors has made guar a golden crop
The increased demand has resulted in a strong escalation of the prices of guar beans and products.
Nevertheless, the prices of guar has shown uncertainty and volatility as the crop is mainly cultivated
under rainfed conditions and its production is confined largely to limited geographical area. In
addition to increased prices, the multi utility nature of the crop has generated a lot of interest for the
crop among different stakeholder. The trajectory of growth of guar industry has been upward as can
be seen from Figure-1. There has been a rapid growth in area, production and value over a decade
from 2002 to 2012. The guar industry is poised to continue to grow and develop in future owing to
higher focus on research in universities and technical institutes of the world.

3
Figure 1. Growth of Guar during last decade
The size of shale gas industry is a major factor in defining demand and prices of Guar in India. The
same has been revealed by the increase in prices of the crop in recent years. In the year 2011, imports
by various US companies to create stocks anticipating poor supply sparked the speculation and thus
price reached to a record high in Indian market. The speculative environment created by the
inventories maintained by shale gas industry caused escalation in prices of guar. The prices of guar
during the 2013-14 were relatively low probably due to weak demand based on high carryover stock
maintained by the US based firms.
1.2 Background of the study
Guar gum is used as a thickening agent and emulsifier in the oil and gas extraction industry for
hydraulic fracturing (“fracking”) of subsurface shale. Until three years ago it was used almost
exclusively in the food processing industry as a thickener and emulsifier, but the research and
development by oil and gas industry discovered that Guar gum is the best emulsifier for hydraulic
fracturing. As a result of expansion of the shale oil and gas industry, demand soared and the value of
Guar gum export rose to nearly INR 212.87 billion in Indian fiscal year (IFY) 2012-13 (April/March)
compared to INR 29.39 billion in IFY 2010-11.What had been a minor crop with limited business
interest and virtually no need for analysis became in two years India’s largest agricultural export to
the United States.
The area, production and yield of the crop are inconsistent due to its overdependence on weather and
production confined to limited geographical area largely arid regions. Official government
production data from the four major producing states (Rajasthan, Punjab, Haryana and Gujarat) are
available only with a lag of one year. In addition, Guar bean yields vary by as much as 300 percent
year on rainfall and weather conditions, making production forecasting extremely difficult compared
to other field crops. The Guar crop does not respond to fertilization or to irrigation, and excess
rainfall can adversely affect yields. Hence there is a need for analysis of factors influencing yields to
enable more accurate estimation of production during the season and just after harvest.

4
With Guar products emerging as India’s single largest agricultural export in CY 2012, there is a
greater need for improved market information for this commodity and an improved ability to estimate
production in the current year. The absence of reliable and accurate production and market
information is reflected in price swings.
Higher prices for Guar have resulted in production expanding in the traditional states of Rajasthan,
Punjab, Haryana and Gujarat as well as into new areas such as Uttar Pradesh and Andhra Pradesh.
While the United States is the major buyer, demand
for Guar gum from other gas and oil producing
countries, notably Russia, Venezuela, and Mexico,
is growing, adding to price volatility.
In order to understand better the Indian Guar
industry this study has been undertaken for the U S
Department of Agriculture to:
To estimate India’s historical Guar (cluster bean)
and Guar gum production, supply, and
distribution
To identify factors important factors during
different stage of cultivation of guar crop to
facilitate more accurate estimation of current
year yield
To assess consumption of guar bean and products in various usage/sectors
To identify major buyers and processors of Guar beans in India
The overall objective is to
establish a production,
supply and distribution
(PS&D) baseline for Guar
bean and gum in India, to
determine input factors that
can be used to estimate
production in a given crop
year before the crop is
harvested, and to enumerate
the major market actors in
the Guar bean and gum
market in India.

5
1.3 Approach and Methodology
To meet the objective of establishing a production, supply and distribution baseline for Guar and
Guar gum the approach of the study is as follows:
1.3.1 Collection of information on production, supply and distribution balances for Guar in
India from 2000 to 2012.
Collection of state-level area and production data for the period 2000 to 2012, covering
all states in which Guar is produced commercially.
Utilization of data from the Government of India’s Directorate General of Foreign Trade
(DGFT) and APEDA on foreign trade to establish exports of Guar gum, and apply a
conversion factor to these exports to establish a Guar bean equivalent export figure.
Estimation of annual carryover stocks for the period 2000 to 2012.
1.3.2 Determination of factors for estimating current crop yield potential of Guar beans
during the growing season.
Interview the Guar research institute in Rajasthan and members of the Indian Guar Gum
Manufacturers Association to obtain information about the agronomy of Guar production.
Identification of list of factors (e.g., precipitation, ambient temperature, soil type) that
influence Guar yields, and associate with that list parameters that can be used to estimate
current crop year yield potential.
1.3.3 Identify major buyers/processors of Guar beans in India
Interview the processors, buyers and sellers
Collect information from major Spot and commodity markets
1.4 Data Source
In order to produce a report on India’s Guar bean production and end-of-year carryout stocks,
including state-level area and production data. The data from the following sources have been
used:
Interviews with Guar producers, traders and guar processors including Indian guar gum
manufacturers association.
Interviews and data collection from Rajasthan State Departments of Agriculture on Guar
production.
Data from Agmarknet, Krishi Rajasthan
DGFT data on annual (calendar year) exports of Guar gum has been compiled and to
Guar bean equivalent using an appropriate conversion factor has been determined. This is
based on following data source:

6
DGFT and APEDA data on Guar gum exports 2000-2012.
Interviews with processors of Guar gum to determine an appropriate conversion factor
from Guar beans to Guar gum that represents an industry average.
The study with the focus on determining factors for estimating yield potential of Guar beans during
the growing season has used regression analysis to identify the key factors. In addition, opinion of
experts was also obtained to identify the factors which could not be assessed through regression
analysis. These factors will provide a basis for estimating Guar bean production in the growing
season based on changes in the parameters (eg. fluctuations in weather conditions). The data source
and methodology is as follows:
Interview with Scientists working at All India Coordinated Research Project on Guar, Durgapura
and CAZRI, Jodhpur
Interview with the members of the Indian Guar Gum Manufacturers Association
Review of literature of Scientific papers on agronomy of Guar
Data from Indian Meteorological Department (IMD) on key weather factors (e.g., precipitation,
ambient temperature, ) that may potentially affect Guar yields
Use of econometric tools to understand the key factors to be used to estimate current crop year
yield prospects.

7
2. PROFILE OF GUAR
Guar is a crop of arid and semi-arid areas cultivated in north and northwest parts of India and east
and south-eastern part of Pakistan. In Pakistan, Guar seed is mainly produced in Punjab and Sindh
province with about 80 percent of total Guar acreage under irrigation. On the other hand production
of Guar in India is mainly confined to arid zones of Rajasthan and parts of Gujarat, Haryana and
Punjab. Guar in Rajasthan is mainly cultivated under rain-fed conditions.
Total production of Guar bean in India is estimated to have crossed 2.7 million metric tons during the
agricultural year 2013-14 due to good weather conditions in the major Guar producing areas in India.
With a moderate production of 250,000 metric tons in Pakistan which is another important guar
producing area, the total global production of Guar bean is estimated to have crossed 3 million
metric tons during 2013-14. Presently, India accounts for more than three-fourth (or nearly 80
percent) of the total world Guar bean production (Figure-2). The other major producers of Guar are
Pakistan, USA, South Africa, Malawi, Zaire and Sudan.
Figure 2. India's share in world Guar production in 2013-14
2.1 Guar bean Production in India
Rajasthan is a major guar producing state in India followed by Haryana and Gujarat and small
contributions from the states of Uttar Pradesh, Punjab and Madhya Pradesh. The share of different
states in total production of Guar bean in India worked out on the basis of triennium average 2011-12
is presented in Figure-3. The figure suggests that 95 percent of the Guar bean production in India is
coming from two states only namely Rajasthan and Haryana. Three-fourth is being contributed by
Rajasthan alone.

8
Figure 3. Share of different states in guar bean production in India
The production of Guar in India has seen wide variation during in recent past ranging from 0.2 to 2.7
million metric tons due to the over dependence of the crop on monsoon precipitation (Table-1). Only
0.2 million metric tons of Guar bean was produced from an area of nearly 1 million hectares during
2002-03 due to severe drought. A harvest of 2.7 million metric tons from an area of 5.6 million
hectares was achieved in 2013-14 due to good monsoon. In spite of the fluctuation in the area and
production of Guar, an increasing trend has been observed during last decade in acreage under the
crop and production of Guar bean in India (Figure-4).
Table 1. Area, production and yield of guar in recent past in India
Year Area
(000 ha)
Production
(000 tons)
Yield
(kg/ha)
2000-01 3497 659 188
2001-02 2903 1090 375
2002-03 975 199 204
2003-04 2854 1513 530
2004-05 2867 903 315
2005-06 2956 1059 358
2006-07 3344 1169 350
2007-08 3472 1789 515
2008-09 3863 1936 501
2009-10 2996 595 199
2010-11 3382 1965 581
2011-12 3444 2218 644
2012-13 5152 2461 478
2013-14# 5603 2715 485
2014-15* 4255 2415 567 Source: Ministry of Agriculture, GOI
#Figurers for 2013-14 at all India level are not available and hence rough estimates have been worked out on the basis
of area and production in Rajasthan and its relative position in guar in India
*Authors estimate based on regression analysis for area and previous three year average for productivity

9
Since the prices remained relatively low during 2013-14 at Rs 4500 per quintal, there are predictions
that the area under guar may come down to 3.50 million hectares during the current kharif season, a
decrease of 1.65 million hectares over previous year. Prices being an important factor to influence
the farmers decision regarding allocation of area, there is every possibility of some correction in area
under guar crop due to low prices but this may not be to the tune of 1.65 million hectares as
predicted by some trade observers. As there are factors other than prices to influence the farmers
decision like relative profitability, traditional cropping pattern, resource availability, availability of
irrigation and markets. An estimate taking these factors in addition to prices into consideration
suggests that the area under Guar in the current kharif season should be somewhere in the range of
4.25 million hectares. A low-input crop like guar may stand competitive against rest of the leading
kharif crops even at low prices of Rs 4500. Marginal fluctuations in the relative profitability on
account of fall in price coupled with other compulsions like resource unavailability may not
encourage farmers to shift to other crops. Availability of resources (like irrigation) and assured
markets are also important factors to influence the acreage allocation decision of the farmers. The
area under guar crop may be grouped into three categories. The traditional farmers taking guar under
rainfed conditions are least likely to shift to other crops due to resource constraints. This category
broadly covers an area of 3 million hectares. Traditional farmers taking guar under irrigated
condition (e.g. Sri Ganganagar and Hanumangarh are moderately likely to shift to other crops) Non-
traditional irrigated resource rich farmers from state like Haryana and Gujarat are most likely to shift
to other crop. But this factor may also have limited impact as the increase in the area under guar
during last season was primarily due to increase in area under guar in Rajasthan state. Traditional
cropping pattern based on the technical knowledge acquired by the farmers may compel them to
continue with same crops. The acreage response analysis based on last year prices suggests that the
area under guar in the current kharif season should be somewhere in the range of 4.25 million
hectares.
The progress of Guar bean in India has been presented in Figure-4. It is apparent from the figure that
production is increasing at a faster rate than the area under cultivation of Guar due to increase in the
productivity. It is expected that the area under cultivation of Guar in India will come down during
current year i.e. 2014-15 to around 4.25 million hectares but it is expected to improve in coming
years on account of better prices based on increasing demand for factors like use of guar gum in
shale gas industry, low-input requirement and relative profitability of crop even at lower prices.

10
Figure 4. Area and production of Guar in India
2.2 Guar Seed Production in Rajasthan
Rajasthan is largest Guar bean producing state in India. The crop is cultivated in Kharif season and
sowing starts with the onset of monsoon in the month of June/July. Guar is being grown mainly in
arid districts of western part of Rajasthan. A production of 2.0 million metric tons was achieved from
an area of 4.5 million hectares in Rajasthan during 2012-13. However, the advance estimates of
Department of Agriculture, State Government of Rajasthan suggest that a further increase in area to
4.9 million hectares will help state in achieving a production of more than 2.2 million metric tons
during 2013-14. Nearly 90 percent of the area under Guar crop in the country is being contributed
almost consistently by Rajasthan state though the same is not true for production which has shown
lots of variation owing to over dependence of the crop (in terms of area and productivity) on
monsoon (Table-2).

11
Table 2. Area, production and yield of Guar in Rajasthan
Year
Area Production Yield
(kg/ha) (000 ha) Percent of Total
Area in India (000 tons)
Percent of Total
Area in India
2000-01 3056 87.38 481 73.01 157
2001-02 2413 83.12 763 70.01 316
2002-03 557 57.03 28 14.07 50
2003-04 2278 79.82 1163 76.85 511
2004-05 1944 67.80 368 40.74 189
2005-06 2445 82.73 566 53.45 231
2006-07 2808 83.98 658 56.27 234
2007-08 2842 81.86 1244 69.56 438
2008-09 3316 85.85 1261 65.14 380
2009-10 2581 86.16 201 33.80 78
2010-11 3001 88.73 1546 78.66 515
2011-12 3000 87.10 1847 83.29 616
2012-13 4526 NA 2023 NA 447
2013-14* 4924 NA 2201 NA 512
Source: Department of Agriculture (DoA), Government of Rajasthan
*Second Advanced Estimate
The details of the leading Guar producing districts in Rajasthan state is given in Table-3. The table
reveals that Bikaner is the leading district both in terms of area (29.1 percent) and production (28.5).
The districts of Hanumangarh (16.1 percent), Sriganganagar (10.6 percent) and Churu (9.1 percent)
are the other three major producers. These four districts together contribute nearly three-fourth of the
total Guar production in the state.

12
Table 3. Leading Guar producing districts in Rajasthan (TE 2011-12)
Districts Area (%) Production (%)
Bikaner 29.1 28.5
Hanumangarh 9.6 16.1
Sri Ganganagar 5.2 10.6
Churu 10.6 9.1
Jaisalmer 13.9 7.5
Barmer 13.8 6.0
Jodhpur 4.6 5.0
Sikar 2.5 4.0
Jhunjhunu 2.0 2.9
Nagaur 2.8 2.5
Jaipur 1.2 2.0
Jalore 1.4 1.5
Alwar 0.6 1.2
Pali 1.0 1.1
Bhilwara 0.2 0.2
Source: Agricultural Statistics (2011-12), Rajasthan
Area and production of Guarbean in Rajasthan for the period 1991-2011 is shown in Figure-5. The
lowest production of Guarbean in Rajasthan was recorded at 28,000 tons during 2002-03 (which was
a drought year) while the production has increased in recent years. The figure reveals the high degree
of fluctuation over year is observed in the production of Guarbean in Rajasthan. This may be due to
overdependence of crop on rainfall.
Figure 5. Area and production of Guar in Rajasthan
Source:
Department of Agriculture, Rajasthan
13
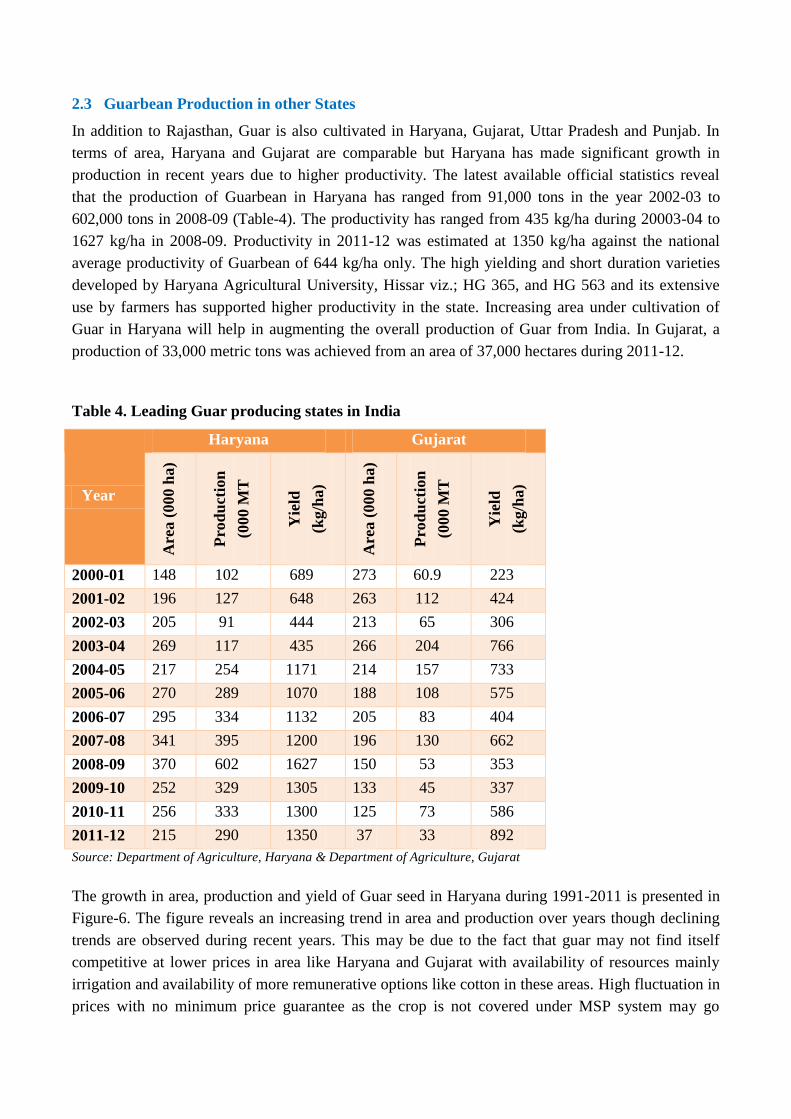
2.3 Guarbean Production in other States
In addition to Rajasthan, Guar is also cultivated in Haryana, Gujarat, Uttar Pradesh and Punjab. In
terms of area, Haryana and Gujarat are comparable but Haryana has made significant growth in
production in recent years due to higher productivity. The latest available official statistics reveal
that the production of Guarbean in Haryana has ranged from 91,000 tons in the year 2002-03 to
602,000 tons in 2008-09 (Table-4). The productivity has ranged from 435 kg/ha during 20003-04 to
1627 kg/ha in 2008-09. Productivity in 2011-12 was estimated at 1350 kg/ha against the national
average productivity of Guarbean of 644 kg/ha only. The high yielding and short duration varieties
developed by Haryana Agricultural University, Hissar viz.; HG 365, and HG 563 and its extensive
use by farmers has supported higher productivity in the state. Increasing area under cultivation of
Guar in Haryana will help in augmenting the overall production of Guar from India. In Gujarat, a
production of 33,000 metric tons was achieved from an area of 37,000 hectares during 2011-12.
Table 4. Leading Guar producing states in India
Year
Haryana Gujarat
Are
a (
000 h
a)
Pro
du
ctio
n
(000 M
T
Yie
ld
(kg/h
a)
Are
a (
000 h
a)
Pro
du
ctio
n
(000 M
T
Yie
ld
(kg/h
a)
2000-01 148 102 689 273 60.9 223
2001-02 196 127 648 263 112 424
2002-03 205 91 444 213 65 306
2003-04 269 117 435 266 204 766
2004-05 217 254 1171 214 157 733
2005-06 270 289 1070 188 108 575
2006-07 295 334 1132 205 83 404
2007-08 341 395 1200 196 130 662
2008-09 370 602 1627 150 53 353
2009-10 252 329 1305 133 45 337
2010-11 256 333 1300 125 73 586
2011-12 215 290 1350 37 33 892
Source: Department of Agriculture, Haryana & Department of Agriculture, Gujarat
The growth in area, production and yield of Guar seed in Haryana during 1991-2011 is presented in
Figure-6. The figure reveals an increasing trend in area and production over years though declining
trends are observed during recent years. This may be due to the fact that guar may not find itself
competitive at lower prices in area like Haryana and Gujarat with availability of resources mainly
irrigation and availability of more remunerative options like cotton in these areas. High fluctuation in
prices with no minimum price guarantee as the crop is not covered under MSP system may go

14
against the crop mainly in area where crops covered under MSP system are available like groundnut
and cotton in Haryana and Gujarat.
Figure 6. Area and production of Guar in
Haryana Sour
ce: Department of Agriculture, Haryana
The share of different states in total Guar production and area is depicted in Figures-7 and 8,
respectively.
Figure 7. Share of different states in production of Guar

15
Figure 8. Share of different states in area under
Guar

16
The crop considered generally for marginalised land has developed a lot of curiosity among farmers
mainly from the non-conventional states after sudden rise in the prices owing to its demand in
international market mainly USA. The analysis of the relative share of different states in total
production and area shows that Rajasthan is the leading producer but suffers from high fluctuation in
production. On the other hand Haryana has significant contribution in terms of production based on
high productivity. This has been achieved by using high yielding short duration varieties by farmers
and assured irrigation. The Rajasthan has shown the lead in production but with high fluctuation in
its share. On the other hand the share of different states has been observed to be almost uniform over
years. It is also revealed from the chapter that production of Guar in Rajasthan is relying heavily on
monsoon while in other state the production is not that much affected by rainfall due to assured
irrigation.

17
3. GUAR CULTIVATION PRACTICES
Guar (Cyamopsis tetragonoloba) is a drought tolerant, multi-purpose legume crop cultivated mainly
in the kharif season in arid environment. A crop that can be raised in poor soil and require lower
agronomic inputs is currently cultivated predominantly in arid regions of northern-western parts of
India. It thrives well on light texture, sandy to sandy loam soils receiving 300-500 mm annual
rainfall. The significantly higher prices of Guar in recent time have helped expand the crop to non-
traditional regions and seasons. The crop is now being cultivated in dry tracts of Madhya Pradesh,
Chhattisgarh, Andhra Pradesh, Karnataka, Tamil Nadu and other parts in kharif as well as in
summer season. The crop has also been able to compete with other kharif crops like groundnuts,
pearl millet, sorghum, cotton, etc. The crop is now grown on black, deep, clay type of soils along
with sandy and red soils. There is a need for developing region and season based Guar crop
production techniques with optimum use of inputs to increase economic returns. The need is also
emerging for bridging the gaps between yields obtained on the experimental farm yields and at
farmer’s field. In view of this, an attempt has been made in the following sections to better
understand the various issues related to the crop and its cultivation.
3.1 Morphology
Guar is an important leguminous annual crop also called as “clusterbean” for its pattern of pod
arrangements in clusters. It grows upright, reaching a height of 2 to 3 meters. It has a main single
stem with either basal branching or fine branching along the stem. It is a robust, bushy, semi-upright
type of plant. Guar has well developed tap root system. Stems and branches are angular, grooved,
forked hairs, sometimes glaucous. Guar has branched and un-branched growth habit. It has pointed
saw-toothed, alternate, trifoliate leaves with small purple and white flowers borne along the axis of
spikelet. It bears hairy pods in clusters of 4 – 12 cm length each pod with 7 to 8 seeds. Seed is hard,
flinty, flattened, ovoid and about 5 mm long.
Seeds are white, grey or black in colour.
Germination is epigeal type. There are both
short and tall statured cultivars.
This legume develops root nodules with
nitrogen-fixing soil bacteria rhizobia in the
surface part of its root system. Its leaves and
stems are mostly hairy. Its fine leaves
have an elongated oval shape (5 to 10 cm
length) and of alternate pattern. Clusters of
flowers are of white to purple colour. The
developing pods are rather flat and slim.
Usually, mature seeds are white or gray, but in
case of excess moisture they can turn black and lose germination capacity.
Figure 9. Crop cycle of Guar

18
3.2 Crop Cycle
Guar is a three-four months crop. From sowing to harvesting it takes about 90 to 110 days. Figure-9
exhibits the major stages of Guar crop cycle. Cycle starts with sowing by first to second week of
July. Germination takes place in 4 to 6 days of sowing. Guar is an indeterminate plant showing
continuous flowering and poding even upto 80 to 85 days of sowing, if soil moisture is available.
However, in general flowering stage starts after 40 to 60 days of sowing (DoS). The pod formation
takes place after 50 to 70 days from the date of sowing. Pod matures in 80 to 90 DoS. The harvesting
of the crop begins when 90 percent pods are matured roughly 90 to 110 DoS (depending on the
variety, soil and climatic conditions).
3.3 Climate
Guar is a photosensitive crop and requires specific climatic condition to grow. For proper
germination soil temperature ideally should be around 20 to 250C, long day period for vegetative
growth and short day period for flowering and pod formation. Being a drought tolerant crop it
performs well under arid and semi-arid condition.
In arid condition Guar grows as rain fed crop which requires 300 to 400 mm rainfall in 3 to 4 spells.
It grows under wide range of rainfall from 300 to 550 mm, but heavy rainfall invites many diseases.
Guar crop performs better in warm climate and grows well in sub-tropics during summer. It can
tolerate high temperature even upto 400C.
The seed is normally sown in second week of
July after rainfall starts. Sowing may get
extended upto to August depending on
rainfall and is harvested during October
and November. It is usually a 90 to 110
days crop. For getting better yield,
germination is very important that makes
the basic phase of Guar life cycle.
Germination is dependent on different
factors like seed viability, seed size, seed
vigour, soil type, soil moisture, soil
temperature and relative humidity. Bolder
seeds give higher germination
compared to small or medium sized seeds.
Bolder seeds may give better shoot length and higher dry matter production. Maximum germination
occurs at 25 to 300C and it takes about 6 days for complete germination. Guar seeds are known to
germinate only after sufficient imbibition, approximately twice their original weight. Guar is not able
to germinate well under high saline and submergence conditions. Pre-soaking of Guar seed in good
quality water for 2 hours followed by half an hour shade drying may enormously increase
germination percentage.
Figure 10. Life cycle of Guar

19
3.4 Soil
Guar can grow in different type of soils but light textured sandy soils are more suitable for the crop.
It performs well on medium-fertile, medium textured; un-logged conditions with neutral pH and
well-drained subsoil. Soils with pH 7.0 are considered best for Guar production than acid soils. Guar
is a moderately salt tolerant crop. Increase in soil salinity affects the nodulation and reduces pod
formation and also yield. Being a legume crop it has ability to fix extra nitrogen in the soil so that it
can perform well even in poor fertile soil and nutrient depleted soil. Guar has the ability to fix
nitrogen to the tune of 30-40 kg/ha.
3.5 Land Preparation
As such no seedbed preparation is required but for good seed germination two or three ploughings of
the field is sufficient for fine tilth which is helpful to the plant in early growth for ample soil aeration
and root development. Each plough is followed by planking. At the time of sowing field should be
well drained and free from weed to ensure good germination.
3.6 Sowing Requirements
3.6.1. Sowing Method
In India, farmers sow Guar mainly by traditional method of broadcasting. Broadcasting is done
manually spreading seed over the soil surface. After broadcasting the seeds, one ploughing is
required for proper seed incorporation in the soil. In this method inter and intra row spacing is not
followed which creates problem in intercultural operations like hoeing, weeding and removing
excessive water in the field. Strategy for proper line and row spacing may help in enhancing the
productivity of the crop. Line method normally is done by seed drill which ensures sowing with
proper spacing and depth. This method results in good germination and proper weed management
and drainage of excess water in the field.
3.6.2 Time of sowing
Sowing time basically depends on availability of rains (30-40 mm at a single stance) and closely
follows monsoon rains in the Kharif season. Studies indicate that yield is reduced considerably when
sowing is delayed to last week of July or first week of August. First to second week of July is the
ideal time of sowing for normal crop in arid Rajasthan (Table-5). However, for Haryana, it is end of
June to first week of July and first fortnight of August for Gujarat.
Table 5. Optimum sowing time for Guar in different seasons in Rajasthan
Season of Crop Sowing Time
Summer Crop 25 February to 15 March
Kharif Crop First to Second week of July after effective monsoon shower

20
3.6.3. Spacing
Spacing is required to ensure proper utilisation of inputs like nutrients, moisture and light resulting in
better production performance of the plant. The sowing strategy involves inter and intra row spacing.
The spacing depend on the optimum plant stand/ population required for different regions having
varied rainfall intensities.
Trials on sowing methodologies conducted under the aegis of National Network Research Projects
on Arid Legumes reveal that the recommended spacing should be 10-15 cm plant to plant distance in
a row and 35-60 cm row to row distance on the basis of rainfall, soil type and inputs availability. For
instance, for low rainfall (200-350 mm) zones like Jaisalmer, Barmer, Bhuj, Jodhpur, etc., optimum
plant population is 110,000 plant/ha, the same can be obtained with sowing strategy of 60 x 10 cm
(inter and intra row spacing). Similarly, for the regions particularly semi-arid, having moderate rains
(450-500 mm), the optimum sowing strategy has been found to be 45 x 10 cm, which may give
required plant population of 150,000 plant/ha. For those regions having still higher rainfalls (550-600
mm) planting pattern of 30x 10 cm has been observed optimum and maximum grain yield can be
harvested with 200,000 plants/ ha. All these strategies are for branching type behaviour of varieties.
However, for the varieties having un-branched growth pattern with main shoot only (RGC-1066,
RGC-1031), the optimum plant spacing having been observed to be 25 x 10 cm. Under late sown
conditions, close planting from more seeds and closer interspacing have proved optimum. The plant
population with respect to location and rainfall is shown in Table-6.

21
Table 6. Plant population with respect to location and rainfall
Inter and Intra Row Distances
(cm) Locations
Rainfall
(mm)
Plant Population
(000/ha)
60 x 10 Jodhpur, Bikaner
(Arid)
200-
350 110 plants
45 x 10 Durgapura (Semi-arid) 450-
500 150 plants
30 x 10 Agra (Semi-arid) 550-
600 200 plants
Source: D Kumar, Guar International Conference 2013, Jaipur
Note: under normal sown conditions, invariably a plant population of 125000-150000 plants per hectare is optimum at
45 cm spacing for branched type varieties. In late sown condition, inter row spacing of 30 cm was observed better than
45 cm.
3.6.4. Seed Rate
Seed rate also depends on variety, purpose and time of sowing. Generally 10-12 kg seed per hectares
is recommended for spreading type varieties whereas 15-16 kg /ha for un-branched varieties. In late
sown conditions more seed is applied and lines are sown closer. Yadav et al (2002) at Bawal and
Yadav et al (2003) at Hissar, while working on early maturing Guar variety HG 365 recommended
12-15 seed per hectares depending on the soil types (Table-7).
Table 7. Effect of seed rate on yield and quality of Guar seed cv HG 365
Seed Rate
(kg/ha)
Seed Yield
(tons/ha)
Gum Yield
(tons/ha) Gum (%) Protein (%)
10 1.430 0.446 31.24 39.13
15 1.641 0.509 31.02 28.86
20 1.567 0.470 29.99 27.89
25 1.528 0.456 29.85 27.35
CD at 5% 0.015 -- 0.71 0.36
Source: Yadav et al (2003)
3.6.5. Seed Treatment
Seed treatment is essential for checking early seedlings mortality and development of diseases at
later stages.
a) For killing the spores of dry root rot fungus, seed is treated with Ceresan or Thiram at the rate
of 3 gm/kg seed.
b) Seeds can be treated with Imidachlorpid at the rate of 6 ml/kg seed to control sucking pest
like Jassids and Aphids.
c) Immersion of seeds in hot water at 500C for 10 minutes followed by drying at room
temperature before sowing helps in killing fungus mycelium and inactivating their spores.

22
3.7 Inoculation of seeds
Guar is a legume crop and its roots bear nodules with special kind of bacteria that converts
atmospheric free nitrogen to fertilizer available form. This symbiotic relation between bacteria and
root nodules helps to reduce the cost of nitrogen fertilizer for crop. Therefore, to maintain the
population of bacteria in the soil with respect to growth of plant seeds of Guar are to be inoculated
with these bacteria before sowing. This is done by preparing a 10 percent sugar or gur solution in
boiling water. This sugar solution is allowed to cool. After cooling, 3-4 packets of Guar bacterial
culture (Bradyrhizobium sp.) are mixed to make a thin paste. This paste is coated over to the seed.
Seed is dried under shade for 30-40 minutes before sowing.
3.8 Moisture and water requirement
Guar is a drought-tolerant summer legume that requires only 300-400 mm annual rainfall. Adequate
moisture ensures maximum production of forage and grain. Areas with low humidity are best for
growing Guar as grain crop. Guar is highly sensitive to water logging throughout development
period. Drainage is very important during kharif. The crop responds well to supplementary irrigation.
The seed protein content improve when irrigation is given at 50-60 days of sowing but the irrigation
at later stages deteriorate the seed quality.
3.9 Fertilization
3.9.1 Effect of nitrogen
Being a leguminous crop, it does not respond much to nitrogen, yet a small starter dose (20 kg N/ha)
stimulates growth of the plants in early stages. Application of small dose of nitrogen improves the
nodulation and nitrogen fixation in Guar whereas application of excessive amounts of nitrogen
results in slow nitrogen fixation process. Application of 20 kg N/ha results in higher grain and straw
yield. On sandy loam soil it leads to significant increase in physiological parameters like crop growth
rate, leaf area index, yield attributes, grain yield and stalk yield of Guar.
3.9.2 Effect of phosphorus
The application of phospharic fertilizer is important for effective nodulation, bolder seed size and
consequently improved yield. Application of phosphorus helps in better plant growth lead by better
root system (elongate) and increased number of seeds per pod and per 1000-seed weight. Application
of 40kg P2O5/ha increase the seed and stalk yield, dry matter accumulation, crop growth rate, leaf
area index and yield contributing characters viz, number of pods per clusters, number of pods per
plant and seed yield per plant. In sandy loam soil a dose of 30 kg/ha P2O5 is found as optimum and
economical. Higher application of phosphorus results in lowering of gum content. Application of 20
kg P2O5 per hectare to Guar increased both the gum and protein content in seeds. Inoculation or 40-
60 kg P2O5 per hectare increases the protein content but reduced the gum contents.
3.9.3 Effect of Zinc
In general, arid zoned/ rain-fed soils are deficient in micro nutrients particularly Zinc and Iron, hence
same must be ensured through soil application. Results of coordinated trails over locations and years

23
indicate that Guar responds very well to ZnSO4 upto 25-30 kg/ha. Hence it is recommended to
supply basal dose of 25 kg ZnSO4/ha. Zn has been found to increase earliness and gum content. It
also provides resistance towards BLB disease to some extent.
Studies on the effect of micro-nutrients conducted at Hissar, Bawal, Durgapura and Gwalior revealed
that at all the locations one spray of 0.5 percent ZnSO4 either at 25 or 45 DoS gave significantly
higher seed yield than control, but statistically equivalent to soil application of ZnSO4@ 25 kg/ha
except at Hissar where 0.5 percent ZnSO4 spray proved better than soil application (Table-8). FeSO4
had no effect on the seed yield of Guar at Hissar and Bawal but significant response was observed at
Durgapura and Gwalior, where one spray of 0.5 percent of FeSO4 at 45 DoS gave significantly
higher seed yield than control (Kumar, 2009).
Table 8. Effect of Iron and Zinc spray on seed yield of Guar
Treatment Seed Yield (tons/ha)
Durgapura Gwalior Bawal Hisar Mean
Control 0.497 0.532 0.52 1.221 0.692
0.5 % FeSO4 spray 25 DoS 0.573 0.612 0.547 1.283 0.753
0.5 % FeSO4 spray 45 DoS 0.604 0.61 0.563 1.21 0.746
0.5 % FeSO4 spray 25 & 45 DoS 0.656 0.609 0.55 1.27 0.771
0.5 % ZnSO4 spray 25 DoS 0.604 0.734 0.677 1.576 0.898
0.5 % ZnSO4 spray 45 DoS 0.653 0.702 0.66 1.483 0.87
0.5 % ZnSO4 spray 25 & 45 DoS 0.67 0.688 0.68 1.631 0.917
Soil applied 25 kg ZnSO4/ha 0.679 0.683 0.72 1.301 0.845
CD at 5 percent 0.092 0.054 0.072 0.196 --
Source: Anonymous (2002-03)
3.10 Nitrogen Fixation
Inoculation of seeds of leguminous plants with rhizobia is important to increase nodulation and thus
nitrogen fixation. Strains of legume bacteria are selective in terms of which crop species they will
nodulate. Cross-inoculation groups have been developed to account for these differences. Any plants
within a cross-inoculation group can be inoculated with a culture of the right kind of bacterial strains.
Richmond (1926) stated that Guar belong to the cowpea cross-inoculation group. He also found that
rhizobia strain that formed nodules on cowpea also formed nodules on Guar roots. Plants grown from
inoculated seeds were slightly taller with more nodes on the main stem and weighed more than plants
grown from non-inoculated seeds. Nodulation was significantly correlated with shoot growth.
However, nitrogenase activity level per plant declined significantly with plant maturity. Oke (1969)
stated that the younger Guar plants seemed to be more efficient fixers of nitrogen than older ones.
3.11 Input Technologies in Guar
The adoption of technology differs on the basis of farmers’ perception, environmental conditions and
the existing area and productivity of the region. In other words for environmentally poor regions and
poor farmers for livelihood security only, LITs are applicable. On the other hand, for better

24
environments, prosperous farmers and export oriented and business oriented big houses HITs are
recommended. The practices adopted in HIT and LIT for production of Guar is exhibited in Table-9.
LITs
LIT is a way to optimize the management and use of internal production inputs (i.e., on-farm
resources) and to minimize the use of production inputs (i.e., off-farm resources), such as purchased
fertilizers and pesticides, wherever and whenever feasible and practicable, to lower production costs.
For the districts of Churu, Jaisalmer, Bikaner, Badmer, Bhuj, etc where soils are poor, rainfall is too
meagre (200-300 mm), farmers are not ready to afford more money due to fear of crop failures, for
such areas and farmers, inputs use have to be specific with priority for pure seed, seed treatment
against Root Rot and sowing methods. It will ensure that crop will not fail. In LIT regions where area
is large but productivity is low for instance in Bikaner, Jodhpur and Sikar, Guar is grown in 1.188,
0.662 and 0.144 million hectare with poor productivity of 180, 159 and 351 kg/ ha respectively.
Productivity needs to be increased to the level of 500, 400 and 600 kg/ha in Bikaners, Jodhpur and
Sikar, respectively (Table-10). It can be achieved in LIT regions with intensive efforts.
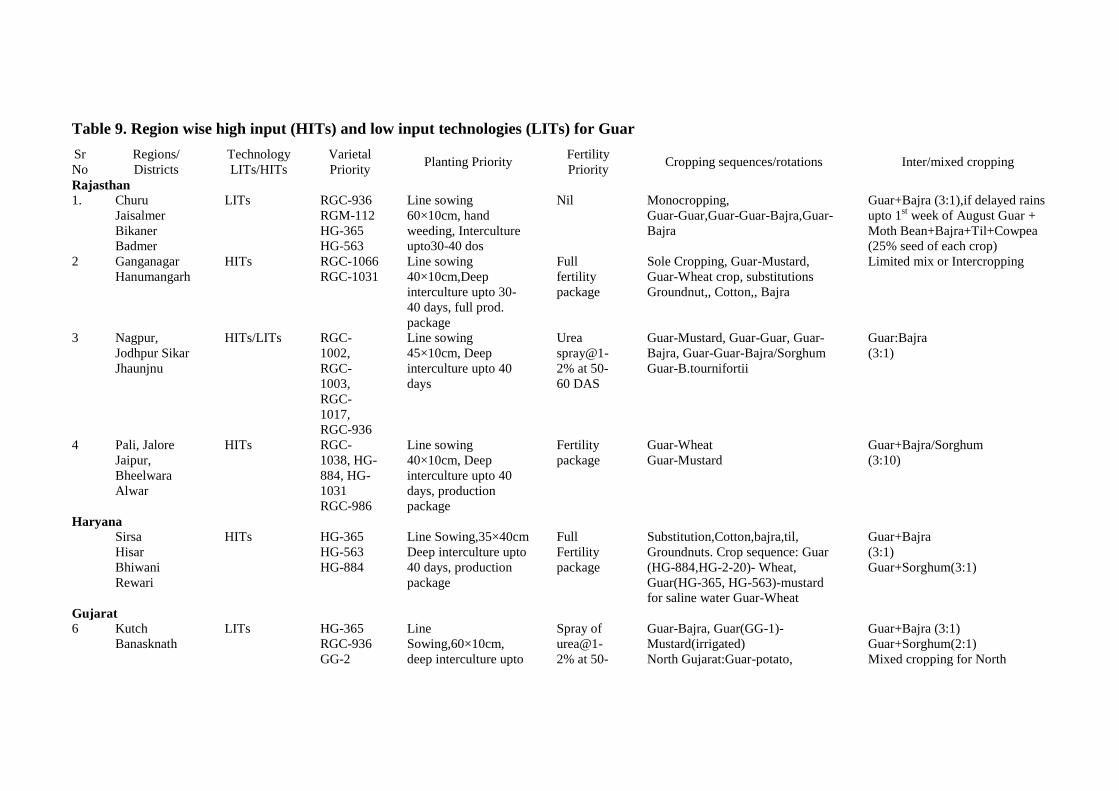
Table 9. Region wise high input (HITs) and low input technologies (LITs) for Guar
Sr
No
Regions/
Districts
Technology
LITs/HITs
Varietal
Priority Planting Priority
Fertility
Priority Cropping sequences/rotations Inter/mixed cropping
Rajasthan
1. Churu
Jaisalmer
Bikaner
Badmer
LITs RGC-936
RGM-112
HG-365
HG-563
Line sowing
60×10cm, hand
weeding, Interculture
upto30-40 dos
Nil Monocropping,
Guar-Guar,Guar-Guar-Bajra,Guar-
Bajra
Guar+Bajra (3:1),if delayed rains
upto 1st week of August Guar +
Moth Bean+Bajra+Til+Cowpea
(25% seed of each crop)
2 Ganganagar
Hanumangarh
HITs RGC-1066
RGC-1031
Line sowing
40×10cm,Deep
interculture upto 30-
40 days, full prod.
package
Full
fertility
package
Sole Cropping, Guar-Mustard,
Guar-Wheat crop, substitutions
Groundnut,, Cotton,, Bajra
Limited mix or Intercropping
3 Nagpur,
Jodhpur Sikar
Jhaunjnu
HITs/LITs RGC-
1002,
RGC-
1003,
RGC-
1017,
RGC-936
Line sowing
45×10cm, Deep
interculture upto 40
days
Urea
spray@1-
2% at 50-
60 DAS
Guar-Mustard, Guar-Guar, Guar-
Bajra, Guar-Guar-Bajra/Sorghum
Guar-B.tournifortii
Guar:Bajra
(3:1)
4 Pali, Jalore
Jaipur,
Bheelwara
Alwar
HITs RGC-
1038, HG-
884, HG-
1031
RGC-986
Line sowing
40×10cm, Deep
interculture upto 40
days, production
package
Fertility
package
Guar-Wheat
Guar-Mustard
Guar+Bajra/Sorghum
(3:10)
Haryana
Sirsa
Hisar
Bhiwani
Rewari
HITs HG-365
HG-563
HG-884
Line Sowing,35×40cm
Deep interculture upto
40 days, production
package
Full
Fertility
package
Substitution,Cotton,bajra,til,
Groundnuts. Crop sequence: Guar
(HG-884,HG-2-20)- Wheat,
Guar(HG-365, HG-563)-mustard
for saline water Guar-Wheat
Guar+Bajra
(3:1)
Guar+Sorghum(3:1)
Gujarat
6 Kutch
Banasknath
LITs HG-365
RGC-936
GG-2
Line
Sowing,60×10cm,
deep interculture upto
Spray of
urea@1-
2% at 50-
Guar-Bajra, Guar(GG-1)-
Mustard(irrigated)
North Gujarat:Guar-potato,
Guar+Bajra (3:1)
Guar+Sorghum(2:1)
Mixed cropping for North

GG-1 40 days 60 DAS Agri-silviculture system Guar with
P.cineraria
Gujarat: Bajra+Moth Bean
Cowpea+Guar
(0.40,3.0,5.0&3.75kg/ha
respectively)
Source: D. Kumar and K. S. Solanki (2012)

HITs
HIT is an intensive agriculture which uses fertilize, pesticides and modern machinery to guarantee a
large crop output. HITs are applicable for resource rich prosperous farmers mainly from districts like
Jaipur, Jalore, Alwar, Pali, etc having semi-arid region with high rainfall (400-500 mm) and
Ganganagar, Hanumangarh with low rainfall (300-350 mm) but availability of irrigation facilities.
Table 10. Region-wise area, productivity and proposed enhanced productivity of Guar in
Rajasthan through LITs
Regions Districts
Area
(million
ha)
Productivity
(kg/ha)
Proposed Productivity
(kg/ha)
Sikar Sikar and Jhunjhuni 0.144 351 600
Bikaner Bikaner, Churu and
Jaisalmer
1.188 180 500
Jodhpur Jodhpur, Barmer and
Nagaur
0.662 159 400
Source: Kumar and Solanki (2012)
3.12 Pest and Diseases of Guar
Guar is susceptible to a number of diseases but bacterial blight and Alternaria leaf spot are the major
ones. The productivity sometimes reduces greatly due to cultivation of traditional strains which are
late maturing and highly susceptible to a number of diseases. To enhance the yield and to improve
the seed quality there is need to increase awareness about the many diseases which deteriorate the
quality and yield of the Guar.
1. Alternaria leaf spot (Alternaria Cucumerma var. cyamopsidis)
It is seed borne disease affecting the Guar crop across the country. The disease is visible primarily
on leaf blade as dark brown, round to irregular spots varying from 2 to 10 mm in diameter. In the
early stage of infection, water soaked spots appear on the leaf blade which later on turn on greyish to
dark brown with concentric zonation, demarked with light brown lines. On the under surface the
spots are light to greyish brown. In severe infection, several spots merge together involving a major
part of the leaf blade. If the plants are infected in the early stage of growth, they may not flower,
thereby causing severe losses. High losses (43-87%) occur when it attacks at seedling and
reproduction stage. Excessive rainfall and humidity favours the incidence of this disease. The
maximum severity take place between bloom and pod set. Biochemical studies indicate that
polyphemol oxidase and peroxidise enzyme increase the intensity of ALS, while catalase enzyme
activities may reduce its intensity.
Control: Sowing of pathogen free seeds or cultivars resistant to pathogen. There are no resistant
varieties available. Zineb (0.2%) and copper oxychloride are two fungicides proved most effective as
two sprays at an interval of 15 days in controlling diseases. A combination of Zineb with

streptocycline is recommend for simultaneously controlling bacterial leaf blight and alternaria leaf
spot, diseases.
2. Powdery Mildew (Odio Taurica, Erysphe Taurica)
The disease manifests only on leaves. The affected leaves are covered with mycelial patches dotted
with the fruiting bodies. Severely affected plants are defoliated and weakened by premature drying
and death of infected leaves. The incidence of powdery mildew is more observed in the regions
where crop season is prolonged. Warm temperature (33% or above), highhumidity (more than 80
percent) and bright sunshine are congenial conditions for disease development. The perithecal stage
of the fungus first appears on the dried leaves. Under favourable condition the mildew causes
considerable defoliation.
Control: Application of benlate, sulphur compounds etc. inhibit the germination of conidia of
Erysiphe. Seed treatment with streptocycline (0.025%) and spraying a combination of streptocycline
and dinocap (both 0.01%) is very effective for controlling powdery mildew.
3. Dry root rot (Acrophomina phaseolina, R. solani, Fusarium cacrulenum roslsfii, Cecosmo
spora vasinfecta)
The disease is most severe under dry and warm growing conditions. It is caused by Macrophomina
phaseolina. The disease may occur at any stage of the crop from pre-emergence to maturity and can
appear as seedling blight or dry root rot. Seedling blight occurs primarily on the cotyledons in the
form of damping off or as elongated black cankers on growing seedlings. Infected seedlings can be
easily uprooted. In grown up plants, the disease appears as bronzing of leaves on one or more
branching followed by drooping of the upper tender parts of the shoots. Affected plants continue to
grow without having clusters or pods, but may break easily in strong winds. Nodule formation in
these plants also reduces drastically. Highly affected plants rarely produce any grain or produce
infected seeds.
Control: Rotation with less susceptible crops like moth bean or pearl millet or keeping the land
fallow reduce the population of pathogen. Mulching of the soil with pearl millet stover, low plant
density and farm yard manure singly or in combination of effectively conserved the soil moisture and
reduce the population densities of the pathogen. Incorporation of Zinc or Copper (5kg/ha) or Sulphur
(10kg/ha) coupled with FYM also bring down the dry root rot incidence. Bavistin seed treatment @ 2
g per kg seed and spray with the same @ 0.1 percent is suggestive measures to control the disease.

4. Bacterial Leaf Blight [Xathomonas axonopodis pv (Cyamopsidis)]
It may cause yield losses from 32 – 68 percent. The congenial situations causing spread of this
disease are scattered rains, high temperature (20-30 0C) and humidity. High nitrogen doses (20-40
kg/ha) may also result in higher disease index. Plants at early growth (20-30 days) may be more
susceptible, leading to their drying due to stem rotting. Presence of high specific activities of
oxidative enzymes, viz polyphenol oxidase and per-oxidase enzyme have their possible role in
disease resistance mechanism.
3.13 Integrated Disease Management
Integrated disease management approaches for Guar are as follows:
(i) Growing short duration varieties like HG-365, HG 563, RGC-936 to escape the disease
incidence
(ii) Using hot water treatment of seed (560C) for 10 minutes before sowing
(iii) Soil solarization in the month of May is found most effective in checking soil borne
pathogens
(iv) Spraying Streptocycline @ 150 ppm twice at 15 days interval at the appearance of BLB
(v) Spraying Di. M-45 @ 0.2 percent thrice at an interval of 15 days at the appearance of AB,
also spray imidacloprid once to check insect pests
(vi) Use kitazin @ 2 ml/kg seed along with Chloropyriphos @ 4 ml/kg and streptocyline @ 1g/kg
seed to check the presence of insect pests, fungi and bacterial during storage
(vii) Using mustard residue (2.5 t/ha) = Bacillus thuringiensis (ST) 4g/kg = One summer irrigation
to check pre and post emergence seedling mortality
(viii) Spraying the crop with wettable cresan and cupravid @ 1 kg/ha at an interval of 15 days at
the appearance of PM disease.
3.14. Climate and Variety
Guar is very drought-tolerant and sun-loving, but susceptible to frost. It requires sufficient soil
moisture before planting and during maturation of seeds. Frequent drought periods can lead to
delayed maturation. On the contrary, too much moisture during early phase of growth and after
maturation leads to lower seed quality. The pattern of rainfall plays an important role in the selection
of seed varieties of Guar (Table-11).

Table 11. Improved varieties of Guar suitable for different cropping regions of Rajasthan
Sr.
No.
Average Rainfall
(mm) Region/District
Cropped Area
(000 ha)
Productivity
(kg/ha) Varieties
Maturity
(days) Remarks
Rajasthan
1 170-200 Churu 315.00 235 RGC-936 85-90 Suitable for arid Rajasthan
Jaisalmer 190.00 10 HG-365 80-85 High viscosity (3500 cP) and ruling variety of
Haryana
2 200-250 Bikaner 411.00 215 RGC-936 85-90 Suitable for Haryana, high gum and viscosity
profile
(4050 cP)
Barmer 325.00 135 RGC-365 80-85
RGC-563 85-90
3 250-300 Ganganagar 180.00 807 HG-365 80-85
Hanumangarh 319.00 870 RGM-
112
85-90
RGC-
1066
100-105 Suitable for mechanical harvesting
4 300-350 Nagur 155.00 420 RGC-
1038
95-100 Suitable for summer season and wide spacing
(40-50 cm)
Jodhpur 183.00 180 HG-884 95-100 High gum content (30-31%) and viscosity
(3000-3500 cP)
5 375-400 Sikar 78.00 311 RGC-
1002
100-105
Jhunjnu 62.00 280 RGC-
1017
95-100
6 400-450 Pali 67.45 708 RGC-
1038
95-100
Jalore 69.50 675 RGC-
1031
105-108 Suitable for irrigated conditions
7 600-650 Jaipur 55.14 780 RGC-
1002
105-108
Bhilwara 37.00 600 HG-20-2 110-112 Gum content 31.41% suited for wider spacing
and irrigated conditions
8 700-800 Alwar 34.66 1000 RGC-986 115-120 Dual purpose and suitable for canal command
areas
Haryana
9 200-250 Bhiwani 90.00 900 HG-365 80-85

10 200-225 Mohindergarh,
Bawal
30.00 985 HG-563 80-85
11 300-350 Sirsa 101.00 1400 HG-884 95-100
12 250-300 Hisar 70.00 1200 HG-2-20 110-115
Gujarat
13 Banaskantha 61.60 604 GG-2 80-85
Kutch 58.10 610 HG-563 80-85
HG-365 80-85
RGC-936 85-90
Source: D. Kumar, Guar International Conference (2013), Jaipur

There are many varieties developed at national level from various research institutes but the most
favoured varieties are RGC 936 (Short duration early maturity), RGC 1002, RGC 1004 (Long
duration late maturity) and RGC 1031. When there is late onset of monsoon, farmers are giving
preference to RGC-936, a short duration variety which matures early. With early onset of monsoon,
farmers are giving preference to RGC 1002 and RGC 1004, long duration variety which matures late.
As seen in Table-11, climate of Rajasthan is having a mix of arid, semi-arid, humid and sub-humid
tropics. In arid (Western and North-west districts) and semi-arid (Central and Eastern districts)
tropics of Rajasthan, almost all varieties of Guar are being cultivated. As specified earlier, the
selection of varieties depends mainly upon onset of monsoon and that is why there is no specificity
in seed variety selection in these regions. In case of humid and semi-humid (Southern and South-
Eastern districts) tropics of Rajasthan, mainly RGC 936 is cultivated. Seed variety RGC-936 is well
suited to all the regions of state as well as country. The maturity period for RGC -936 is 70-90 days
only.
3.15 Summer Guar: An emerging Concept
Guar is a deep rooted, drought hardy, summer annual legume of great economic significance.
Historically, it has remained confined to very specific habitats of arid districts of Rajasthan, Haryana
and Gujarat. Sudden spurt in prices of guar gum from December, 2011 have attracted the attention of
corporate world, new and non-traditional farmers, traders and seed companies throughout the
country. The researchers have also explored the possibility of cultivating the crop in non-traditional
regions and in non-traditional season (s). The crop has shown potential to be grown during summer
season.
Certain promising genotypes and varieties of guar, consisting 6 (RGC-986, RGC-936, RGC-1066,
RGC-936-1-5-1, HG-884 and HG-563) during rainfed conditions of kharif 2011; and 10 (RGC-986,
RGC-936, RGC-1066, RGC-936-1-5-1, RGC-1031, RGC-1003, RGM-112, HG-884, HG-365, HG-
563) were evaluated during irrigated conditions of summer
2012. The outcome of the experiment reveals favourable
results for guar cultivated during summer season over
kharif season in terms of maturity period, plant height,
number of pods per plant and number of seeds per pod
(Table-12). The cultivation of guar in summer season may
help in increasing guar yield by 2.5 – 3.0 times,
percent gum content almost by 1.7, guar gum yield by 320
kg/ha and viscosity of guar gum by 339 cP over rainy
season. It has been due to climatic conditions (high
temperature, low humidity, and sunny sky) and controlled
availability of soil moisture proved useful in reducing
diseases and insect pests’ infection in summer season leading to better source-sink relationship.
Enhanced grain yield potential in summer season could also be due to better podding potential, and
more number of grains, besides, reduction in extra biomass. The new system provides avenues for
By shifting guar cultivation in
summer season, where 4-5
irrigations are available, grain
yield can be increased by 2.5 –
3.0 times over traditional
cultivation in rainy season.
Summer crop will enhance gum
yield and improve its quality.
Hence, it is new concept of
farming system encouraging
taking two crops every year in
arid and semi-arid regions.

guar cultivations in non-traditional season, economic use of available irrigation water, and increasing
cropping intensity in arid and semi-arid regions.
Table 12. Characteristics of different varieties of Guar in terms of maturity, plant height, pods
per plant and seeds per pod
Genotypes
Days to Maturity Plant Height (cm) No. of pods/ plant No. of seeds/ pod
Kharif
2011
Summer
2012
Kharif
2011
Summer
2012
Kharif
2011
Summer
2012
Kharif
2011
Summer
2012
RGC-986 76.88 94.33 70.19 49.60 52.09 60.17 6.94 8.00
RGC-1066 81.4 83.67 92.71 72.17 50.96 57.92 6.00 7.99
HGS-563 72.88 83.67 67.69 45.77 60.94 68.00 6.71 7.88
RGC-936-
1-5-1
72.13 88.00 71.73 48.04 51.60 60.00 7.13 8.50
HG-884 77.06 84.33 76.65 43.67 60.27 68.00 7.08 8.93
RGC-936 75.81 85.33 74.90 46.08 52.25 58.01 7.35 8.25
Mean 76.11 87.05 75.6 45.88 54.69 62.01 6.87 8.26
SEM(±) 2.24 1.07 3.90 2.05 1.66 4.13 0.08 0.23
LSD(p=
0.05)
8.16 3.38 14.19 6.45 6.05 13.00 0.29 0.73
LSD(p=
0.01)
12.80 4.81 22.26 9.18 9.49 18.49 0.46 1.04
4. DETERMINANTS INFLUENCING GUAR SUPPLY
AN ANALYSIS OF RAJASTHAN
Guar has emerged as an important export crop in recent year for its multiple uses in various
industries. Guar gum is one of the important items of export, and accounts for 18 per cent of India’s
total agricultural exports in 2012-13 (DGCIS).
The demand of processed Guar in world market is expected to increase with the expansion of shale
oil gas fracking to new countries like China and Russia and scaling up in prominent existing
countries like USA along with other uses in food and textile industries owing to increased food
safety and health concerns. According to energy consultants Wood Mackenzie, thousands of shale
wells are expected to be drilled in the USA, additionally around 400 shale gas wells are expected to
come from outside USA mainly confined to China and Russia during 2014. The fracking may also
commence in UK in 2014 after a suspension of 18 months ban imposed by the Government
(Bakhsh and Swint, 2013).
The food safety and health issues in cosmetics, food and textiles industries and use of appropriate
material in fracking to safeguard contamination of ground water is going to further consolidate
demand of processed Guar in world market. The increased demand is going to have an escalating
effect on prices as has been seen in recent years. The responsiveness of farmers to economic
incentives determines agriculture’s contribution to the economy specially where the sector is largest
employer of labour. Supply response is fundamental to an understanding of this price mechanism
(Nerlove and Bachman, 1960).
This makes it relevant to study the supply response of Guar crop particularly when the cultivation of
crop is confined to a limited geographical area. The supply response of a crop may be estimated in
terms of area, yield and output response. The study focuses on area and yield response. In economic
analysis of the dynamics of farm supply response, price is usually considered the most critical factors
which influence farmer’s production decisions (Khan et. al., 1988). However, acreage under a crop is
also influenced by various factors other than prices.
Other factors influencing supply response include weather, risk, and relative productivity. The crop
being rain-fed may be affected by the variability in intensity and pattern of monsoon during the
sowing season. Since the crop is not covered under prices support policy and experienced high price
fluctuations in recent years, the risk associated with the prices of crops may also play an important
factor in defining acreage under the crop. Relative productivity of Guar is important as a profit
oriented farmer will opt for most profitable crop.

Considering this, an attempt under the chapter has been made to work out the response of prices and
other factors on farmer’s decisions in allocating area under Guar crop. The simple Nerlovian lagged
adjustment model (Nerlove, 1956) has been considered appropriate to study the supply response of
Guar. Of all the econometric models used to estimate agriculture supply response, the Nerlovian
Model is considered to be one of the most influential and successful (Braulke, 1982).
4.1 Nerlovian Lagged Adjustment Model
In its simplest form, with one determinant, the model expressing linear relationship between the
planned acreage and the previous year’s price can be presented as the follows:
At* = a + bPt-1 + ut ………. (1)
At – At-1 = β (At* -
At-1); 0≤β<1 ………. (2)
At*
is the acreage farmers would plant in period t if there are no difficulties of adjustment. As At*
is
unobservable, equation (1) cannot be estimated. Therefore, assuming that acreage actually planted in
period t equals acreage actually planted in period t-1 plus a term that is proportional to the difference
between the acreage farmers would like to plant now and the acreage actually planted in the
proceeding period, hypothesis (2) is made. Technological/ institutional factors prevent the interned
acreage from being realized during the period and the parameter β is called the acreage adjustment
coefficient. Expressing At*
in terms of directly observation variables, the equation for estimation
become
At = ao + boPt-1 + co At-1 + vt ………. (3)
Where,
ao= aβ
bo= bβ
co = 1-β and
vt = β ut
The reduced form of the equation would remain basically the same even if additional independent
variables are incorporated into the estimating equation. The response relationship in this study was
estimated with the help of following equation.
ACREAGEt = bo + b1 PRICEt-1 + b2 ACREAGEt-1 + RPTYt-1 + RAINt + RISK + Ut
Where,
ACREAGEt = Current year acreage or planned acreage of Guar
PRICEt-1 = Last year price
ACREAGEt-
1
= last year acreage
RPTYt-1 = Relative per hectare productivity (INR/ha) of Guar to weighted average
productivity of other competing crops like Bajra, Maize, Groundnut and
Moong
RISK = Risk associated with the price assurance of the crop at harvesting time
measured in terms of standard deviation in previous years
RAINt = Rain received in the month of June and July during current year i.e. sowing

time
Ut = error term
4.2 Information Source
The analysis is confined to Rajasthan the leading Guar producing state. The information to estimate
the supply response using Nerlovian adjustment model has been obtained from various secondary
sources like publication of Department of Agriculture, CAZRI, Water Resource Department,
Rajasthan Agricultural Statistics at A Glance 2011-12, India Meteorological Department,
agmarknet.nic.in, www.india stat.com, etc. for the period 1981 to 2012. The estimates could not be
made for other emerging Guar producing states like Haryana, Punjab and Gujarat due to
unavailability of sufficient information.
The analysis for Rajasthan state also focuses on estimating the aggregate response function which
may slightly vary from the actual picture prevailing in the Guar producing area. District level
analysis generating more accurate estimates could not be worked out due to lack of consistent time
series information on all the relevant variables considered in the model. Nevertheless, it is assumed
that the results of the model would represent near real picture for following reasons:
(i) The Guar production in the state is confined to three divisions only namely Bikaner,
Ganganagar and Jodhpur consisting of seven districts. These three divisions accounted for
nearly 90 percent of total area under Guar during 2011-12.
(ii) The prices for a commodity of international importance traded on forward and futures market
are assumed to be integrated in different markets of the states. Even in case of absence of true
integration, it is believed that the inter-relationship of prices in different markets will follow
the same proportion over years.
The model considered for supply response also suffers from some limitations, as discussed below:
(i) The state level rainfall during the sowing season has been considered as a proxy variable not
only for actual rainfall received by the Guar producing area during sowing time but also for
various other weather factors like rainfall distribution through time and space, temperature,
humidity, sunshine, wind, quality of soil, etc. (Soontaranurak, 2011).
(ii) Standard deviation in prices prevailing in previous seasons is taken as a proxy variable to
represent the risk associated with the prices of the crop.
4.3 Results of the Supply Response Equation
The results of the Nerlovian relationship between area under Guar cultivation and prices, rainfall
during sowing period, risk associated with prices and relative productivity of Guar for the period
from 1982-2012 is presented in Table-13. The estimated coefficient for independent variables
included in the model have the signs as predicted theoretically except for relative productivity. The
results show that prices and production lagged by one time period and rainfall during the sowing
time have a positive influence on acreage under Guar crop while risk associated with the prices and
relative productivity of Guar in comparison to other competing crops has shown negative impact on
the area under crop.

The coefficient of prices of Guar in the previous season is positive and significant at 1 percent level,
showing that the increase in prices prevailing in one period will lead to an increase in the area under
Guar crop in the succeeding season. This shows that the farmers are responsive to the market signal
which sometime may not be the case in developing economies characterized by large number of
small and marginal farmers. In addition to lagged prices, the area under Guar crop cultivated mainly
under rain-fed conditions in the states is affected by the rainfall received during sowing time. The
same has been reflected by the positive coefficient of rainfall during the sowing time which is
significant at 1 percent.
Table 13.Regression results for the Guar supply response
Dependent Variable: Acreage under Guar Crop
Independent Variables Coefficients t Stat Significance
Constant 10.9349 3.03 1%
PRICEt-1 0.0084 6.29 1%
RAINt 0.2335 2.80 1%
ACREAGEt-1 0.0890 0.74 NS
RPTYt-1 -2.6326 -1.63 NS
RISK -0.0142 -3.02 1%
Adjusted R2 = 0.6876 Observations = 30 -- --
The coefficient of lagged acreage of Guar is also observed to be positive though statistically non-
significant indicating increase in acreage in one period will be followed by increase in area in the
following period. This may be true for various reasons like the tendency of farmers to re-use the seed
for four to five seasons generated from their own field after use of certified seed procured from some
specialized agency.
Acreage under a crop also depends on the productivity (value per hectare) of competing crops like
bajra, maize, moong and groundnut. The coefficient of relative productivity per hectare of Guar is
found to be negatively associated with the acreage under the crop. Though, the results are
statistically non-significant but reveals direction opposite to the theoretical believe. This may be an
indication of the fact that marginal price-differential may not be sufficient to induce the farmers to
change their traditional dictated and time tested crop rotation practice (Bhagat, 1989). There may be
other strong factors influencing the farmers’ decision to substitute crop like crop rotation systems
followed by the farmers, relative risk involved in growing crops and compatibility of their skills to
take a particular crop. There may be other constraints like irrigation and infrastructure, lack of
complementary agricultural policies, etc. (Bingxin, et al, 2010).
Agricultural production processes are generally a complex combination of decisions made under
conditions of risk and uncertainty. Agricultural production in developing countries particularly is
characterized by various kind of uncertainty (Colman and Young, 1989) including the difference
between the price prevailing at sowing time and at harvesting time. This uncertainty may influence
farmer in dedicating acreage for a particular crop. This factor has been incorporated in the model

though a proxy variable defined by the standard deviation of prices prevailing in previous seasons.
The coefficient of the variable is negative and highly significant suggesting that the acreage under
the crop will come down as the uncertainty increases even if the lagged prices are ruling high.
These variables together explain around 70 percent variation in the area brought under cultivation of
Guar crop in Rajasthan. This seems to be a reasonable fit considering the nature of Guar crop and
limitation of the model in terms of assumption and proxy variables considered.
4.4 Factors Determining Yield of Guar
The estimate of supply response of a crop depends on acreage and productivity. The acreage under a
crop is allocated based on expected prices while productivity is determined by availability of inputs
and climatic conditions. The farmers may make substantial revisions in the decision in terms of
inputs to enhance yield after allocating land. Hence, it is reasonable to assume that both area and
yield are influenced by the expected output price. The idea of yield response to price is further
supported by the literature that area function alone might under-estimate the actual level of supply
response. Farmers may display response by adopting better technology of production with no change
in area or by using more or better quality of inputs. Such responses will change the output without
changing the area, something that is hidden in the acreage function. The intensive nature of
cultivation will not be revealed by the input application alone, but will also be reflected in the quality
of inputs and the timing and the method of application (Mythili, 2008).
The yield response of Guar is assumed to be affected by prices and other factors like rain and the
production risk association with the crop. The response relationship of productivity of Guar with
other factors is estimated with the help of following equation.
PTYt = bo + b1 PRICEt-1 + RAINt + RISK + Ut
Where,
ACREAGEt = Current year productivity of Guar
PRICEt-1 = Last year price
RISK = Risk associated with the productivity of the crop at measured in terms of
standard deviation in previous years
RAINt = Rain received in the month of June and July during current year i.e. sowing
time
Ut = error term
The results of the relationship of productivity of Guar with last year prices, rainfall and production
risk for the period from 1982-2012 is presented in Table-14. The estimated coefficient for
independent variables namely lagged prices of Guar, rainfall during sowing time and the production
risk have the direction as predicted theoretically except for production risk.
The table shows that lagged prices are having a positive influence on the productivity but the results
are not statistically significant. The over dependence of the crop on nature in terms of rainfall and
other factors may have reduced the impact of prices only to define acreage and not productivity. The

coefficient of rainfall of Guar during sowing period is positive and significant at one percent level,
showing that productivity of Guar being cultivated in the state under rain-fed conditions is affected
by the rainfall mainly during the sowing period. The coefficient of independent variable production
risk measured in terms of variation in the yield during previous years has been found positive and
statistically significant at one percent level. The variation in yield in previous seasons is found to be
encouraging farmers to take better care of the crop to ensure better productivity.

Table 14. Regression results for the Guar yield supply response
Dependent Variable: Yield of Guar Crop
Independent Variables Coefficients t Stat Significance
Intercept -111.61 -1.25 1%
Lagged Price 0.05 1.28 NS
Rainfall 0.74 2.56 1%
Production Risk 1.07 2.80 1%
Adjusted R2 = 0.3769 Observations = 30 -- --
The equation has explained only 38 percent variation in the yield, which is attributed to following
reasons:
(i) Input related aspects could not be covered in the model
(ii) Policy aspects and infrastructure could not be included due to unavailability of information
(iii) Guar has over dependence on nature. Taking rain a proxy for all the weather related aspects
make it a weak link of the model.
The analysis reveals that the acreage allocation under the Guar crop in Rajasthan is responsive to
economic incentives expected as reflected by the positive coefficients of the last year prices.
Economic orientation of the farmers is also reflected by consideration of risk factor associated with
the crop in terms of fluctuation in prices. Though the prices of Guar have ruled high in recent years
but the farmers have reduced the acreage under the crop as a reaction to high fluctuation in prices. It
has also been observed that farmers are only willing to divert area from their traditional crop to Guar
only if significant relative monitory gains are expected. Marginal price-differential may not be
sufficient to induce the farmers to change their time tested traditional dictated crop rotations.
Another vital factor defining acreage under Guar crop is rainfall. Since the Guar crop is practiced
under rain-fed conditions in Rajasthan state, adequate and timely rainfall is required for farmers to
allocate area under Guar crop.
The rainfall has also emerged as expected a vital factor influencing the productivity of the crop
cultivated under rain-fed conditions. A detailed model capturing all the weather related parameter
could not be worked out due to paucity of information and relevant literature to establish relationship
of productivity with various other factors. Nevertheless, the model attempted including prices,
rainfall and risk associated with crop production has revealed that the most significant factor defining
productivity of Guar crop in Rajasthan is rainfall. Expected prices have shown an influence on
acreage but not on productivity. Under rain-fed conditions farmers rely on bringing more area under
the crop then enhancing productivity to increase supply in response to the prices.
4.5 Factors Influencing Productivity of Guar
The regression analysis has revealed rainfall as an important factor influencing the productivity of
the crop cultivated under rain-fed conditions. The relationship of productivity with various factors
other than rainfall like temperature, humidity, intensity of rainfall, etc. could not be worked out due
to paucity of information and relevant literature required to establish the relationship. However, an

attempt has been made on the basis of review of literature and interaction with the experts to find out
the association of different factors on productivity. The factors considered have been categories into
technical, climatic and social factors.
Technical Factors
(i) Certified seed – The availability of good quality certified seed can play a vital role in
enhancing the productivity of a crop mainly in case of guar which is a low input crop. In the
absence of availability of good quality seed the farmers are forced to rely on their own seed
which may severely affect the productivity due to mixture lines leading to different maturity
and different plant height.
(ii) Sowing Method – Method of sowing affects the seed germination, plant population per unit
area and crop yield. The most common practice i.e. broadcasting should always be avoided
because it gives higher weed population and results in poor resource management. Optimum
plant population with respect to the rainfall received in the area can help improving the yield
of the crop. The same may be maintained through Inter and Intra Row Distances strategies.
(iii) Weed management – Weed management is very important in cultivation of guar as the
initial growth of the crop is very slow posing serious exposure to weeds. It is therefore very
important to clear the field from weed mainly within 20 days; another weeding is required at
35-40 days. Weeds in guar may causes reduction in yield in the range of 30-50 percent and
loses may go upto 70-90 percent depending on the intensity of weed infestation. Weed
control alone may help in increasing the seed yield in guar by more than 60 percent (Kumar,
2009).
(iv) Supplementary Irrigation – Though the crop being cultivated mainly under rainfed
conditions due to its drought tolerant nature but the moisture is required by the crop at some
critical stages like germination and flowering. In the absence of rainfall, a supplementary
irrigation during the flowering state may help in enhancing the yield of the crop.
(v) The production inputs like sowing methods, improved variety; weeding along with fertilizer
application were studied at multi-location farmer’s field to evaluate the influence of these
factors on productivity under rainfed conditions. Results have been presented in Figure-11.
Sowing method has emerged as the most critical component. The showing method resulting
in optimum plant population obtained from line sowing at adequate spacing of 60, 45 or 35
cm may increase grain yield up to 35 percent. Fertilizer application (20 kg N + 30-40 kg
P2O5/ha) in the form of basal dose only drilled before sowing may help in increasing the grain
yield by about 31.24 percent. The role of pure seed of suitable variety for the region
depending on rainfall and soil type has been found to be 27 percent in increasing grain yield.
Weeding at critical stages (upto 30-35 days of sowing) may increase grain yield by 26
percent
Figure 11. Effect of different components on grain yield of Guar FLDs during 2002-07 (Total
Field Level Demonstration, FLDs conducted 463)

Climatic Factors
(i) Rainfall – Guar is being mainly cultivated under rainfed conditions. The crop tolerant to
drought condition requires adequate moisture at some critical stages. The relationship
between distribution of rainfall and critical stages of the growth of crop is presented in Table-
15. The crop needs dry weather during the maturity time and rains during the last fortnight of
maturity can be detrimental to the production. The spread of rainfall through the crop cycle in
a more or less consistent manner is an important determinant influencing the guar production.

Table 15. The rainfall requirement with respect to growth state of guar crop
Stage of growth Days Rainfall (mm)
Sowing/ germination 0-6 days 30-40 mm
Branching 20 days 75-95 mm
Flowering 50-60 days 75-95 mm
Pod formation 70-75 days 75-95 mm
Seed Maturity 75-90 No rainfall
(ii) Temperature – The crop flourishes better under hot conditions and is sensitive to cold. The
range of maximum and minimum temperature during day and night is presented in Table-16.
The optimum temperature for obtaining maximum yield is 15 to 35 oC. The crop starts
deteriorating at temperature above 40 oC
Table 16. The optimum temperature requirement for achieving maximum productivity of
guar
Temperature Minimum Maximum
Night temperature Above 15 oC --
Day temperature Above 15 oC Less than 35
oC
(iii) Humidity – Humidity has a major role to play in the overall growth of the crop. The crop
prefers longer days with humidity in the range of 60-70 percent. During germination slightly
more humid conditions are required (70-80%). During maturity crop requires warmer days
with less humidity and no rainfall is required.
Social Factors
The crop is being cultivated under rainfed conditions as low-input crop. The farmers use minimal
off-farm inputs and provide limited interculture care. The crops need to be approached with a
commercial perspective and the farmers need to be trained to adopt irrigation, better inputs and
better cultivation practices, Guar producers intend to reap benefit in the short run by taking
advantage of the price rise. The long run benefits can be accrued by focusing on yield enhancement.
Use of High Input technology (HIT) needs to be fostered in the area of good rainfall and Low Input
Technology (LIT) in rainfed cropping areas. A judicious balance between HIT and LIT will be
helpful in getting better returns from cultivation.

5. MARKETING AND DISTRIBUTION OF
GUAR
5.1 Guar Supply Chain
Guar seed is used for animal feed, extracting Guar split, powder and Guar gum. There are number of
Guar processing units in Jodhpur, Bikaner, Ganganagar, Alwar and Jaipur districts of Rajasthan
state, Bhiwani and Sirsa districts of Haryana state and Deesa and Ahmadabad districts of Gujarat
state. These units can be grouped into Guar split manufacturers and Guar gum processors. Though
the involvement of processing and high demand in international market have made the marketing and
distribution of guar crop very complex, Agriculture Produce Marketing Committee (APMC) markets
have an important role to play in the supply chain. The APMC market (also called Mandis) provides
a platform for aggregation and operation for various players operating at the wholesale level like
traders, stockists, etc. The trade in these markets are facilitated by commission agents and the traders
have to pay prescribed market fee on the value of transaction. Mandi fee for Guar in Rajasthan is
charged at the rate of 1.60 percent of value, while in Haryana it is 1.0 percent, in Gujarat it is 0.50
percent and in Punjab there is no market fee charged on Guar trade. These markets have peak arrivals
of Guar seed in the month of November and December. The major markets for guar in different
states are given in Table-17.
Table 17. Major APMC trading centres for Guar seed in India
State Mandi
Rajasthan Jodhpur, Bikaner, Sriganganagar, Hanumangarh, Churu, Sikar, Jaipur, Jaisalmer,
Barmer, Nagaur, Nokha, Renwal
Haryana Adampur, Fatehabad, Hisar, Sirsa, Bhiwani, Ellanabad
Gujarat Kachch, Banaskanta, Sabarkanta, Mehsana, Patan, Ahemdabad
Punjab Bhatinda
Source: agmarknet.nic.in
The commission agents charge a prescribed brokerage of two percent from the buyers to facilitate the
trade in APMC markets. The trade in these markets takes place on the basis of physical examination
based on the traders defined industry grades, although AGMARK grades are available. The long
storage life of the commodity facilitates the traders in releasing the commodity purchased from the
market in staggered way as per the demand. The price in the market (trader to miller) is influenced
by the stock positions. Most of the traders store Guar bean in their own storage warehouses instead
of accredited warehouses. Warehousing facilities for storage of Guar bean is inadequate. The quality
of the commodity is not maintained properly at the warehouses and strict regulations for the
warehouses should be introduced under new initiatives like Warehousing Development and

Regulatory Act 2007. Such arrangements will also facilitate farmers in availing the benefits of
pledge financing, which at present is not reaching farmers and other stakeholders.
The supply chain of guar and its various derivatives is presented in Figure-12. As can be seen, split
manufacturers procure Guarbean either from village traders or from farmers in the market (Mandi)
through commission agents. Another chain which exists in the market is direct sale by farmers to
traders/ stockist through commission agent. Subsequently, the traders sell it to split manufacturers or
Guar gum processors. Processors after processing Guar seed into split either export directly or
through exporters. Processors also sell Guar split to the local gum processors. Similarly, gum
processors source Guarbean either from village traders, farmers through commission agents, stockist/
traders or procure split from split manufacturers. After processing of Guarbean/ split into different
industry specific Guar gum products, the final product is exported and/or made available to the
domestic market.
Majority of the processed product is being exported and only a small quantity is being consumed in
the local market. At processors level, the splits are packed in plastic bags of 50 kg size while Guar
powder is packed in paper bags of size 25 kg of powder. These packets are arranged in containers
consisting of 800 packets for smooth bulk movement. These processed products are being stored at
the trader/ processor level by their own arrangements. The assessment of current stocks and
carryover stock in this situation is quite difficult and hence leads to speculation. Although market
forces determine the price in long run but the Guar industry has witnessed high price fluctuations in
the recent years.

Figure 12. Supply chain of guar
5.2 Distribution of Guar bean
The surge in demand in international market and consequent strong surge in prices has created
interest for the Guar crop amongst all the stakeholders involved in the marketing and distribution.
Broadly, there are three important players involved in the distribution of guar i.e., producer-farmers,
wholesalers and processors.
Producer-farmers are important not only for the production but also for their behaviour defining the
quantity of marketable surplus. The crop which traditionally has been popular among resource poor
small holders has been retaining a portion of their produce mainly for seeds. However, in recent
years the high prices of the crop have made it competitive and popular among large farmers also, and
they have a tendency to stock in anticipation of good prices. Farmers are generally retaining around 8

percent of their production for seeds and price advantage. There are around two percent post-harvest
losses also due to poor handling of the crop. The estimates presented in Figure-13 are based on
information collected through interaction with a small sample of producers and other stakeholders
and thus are indicative only.
At the wholesale level, majority of the produce i.e. 86 percent of the bean is procured by the
processors for preparation of guar gum and splits. Of this, about 80 percent is utilized for guar gum
preparation and 6 percent for split preparation. A small portion of beans (4 percent) is processed into
split directly at wholesale level by some traders to take advantage of price in international market for
guar split.
Figure 13. Distribution of Guar seed produced
Farmers
Farmers Level Seed and Stock (8%) Losses (2%) Surplus (90%)
Wholesale Levels Wholesaler/Traders/Stockiest
Processors Level Processors
Guar Gum Guar Split
5.3 Consumption and demand of Guar Seed
Considering the importance of Guar as an export crop, an attempt has been made to work out the
quantity of Guar bean (in terms of equivalent of quantity exported) exported and consumed
domestically. An estimate has also been made of the Guar bean equivalent being exported to USA to
assess the size of US Market, and its importance for Guar and Guar processing industry. The analysis
is based on the assumption that the Indian Guar processing industry is realizing 29.25 percent of
Guar gum from the Guar bean. The quantity left unaccounted after export to US and rest of the world
is considered to be consumed in domestic market (Table-18).
90
%
86 %
4 %
80
%
6
%
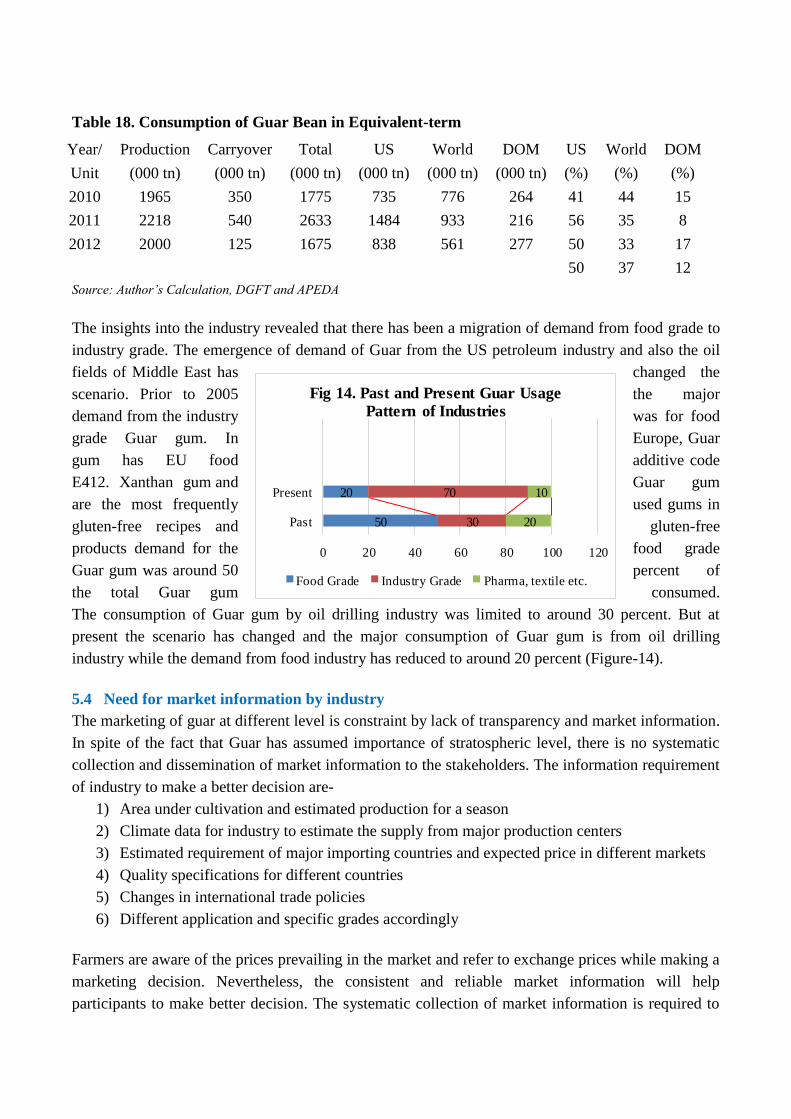
Table 18. Consumption of Guar Bean in Equivalent-term
Year/
Unit
Production
(000 tn)
Carryover
(000 tn)
Total
(000 tn)
US
(000 tn)
World
(000 tn)
DOM
(000 tn)
US
(%)
World
(%)
DOM
(%)
2010 1965 350 1775 735 776 264 41 44 15
2011 2218 540 2633 1484 933 216 56 35 8
2012 2000 125 1675 838 561 277 50 33 17
50 37 12
Source: Author’s Calculation, DGFT and APEDA
The insights into the industry revealed that there has been a migration of demand from food grade to
industry grade. The emergence of demand of Guar from the US petroleum industry and also the oil
fields of Middle East has changed the
scenario. Prior to 2005 the major
demand from the industry was for food
grade Guar gum. In Europe, Guar
gum has EU food additive code
E412. Xanthan gum and Guar gum
are the most frequently used gums in
gluten-free recipes and gluten-free
products demand for the food grade
Guar gum was around 50 percent of
the total Guar gum consumed.
The consumption of Guar gum by oil drilling industry was limited to around 30 percent. But at
present the scenario has changed and the major consumption of Guar gum is from oil drilling
industry while the demand from food industry has reduced to around 20 percent (Figure-14).
5.4 Need for market information by industry
The marketing of guar at different level is constraint by lack of transparency and market information.
In spite of the fact that Guar has assumed importance of stratospheric level, there is no systematic
collection and dissemination of market information to the stakeholders. The information requirement
of industry to make a better decision are-
1) Area under cultivation and estimated production for a season
2) Climate data for industry to estimate the supply from major production centers
3) Estimated requirement of major importing countries and expected price in different markets
4) Quality specifications for different countries
5) Changes in international trade policies
6) Different application and specific grades accordingly
Farmers are aware of the prices prevailing in the market and refer to exchange prices while making a
marketing decision. Nevertheless, the consistent and reliable market information will help
participants to make better decision. The systematic collection of market information is required to
50
20
30
70
20
10
0 20 40 60 80 100 120
Past
Present
Fig 14. Past and Present Guar Usage
Pattern of Industries
Food Grade Industry Grade Pharma, textile etc.

be followed by assured, reliable and consistent dissemination of market information to farmers and
industry. The extension and advisory service also needs to be geared up to enable farmers, traders
and processors to be able to make analysed decision for present and future.
Presently there is no dedicated organization performing task of collection and dissemination of
market information to the stakeholders in public domain. There are discrepancies in data collected.
However, the Guar industry is largely driven by private players who have their own mechanism of
survey and collection of information. Such discrete efforts need to be consolidated to from a reliable
mechanism of market information and advisor services.
Value addition and processing of Guar seed are the most important components of the market. There
is lack of technology, proper research and development efforts, skilled manpower, etc. Processing
industry is fragmented and most of the units are operating on small scale. There is a need for
consolidation to achieve economies of scale and a stable market for Guar.

6. PROCESSING AND USAGE
OF GUAR
The Guar seed consists of three parts namely the seed coat (14-17 percent), the endosperm (35-42
percent), and the germ (43-47 percent). The different constituents of the Guar seed are presented in
Table-19. Guar gum the prime marketable processed product of the plant comes from the endosperm.
The other by-product of the processing like Churi and Korma are used for Cattle feed. Various steps
involved in the processing of guar seed is presented in Figure-15.
Table 19. Constituents of Guar grain
Part of Seed Protein
%
Ether Extract
%
Ash
%
Moisture
%
Fibres
%
Types of
Sugar
Hull (14-17%) 5 0.3 4 10 36 D-glucose
Endosperm
(35-42%)
5 0.6 0.6 10 1.5 Galactomannon
Germ (43-
47%)
55.3 5.2 4.6 10 18 Glucose
6.1 Guar Splits
When the polished endosperm are removed and separated from the fine layer of fibrous material a
husk and refined Guar splits are obtained.
6.2 Guar Powder
These refined splits are then pulverized and treated and processed for specialty grade products for
usage in industries. After pulverization, sieving is done to get the required mesh size i.e. fine, coarse,
etc. and is converted into powder by a variety of means and processing techniques depending upon
the desired end product. The Guar gum is mechanically extracted by roasting, differential attrition,
sieving and polishing of Guar seeds. The sieved gum is then passed through the blenders to make it
homogenous and later it is packed for marketing. The gum is refined to make yellowish white
powder as per the quality specifications required by user industries and grades specified.
The processors dominated marketing of Guar seed operates on the trade defined standards. However;
specifications for Guar seed have also been defined by Directorate of Marketing and Inspection
through AGMARK standard.
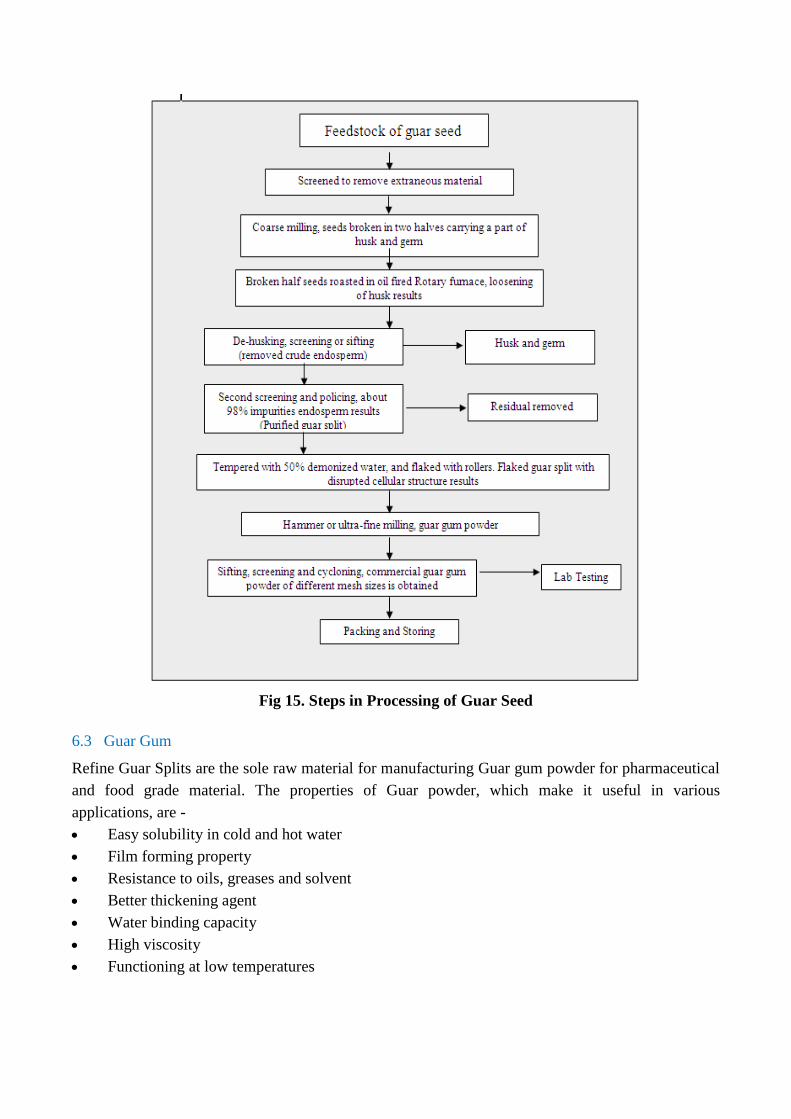
Fig 15. Steps in Processing of Guar Seed
6.3 Guar Gum
Refine Guar Splits are the sole raw material for manufacturing Guar gum powder for pharmaceutical
and food grade material. The properties of Guar powder, which make it useful in various
applications, are -
Easy solubility in cold and hot water
Film forming property
Resistance to oils, greases and solvent
Better thickening agent
Water binding capacity
High viscosity
Functioning at low temperatures

6.4 Efficiency of Processing Industry
The Guar seed is consumed primarily by the processing industry for the extraction of Guar gum
which fetches high prices in export market. Only a small proportion of raw Guar seed processed for
Guar gum is consumed in the domestic market mainly the by-products like churi and korma for
animal feed. Since the efficiency of any processing industry is defined by the realization of main
product from processing, an attempt has been made to analyse the rate of realization of Guar gum
and other derivatives from the Guar seed through processing. Compilation of information collected
through interaction with processors of different size using varied degree of technology has revealed
that only 29.25 percent is realized as Guar gum from the total quantity of seed processed. A large
proportion of the raw material to the tune of 66.5 percent is received as by-product in the form of
Churi (34.5 percent) and Korma (32.0 percent). A waste of 4.25 of the raw seed has also been
observed with the use of existing Guar seed processing technology (Table-20). The realization of
Guar gum from seed may be enhanced by adopting better technology, minimization of waste and
promoting high gum content seed varieties. Cultural practices may also help in improving the gum
content of seed as has been suggested by various research studies.
Table 20. Realization of different product from processing of Guar bean
Processed outcome Share (%)
Gum 29.25
Korma 32
Churi 34.5
Waste 4.25 Source: Primary Survey
6.5 Uses of Guar and its derivatives
Guar was traditionally used for feeding animals in Rajasthan and green pods were used for vegetable
purpose. With the development in processing technology in the country, Guar seed is being used for
extracting gum powder, which has many applications including food preparations, beverages, textiles,
paper industry, petroleum industry, mining, explosives, pharmaceuticals and cosmetics
6.6 Traditional Uses of Guar
The traditional uses of Guar are as following:-
Human Consumption
Immature pods are dried, salted and preserved for future use
Immature pods are dried and fried like potato chips
Green pods are cooked like French beans
Mature seeds are used as an emergency pulse in time of drought

Cattle Feed
Plants are cut and used as green forage.
Beans are used as high protein feed.
Medicinal Purposes
Plants are mashed, then mixed with oil and used as a poultice on cattle boils.
Leaves are eaten to cure night blindness.
Seeds are used as a chemotherapeutic agent against smallpox.
Boiled Guar seeds are used as poultices for the plague, enlarged livers, and head swellings and
on swellings due to broken bones.
Seeds are used as laxative.
Crop and Soil Improvement:
Plants are used as shade for ginger
Guar commonly is used as a cover crop and green manure.
Industrial Use
The guar gum is being consumed in a variety of industries ranging from oil drilling to textile, paper,
explosive, food processing, pharmaceuticals, cosmetics, etc. The Industry-wise applications of Guar
gum are presented in Table-21.
Table 21. Industry-wise applications of Guar gum derivatives
Sr.
No. Industry Uses Derivatives Functions
Industrial/ Technical
1. Oil well drilling Driling Fluids
hydraulic fracturing
Borate cross-linked guar
gum, hydroxy alkyl ether
derivatives
Control of water loss,
viscosity, suspension,
turbulence, mobility, friction
reduction
2. Textile Printing Cotton, Rayon silk,
wool sizing, carpet
printing
Carboxy-methyl guar,
hydroxy propyl guar,
modified guar gum
Reduces wrap breakage,
reduces dusting film forming
thickening for dye
3. Paper Wrapping paper,
kraft, photographic
paper, filter
Oxidized guar gum, cross-
linked guar gum, amino
ethyl gum, modified guar
gum, guar gum formate,
Replaces hemi cellulose,
increase strength, fold, pick,
pulp hydration, retention of
fines, decreases porosity
4. Mining Concentration of
ore, filteration
Aminoethyl guar gum,
sulphate of guar gum
Flocculating and settling
agent, filter aid
5. Explosive Stick explosive,
blasting slurries
Reticulated guar gum,
cyanoethyl ether of guar
gum
Water proofing, gelling
agent
6. Water Treatment Industrial water,
drinking water
Food grade guar gum Coagulant aid (food
approved)
7. Tobacco Reconstitution of
fragmental tobacco
Reaction product of
carboxymethyl cellulose and
guar gum
Binding agent, strengthening
agent

Sr.
No. Industry Uses Derivatives Functions
8. Coal Mining Coal suspension,
shock impregnation
Borate cross-linked guar
gum
Friction reducing suspending
agent
9. Fire fighting Water for fighting
fires
Guar gum with ethylene
glycol and glycerol
Friction reducing, dispersion
and direction control
10. Ceramic Enamels,
electroceramics
Chlorinated guar gum Fixing, binding thickening
agent
11. Photography Emulsions, gelatine
solutions
Borate cross linked guar
gum, hydrolysed guar gum
Gelling, hardening agent
12. Synthetic Resins Polymerization,
suspension, collagen
dispersion
Suspension of guar gum with
CMC
Thickening, Binding agent
Food Applications
13. Frozen foods Ice creams, Soft
serves, frozen cakes
Food grade guar gum with
CMC
Water retention, ice crystel
inhibitor, stabilizer
14. Bakery Bread, Cakes,
Pastry, Icing
Non-metabolised guar gum Dough improvement, greater
moisture retention,
prolonged self life
15. Processed
Cheese
Cottage cheese,
cream cheese
In combination with other
water soluble gums
Increase the yield of curd
solids, improves tenderness
16. Dairy Products Yoghurts, desserts,
molasses
In combination with other
water soluble gums
Inhibits when separate keeps
texture after sterilization
17. Dressing and
Sauses
Salad cream, pickles,
barbecue relish
In combination with other
water soluble gums
Fast, cold dispersible
thickening and texturising
agent
18. Instant mixes Pudding sauses,
desserts, beverages
In combination with other
water soluble gums
Fast, cold dispersible
thickening and texturising
agent
19. Canned Foods Pet foods, corned
meat, baby foods
In combination with other
water soluble gums
Acid resistant thickening and
suspending agent
20. Beverages Cocoa drink, fruit
nector, sugarless
beverages
In combination with other
water soluble gums
Acid resistant thickening and
suspending agent
21. Animal Feed Veterinary
preparations, calf
milk replacer
In combination with other
water soluble gums
Suspending agent,
granulating agent
Pharmaceuticals
22. Pharmaceuticals Laxative,
slimming aids
Gastric hyper
acidity
Diabetic
treatment
Cholesterol
Vitamin
formation
preparation
Food grade guar gum
Food grade guar gum
Food grade guar gum
Food grade guar gum
Food grade guar gum
Bulking agent, bulk forming
appetite depressant
Synergistic activity with
bismuth salt
Reduction of urinary glucose
loss
Reducing aid
Stable water soluble
suspension
Cosmetic
23. Cosmetics Ointment
Lotions
Hydroxypropyl guar (HPG)
Hydroxypropyl guar (HPG)
Food grade guar gum
Thickening agent gives
unctuousness
Lubricating, suspending
agent
Disintegrating and

Sr.
No. Industry Uses Derivatives Functions
Tablets
Hair Shampoos
Hair Conditioners
Cationic guar
Hydroxypropyl guar (HPG)
granulating agent
Detergent compatible
thickener
Protective colloid film
forming agent
Source: NIAM, 2010
The major consumer of Guar gum is oil drilling and mining with the global consumption of 60-65
percent followed by food processing industry accounting for 25-30 percent consumption. (Table-22)
Table 22. Application-wise Global consumption of Guar Derivatives
Type of
Application Target industries
Global
Consumption
Food grade
Bakeries (Bread), Dairy (Ice cream, Sherbets, Cheese etc.),
Dressing (Sauces, Ketchup’s), Beverages (Chocolate drinks) &
Pet Food (Thickener)
25-30%
Pharmacy
grade
Cosmetics & medicines (as binder and thickener) Slimming,
(Reducing weight & laxative) 05-10%
Industrial
grade
Oil drilling (as a well stimulant and fraction reducer), Mining
(increased yield, filter aid), Explosives (Gelling agent), Coal
Mining (fraction reducer, binding)
60-65%
Other
Textile printing (Thickening agent for dyes), Paper (increase
strength and decrease porosity), Tobacco (binding and
Strengthening) & Photography (Gelling and Hardening)
5-10%
Source: NIAM, 2010
A by-product of the Guar processing is Guar meal (mixture of husks and germ) which is a potential
source of protein. It is used for cattle as well as poultry feeding. Toasting of Guar meal improves its
nutritive value. It can be used up to 10 percent in poultry diet and can replace up to 100 percent
protein supplements such as ground nut oil cakes in ruminants. Various derivatives of Guar gum are
available that will stiffen gels even up to a water content of 99 percent. Commercially important
derivatives of Guar gum are:
Hydroxy and Carboxy Alkylated Guar gum
Oxidized Guar gum
Acetates of Guar gum
Cationic derivatives of Guar gum
Sulphated Guar gum
Guar gum formate
Guar gum acryl amide
Borate cross linked Guar gum
Reticulated Guar gum
Carboxy methyl hydroxy propyl Guar gum
Depolymerized Guar gum

Guar gum has emerged as India's top farm export overtaking traditional heavyweights rice and cotton
and looks set to power into the league of top 10 shipments from the country, due to increasing
demand from the US oil and gas industry. The Guar gum exports have shot up nearly 139 percent on
a year-on-year basis between April and January 2013, with shipments of about $4.9 billion. In the
previous year, it rose 374 percent in January alone compared to the same month of 2011.

7. PRICE AND TRADE OF GUAR
7.1 Price Movement of Guar
Guar bean has shelf life of more than 3 years without losing out on any of its properties or qualities.
It requires the minimum maintenance and handling
environment. Therefore, traders or stockist store
guar for as long as 6-7 years. However, prices of
Guar bean as well as its derivatives very much
depend on the monsoon condition and its likely
production.
The prices are observed to be highly volatile
during monsoon months due to market speculation.
There is a good correlation between rainfall and
production in Rajasthan as the Guar crop is rain-
fed. The effect of rainfall on production is seen less
in case of Haryana where Guar is an irrigated
crop. The other factors like pattern of arrival,
demand from millers and export also cause
volatile price movement.
7.2 Fluctuation in Spot prices
The spot price of Guar seed for the last 7 years i.e., from 2007 to 2013 reflects high volatility of
prices. The Spot price at Jaipur market and Sri Ganganagar are analyzed. The price fluctuates highly
during monsoon period i.e. July to October. Guar seed traded at Kishangarh Renwal market between
INR 4000/qt. during Oct, 2012 to INR 15000/qt. in the month of December, 2012. In 2013 the
highest price at Jaipur was recorded in the month of January at INR 14400/qt. and lowest recorded
was INR 4200/qt. in August. Highest fluctuation in prices of Guar bean has been observed in the
year 2012. During the year 2012, prices at Sri Ganganagar market ranged from INR 7752/qt. to INR
28556.2/qt. Annual volatility (measured as Coefficient of Variation) in Mandi prices of Guar seed at
different markets has been worked out and presented in Table-23.
Factors Influencing Guar Price
1. Rainfall during sowing and critical
stages of growth
2. Area sown under the crop in major
states like Rajasthan, Haryana,
Punjab, Gujarat, etc.
3. Pattern of arrivals on a regular basis
in markets like Jodhpur, Bikaner,
Sriganganagar, Adampur, Bhiwani,
Siwani, etc.
4. Demand from millers or processors
and export demand
5. Carryover stock.

Table 23. Volatility in Guar bean Prices (C.V. in %)
Year Rajasthan Haryana
Ganganagar Jaipur Hanumangarh Adampur Fatehabad Hissar
2007 5.5 6.0 5.9 6.0 6.7 6.9
2008 7.2 8.5 7.8 8.0 7.1 9.6
2009 20.9 19.3 22.0 21.1 21.5 20.2
2010 7.8 8.4 8.0 6.7 8.3 14.7
2011 29.4 50.6 36.1 28.1 29.5 25.4
2012 46.1 38.5 33.8 47.7 56.3 56.7
2013 29.2 39.5 28.3 24.5 23.5 56.6
Source: Agmarknet
Results of the analysis reflect that there was high volatility in prices of Guar bean at Hissar (56.7%
and 56.6% in 2012 and 2013, respectively), Fatehabad (56.3% in 2012), Jaipur (50.6% in 2011),
Adampur (47.7% in 2012), Sri Ganganagar (46.1% in 2012) and Hanumangarh (36.1% in 20011)
markets, as indicated by the higher magnitude of CV in the respective markets.
The price of Guar seed ranged from INR 4000/- per quintal to INR 11000/- quintal at Jaipur market
in 2013. While for the same period the price range at Sri Ganganagar was from INR 7752/- per
quintal to INR 28556/- per quintal. In the year 2013 the ranges of price at Jaipur and Sri Ganganagar
market were INR 4361/- per quintal to INR 11482/- per quintal and INR 5004/- per quintal to INR
11743/- per quintal respectively.
The high price fluctuation in Guar is mainly on account of higher fluctuation in area and production
of Guar seed depending on the spread and level of monsoon rainfall in the producing centers and the
export demand of Guar gum from the importing countries.
7.3 Futures Trade for minimizing Price risk
Futures trade in agri-commodities provides good hedging platform for the farmers, processors,
exporters, etc. in the value chain. Futures trade in Guar bean started in the month of April, 2004 on
NCDEX platform with the objective of price discovery and price risk management. Futures contracts
for Guar gum are traded mainly on NCDEX platform. The total value of output of Guar seed is
estimated at INR 1,238 crore during 2005-06 (June – July), which has enjoyed a futures turnover of
INR 299,305 crore (242 times of Guar output) during May 2005- March 2006.
Total value of Guarbean and Guar gum traded on NCDEX has continuously increased in the initial
years and reached to the peak during 2006-08. In 2006 Guar bean and Guar Gum together
contributed to 45 percent of total agricultural commodity traded at NCDEX and 37 percent of overall
commodity trade of the exchange. The trend was continuing till 2008 as 39 percent of agricultural
commodity trade was from Guar only. From the year 2009 the share of Guar in agricultural
commodity trade and overall commodity trade of NCDEX started declining. In the year 2010 the

share of Guar in total agricultural commodity trade of NCDEX was only 13 percent. Up to
November 2013, the share of Guar in total commodity trade of NCDEX is only around 9 percent.
Table 24.Volume and Value of trade on Commodity Exchange
Volume in 000’s Metric Tons and Value in INR billion
Year
Guarse
ed
(A)
Guarg
um
(B)
Total
A+B
% of Agri trade at
NCDEX
% of Total Trade at
NCDEX
200
4
Volu
me 47154 2189 913.1
4 13 11
Value 805 108
200
5
Volu
me
18872
1 7631 3550.
99 6 5
Value 3202 349
200
6
Volu
me
14095
7 3062 2975.
34 45 37
Value 2823 152
200
7
Volu
me 65042 1112 1258.
14 44 38
Value 1207 51
200
8
Volu
me 60372 839 1154.
53 39 35
Value 1117 38
200
9
Volu
me 90298 4271 2202.
52 15 14
Value 1991 211
201
0
Volu
me
10986
2 6690 2906.
26 13 11
Value 2558 348
201
1
Volu
me 89985 8590 4539.
76 20 16
Value 3520 1019
201
2
Volu
me 3301 387 492.9
6 20 19
Value 353 140 Source: NCDEX
The total quantity traded on commodity exchanges was 88 times of total quantity of Guar seed
produced in the year 2004-05, 179 times in the year 2005-06, 146 times in the year 2006-07 and 53
times in the year 2007-08.
Table 25. High –Low difference in Guar bean prices in India (INR/tons)
Year High Low Average Difference (H-L)
2004 18817 10028 13999 8789
2005 20404 13583 15671 6821
2006 23364 15606 18242 7758
2007 19637 17441 18486 2196 Source: Agmarknet

The high-low price difference after introduction of commodity futures in Guar seed indicates that the
spot price volatility of Guar seed has decreased (Table-25).
7.4 Price Fluctuations due to Area, Production and Rainfall
The price of Guar depends upon rainfall and area under cultivation of Guar. The rainfall has more
impact on price than production, while with increase in area under cultivation the price decreases to a
little extent.
Fig 16. Movement of price determining factors at Sri Ganganagar market
From the Figure-16, it is clear that the rainfall and area under cultivation is moving in same direction
while with increase in area under cultivation price is decreasing.
Table 26. Impact on spot price of Guar due to variation in factors (in short run)
Between Rainfall Area Production
Price 51 (0.72) 25 (-0.50) 14 (0.37) Source: Author’s Calculation
Here in case of correlation between price and rainfall, result obtained shows a positive relation. Here
for relationship between price and rainfall is 51, which shows linear relationship between rainfall
and price. The relationship between price and area has a negative correlation coefficient and the
value of is 25. The correlation coefficient for relationship between price and production has a
positive but very week association as reflected by a correlation coefficient of 14.
7.5 Trade of Guar
The volume and value of the trade in terms of export of Guar derivatives from India during recent
years is presented in Table-27. The table reveals the processed commodity is exported mainly as

Guar gum treated and pulverized constituting more than 83 percent during 2012-13 followed by Guar
gum refined splits and a very small quantity as Guar meal. The proportion of refined Guar split, an
intermediate product, has dropped to 30 percent of total Guar derivatives export from the country,
but still a sizeable quantity of exports is contributed by this raw material used for processing into
different industry specific Guar gum products. The major share of the Guar processed in India is
exported either in form of semi processed product i.e. refined splits or in form of Guar powder.
Table 27. Export of Guar derivatives from India
Quantity in ‘000’ Tons and value in INR billion
Items with Code IFY 2010-11 IFY 2011-12 IFY 2012-13 Growth
percentage
over an
year
Percentage
share
in 2012-13
HS Code Product Qty Value Qty Value Qty Value
13023230 Guargum
Treated &
Pulverised
317.2 23.7 524.8 144.8 263.2 177.6 23 83
13023220 Guargum
Refined
Split
83.0 5.1 102.4 19.2 70.5 33.9 76 16
13023210 Guar Meal 41.4 0.7 80.2 1.2 74.8 1.4 20 1
Total 441.6 29.4 707.3 165.2 408.6 212.9 119 100
Source: Directorate General of Commercial Intelligence (DGCIS), Ministry of Commerce, GOI.
Note: Indian Financial Year runs from April to March
There has been 76.29 percent growth in the value of Guar refined split traded in IFY 2012-13
compared to IFY 2011-12. India continues to be a major exporter of refined split. The value of
treated Guar gum has also recorded a growth of 22.59 percent. The United States of America has
been a major market for India whose status in Indian guar processing industry has further
consolidated in recent years mainly in value terms with a share of more than 80 percent during 2012-
13. In addition to US, India is also exporting to countries like China, Germany, France, Mexico,
Argentina, Japan, Indonesia, etc.
Guar gum is classified under Mucilages and Thickeners group (HS code 13032) in harmonized
system of classification in international trade. Mucilages and Thickeners include derivatives of
Locust bean, Locust bean seeds and Guar Seeds. India is the largest exporter of Guar gum and
mucilages with 73 percent (Table-28) share of world mucilages and thickeners trade, followed by
USA (5.5 percent), Spain (4.4 percent), Pakistan (4.3 percent), Italy (2.3 percent) and Germany (1
percent). Countries like USA, Spain, Italy, Germany, etc. imports Guar refined split from India and
process it into industry specific Guar gum products and re-export it.

Table 28. Major Exporting countries of Mucilages and Thickeners (in value term for year
2011)
Sr No. Country Share (%)
1 India 73.07
2 USA 5.52
3 Spain 4.50
4 Pakistan 4.38
5 Italy 2.40
6 Germany 1.68
7 France 1.32
8 China 1.14
9 Denmark 1.02
10 Switzerland 0.96
11 Morocco 0.90
12 Netherlands 0.90
13 United Kingdom 0.60
14 Belgium 0.36
15 Turkey 0.30
16 Philippines 0.18
17 Russian Federation 0.12
18 Sweden 0.12
19 Japan 0.12
20 Portugal 0.12
21 Poland 0.06
22 Australia 0.06
23 Austria 0.06
24 United Arab Emirates 0.06
25 Trinidad and Tobago 0.06
Leading importing country of Guar gum or mucilages and thickeners group is USA with about 62
percent of total world mucilages and thickeners import followed by Germany (6 percent), Canada (4
percent), China(2.8 percent), Italy (2.5 percent), etc (Table - 29).
Table 29. Major importing countries of Mucilages and Thickeners (in value term for year
2011)

S. No. Country Share (%)
1 USA 62.88
2 Germany 6.33
3 Canada 4.08
4 China 2.88
5 Italy 2.51
6 Japan 2.45
7 Denmark 1.88
8 France 1.76
9 Russian Federation 1.69
10 United Kingdom 1.38
11 Mexico 1.32
12 Netherlands 1.19
13 Australia 1.13
14 Belgium 1.00
15 Brazil 0.94
16 South Africa 0.88
17 Argentina 0.75
18 Indonesia 0.69
19 Thailand 0.69
20 Spain 0.69
21 Switzerland 0.63
22 Poland 0.63
23 Austria 0.63
24 Rep. of Korea 0.56
25 Malaysia 0.44
7.6 Export of Guar gum to USA
Total quantity of Guar gum exported from India was about 409 thousand metric tons valued at INR
212.9 billion during 2012-13. Export of Guar gum to USA has also increased in both quantity and
value term. The compounded annual growth rate (CAGR) of export of Guar and its derivatives form
India in quantity terms has been recorded at 7 percent for the world during 2002-2013, while the
growth rate for USA during the same period has been recorded at 22 percent. The USA has emerged
as an important player for Guar and Guar processing industry in recent year owing to expanding
shale gas fracking industry (Table-30). The demand for Guar and its various derivatives in USA has
increased at much faster rate than for rest of the world as depicted by Figure-17.
In addition to USA, China is also emerging as an important importer of refined Guar split. These are
the countries acquiring strength in the processing of Guar split to the value added Guar gum and
other industry specific products. China and USA now started exporting value added products to other
countries. During 2006-07, China emerged as largest importer of Guar refined split, according to
trade sources China imposes import duty to the tune of 15 percent on import of Guar gum and import
of Guar refined split is free. Thus, China is encouraging import of intermediate product, process it
into different industry specific Guar gum products and re-export it.
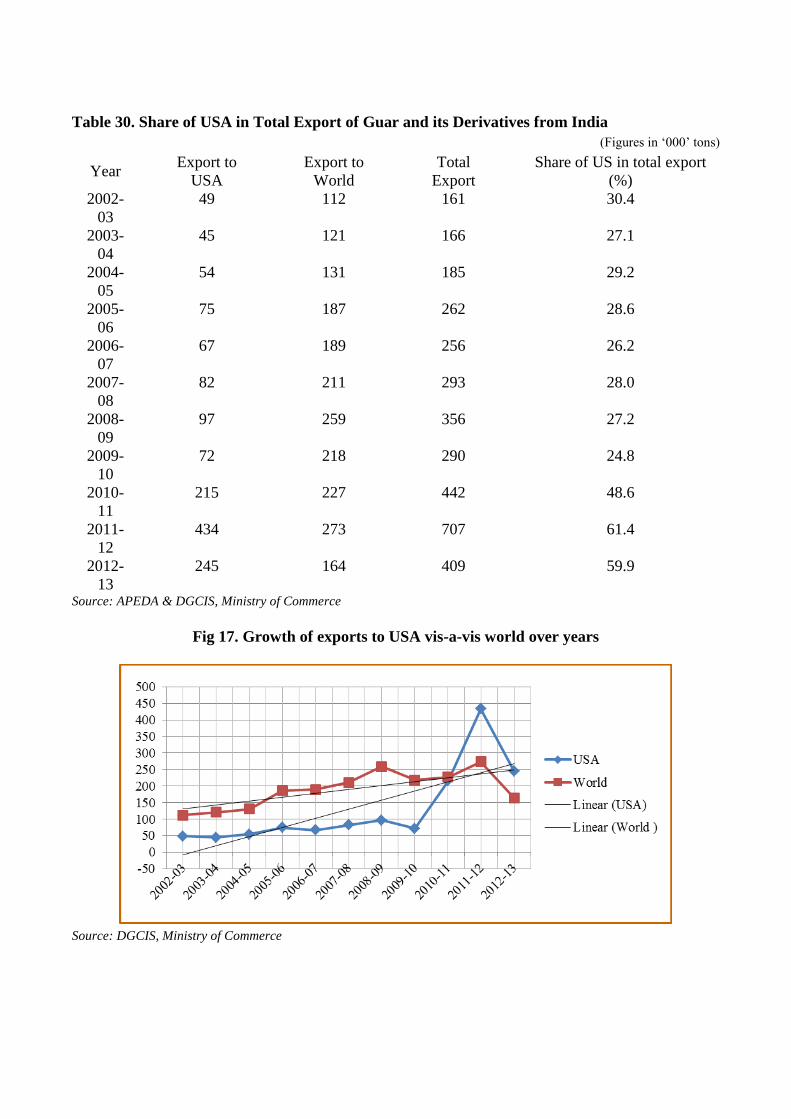
Table 30. Share of USA in Total Export of Guar and its Derivatives from India
(Figures in ‘000’ tons)
Year Export to
USA
Export to
World
Total
Export
Share of US in total export
(%)
2002-
03
49 112 161 30.4
2003-
04
45 121 166 27.1
2004-
05
54 131 185 29.2
2005-
06
75 187 262 28.6
2006-
07
67 189 256 26.2
2007-
08
82 211 293 28.0
2008-
09
97 259 356 27.2
2009-
10
72 218 290 24.8
2010-
11
215 227 442 48.6
2011-
12
434 273 707 61.4
2012-
13
245 164 409 59.9
Source: APEDA & DGCIS, Ministry of Commerce
Fig 17. Growth of exports to USA vis-a-vis world over years
Source: DGCIS, Ministry of Commerce

7.7 Availability of Guar for Processing and Export
Given that the guar beans can be stored for 3-6 years, the stocks maintained at different level in the
supply chain play a vital role in total availably of the crop for processing and export. An attempt has
been made to develop data on carry over stock maintained over year to ensure regular supply of the
crop by compiling information from different sources. The Table-31 reveals that the processing
industry is relying heavily on maintaining stock to safeguard against the high fluctuation of prices
and high year to year variation in production owing to over dependence on monsoon.
Table 31. Carry over stock of Guar bean over years (million tones)
Year Opening
Balance Production
Total
Availability Used
Carryover
Stock
2004-05 0.75 0.50 1.25 0.61 0.64
2005-06 0.64 0.60 1.24 0.79 0.45
2006-07 0.45 0.70 1.15 0.74 0.41
2007-08 0.41 0.80 1.21 0.50 0.71
2008-09 0.71 0.80 1.51 0.85 0.66
2009-10 0.66 0.40 1.06 0.70 0.36
2010-11 0.36 1.33 1.68 1.14 0.55
2011-12 0.55 2.22 2.76 2.02 0.74
2012-13 0.13 2.46 2.59 2.12 0.47
2013-14 * 0.55 2.72 3.27 2.37 0.90
Source: Ministry of Agriculture, Government of India, NCDEX and Author estimates based on Industry information;
Production: Govt. Estimates and information from market and industry sources; Export: Based on Guar Gum exports
and Guar Seed required to produce the same and Local Consumption - Information from industry and market sources

8. ISSUES IN GUAR INDUSTRY
AND TRADE IN INDIA
The various issues related to Guar industry and trade have been summarized as under:
Research and Development: The issues pointed out by the stakeholders related to research and
development on guar production included lack of availability of high-yielding varieties with high
viscosity gum, poor access of farmers to production technology and quality seeds, low seed
replacement ratio, etc. It was suggested that SAUs/ research centres should develop varieties taking
care of the requirements of the industry. The easy availability of production technology and HYV
seeds were the main requirements of farmers.
Marketing of Guar and its Products: The issues observed during discussions with stakeholders
related to marketing of guar seed and products included lack of containers and transportation
facilities for processed products from processing point to the port of export, lack of storage facilities,
poor linkage of buyers to and development of value-added products of gum for use in different
industries. It is suggested that a part of revenue from export taxes need to be diverted to create a
national level research and development institute for the purpose.
Promotion of Guar Industry and Export: The issues identified relating to promotion of guar
industry were lack of certification laboratories in the processing centres, policies promoting export of
intermediate product, competition from countries strong in processing of value-added products of
gum, etc. The requirement of the stakeholders included establishment of certification laboratories at
the processing locations, framing policies discouraging export of intermediate product, and concerted
efforts for developing/importing processing technology for value-added products.

Table 32. Issues and suggestions to strengthen guar industry in India
Source: Purshottam Sharma and K C Gummagolmath (2012)

Guar Industry Value Chain: The concerns on guar value chain indicated that there was a
fragmented supply chain in guar bean and products with lack of skilled manpower and lack of
knowhow on technical & emerging market requirements among the small split manufacturers. The
measures to strengthen the value chain include development of specialized manpower and capacity
building of fragmented industry on the food safety aspects.
Guar Industry Associations/ Representation: Though guar industry associations exist in the
country, there is lack of farmers groups/ associations and lack of coordination among different
associations. Hence, it is suggested that there should be a national level federation of guar industry
and farmers associations with close coordination for a better information flow as a backward linkage
and product flow as forward linkage

101
ANNEXURE Area, Production and Productivity in leading Guar growing states in India
Area in 000 ha
Production in 000 MT
Productivity in kg/ha
Year
Rajasthan Haryana Gujarat India
Area Production Yield Area Production Yield Area Production Yield Area Production Yield
2000-01 3056 481 157 148 102 689 273 61.0 223 3497 659 188
2001-02 2413 763 316 196 127 648 263 112.0 424 2903 1090 375
2002-03 556 28 50 205 91 444 213 65.0 306 975 199 208
2003-04 2278 1163 511 269 117 435 266 204.0 766 2854 1513 530
2004-05 1944 368 189 217 254 1171 214 157.0 733 2867 903 315
2005-06 2445 566 243 270 289 1070 188 108.0 575 2956 1059 358
2006-07 2808 658 234 295 334 1132 205 83.0 404 3344 1169 350
2007-08 2842 1244 269 341 395 1200 196 130.0 662 3472 1789 515
2008-09 3316 1261 380 370 602 1627 150 53.0 350 3863 1936 501
2009-10 2581 201 78 252 329 1305 132.7 44.7 337 2996 595 198
2010-11 3001 1546 515 256 333 1300 124.6 73.0 586 3382 1965 581
2011-12 3000 1847 547 215 290 1350 37 33.0 889 3444 2218 157
Source: 1. Ministry of Agriculture, Government of India 2. Ministry of Agriculture, Government of Rajasthan 3.Ministry of Agriculture, Government of
Gujarat 4. Directorate of Agriculture, Government of Rajasthan

102
District wise Area and Production of Rajasthan (Area in ha and Production in MT)
Region/
District
2000-01 2001-02 2002-03 2003-04 2004-05 2005-06 2006-07 2007-08
Are
a
Pro
du
ctio
n
Are
a
Pro
du
ctio
n
Are
a
Pro
du
ctio
n
Are
a
Pro
du
ctio
n
Are
a
Pro
du
ctio
n
Are
a
Pro
du
ctio
n
Are
a
Pro
du
ctio
n
Are
a
Pro
du
ctio
n
Ajmer 1431
3
687 6156 457
8
703
0
28 2294 2133 5320 358 2099 241 6285 411
9
1381
2
7400
Dausa 2199
4
471
2
1000
8
785
1
298
9
307 1599
0
1368
5
1114
4
789
3
1066
4
8003 9985 805
0
1121
5
1035
6
Jaipur 1039
41
831
4
8500
5
719
98
606
17
130
6
6696
6
5602
7
5500
6
407
62
5542
1
2741
4
5138
9
411
04
5514
3
4306
0
Alwar 4567
2
408
32
4516
1
212
40
156
28
452 2346
3
2295
5
1502
8
513
34
2101
8
1292
5
2790
0
288
42
3466
2
3991
6
Bharatpur 1073
9
974
7
1276
6
118
30
540
0
424 5438 5277 4129 358
5
3141 2864 3591 352
8
6816 5994
Dholpur 4507 367
0
3690 300
4
114
1
201 1597 130 889 124
4
727 945 608 790 937 937
Karauli 6499 246
0
4696 371
0
290
3
371 3286 2903 2739 232
2
1766 1855 1946 216
9
2591 3136
S.Madhopu
r
1586
1
301
6
8353 342
7
719 1 5395 2698 2313 116
5
2235 1125 2058 946 3398 1606
Baran 0 0 0 0 0 0 63 96 24 37 13 9 0 0 0 0
Bundi 1074
1
102
7
2085 139
7
630 122 1352 1351 110 110 180 265 178 153 932 1192
Jhalawar 0 0 0 0 0 307 0 0 0 0 0 0 0 0 0 0
Kota 2623 151
7
528 529 0 0 199 189 0 0 0 0 1 0 0 0
Tonk 3120 105 1505 633 653 0 1212 1213 4255 332 5298 4625 4025 403 6554 6532

103
2 5 3 8 3 7 0 4 7
Barmer 3753
28
476
38
3169
94
224
61
173
98
131 3122
17
1467
77
2959
16
160
18
3526
87
2467
8
4218
17
563
42
3546
64
7340
3
Jodhpur 2367
73
148
47
1664
54
701
89
241
5
118
7
1534
29
8302
9
1536
98
105
79
1605
39
1038
7
1838
10
623
0
1499
75
2159
0
Nagaur 2771
21
455
58
1433
87
380
66
826
94
145
0
1415
38
7066
3
1706
56
315
71
1516
55
6374
7
1558
20
420
26
1290
94
6989
2
Hanumanga
rh
2475
25
881
06
2338
10
824
95
788
45
371
7
2440
03
2782
00
1660
37
243
02
2037
42
1479
27
2873
82
762
56
3196
17
2779
72
SriGangana
gar
1471
81
524
21
1456
94
499
98
379
84
113
28
1595
14
5236
3
6523
4
214
14
5929
4
4060
5
1203
01
969
59
1801
41
1454
25
District wise Area and Production of Rajasthan (Area in ha and Production in MT)
Region/
District
2000-01 2001-02 2002-03 2003-04 2004-05 2005-06 2006-07 2007-08
Are
a
Pro
du
ctio
n
Are
a
Pro
du
ctio
n
Are
a
Pro
du
ctio
n
Are
a
Pro
du
ctio
n
Are
a
Pro
du
ctio
n
Are
a
Pro
du
ctio
n
Are
a
Pro
du
ctio
n
Are
a
Pro
du
ctio
n
Bhilwara
47299 492 11664 1158 5644 44 10985 5988 6956 3225 16312 2030 21379 1280
1
36921 18820
Chittorga
rh
18734 4550 7833 3921
3
4902 696 5858 5756 3306 2158 4315 3601 4227 4195 5009 5009
Rajsama
nd
8068 236 2207 3972 2723 283 3364 2298 2288 936 5833 3407 5482 7171 8498 7309
Banswar
a
2036 350 1888 1015 1718 473 2000 1316 455 84 1164 444 1268 98 779 548
Dungarp
ur
2582 251 2671 0 2392 505 2212 3539 3432 1220 2981 845 1799 45 1875 3000
Udaipur 8358 1612 7100 4692 7816 258
5
9610 5654 10980 7447 13085 8233 14951 4880 13768 15943

104
Jhunjhun
u
74344 6364 64597 6492
2
2397
4
416 53019 53103 54237 3561
6
65427 1823
5
61228 1152
5
68196 15327
Sikar 11353
0
1298
8
92352 4661
9
5627
7
882 71924 36346 85533 2693
5
79999 2489
5
78448 3284
2
79603 41583
Jalore 84102 700 87786 4128
5
1434
4
79 61073 54979 72741 3662 64147 2304
4
50163 3383
7
69506 38186
Pali 52884 119 25251 1953
0
1483
8
20 25746 18819 29212 9012 49129 1635
6
50699 3589
4
67450 45761
Sirohi 18643 876 23508 2350
8
4824 23 5723 2797 12841 643 11927 9708 1630 879 5713 5713
Bikaner 17700
6
1777
0
18828
4
2110
5
7273 316 19427
7
45904 13987
6
3996
1
47838
4
7707
4
51178
9
1076
61
60586
9
25145
7
Churu 57906
7
3420
5
38405
7
6490
2
8173
1
198 32727
4
11299
5
36415
5
1892
3
37373
1
3428
4
38728
0
2051
4
34722
9
66980
Jaisalmer
31759
1
7509
7
31356
0
3231
6
5047 0 35641
1
63070 20583
8
2511 24773
5
2345
2
34047
4
1453
2
32975
2
19686
Total
30562
64
4812
17
24125
98
7633
48
5564
29
278
52
22783
47
11631
70
19443
48
3683
51
24446
48
5658
09
28079
13
6584
25
28422
69
12437
33
Source: Directorate of Agriculture, Government of Rajasthan

105 | P a g e
105
AGMARK Grade Standards
Grade designations and definitions of quality of Dehusked split (Refined) Guar Gum
Definition of quality (Special characteristics)
Grade
Designation
Moisture %
by weight
(Max.)
Ash % by
weight
(Max.)
Protein % by
weight (on
dry basis)
Residue
insoluble in
acid (Max.)
Gum % by
weight
(Min.)
Black
splits %
(Max.)
General Characteristics
Standard 10.0 1.0 Not more
than 9%
5.0 80.0 1.0 The dehusked split Guar gum shall :
General 11.0 2.0 Not more
than 9%
7.0 75.0 2.0 (a) be obtained by milling Guar seeds
after removal of husk from Guar pods
of the plant botanically known as
Cyamopsis
tetragonoloba family Leguminosae.
(b) be free from dirt, dust added
colouring matter visible mould
growth insect infestation and ob-
noxious smell.
(c) have characteristics shape, size
and colour
* Includes organic extraneous matter such as stems, straw, chaff.
Grade designations and definitions of quality of Guar Gum (Pulverised)
Definition of quality (Special characteristics)
Grade
Designation
Moisture %
by weight
(Max.)
Ash % by
weight
(Max.)
Protein %
by weight
(on dry
basis)
Residue
insoluble in
acid (Max.)
Gum %
by weight
(Min.)
Viscosity at
250C in
centipoises
(Min.)
pH Arsenic
As2O3
ppm
(max)
Lead
ppm
(Max.)
Grade-I 11.0 0.5 <= 9% 3.0 80.0 3000 5.5-
7.5
1.0 5
Grade-II 12.0 1.0 <= 9% 5.0 70.0 2000 6.0-
8.0
1.0 5
Grade-III 13.0 1.5 <= 9% 7.0 55.0 1000 6.0- 1.0 5

106
8.0
* Includes organic extraneous matter such as stems, straw, chaff.
Details of stakeholders procured for interaction on sample basis Sr.
No
.
Name of the
Firm
Name of the Person Mobile
Number/Telephone
Number
Telephon
e
Number/
Mobile
Number
Address
Line 1
Pin
Code
City State Email ID Category
(Miller/ Trader/
Producer/Expor
ter)
1 Adarsh Guar
Gum Udyog Mukesh Jain 9928083353
Opp. Krishi
Upaj mandi
34400
1 Barmer Rajasthan [email protected] MILLER
2 Altrafine
Gums Ajit Patel 9825714702
079-
25890401
88/2, GIDC
Estate, Phase I,
38244
5
Ahmedaba
d Gujarat [email protected] MILLER
3 Anil Trading
Co. Rakesh Ji 0291-2570753
98290237
53
N-11,
Mandor Mandi
34200
5 Jodhpur Rajasthan
TRADER
4 Arihant
Industries Mevaram Ji
94141074
50
Anaj Mandi,
Barmer
34400
1 Barmer Rajasthan
TRADER
5 Arvind Goyal
Trading
Company
Mr.Arvind Goyal 9416924667
Shop No. 40,Mandi,
Siwani
12704
6 Siwani Haryana
Trader
6 Asharam Mahendra
Kumar
Girdhar 0291-2722199 5107199 B18 Basni Krisi Upaj
Mandi
34200
5 Jodhpur Rajasthan
TRADER
7 Ashok Broker Akash Deep Gupta 0291-2721432 94141267
77
A-4, Basni
Krisi Upaj Mandi
34200
5 Jodhpur Rajasthan [email protected] BROKER
8 Ashok
Industries Ashok 9314709015
94141003
29
F44Medium
Ind.Area;Phase I
34200
5 Jodhpur Rajasthan
MILLER
9 Balaji Trading
co Sanjay Agarwal 0151-2250139
94141383
47
236, New
Grain Mandi
33400
1 Bikaner Rajasthan
TRADER
10 Balaji Trading
Company Manohar lal Mohan
kumar 0151-2250242
9414138347
176, Krishi upaj mandi
334001
Bikaner Rajasthan
TRADER
11
Balchand
Mukesh
Kumar
Mr Mukesh Kumar 9416811104
Anaj Mandi,
Admapur,His
sar
125052
Adampur Haryana
BROKER
12 Banwari lal Beli Ram
Mr Vivek Rao 9467050866
Anaj Mandi,
Admapur,His
sar
125052
Adampur Haryana [email protected] BROKER
13 Bhaktawar
Mal Govind
Ram
Mohan Lal Mundhra 0291-2721926 93143219
26
C4, Basni Krishi Upaj
Mandi
34200
5 Jodhpur Rajasthan
TRADER

107
Sr.
No
.
Name of the
Firm
Name of the Person Mobile
Number/Telephone
Number
Telephon
e
Number/
Mobile
Number
Address
Line 1
Pin
Code
City State Email ID Category
(Miller/ Trader/
Producer/Expor
ter)
14 Bhansali
Gums Ghewar Singh Ji 9829022904
E
375Medium Ind.Area;
34200
5 Jodhpur Rajasthan
MILLER
15 Bhawani Trading
Mahesh Ojha 0291-5107173 98290271
73
E3, Basni
Krishi Upaj
Mandi
342005
Jodhpur Rajasthan
TRADER
16 Bhawarlalji Bhawarlalji 9829021663
Basni Krishi
Upaj Mandi
34200
5 Jodhpur Rajasthan
TRADER
17 Bhimsen Ved
Prakash Mr.Mukesh Goyal 9610284342
Anaj Mandi,
Raisinghnagar
33505
1
Raisinghna
gar Rajasthan
Trader
18 Bihari Lal
Chabil das Mr. Sunil Kumar Jain 9416042145
Anaj Mandi,
Admapur,Hissar
12505
2 Adampur Haryana [email protected] BROKER
19 Buccha
Trading co Jethram Buccha 0151-2250414
94142634
54
85, Krishi
upaj mandi
33400
1 Bikaner Rajasthan
TRADER
20 Budh Ram
Bris Lal Mr.Mukesh 9672990934
Anaj Mandi, Raisinghnaga
r
33505
7
Raisinghna
gar Rajasthan
Trader
21 Chandra
Prakash Sanjay Jain 9314709018
Basni Krishi
Upaj Mandi
34200
5 Jodhpur Rajasthan
BROKER
22 Chhagan lal
Harishkumar Harish Agarwal 9414506347
94141373
12
44, New
Grain Mandi
33400
1 Bikaner Rajasthan
TRADER
23 Chiranjiv Lal
Company Mr.Chiranjiv Lal 9414091591
Anaj Mandi, Raisinghnaga
r
33505
3
Raisinghna
gar Rajasthan
Trader
24 Chopra Gwar
Gum Ind Prakash Chopra 9314709071
E 20 Medium
Ind.Area
34200
5 Jodhpur Rajasthan
MILLER
25 Dabri Food
Products Ramesh Jindal 9215144034
Anaj Mandi,
Admapur,His
sar
125052
Adampur Haryana [email protected] MILLER
26 Damodar Sarswat
Manoj/ Damodar Sarswat
0151-2250577/2250387
9829025536
R-4, Krishi upaj mandi
334001
Bikaner Rajasthan
TRADER
27 Dargar
Trading co Arun Dargar 0151-2250911
94141390
39
39, New
Grain Mandi
33400
1 Bikaner Rajasthan [email protected] TRADER
28 Deepak Guar
Mill Anjani Goyal/Krishna 9416049803
Anaj Mandi, Admapur,His
sar
12505
2 Adampur Haryana
MILLER
29 Deepak
Trading Vagaram 0291-5107139
98290256
96
E111-13 Basni Krishi
Upaj Mandi
34200
5 Jodhpur Rajasthan [email protected] BROKER
30 Delu Trading
Company Mr Bhim Singh 9416593804
Anaj Mandi,
Admapur,Hissar
12505
2 Adampur Haryana
BROKER

108
Sr.
No
.
Name of the
Firm
Name of the Person Mobile
Number/Telephone
Number
Telephon
e
Number/
Mobile
Number
Address
Line 1
Pin
Code
City State Email ID Category
(Miller/ Trader/
Producer/Expor
ter)
31 Dev Raj Mr Dev Raj 9416024115
Anaj Mandi,
Admapur,Hissar
12505
2 Adampur Haryana
BROKER
32 Dhajaram
Jaidev Jaidev Gupta 9414088183
0154-
2472875
131 New
Mandi Yard
33500
1
Srigangana
gar Rajasthan
TRADER
33 Dinesh Chand
9414671795
Basani Krishi
Upaj Mandi
34200
5 Jodhpur Rajasthan
TRADER
34 DS Mittal &
co DS Mittal 0151-2250872
94141379
10
9, New Grain
Mandi
33400
1 Bikaner Rajasthan [email protected] TRADER
35 Dugar and Company
Shikhar Chand Dugar 9414142666
Basni Krishi Upaj Mandi
342005
Jodhpur Rajasthan
TRADER
36
Gandhi Guar
Gum
Industries
Gandhi Ji 0291-2740308 2740408 E92 M I A ;IInd Phase
342005
Jodhpur Rajasthan
MILLER
37
Ganeshilal
Cotton
Industries
Sandeep Mittal 9215729574
Anaj Mandi,
Admapur,His
sar
125052
Adampur Haryana [email protected] MILLER
38 Ganga ram
Satpal Satpal Agarwal 0151-2251984
9414211568
70, New Grain Mandi
334001
Bikaner Rajasthan
TRADER
39
Gangaram /
Balbeer Kumar
Mr.Surender/Mr
Balbeer Mittal 9254242086
Anaj Mandi,
Admapur,Hissar
12505
2 Adampur Haryana
BROKER
40 Ganpati Guar
Gum Ayush Goyal 9215242305
Anaj Mandi,
Admapur,Hissar
12505
2 Adampur Haryana [email protected] MILLER
41 Ganpati
Trading & Co Rajender Agarwal 9982307761
Basni Krishi
Upaj Mandi
34200
5 Jodhpur Rajasthan [email protected] TRADER
42 Ghadsana Trading co
Mangeram Goyal
9414139703
167, New Grain Mandi
334001
Bikaner Rajasthan
TRADER
43
Ghanshyam
Das Rajesh
Kumar
Mr Ghanshyam Das 9466239877
Anaj Mandi,
Admapur,His
sar
125052
Adampur Haryana
BROKER
44 Goyal
Brothers Mr Rajkumar goyal 9416042355
Anaj Mandi,
Admapur,His
sar
125052
Adampur Haryana [email protected] BROKER
45 Goyal Trading
Company Mr.Rajesh Goyal 9255181327
Anaj Mandi, Admapur,His
sar
12505
2 Adampur Haryana [email protected] BROKER
46 Hanuman Traders
Indra Kr. 0151-2250408 94141396
17 201, Krishi upaj mandi
334001
Bikaner Rajasthan
TRADER
47 Hanuman
Trading co Bhimraj Bajaj
94141373
22
237, New
Grain Mandi
33400
1 Bikaner Rajasthan
TRADER
48 Hanuwantrajji Hanwantraj 0291-5107184 98290259
30 B3 Basani Krisi Upaj
342005
Jodhpur Rajasthan
BROKER

109
Sr.
No
.
Name of the
Firm
Name of the Person Mobile
Number/Telephone
Number
Telephon
e
Number/
Mobile
Number
Address
Line 1
Pin
Code
City State Email ID Category
(Miller/ Trader/
Producer/Expor
ter)
Mandi
49
Hari Kishan
Ramesh Kumar
Mr. Shiv Kumar 9255544751
Anaj Mandi,
Admapur,Hissar
12505
2 Adampur Haryana
BROKER
50 Harlal Ram
Kumar Mr Shubhash Kumar 9813444270
Anaj Mandi,
Admapur,His
sar
12505
2 Adampur Haryana
BROKER
51 Haryana Guar
Gum Kailash/Surendra
Singhal 9315432455
Anaj Mandi,
Admapur,His
sar
125052
Adampur Haryana [email protected] MILLER
52 Hindustan
Gum Mr. Vinod Acharya 0291-2740309
98290230
87 E 282 M I A
34200
5 Jodhpur Rajasthan [email protected] MILLER
53 HP Guar Gum Kartik Goyal 9215400009
Anaj Mandi,
Admapur,Hissar
12505
2 Adampur Haryana [email protected] MILLER
54 Inderchand
Raj Kumar Mr Inder Chand 9416080308
Anaj Mandi,
Admapur,Hissar
12505
2 Adampur Haryana
BROKER
55
Jai Bharat
Gum and
Chemicals
Mr.Ravindra Kedia 9813517653
Siwani
Mandi
,Bhiwani
127046
Siwani Haryana [email protected] Miller
56 Jainsons
Industries Prashant Bohra
98281303
72
F-547, MIA,
II phase
34200
5 Jodhpur Rajasthan
MILLER
57 Jairam Das
Punnet Kumar Mr.Puneet Garg 7568824151
Anaj Mandi, Raisinghnaga
r
33506
1
Raisinghna
gar Rajasthan
Trader
58 Jayamal Ram
Ramswaroop Mr Purushottam Rana 9416076301
Anaj Mandi,
Admapur,Hissar
12505
2 Adampur Haryana
BROKER
59 Jhamboo
Kharwa 0291-3105613
Basni Krishi
Upaj Mandi
34200
5 Jodhpur Rajasthan
BROKER
60 Jineshwar Kr.
Amratlal Hastimal 0291-2721731
98290267
31
C5, Basni
Krishi Upaj Mandi
34200
5 Jodhpur Rajasthan
TRADER
61 Kailashchand
Manojkumar Kailash Mittal 9414090347
0154-
2485947
85, New
Mandi Yard
33500
1
Srigangana
gar Rajasthan [email protected] TRADER
62
Kakkad
Trading
Company
Mr.Atam Prakash 9888330737
Shop No.31-
A,Grain Market,
Rajpura
140401
Rajpura Punjab
Trader
63 Kalyan
Commodities Mr.Shyam Kalyani 9414091563
Anaj Mandi,
Raisinghnagar
33505
2
Raisinghna
gar Rajasthan
Trader
64 Kamal Agro Rambilas 9316196595
Anaj Mandi, 12505 Adampur Haryana [email protected] MILLER

110
Sr.
No
.
Name of the
Firm
Name of the Person Mobile
Number/Telephone
Number
Telephon
e
Number/
Mobile
Number
Address
Line 1
Pin
Code
City State Email ID Category
(Miller/ Trader/
Producer/Expor
ter)
Admapur,His
sar
2
65 Kanaram and
Company Mr Jagdish Delu 9416173223
Anaj Mandi,
Admapur,Hissar
12505
2 Adampur Haryana [email protected] BROKER
66 Kanhaiyalal
Rajkumar Indrakumar Khatri 0151-250408
94141396
17
189, New
grain mandi
33400
1 Bikaner Rajasthan
TRADER
67 Kasaniya Trading
Company
Mr Kapil Moneywal/
Bhakti singh 9466404761
Anaj Mandi, Admapur,His
sar
12505
2 Adampur Haryana [email protected] BROKER
68 Kewal chand
Kanwarlal Raja Babu
0151-
2250834
40, New
Grain Mandi
33400
1 Bikaner Rajasthan
TRADER
69 Kheram Pur
Brothers Mr Ashish Goyal 9802720021
Anaj Mandi, Admapur,His
sar
12505
2 Adampur Haryana
BROKER
70 Kisan Agro Pawan Goyal 9316042577
Anaj Mandi,
Admapur,Hissar
12505
2 Adampur Haryana [email protected] MILLER
71 Kothari
brothers Pramod Khotari 9414140502
0151-
2251210
228, New
Grain Mandi
33400
1 Bikaner Rajasthan
TRADER
72 Krishna
Industries Ratan Kumar Mittal 9255596769
Anaj Mandi, Admapur,His
sar
12505
2 Adampur Haryana [email protected] MILLER
73 Kundanamal
Mohanlal Shivratan Modi
94141374
45
55, New
Grain Mandi
33400
1 Bikaner Rajasthan
TRADER
74 Ladhuram
Hastimal Pawan Ji
94141064
32
Anaj Mandi,
Barmer
34400
1 Barmer Rajasthan
TRADER
75 Lahia
Abhishek Abhishek 9314422155
Basni Krishi
Upaj Mandi
34200
5 Jodhpur Rajasthan
TRADER
76 Lalit Kumar Chandak &
Co.
Raju Sa 0291-2570066 2570841 C-6 Mandor
Mandi
34200
5 Jodhpur Rajasthan
TRADER
77
Lamberti
Hydrocolloids Pv lt
Mahendra Tripathi 9099611911 02827-254254
Plot No.
1&2, SIDC Road,
Veraval
360024
Rajkot Gujarat [email protected]
m
MILLER
78 Laxmi Guar
Gum Vishwanath 9896123464
Anaj Mandi, Admapur,His
sar
12505
2 Adampur Haryana [email protected] MILLER
79 Liladhar
Anandkishore Sri Gopal Agarwal
94145148
45
36, New
Grain Mandi
33400
1 Bikaner Rajasthan
TRADER
80 Liyaqatali Hyder Ali
Md.Rafyq(guddu)\HyderAli
0151-2251409 99826831
31 Opposite lalgarh
334001
Bikaner Rajasthan
TRADER

111
Sr.
No
.
Name of the
Firm
Name of the Person Mobile
Number/Telephone
Number
Telephon
e
Number/
Mobile
Number
Address
Line 1
Pin
Code
City State Email ID Category
(Miller/ Trader/
Producer/Expor
ter)
railway
station
81 Lotus Gums Shayam Kamal
Sharma 9829027259
0291-
2513259
G-657, MIA, 2nd Phase,
Basni
34200
5 Jodhpur Rajasthan [email protected] MILLER
82 LR Gum and
Chemicals Mr Ashok Goyal 9416383393
Shop No.
67,Mandi, Siwani
12704
6 Siwani Haryana
m
Miller
83 Lucid
Hydrocolloids Uday Merchant 022-24158059
9324150001
401 A,
Navbharat Estates,
Zakaria
Bunder Road, Sewri
(W)
400015
Mumbai Maharash
tra [email protected] Miller
84 Lunawat Dal
Mill Vedprakash 0291-2740019
94141007
65
E 102
Medium Ind.Area;
34200
5 Jodhpur Rajasthan
MILLER
85 Maa Vankal
Group Rakesh Dhariwal 9829028082
196, SS
Market Yard
38553
5 Deesa Gujarat [email protected] MILLER
86 MadanLal
Jagdish Chand Mr Sudhir Asija 9729290007
Anaj Mandi, Admapur,His
sar
12505
2 Adampur Haryana [email protected] BROKER
87 Madanlal
Sarswat Madanlal Sarswat 0151-2250351
94141383
51
126, Krishi
upaj mandi
33400
1 Bikaner Rajasthan
TRADER
88 Mahalaxmi
store Satyanarayan Saraswat 0151-2251240
9414142356
88, New Grain Mandi
334001
Bikaner Rajasthan
TRADER
89 Mahaveer
Corp. Dinesh Jain 0151-2251976
94141389
76
90, Krishi
upaj mandi
33400
1 Bikaner Rajasthan
TRADER
90 Mahender
Kumar Rakesh
Kumar
Mr.Udhister Agarwal 9416042375
Anaj Mandi, Admapur,His
sar
12505
2 Adampur Haryana [email protected] BROKER
91 Mahendra Kr.
Manish Kr. Jatan Chajjer 0151-2250639
9829217639
185, Krishi upaj mandi
334001
Bikaner Rajasthan
TRADER
92 Mahesh & Co. Mahesh Phophalia 0291-2721172 98290217
87
C6, Basni
Krishi Upaj Mandi
34200
5 Jodhpur Rajasthan [email protected] TRADER
93 Maheshwari
Trading Jugal Kishore 9829154161
Basni Krishi
Upaj Mandi
34200
5 Jodhpur Rajasthan
TRADER
94 Mahinder Trading
Company
Mr Mangal Sen 9992623146 /
9416263171
Anaj Mandi, Admapur,His
sar
12505
2 Adampur Haryana
BROKER
95 Malani Bros. Pankaj Malani 0291-2725647 94141328
41 E/11-9,Basni
Krishi Upaj
34200
5 Jodhpur Rajasthan
TRADER

112
Sr.
No
.
Name of the
Firm
Name of the Person Mobile
Number/Telephone
Number
Telephon
e
Number/
Mobile
Number
Address
Line 1
Pin
Code
City State Email ID Category
(Miller/ Trader/
Producer/Expor
ter)
Mandi
96 Maloo Agency Mukesh Maloo 0291-5106628 94141323
69
C1 Basni
Krishi Upaj Mandi
34200
5 Jodhpur Rajasthan
BROKER
97 Manoj kumar Pankaj Kumar
Manoj Goyal 9414093379
Anaj Mandi,
Sriganganaga
r
335001
Sriganganagar
Rajasthan [email protected] TRADER
98 Manoj
Mediator Manoj Saraswat 0151-2250370
9414143529
R-4, New Grain Mandi
334001
Bikaner Rajasthan [email protected] TRADER
99
Manoj
Trading Company
Mr.Piyush Singh 9828437765
Anaj Mandi,
Raisinghnagar
33506
2
Raisinghna
gar Rajasthan
Trader
100
Maxam India Pvt. Ltd.
Dr. Rajendra Kumar Verma
9910330166 011-
22444846
209, Ansal's
Vikas Deep,
Laxmi Nagar
110092
Delhi Delhi [email protected] User
10
1
Megha Guar
Gum Rajinder Goyal 9215142401
Anaj Mandi, Admapur,His
sar
12505
2 Adampur Haryana [email protected] MILLER
10
2
Meghraj
Ganeshlal Harish Agarwal 0151-2251240
94141412
40
94, Krishi
upaj mandi
33400
1 Bikaner Rajasthan [email protected] TRADER
103
Mehta Traders Mr Madan Lal Mehta 9896954907
Anaj Mandi,
Admapur,His
sar
125052
Adampur Haryana
BROKER
104
Mohan Ajencies
Mohan Surana
9414139111
87, New Grain Mandi
334001
Bikaner Rajasthan
TRADER
10
5
Mohan Lal
Satya Narayan
Mr Mahesh Kumar
Goyal 9812342054
Anaj Mandi,
Admapur,Hissar
12505
2 Adampur Haryana
BROKER
10
6
Mohinder Trading
Company
Mr. Mohinder Kumar 9417040882
Shop
No.208,Grain
Market,
Rajpura
14040
1 Rajpura Punjab
Trader
107
Mohta
Trading
Company
Mr.Manish Goyal 9509040957
Anaj Mandi,
Raisinghnaga
r
335058
Raisinghnagar
Rajasthan
Trader
108
Munna lal
Trading
Company
Mr.Tejram Thekedar 9461258448
Anaj Mandi,
Raisinghnaga
r
335056
Raisinghnagar
Rajasthan
Trader
109
N M Foods Pvt. Ltd.
Manoj Gupta 9414089375
New Mandi Yard
335001
Sriganganagar
Rajasthan
TRADER
11
0
Nahata
Trading Co. Ghewar G 0291-2570820
98290268
20
I/I-8, Basni
Krishi Upaj Mandi
34200
5 Jodhpur Rajasthan
TRADER
11 Nanuram Mr.Ashish Jindal 9416056248
Shop No. 12704 Siwani Haryana [email protected] Miller

113
Sr.
No
.
Name of the
Firm
Name of the Person Mobile
Number/Telephone
Number
Telephon
e
Number/
Mobile
Number
Address
Line 1
Pin
Code
City State Email ID Category
(Miller/ Trader/
Producer/Expor
ter)
1 Jindal Gum
and Chemicals
12,Mandi,
Siwani
6
112
Navkar Broker Rinku Guleria 0291-3112107 93147121
07 Basni Krishi Upaj Mandi
342005
Jodhpur Rajasthan
BROKER
11
3
Navratan daga
& co Navratan Daga
94141427
64
B-61, New
Grain Mandi
33400
1 Bikaner Rajasthan
TRADER
11
4 Nikhil Brokers Somparikh 9829290523
Basni Krishi
Upaj Mandi
34200
5 Jodhpur Rajasthan
BROKER
115
Nirmal Kumar Mundhir
Mr.Narender 9928049670
Anaj Mandi,
Raisinghnaga
r
335054
Raisinghnagar
Rajasthan
Trader
116
Om Agro Industries
Suresh Thakkar
9824087483
Anaj Mandi, Deesa
385535
Deesa Gujarat [email protected];
Trader
117
Paliran Tejimal
Mr Neeraj Bansal 9416080051
Anaj Mandi,
Admapur,His
sar
125052
Adampur Haryana
BROKER
11
8 Pankaj Gums Paras Setia
93147142
64
F-146-B, II
phase MIA
34200
5 Jodhpur Rajasthan
MILLER
11
9
Pawan kumar
Vipin kumar Pawan Agarwal
94141386
04
123, New
Grain Mandi
33400
1 Bikaner Rajasthan
TRADER
12
0
Phulchand
Indrersen Mr Vikas 9254142117
Anaj Mandi, Admapur,His
sar
12505
2 Adampur Haryana [email protected] TRADER
12
1
Phursani Trading
Company
Mr. Rajender Vishnoi 9215145529/429/329
Anaj Mandi, Admapur,His
sar
12505
2 Adampur Haryana
BROKER
12
2
Pokar Chand
Manak Chand Devilal Rathi 0291-5107143
98290231
27
A22, Basni
Krishi Upaj Mandi
34200
5 Jodhpur Rajasthan
TRADER
12
3
Pokermal
Pradeep
Kumar
Mr Prdeep Benival 9416042101
Anaj Mandi,
Admapur,His
sar
12505
2 Adampur Haryana [email protected] BROKER
124
Poonam Chand Lalit
Kumar
Mr Lalit Kumar 9416390954
Anaj Mandi, Admapur,His
sar
125052
Adampur Haryana
BROKER
12
5
Poonam Chand
Praveen
Kumar
Mr Harish chandar 9416042298
Anaj Mandi,
Admapur,Hissar
12505
2 Adampur Haryana
BROKER
12
6
Pradeep Trading
company
Mr. Shyam/Sushil 9416080184/946620
6400
Anaj Mandi, Admapur,His
sar
12505
2 Adampur Haryana
BROKER
12
7
Praveen
Trading Mr Surjeet Singh 9466249367
Anaj Mandi,
Admapur,His
12505
2 Adampur Haryana
BROKER

114
Sr.
No
.
Name of the
Firm
Name of the Person Mobile
Number/Telephone
Number
Telephon
e
Number/
Mobile
Number
Address
Line 1
Pin
Code
City State Email ID Category
(Miller/ Trader/
Producer/Expor
ter)
Company sar
12
8
Prayag Chand
Shubh Karam Das
Mr. Hanuman das 9416042187
Anaj Mandi,
Admapur,Hissar
12505
2 Adampur Haryana
BROKER
129
Prem kumar
Pradeep
kumar
Pradeep Agrawal 9414093938
New Mandi Yard
335001
Sriganganagar
Rajasthan
TRADER
13
0
Premcem
Gums Premal Joysher 022-21026196
98201029
77
401,
Udaybhanu
Apartments, M.G Road,
Rajawadi
Ghatkopar East
40007
7 Mumbai
Maharash
tra [email protected] Miller
13
1
Premnath
Shivpaul Shivpal Khatri 0151-2252255
94141383
55
114, New
Grain Mandi
33400
1 Bikaner Rajasthan
TRADER
13
2
Pursuram
Chajuram
Mr Ramswaroop
singhal 9416132623
Anaj Mandi, Admapur,His
sar
12505
2 Adampur Haryana
BROKER
13
3 Raghavji Shravanji 9314715849
Basni Krishi
Upaj Mandi
34200
5 Jodhpur Rajasthan
BROKER
13
4
Raichand
Amit Kumar Mahendra 9314709017
Basni Krishi
Upaj Mandi
34200
5 Jodhpur Rajasthan
BROKER
13
5
Rajasthan Guar Gum
Industries
Bheeru Jain 9829225829
F 115Medium
Ind.Area;
34200
5 Jodhpur Rajasthan [email protected] MILLER
13
6
Rajesh
Trading Company
Mr. Rajesh Kumar 7597828105
Anaj Mandi,
Raisinghnagar
33505
5
Raisinghna
gar Rajasthan
Trader
13
7
Ram Chand
Madan Lal Mr Chunnilal Goyal 9466576065
Anaj Mandi,
Admapur,His
sar
12505
2 Adampur Haryana
BROKER
138
Ram Chandra Rajesh Kumar
Meethu Sa 5107205
B-15,Basni
Krishi Upaj
Mandi
342005
Jodhpur Rajasthan
TRADER
13
9
Ram Niwas
Dhoot Ram Niwas 3109066
93147090
66
C-2, 1st
Floor
34200
5 Jodhpur Rajasthan
BROKER
14
0
Ram Pratap
Ram Gopal Mr Pawan Kumar 9812922229
Anaj Mandi,
Admapur,Hissar
12505
2 Adampur Haryana
BROKER
141
Rama Industries
Mitul Shah
9825047093
Patan
highway road, Near
G.I.D.C
385535
Deesa Gujarat [email protected] MILLER

115
Sr.
No
.
Name of the
Firm
Name of the Person Mobile
Number/Telephone
Number
Telephon
e
Number/
Mobile
Number
Address
Line 1
Pin
Code
City State Email ID Category
(Miller/ Trader/
Producer/Expor
ter)
14
2
Rambilas/muk
esh Kumar Mr. Suresh Kumar 9215831044
Anaj Mandi,
Admapur,Hissar
12505
2 Adampur Haryana
BROKER
14
3
Ramdev
Trading Co. Satya narayan 9461240013
Basni Krishi
Upaj Mandi
34200
5 Jodhpur Rajasthan No email ID TRADER
14
4
Rameshwar
Das
Ghanshyam
Das
Mr Bhimrat Bansal 9812158230
Anaj Mandi,
Admapur,Hissar
12505
2 Adampur Haryana
BROKER
145
Ramnarayan Biyani
Ramnarayan Biyani 0151-2250609
176, Krishi upaj mandi
334001
Bikaner Rajasthan
TRADER
14
6
Rohit Trading
Co Mahaveer Singh 9001790036
Basni Krishi
Upaj Mandi
34200
5 Jodhpur Rajasthan [email protected] TRADER
14
7
Rohtas
Brothers Mr Pankaj Singhal 9215540735
Anaj Mandi, Admapur,His
sar
12505
2 Adampur Haryana [email protected] BROKER
14
8
Ruchi Soya
Industries Pvt.
Ltd
A P Dadoo 9810183855 0124-
4613300
3rd Floor Universal
Trade Tower,
Sector 49
12200
1 Gurgaon Haryana [email protected] MILLER
149
Sajal Kumar Pawan Kumar
Mr Sajal Kumar 9466003324
Anaj Mandi, Admapur,His
sar
125052
Adampur Haryana
BROKER
150
Sambhu Trading Co.
Basant Bhai/Babulal 0151-2250399 94141393
99 164, Krishi upaj mandi
334001
Bikaner Rajasthan [email protected] TRADER
15
1
Sanjay Gupta
Sole Prop Sanjay Gupta 9414089864
129, New
Dhaan Mandi
33500
1
Srigangana
gar Rajasthan
sanjay_kumar_garg2007@yah
oo.com
TRADER
152
Sanjay Trading co
Sanjay Bansal 0151-3290336 94141382
70 105, New
Grain Mandi 33400
1 Bikaner Rajasthan
TRADER
15
3
Sanjharam
Radheshyam
Mr Radheshyam
Gharwal 9416544735
Anaj Mandi,
Admapur,His
sar
12505
2 Adampur Haryana
BROKER
154
Saraswati
Gum and
Chemicals
Mr.Dipin/Mr Govindram
9729085177
Shop No.
26,Mandi,
Siwani
127046
Siwani Haryana [email protected] Miller
155
Sathi Trading Company
Mr. Bagrawat Singh 9416990650
Anaj Mandi,
Admapur,His
sar
125052
Adampur Haryana
BROKER
156
Satish Kr.Manoj Kr.
Satish\ Shekhar 0151-2250486 94141370
43 65, Krishi upaj mandi
334001
Bikaner Rajasthan
TRADER
15
7
Shakti Trading
Co. Jaiprakash Saraswat 0291-2721309
98290265
36
B Basni
Krishi Upaj Mandi
34200
5 Jodhpur Rajasthan [email protected] BROKER
15 Shiv Chandra Devilal Arora 9992000751
Anaj Mandi, 12505 Adampur Haryana
BROKER

116
Sr.
No
.
Name of the
Firm
Name of the Person Mobile
Number/Telephone
Number
Telephon
e
Number/
Mobile
Number
Address
Line 1
Pin
Code
City State Email ID Category
(Miller/ Trader/
Producer/Expor
ter)
8 Chabil Das Admapur,His
sar
2
159
Shiva Traders Jagdish Pediwal 9351206171
98, Krishi upaj mandi
334001
Bikaner Rajasthan
TRADER
16
0
Shivgopal
Gopikishan Amit Goyal
98291469
68
21, New
Grain Mandi
33400
1 Bikaner Rajasthan [email protected] TRADER
16
1
Shobhachand
Sanjaykumar Sanjay Mahipal 9414089553
20 New
Dhan Mandi
33500
1
Srigangana
gar Rajasthan [email protected] TRADER
162
Shree Raghav Broker.
Hanumanji Sarswat 0291-2720049 5107123
C9Basni
Krishi Upaj
Mandi
342005
Jodhpur Rajasthan
BROKER
163
Shree Trading co
Radhakishan Chandak 0151-2250314 94141422
54 132, New
Grain Mandi 33400
1 Bikaner Rajasthan
TRADER
164
Shri Balaji Sonu Bansal 9729023731
Near Anaj
Mandi,admp
ur Hissar
125052
Adampur Haryana [email protected] MILLER
16
5
Shriram
Industries O P Soni
98290270
76
C-80, II
phase
34200
5 Jodhpur Rajasthan
MILLER
16
6
Shubhash
Chand Ajay Kumar
Mr Shubhash Chand 9416043511
Anaj Mandi,
Admapur,Hissar
12505
2 Adampur Haryana
BROKER
167
Shuchand
Kasur and
Sons
Mr Rajesh Kumar 9416216403
Anaj Mandi,
Admapur,His
sar
125052
Adampur Haryana
BROKER
168
Siddarth Broker
Rajesh Lunawat 0291-5106798 93144381
49
A-24, Basni
Krishi Upaj
Mandi
342005
Jodhpur Rajasthan
BROKER
16
9
Singhal Trading
Company
Mr Rajender Prasad 9255487531
Anaj Mandi, Admapur,His
sar
12505
2 Adampur Haryana
BROKER
17
0
Singla
Commodities Mr. Rajesh Jindal 9414380986
Anaj Mandi,
Raisinghnagar
33506
0
Raisinghna
gar Rajasthan
Trader
17
1
Sohan Lal
Sunil Kumar Vimal Vadera 0291-3118525
93147152
39
Basni Krishi
Upaj Mandi
34200
5 Jodhpur Rajasthan
TRADER
172
SS Chem Industries
Ashok Ji 9829021965
F 60 Medium Ind.Area;
342005
Jodhpur Rajasthan
MILLER
173
Subhash Sharma
Mr.Subhash Sharma 9255411609
Siwani
Mandi
,Bhiwani
127046
Siwani Haryana
Trader
174
Subhlaxmi Traders
Omprakash Mundhara 0291-2721216 98290281
10
E 111Basni
Krishi Upaj
Mandi
342005
Jodhpur Rajasthan
TRADER
17 Sumati Gums Shreyans Mehta 9799506999
Basni 34200 Jodhpur Rajasthan [email protected] MILLER
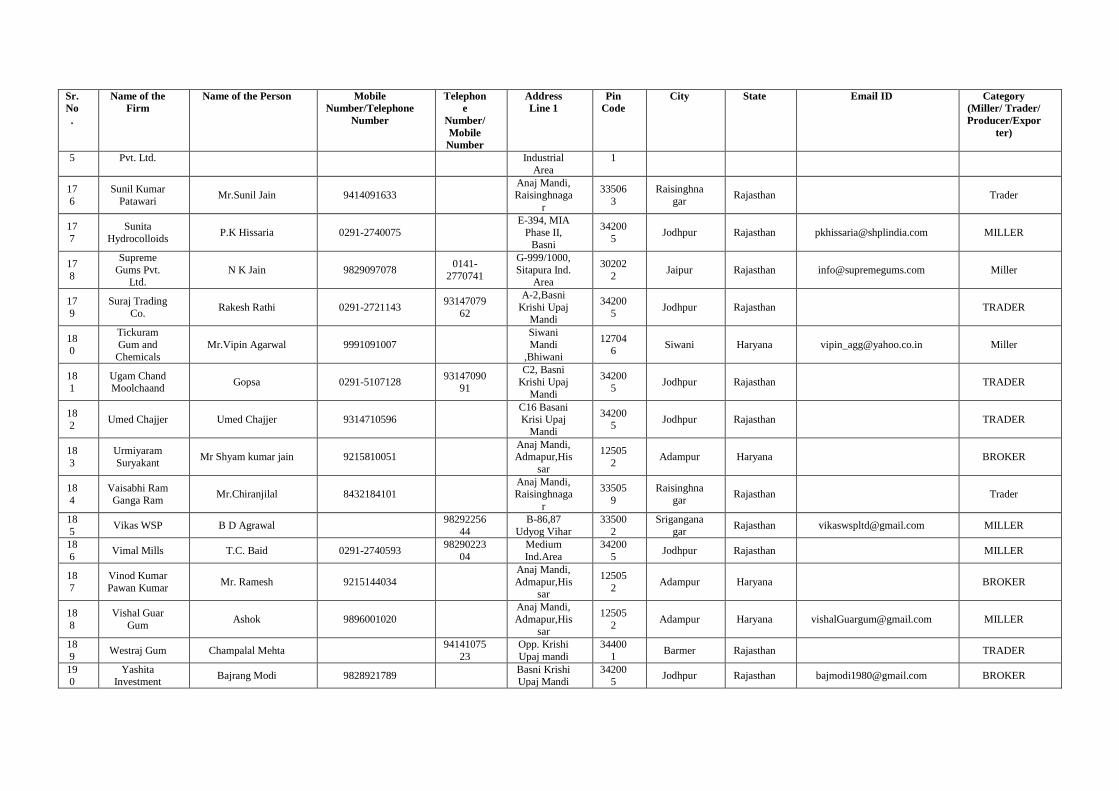
117
Sr.
No
.
Name of the
Firm
Name of the Person Mobile
Number/Telephone
Number
Telephon
e
Number/
Mobile
Number
Address
Line 1
Pin
Code
City State Email ID Category
(Miller/ Trader/
Producer/Expor
ter)
5 Pvt. Ltd. Industrial
Area
1
17
6
Sunil Kumar
Patawari Mr.Sunil Jain 9414091633
Anaj Mandi, Raisinghnaga
r
33506
3
Raisinghna
gar Rajasthan
Trader
17
7
Sunita
Hydrocolloids P.K Hissaria 0291-2740075
E-394, MIA
Phase II,
Basni
34200
5 Jodhpur Rajasthan [email protected] MILLER
17
8
Supreme
Gums Pvt. Ltd.
N K Jain 9829097078 0141-
2770741
G-999/1000,
Sitapura Ind. Area
30202
2 Jaipur Rajasthan [email protected] Miller
17
9
Suraj Trading
Co. Rakesh Rathi 0291-2721143
93147079
62
A-2,Basni
Krishi Upaj Mandi
34200
5 Jodhpur Rajasthan
TRADER
180
Tickuram
Gum and
Chemicals
Mr.Vipin Agarwal 9991091007
Siwani
Mandi
,Bhiwani
127046
Siwani Haryana [email protected] Miller
18
1
Ugam Chand
Moolchaand Gopsa 0291-5107128
93147090
91
C2, Basni
Krishi Upaj
Mandi
34200
5 Jodhpur Rajasthan
TRADER
182
Umed Chajjer Umed Chajjer 9314710596
C16 Basani Krisi Upaj
Mandi
342005
Jodhpur Rajasthan
TRADER
18
3
Urmiyaram
Suryakant Mr Shyam kumar jain 9215810051
Anaj Mandi, Admapur,His
sar
12505
2 Adampur Haryana
BROKER
18
4
Vaisabhi Ram
Ganga Ram Mr.Chiranjilal 8432184101
Anaj Mandi, Raisinghnaga
r
33505
9
Raisinghna
gar Rajasthan
Trader
18
5 Vikas WSP B D Agrawal
98292256
44
B-86,87
Udyog Vihar
33500
2
Srigangana
gar Rajasthan [email protected] MILLER
18
6 Vimal Mills T.C. Baid 0291-2740593
98290223
04
Medium
Ind.Area
34200
5 Jodhpur Rajasthan
MILLER
18
7
Vinod Kumar
Pawan Kumar Mr. Ramesh 9215144034
Anaj Mandi,
Admapur,Hissar
12505
2 Adampur Haryana
BROKER
18
8
Vishal Guar
Gum Ashok 9896001020
Anaj Mandi,
Admapur,Hissar
12505
2 Adampur Haryana [email protected] MILLER
18
9 Westraj Gum Champalal Mehta
94141075
23
Opp. Krishi
Upaj mandi
34400
1 Barmer Rajasthan
TRADER
190
Yashita Investment
Bajrang Modi 9828921789
Basni Krishi Upaj Mandi
342005
Jodhpur Rajasthan [email protected] BROKER

118

119
REFERENCES
Ali, M. 1982. Effect of plant types and row spacing on clusterbean production under dryland condition.
Indian J. Agron.27(2).144-148.
Anonymous, 1976. Salient highlights of research conducted during 5 years period (1971-76). J. Agron.
27(2) 144-148.
Anonymous (2002-03) Annual Progress Report of AICRP on Arid Legumes. Project Coordinator’s Unit,
CAZRI, Jodhpur, India
Bains, D.S and Dhillon, A.S 1977 the influence of sowing dates and row spacing patterns on
performance of two varieties of clusterbean (Cyamopsis tetragonoloba L.). J. Res. Punjab Agric.
Univ. 14 (2): 157-61.
Bhadoria, R.B.S., Chauhan, D.V.S. and Bhadoria H S, 1966.Effect of weed control on yield attributes
and yield of clusterbean (Cyamopsis tetragonoloba). Indian J. Agron. 41 (4): 662-4
Bhadoria R.B.S. Chauhan G.S., Kushwaha H.S. and Singh V.N. 1992. : Intercropping of clusterbean
(Cyamopsis tetragonoloba) with Pearl millet (Pennisetum glaucum). Indian J Agron. 37 (3) :
436-9
Bhati D. S. and Manohar S.S. 1989. Studies of intercropping of pearl millet with legumes
Daulay H. S., 1977: Relative performance of annual grain legumes as companion crops in intercropping
systems with perennial grasses. Proc. Of the first ICAR Guar Res. Workshop, held during 11-12
January 1977 at CAZRI, Jodhpur, pp. 93-7
Deshpande P. M. and Nankar J. T., 1977; Effect of intercropping on yield of seasonal sugarcane on net
returns in Marathwara region. Indian Sugar 27: 261-3.
Dhilon G. S., Kler, D.S. and Walia, A.S. 1980. Studies on groundnut – clusterbean association, J. Res.
Punjab Agriculture University.17 (1) 34-7.
Dixit L. and Misra A. 1991: intercropping in sugarcane. Indian J. Agron.36 : 261-262
Gill A. S., Patil S. D. and Yadav C L, 1984: intercropping studies in cenchrusciliaris.Agril. Sci. Digest 4
206-7
Gupta V.K. 1983, Studies on comparative response of some kharif crops to zinc application. Agric. Sci.
Dig. 3 (2) : 79-80
Jadav, J S, Virendra Kumar and B D Yadav (2003) Effect of Micronutrients on growth and seed yield of
clusterbean. National Symposium on Sustainability, Advancement and Future Thrust Area of
Research on Forages held at CCSHAU, Hisar from March 5-6, 2003. Pp:108-09.
Jadav, J S, V Kumar, B D Yadav and A Kumar (2002) Effect of sowing time and seed rate on seed yield
and quality of clusterbean cv HG 365. National Symposium on Arid Legumes for Food, Singh,
Y.P., Dahiya, D.J., Kumar, V. and Singh, M. 1993.Effect of nitrogen application on yield and
uptake of nitrogen by different legume crops. Crop Res. 6 (3): 394-400.
Jain, Veena, Yadav, B.D., Sharma, B.D. and Taneja, K.D. 1987. Effect of dates of sowing, row spacing
and varieties on yield and quality of clusterbean (Cyamopsis tetragonoloba L. Taub).Indian J.
Agron. 32 (4): 378-82.
Katyal J. C. and Sharma B.D. 1979, Role of micronutrient in crop production. Fertilizer news 24 : 33-50

120
Kumar V. and Agarwal S. K., 1982: studies on the compatibility and profitability of different intecrops
in pigeonpea, Haryana Agric. Univ. J. Res 12 (1): 116-8
Kumar Virendra (2009) Perspective Production Technologies of Arid Legumes. Perspective Research
Activities of Arid Legumes in India (Ed; D Kumar &A Henary). India Arid Legumes Society.
Pp:119-155
Muthuvel P, Subramanian V, Robinson J. G. and Ravi V, 1984 soil fertility and crop yield under bajara-
pulses intercropping system. Madras Agri. J. 71 (9) : 24-6
Narwal S. S. and Malik D. S. 1986: effect of intercropping on growth and yields of rainfed sunflower
and companion legumes. Inter J. Trop. agri. 4(1): 55-62.
Nutrition Security and Promotion of Trade held at CCSHAU, Hisar from May 15-16, 2002. Pp:93.
Oke, O.C., 1969, Sulphur Nutriion of Legumes, Experimental Agriculture
Rao C N, Sastry J A,Verma O.P.S. 1979, A note on the effect of the cultural practices on yield of forage
cereals-legumes mixtures. Forage Res. 5 89-92
Sharma, Purushottam (2010) Guar Industry Vision 2020: Single Vision Strategies. CCS National
Institute of Agricultural Marketing, Jaipur
Singh, B.P. 1981. Effect of intercropping of Guar in Pearl millet.Guar Newsl. 2: 24-7.
Singh, B.P. 1985. Effect of intercropping with pearl millet on productivity, profitability and water use on
aridisol.Indian J. Agron. 30 (4): 408-13.
Singh, D P, Rathore D N, Singh H and Kumar V. 1978; A note on crude protein and gum production of
two varieties of Guar (Cyampsis tetragonoloba) as influenced by two different seed rates and
row spacing. Ann. Arid zone 17 (3): 329-31.
Singh, G.D, Keshwa G L and Sharma KB. 1989. Effect of nitrogen and intercropping of clusterbean on
growth and yield of pearl mllet. Haryana J. Agron. 5 (2): 179-81.
Singh, R.P. 1977, a.Some agronomic considerations in the production of the cluster bean. Proceeding of
the first ICAR Guar Res. Workshop held during 11-12th january at CAZRI, jodhpur, pp.75-92
Taneja, K.D., Bishnoi, O.P., Row, V.U.M. and Ram, Niwas 1995. Effect of environment on growth and
yield of clusterbean. Crop Res. 9 (1): 159-62.
Yadav, B.D., Agarwal, S.K. and Faroda, A.S. 1991. Dry matter accumulation and nutrient uptake in
clusteebean as affected by row spacing and fertilizers application. Forage Res. 17 (1): 39-44.
Yadav, B.D., and Joon, R.K. 1993. Studies on intercropping of pearl millet in Guar. Forage Res. 19 (3 &
4): 306-9.
Top Related