


Languages
Pages
Legal

Page 1 of 79
Independent Final Report
Title: Customer Relationship Management in Retailing Industry: A
Case Study on Convenience Store Sector in Japan.
by
AHMED faysal
52114611
September 2016
Independent Final Report
Presented to
Ritsumeikan Asia Pacific University
In Partial Fulfillment of the Requirements for the Degree of
Master of Business Administration

Page 2 of 79
Table of Contents
List of Figures ................................................................................................................ 3
List of Tables ............................................................................................................... 4
Certification Page ....................................................................................................... 5
Acknowledgements ..................................................................................................... 6
Summary ...................................................................................................................... 7
1. Introduction: ............................................................................................................. 8
1.1. Problem Identification: .........................................................................................11
1.2. Research question: ...............................................................................................12
2. Literature Review:....................................................................................................13
2.1. Customer relationship management: .......................................................................13
2.2. Relationship among parameters: .........................................................................14
2.2. Convenience Stores Sector in Japan: ......................................................................20
2.2.1. Definition of Convenience stores: ....................................................................20
2.2.2. Convenience stores in Japan: ...........................................................................21
2.2.3. Leading convenience stores in Japan: ...............................................................22
2.2.4. Statistical Data about Convenience Store in Japan: .............................................24
2.3. Factor Analysis: ...................................................................................................25
2.3.1. Factors and variables: .....................................................................................27
2.3.2. Strategy and methods of factor analysis (exploratory analysis): ...........................32
2.3.3. Orthogonal rotation: .......................................................................................33
2.3.4. Eigenvalue Specification:................................................................................36
3. Methodology: ...........................................................................................................38
3.1. Data collection and preparation: .............................................................................38
3.2. Sample size and statistical power: ..........................................................................40
3.3. Survey Findings: ..................................................................................................41
Page 3 of 79
4. Result and Analysis: .................................................................................................49
5. Limitations and suggestions for further research: ......................................................69
6. Conclusion ...............................................................................................................70
7. Bibliography ...........................................................................................................72
8. Appendix .................................................................................................................75
List of Figures
Figure 1: Seven-Eleven stores in Japan. .............................................................................. 23
Figure 2: Lawson stores in Japan. ....................................................................................... 24
Figure 3: Retail market. ....................................................................................................... 25
Figure 4: Path model for a two variable, one common factor model .................................. 27
Figure 5 Path model for a Multi-variable, one common factor model ............................. 28
Figure 6: Path model Five - variable, two common factor model (Orthogonal Case) ..... 31
Figure 7: Gender .................................................................................................................. 41
Figure 8: Age group of respondents .................................................................................... 42
Figure 9: Location ............................................................................................................... 43
Figure 10: Store atmosphere ................................................................................................ 43
Figure 11: Check-out-time ................................................................................................... 44
Figure 12: Employee responsiveness .................................................................................. 44
Figure 13: 24 X 7 availability .............................................................................................. 45
Figure 14: product reliability ............................................................................................... 45
Figure 15: Store loyalty ....................................................................................................... 46
Figure 16: Utility bill payment ............................................................................................ 46
Figure 17: Price ................................................................................................................... 47
Figure 18: Communication .................................................................................................. 48
Figure 19: Overall satisfaction ............................................................................................ 48
Page 4 of 79
List of Tables
Table 1: 1st Analysis (Chart of Correlation Matrix) ............................................................ 50
Table 2: 1st Analysis (KMO and Bartlett’s Test) ................................................................. 52
Table 3: 1st Analysis (Communalities). ............................................................................... 52
Table 4: 1st Analysis (Total Variance Explained). ............................................................... 53
Table 5: 1st Analysis (Scree Plot). ....................................................................................... 55
Table 6: 1st Analysis (Component Matrix). ......................................................................... 56
Table 7: 1st Analysis (Rotated Component Matrix). ........................................................... 57
Table 8: 1st Analysis (Component Transformation Matrix). ............................................... 58
Table 9: 1st - 10th analysis (Combined result). ................................................................... 60
Table 10: 2nd Analysis (Rotated Component Matrix) ......................................................... 61
Table 11: 3rd Analysis (Rotated Component Matrix) .......................................................... 62
Table 12: 4th Analysis (Rotated Component Matrix) .......................................................... 63
Table 13: 5th Analysis (Rotated Component Matrix) .......................................................... 64
Table 14: 6th Analysis (Rotated Component Matrix) .......................................................... 64
Table 15: 7th Analysis (Rotated Component Matrix) .......................................................... 65
Table 16: 8th Analysis (Rotated Component Matrix) .......................................................... 66
Table 17: 9th Analysis (Rotated Component Matrix) .......................................................... 66
Table 18: 10th Analysis (Component Matrix) ..................................................................... 67
Table 19: 10th analysis (Correlation Matrix)....................................................................... 67
Page 5 of 79
Certification Page
I, AHMED faysal (Student ID 52114611) hereby declare that the contents of this
Independent Final Report are original and true, and have not been submitted at any
other university or educational institution for the award of degree or diploma.
All the information derived from other published or unpublished sources has been cited
and acknowledged appropriately.
AHMED faysal
2016/05/30

Page 6 of 79
Acknowledgements
First of all, I would like to thank my course Supervisor Professor Asgari Behrooz for his
untiring guidance, help, effort and suggestions. Really, I am thankful to him. Without
his direct guide this report could not have been possible. He is a very dynamic
personality. Professor Asgari constantly inspired me to develop my strategic thought and
shared his knowledge with me. I shall remain ever grateful to Professor Asgari Behrooz
for his extraordinary gesture and relentless effort.
Moreover, I would also like to express my gratitude to the participants who effectively
participated in survey and helped me to do my research. I am also thankful to my
colleagues who continuously support me during my research.

Page 7 of 79
Summary
Due to globalization, organizations need to change their strategies continuously to
maintain pace with the greatest challenges faced by the continuous change in the market
environment. In this competitive market place, a firm can differentiate itself by
providing unique product or services. An organization can build a sustainable approach
to defeat their competitor in a highly competitive environment. Customer is the main
element for sustainable business growth. It is an important issue to understand how to
manage relationship with customers. This research focused on the customer relationship
management of Convenience store sector in Japan. Convenience store sector is the fast
growing retailing sector in Japan. Competition is very high in Japanese retailing
industry. This research focused on the factors that most influence customer satisfaction
through service quality provided by the convenience stores. For doing so, this research
has collected relevant information from literatures about CRM in retailing industry and
also collected data through a survey conducted in Beppu city area on the assumption
that customer consumption pattern are similar all over Japan. Statistical analysis tool
has been used to analyze data collected through survey. Statistical analysis shows that
CRM components such as store loyalty, responsiveness are most influencing factors of
customer satisfaction.

Page 8 of 79
1. Introduction:
Customer relationship management is an integrated approach to know its customer,
process and technology by focusing customer retention and relationship development.
CRM has evolved because of dramatic increase of product and service availability.
Organizations that can successfully implement CRM will be able to earn higher
customer retention and long-term profitability (Chen & Popvich, 2003). Globalization
has changed the concept of mass production and marketing strategy and increased the
product availability. As there is an abundant of product availability, customer can buy
product from wherever they find suitable for them. This is also true for the case of seller
side in some sorts. Customers become just a number. Organizations are trying to
construct their relationship to potential and existing customers to gain customer loyalty.
By using technology and strategic management some organizations are creating and
increasing their market share over their competitor. To understand the best management
practice, executives should consider the four business dimensions: brand, management,
operations and equity (R. Guati, 2000).
Customer relationship management is considered as a broad term in today’s business
world. Different professional defines it in a different way. A marketing executive can

Page 9 of 79
see CRM as a strategic tool to achieve organizations target. A chief information
manager may see CRM as a medium to establish & retain relationship with
organizations and customers (Zubey, 2007) . Customer relationship management is very
essential for an organization. Proper and efficient customer relationships provide long
term relation with organization and customers and act as one of the driving force of
profitability for the organization. Growing effectiveness of CRM leads firms to
emphasize and analyze the relationships among concerned parties. Previously it may
considered as a tool for leading firms or organizations but now a days, sometimes
customer relationship management is a surviving tool for an organization.
Organizations need to understand what are critical factors that keeps them top than their
competitors. CRM helps organizations to understand the components customers need
and the components that can pull the organization over its competitor. Organizations are
competing with each other by lowering price, advertising or increasing promotions.
Organizations must understand the market condition. Organizations should have a
strong focus on their customer and potential customers. They should build a structure of
how to increase customer relationships that will provide a strong foundation for the
organization (Zineldin, 2006). Due to globalization companies are competing with each
Page 10 of 79
other’s to increase market share and to become dominant in the market. For doing so,
organizations should consider to improve CRM (Chu, 2007). But maintaining customer
loyalty for a long term is not an easy task for an organization. CRM is not only a fact
that is considered while doing the business but also the fact of retaining the customers
and the profitability of an organization largely depends on the longevity of customer
loyalty (Chan, 2010).
Organizations are realizing the fact that they should move from brand or product centric
marketing to customer centric approach. Many of the organization believe that CRM
implication is very expensive and sometimes inefficient. Some of organization consider
it as an investment on Technology other organizations consider it as a management tool
to improve customer satisfaction to achieve organization’s goal (Werner Reinartz, Aug.,
2004). Academicians are tried to show relationships among customer satisfaction and
company performance. But there are very few researches on how a particular
component of CRM relates with customer satisfaction and the factors that an
organization should implement to improve market share. This research will focus on the
factors that affect customer satisfaction particularly in convenience store sector in Japan
and will try to find what kind of measure organizations can take to improve CRM
Page 11 of 79
towards profitability.
The retail sector especially convenience store sector needs to investigate service quality,
customer loyalty, price, location, employee attitude and other factors to identify the
factors that influence customer satisfaction to increase profitability and maximize
revenue for this sector.
1.1. Problem Identification:
Retail industry is now in a period of transformation. Besides traditional retailing entities
such as department stores, supermarkets and convenience stores, new retailing entities
such as mega shopping mall are emerging in Japan. Competition among these retailing
companies is severe (Times, 2014).They are selling almost same kind of products.
Despite of the aggressive competition, Convenience stores sales volume remains same
and department and supermarket’s sales dropped substantially (Japan Ministry of
Economy, 2015).Due to this highly competitive market, retailers are taking strategic
management practices to increase market share and dominance. Retailers are looking
forward to increase their customer. So, exploratory research should be done on retailing
industry to identify the factors influencing organization’s performance. Some

Page 12 of 79
researchers found that customer relationship management has positive effect on
organization’s performance (Gerstner, 2002) (Jayasankaraprasad & Kumar, December,
2012) (Kumar G. R., 2008). Unfortunately most of the research focuses only few
components of customer relationship management. In these circumstances, this study
will try to combine factors that can have influence on customer relationship
management. For the simplicity and due to time constraints, this research will only
consider “Convenience store sector as a retailing industry in Japan” as a case study.
1.2. Research question:
This research will focus to find out CRM factors that can influence customer
satisfaction of convenience store sector in Japan. This study will consider only customer
side satisfaction not on organization side. This research will analyze customer
satisfaction factors that customers receive from convenience stores and identify factors
that can be improved by the organization’s side to enhance customer satisfaction.
Research question of this research is:
What are the most influencing factors that affect customer satisfaction
particularly in the convenience store sector in Japan?

Page 13 of 79
2. Literature Review:
2.1. Customer relationship management:
Once Organization’s thought was to create loyal customer. The thought behind this fact
was that, organization may make same level or better profitability in case of product
variation or price change. But due to globalization, customer behavior has changed or
does not work all the time. Some customers always ask and hunt for the best price. This
kind of customers is not profitable for the organization. A part CRM helps organization
to identify profitable customer groups and then to formulate business strategy to
maximize profitability (Kumar & Reinartz, 2012). Researchers have found that
consumer behavior greatly influence on marketing practice and advertisement by the
organization. Some of the researcher mentions that there is a strong relation between
advertising and materialism (Graham, 2010). An effective CRM should consider the
organization’s environments. This should include all the value chain part within an
organization. Organization will examine the whole value chain and implement the CRM
strategy and this strategy will focus intensively at the most weakest part of a value chain,
then it will be an effective customer relationship management strategy (Baran, 2008).
On the other hand, one group of researcher has found that managerial support and work
Page 14 of 79
affiliation has indirect effects on customer satisfaction by improving employee
satisfaction (Yuanqiong He, Septermber, 2011)
(Chan, 2010), pointed out that CRM is a different strategic approach than traditional
marketing strategy as it focuses one-to-one marketing activity and it helps to identify
effective customer group that are loyal and profitable for the organization. But there are
some controversies about the implication of CRM. (Bryan, 2002), pointed out that CRM
should not related with sales. Writer’s opinion is, organization paid bonus or other form
of reward to the sales person for their sales person but this sale may be for short term
and organization should consider on long-term profitability, because this customer drain
will not be consider as a problem for sales department but will consider as a customer
relation problem for the organization (Bryan, 2002).
2.2. Relationship among parameters:
Several researches have been done to identify relationship among factors that influence
customer satisfaction and customer relationship management. In this research I will

Page 15 of 79
focus on some selected journal articles and books those explain how these variables
interact with each other. The interaction will be considered to form the dynamic model
to further analyze. (J, London, Crom, & Jones, 1996), explains that organization
performance and customer satisfaction are related with employee attitudes. Employee
attitudes can be improved over time and experience. Customer satisfaction is a
performance indicator in service business along with measures of unit productivity and
administrative effectiveness. Author of this article has shown that a small change in
employee attitudes leads to a significant impact on performance. So if an organization
put money to improve its employee management then the organization can be benefited
by higher performance. John et al. (1994) from Massachusetts Institute of Technology
mentioned that many American corporations consider customer satisfaction as employee
motivation system as if employees know that he or she is able to satisfy their customer
than the employee feel satisfied psychologically. Writers focus on the reward system to
increase employee performance, although organizations cannot always measure
employee efficiency about how efficient they are in terms of customer satisfaction (John
R. Hauser, 1994). (Robinson, 1978), argued that customer satisfaction measurement tool
should be ideal, low cost and provide accuracy. Their opinion is, “the acquisition of
customer feedback should be anonymous, easy and simple”.
Page 16 of 79
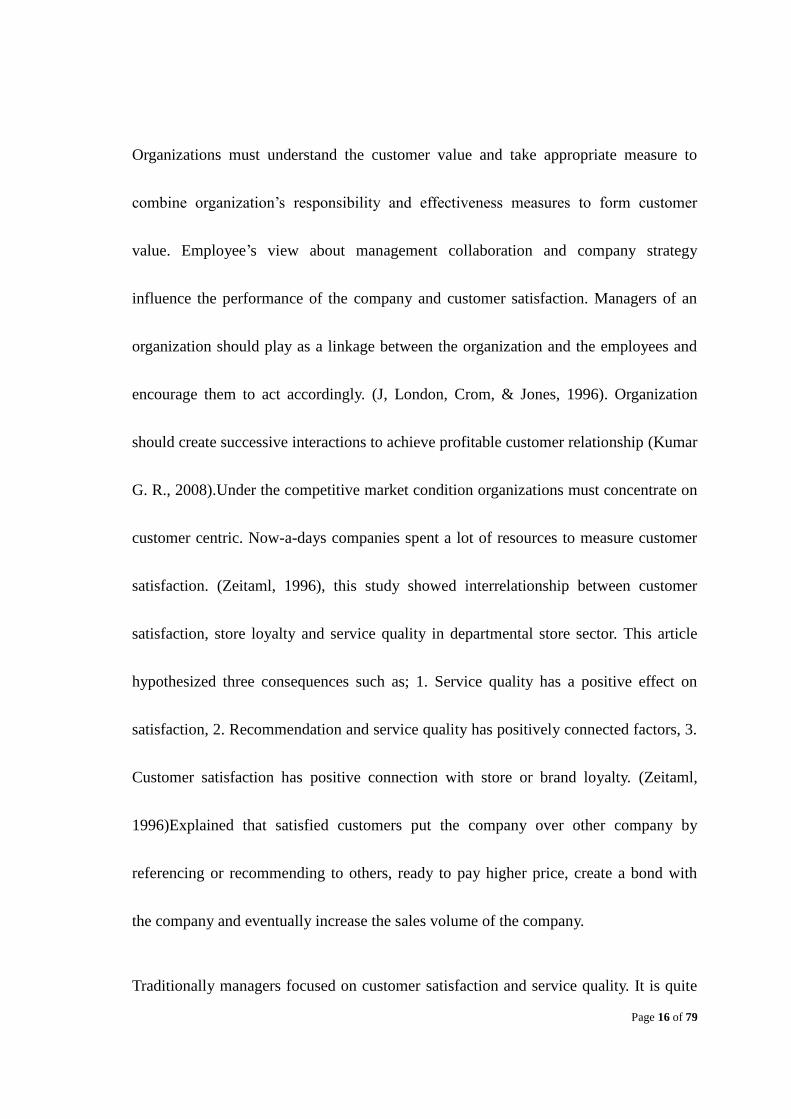
Organizations must understand the customer value and take appropriate measure to
combine organization’s responsibility and effectiveness measures to form customer
value. Employee’s view about management collaboration and company strategy
influence the performance of the company and customer satisfaction. Managers of an
organization should play as a linkage between the organization and the employees and
encourage them to act accordingly. (J, London, Crom, & Jones, 1996). Organization
should create successive interactions to achieve profitable customer relationship (Kumar
G. R., 2008).Under the competitive market condition organizations must concentrate on
customer centric. Now-a-days companies spent a lot of resources to measure customer
satisfaction. (Zeitaml, 1996), this study showed interrelationship between customer
satisfaction, store loyalty and service quality in departmental store sector. This article
hypothesized three consequences such as; 1. Service quality has a positive effect on
satisfaction, 2. Recommendation and service quality has positively connected factors, 3.
Customer satisfaction has positive connection with store or brand loyalty. (Zeitaml,
1996)Explained that satisfied customers put the company over other company by
referencing or recommending to others, ready to pay higher price, create a bond with
the company and eventually increase the sales volume of the company.
Traditionally managers focused on customer satisfaction and service quality. It is quite

Page 17 of 79
difficult for the managers to manage and identify loyal customer because the customer
can have positive affection with other rivalry shops at the same time. By fostering of a
favorable attitude stores can retain and create customers. But the same is true for the
competing stores. By providing quality service than other competitors, a store can create
favorable attitude to create customer satisfaction. (Sivada, 2000) Mentioned that
service quality and satisfaction can create favorable attitude on customers to
recommend the store to others that can boost revenue, customer retention and customer
loyalty. (J. Joseph Cronin, 1992) Also mention that service quality should be measured
as an attitude. Definition of communication in this research will not only consider as a
formal communication between service provider and customer but also will consider as
communication lack due to language barriers. The logic behind the fact is that there are
millions of foreigners live in Japan. Many of them cannot read and write in Japanese. So,
the difficulty customers face during purchase is to read the product level and find out a
specific product. In this situation, survey will focus on the customer’s shopping
experience in terms of communication barrier.
(Cynthia & S, 2009)This study focused on the communication of service provider and
Page 18 of 79
customer satisfaction. Researchers did an systematic analysis on professional service
provider to focus on the communication style of different service criteria and found that
service provider’s communication style largely influence customer satisfaction.
According to the author, Communications can be characterized by high and low
affiliation. Low dominance is important in low critical situation and vice versa. Low
dominance is important in experience services as because service providers are too
experienced about their service. On the other hand, high dominance is necessary in
credible services. Managers should train his/her employees how to adopt criticalness
and the nature of the service the organization provide. Researcher of this study found
that provider’s communication was largely related with the evaluations of the service,
such as if the provider’s service is satisfying, customer feels that the service was more
satisfying. Author suggested that communication style is very important in low-critical
situations because where customer likely to visit service provider routinely.
In another article, author mentioned that the front line service provider provides
organization-customer interface and they are mainly represents an organization to
customers. (Liao & Chuang, A Multilevel investigation of Factors Influencing
Employee service Perfromance and customer outcomes, 2004), here author shows that

Page 19 of 79
high quality service generates high customer satisfaction but the relationship between
overall customer evaluation and service quality is not always true. For example, a
restaurant’s architecture that is beyond the control of individual employees. In one
article, (Taylor & Baker, 1994) showed that service quality and customer satisfaction
model differs largely depends on the types of industry and the customer they are dealing
with. An empirical study had been conducted by (Jayasankaraprasad & Kumar,
December, 2012) on the factors that influence customer satisfaction in retail store sector.
This study considered product price, waiting time, store loyalty, repurchase intention,
Word-of-mouth activity, and complain behavior, service quality, store reputation and
store location as variables to measure customer satisfaction. The result shows that store
should pay attention on merchandise value proposition such as merchandise value, store
promotions, value added services that will initiate word-of-mouth marketing and also
increase store loyalty. Besides this, store decoration (atmosphere), fast check-out line,
personal rapport and dialogue with customers have positive impact on customer
satisfaction (Jayasankaraprasad & Kumar, December, 2012).
(Gerstner, 2002)Argues that product audit can be a useful tool to measure and services
against market situation and price sensitivity. This can help organizations to create

Page 20 of 79
product benchmarking, price analysis, and market expansion policy and profitability
measurement. There are some authors who argue that there are two CRM issues that
most of the literature neglected, one is advertisement and promotion of human capital.
(Homburg, Apr. 2007), is one of them who emphasized that empowering human capital
can improve customer satisfaction and an important factor for firm’s profitability. John
R. et.al (1994), proposed that firm can implement certain practices for improving CRM
such as firm can use customers reaction to monitor employees how they allocate their
effort to satisfy the customers. (John R. Hauser, 1994)mentioned that this kind of
approach can be used to motivate employees to make tradeoffs that are the best interest
of the firm.
2.2. Convenience Stores Sector in Japan:
2.2.1. Definition of Convenience stores:
The reason behind the use of the term ‘convenience’ is that customer found these kind
of small retailing shops are very convenient for their daily life. Basically convenience

Page 21 of 79
stores operate 24 hours a day and offer groceries, snack foods, toiletries, drinks,
newspaper & magazine. (Wikipedia)
2.2.2. Convenience stores in Japan:
In Japan Convenience stores are commonly known as ‘Konbini’ (コンビニ )
(Wikipedia)。Convenience stores started its operation in Japan in 1969. According to
(Koki, Dec. 2001) Japanese convenience stores largely depend on ‘Point of Sales (POS)’
system. This system helps stores to manage sales, keep customer information, amount
of products sold and also for the supplier to know the required amount of products to be
filled. According to (Russell, Jan-Mar 2000), convenience store became very popular in
Japan because of its convenience. In general convenience stores offers the below
services:
Courier and Postal service.
Photocopying and fax service.
Automated teller machines.

Page 22 of 79
Utilities bill payments.
Ticket for various cultural events and parks.
Cellular phone cards are also available. (Wikipedia).
2.2.3. Leading convenience stores in Japan:
Top five convenience store chains in Japan are Seven-Eleven Japan, Lawson, Family
Mart, Circles K Sunkus and Ministop and they accumulate 91% of total industry
(Review, 2014).
Seven-Eleven Japan:
Seven eleven japan is number one among convenience store chain in Japan in terms of
number of stores; it has 18650 stores and total sales4,291,067 million yen in Japan as
of April 30, 2016 (Co.Ltd, 2016). The following figure shows countrywide presence of
Seven-Eleven Japan.

Page 23 of 79
Source: (Co.Ltd, 2016)
Figure 1: Seven-Eleven stores in Japan.
Family Mart:
Family Mart is in second position in terms of stores and top in terms of sales. It has
17502 stores in Japan and net-sales 2,005,580 millions of yen as of February, 2016
(Mart, 2016).
Lawson:
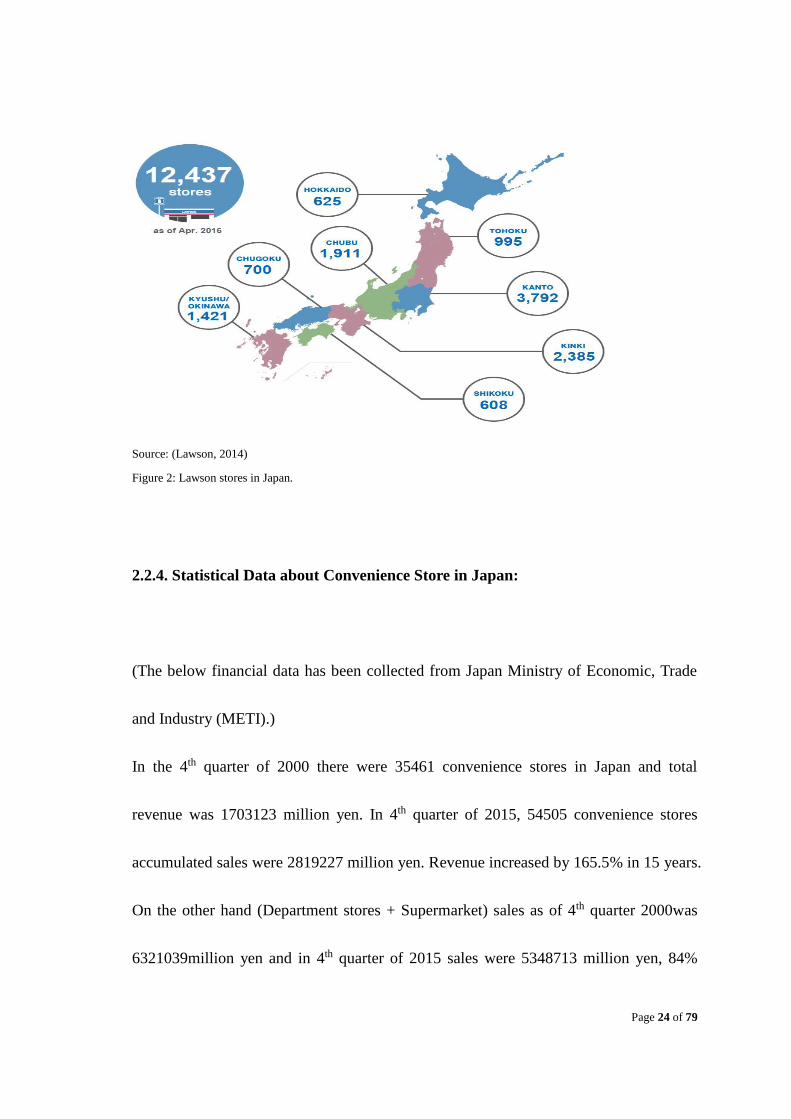
Lawson is the third largest convenience store chain in Japan of having 12437 stores
around Japan and net sales 1,945 billion yen as of February 2014 (Lawson, 2014).
Below picture shows Lawson’s presence in each prefecture.
Page 24 of 79
Source: (Lawson, 2014)
Figure 2: Lawson stores in Japan.
2.2.4. Statistical Data about Convenience Store in Japan:
(The below financial data has been collected from Japan Ministry of Economic, Trade
and Industry (METI).)
In the 4th quarter of 2000 there were 35461 convenience stores in Japan and total
revenue was 1703123 million yen. In 4th quarter of 2015, 54505 convenience stores
accumulated sales were 2819227 million yen. Revenue increased by 165.5% in 15 years.
On the other hand (Department stores + Supermarket) sales as of 4th quarter 2000was
6321039million yen and in 4th quarter of 2015 sales were 5348713 million yen, 84%
Page 25 of 79
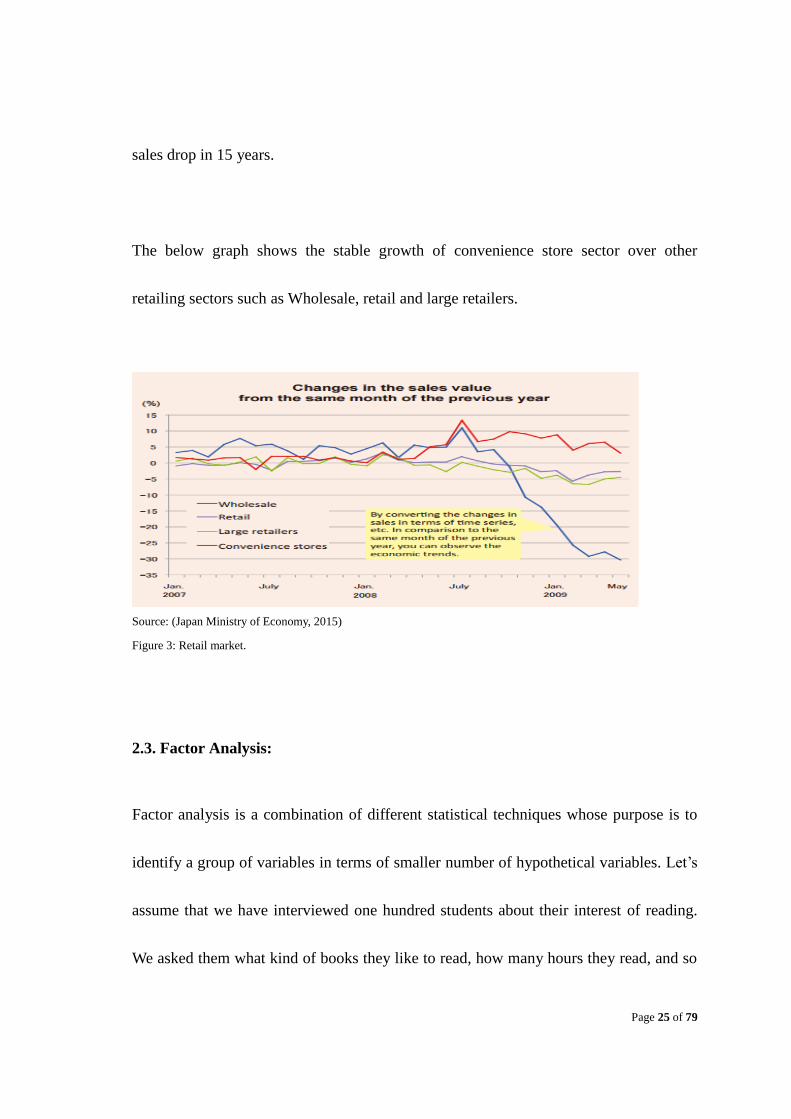
sales drop in 15 years.
The below graph shows the stable growth of convenience store sector over other
retailing sectors such as Wholesale, retail and large retailers.
Source: (Japan Ministry of Economy, 2015)
Figure 3: Retail market.
2.3. Factor Analysis:
Factor analysis is a combination of different statistical techniques whose purpose is to
identify a group of variables in terms of smaller number of hypothetical variables. Let’s
assume that we have interviewed one hundred students about their interest of reading.
We asked them what kind of books they like to read, how many hours they read, and so

Page 26 of 79
on. The responses to these questions are called observed variables. Generally, the first
step of analysis is to examine the interrelationship among the variables. If we prepare a
correlation matrix table, we may see that there are positive relationships among these
observed variables and the relationships within some subsets are stronger than those
between the subsets. A factor analysis then can be used to justify whether this
correlation can be explained by the existence of a small number of hypothetical
variables.
Sometimes, it is difficult to estimates about the numbers of underlying dimensions of a
given data. In this situation, factor analysis can be used as an exploratory technique to
identify the minimum number of hypothetical factors that can account for the observed
co variation and a form of possible data reduction. But, factor analysis is not only use
for exploring underlying dimension but also use to test specific hypotheses. We may
hypothesized that there are two different underlying dimensions in a given data set and
one certain variable belong to one dimension while others belong to the second. If we
use factor analysis it means that the analysis will justify the hypotheses and it is called
confirmatory factor analysis. The division between the two uses is always not clear. For
example we may say that there will be two underlying factors but cannot specify which

Page 27 of 79
variables will represent what factor (Jae-On Kim, Introduction to Factor Analysis: What
it is and how to do it, 2013).
2.3.1. Factors and variables:
“Factor analysis is based on the fundamental assumption that some underlying factors,
which are smaller in number than the number of observed variables, are responsible for
the covariation among the observed variables.” (Jae-On Kim, Introduction to Factor
Analysis: What it is and how to do it, 2013). Below graphs and equations are derived
from the book name, “Introduction to Factor Analysis ( (Jae-On Kim, Introduction to
Factor Analysis: What it is and how to do it, 2013)( (Jae-On Kim, Factor Analysis:
Statistical Methods and Practical Issues, 2014)”. Now, let’s assume a simplest case,
where one underlying factor is responsible for the covariance between two observed
variables.
F
X1
X1
U1
U2
d1
d2
b2
b1
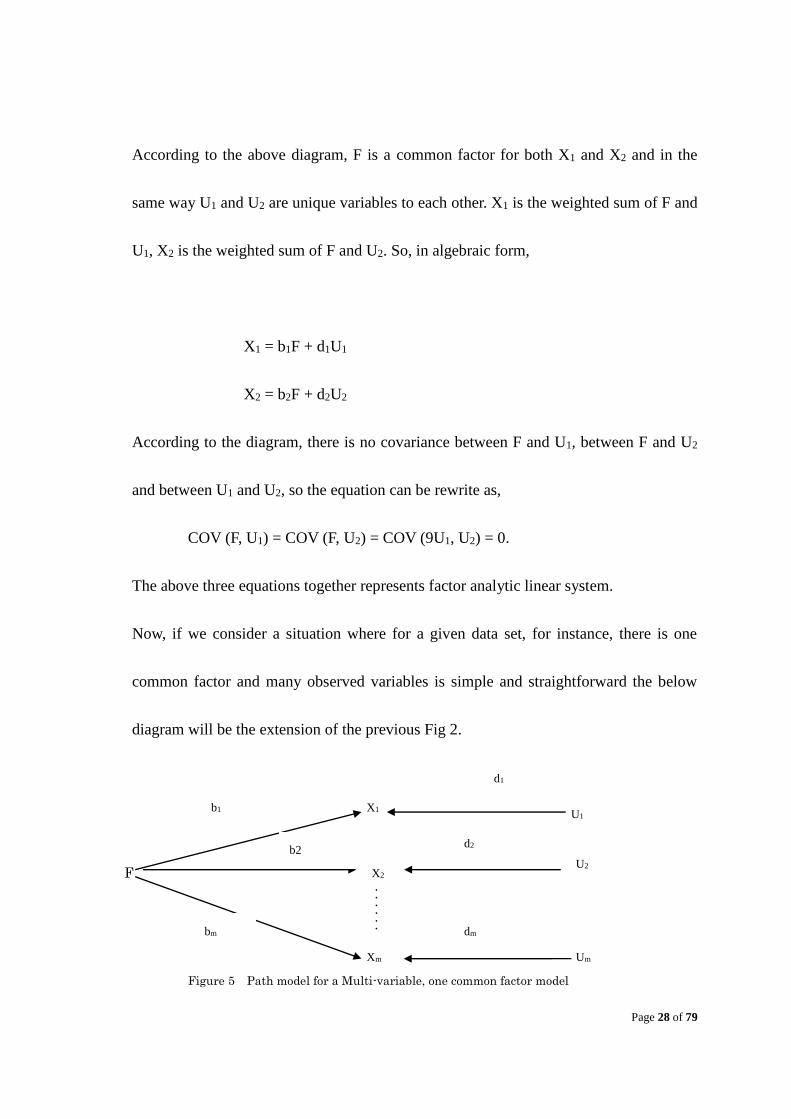
Figure 4: Path model for a two variable, one common factor model
Page 28 of 79
According to the above diagram, F is a common factor for both X1 and X2 and in the
same way U1 and U2 are unique variables to each other. X1 is the weighted sum of F and
U1, X2 is the weighted sum of F and U2. So, in algebraic form,
X1 = b1F + d1U1
X2 = b2F + d2U2
According to the diagram, there is no covariance between F and U1, between F and U2
and between U1 and U2, so the equation can be rewrite as,
COV (F, U1) = COV (F, U2) = COV (9U1, U2) = 0.
The above three equations together represents factor analytic linear system.
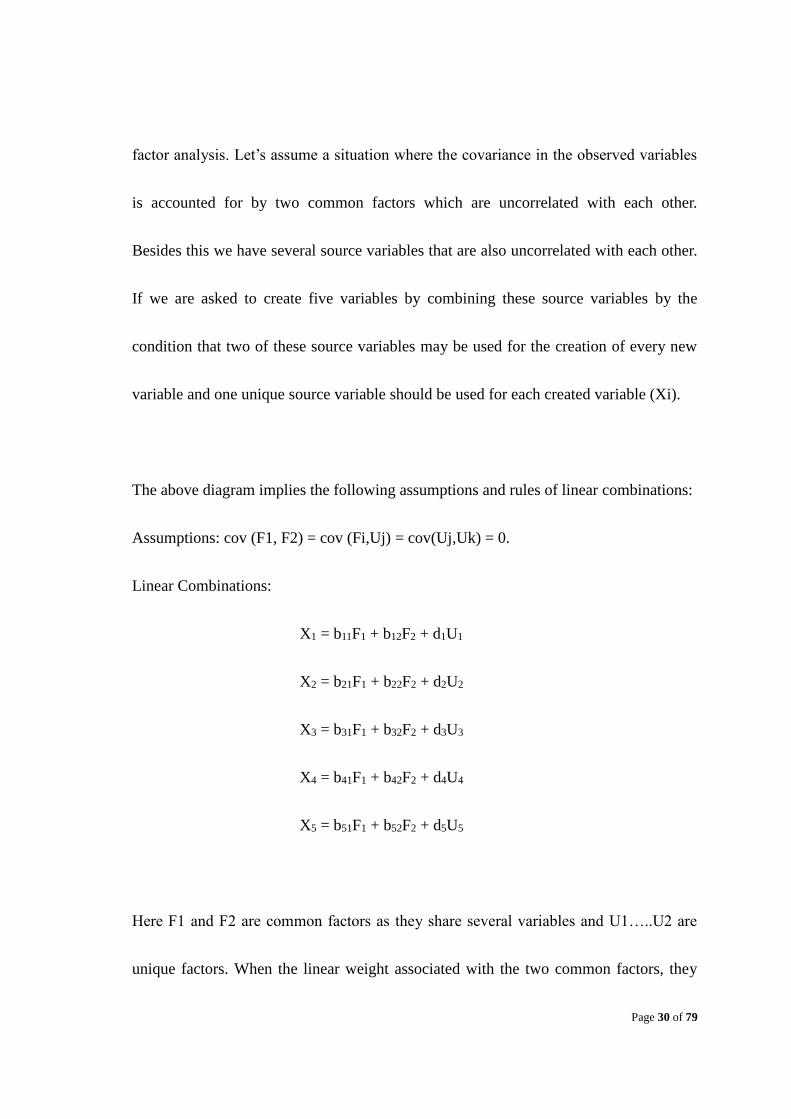
Now, if we consider a situation where for a given data set, for instance, there is one
common factor and many observed variables is simple and straightforward the below
diagram will be the extension of the previous Fig 2.
Figure 5 Path model for a Multi-variable, one common factor model
F
X1
Xm
U1
Um
d1
d2
bm
b1
U2
X2
dm
b2
. . . . . .

Page 29 of 79
According to the above diagram, COV (F, U1) = 0, and COV (Ui, Uj) =0, then the linear
equation will be,
X1 = b1F + d1U1
X2 = b2F + d2U2
………………
Xm = bmF + dmUm.
Therefore, for a given (m+1) number of variables we can identify b1, b2,….bm, as factor
loadings and b12, b2
2,….bm2, as respective communalities. The correlations between the
factors and variables are also equivalent to b1,b2,……bm, on an assumption that var(F)
= var(Ui) =1 and cov(F, Ui) and cov(Ui, Uj) = 0.
The resulting correlations between observed variables are:
r12 = b1b2, r13 = b1b3,……….r1m = b1bm and so on.
Two common factors (Orthogonal Case): From the above discussion, we have seen that
one common factor analysis is quite simple and explains few about basic properties of
Page 30 of 79
factor analysis. Let’s assume a situation where the covariance in the observed variables
is accounted for by two common factors which are uncorrelated with each other.
Besides this we have several source variables that are also uncorrelated with each other.
If we are asked to create five variables by combining these source variables by the
condition that two of these source variables may be used for the creation of every new
variable and one unique source variable should be used for each created variable (Xi).
The above diagram implies the following assumptions and rules of linear combinations:
Assumptions: cov (F1, F2) = cov (Fi,Uj) = cov(Uj,Uk) = 0.
Linear Combinations:
X1 = b11F1 + b12F2 + d1U1
X2 = b21F1 + b22F2 + d2U2
X3 = b31F1 + b32F2 + d3U3
X4 = b41F1 + b42F2 + d4U4
X5 = b51F1 + b52F2 + d5U5
Here F1 and F2 are common factors as they share several variables and U1…..U2 are
unique factors. When the linear weight associated with the two common factors, they

Page 31 of 79
form a rectangular form called factor pattern matrix or factor structure matrix (Jae-On
Kim, Introduction to Factor Analysis: What it is and how to do it, 2013).The correlation
(rFjXi) between a common factor (Fj) and a variable (Xi) is equivalent to the linear
weight (bij) is derived from the previous equations.
Figure 6: Path model Five - variable, two common factor model (Orthogonal Case)
The decomposition of the variance of Xi is given by:
var (Xi) = bi12 + bi2
2 + bi2
b21
X5
U5
b52
b51
d5
F
d4
U4
X4
b42
b31
X3
U3
d3
d2
U2
X2
F
X1
U1
d1
b11
b12
b22
b32
b41

Page 32 of 79
The communality of variable i(hi2) is the proportion of variance of an observed variable
(Xi) can be expressed as:
hi2 = bi1
2 + bi22
And, the covariance among any two observed variables is:
rik = bi1bk1 + bi2bk2
2.3.2. Strategy and methods of factor analysis (exploratory analysis):
The use of factor analysis mainly based on exploratory or confirmatory depending on
the objective of the research. Both two methods contains three basic steps; preparation
of covariance matrix, extracting initial factors and rotating to a terminal solution. In the
initial factoring process there are two models; one is common factor model and
principal component analysis where the underlying rationale is different from the
common factor analysis. Both the models are widely used and effective. Basic
difference between the two analyses is principal components are certain mathematical
functions of observed variables and the common factor analysis is not expressible by the
combination of observed variables (Jae-On Kim, Factor Analysis: Statistical Methods
Page 33 of 79
and Practical Issues, 2014). The main objective of exploratory analysis is to identify
minimum number of common factors that can produce correlation among the observed
variables. If there is no sampling and measurement error then there is an exact
correspondence between the minimum numbers of common factors responsible for a
given correlation matrix.
2.3.3. Orthogonal rotation:
Factoring process initially identifies few amounts of factors that can be judge for the
observed correlations. The next step is the rotation techniques through which simple and
more easily interpretable factors can be identified. There are three basic techniques for
rotation. The first one is to examine the pattern of variables graphically and then rotate
the axis or define new axis that best describe the one’s expectations. When variables are
well separated from each other than the simple structure can be achieved but if the
variables are not adequately separated from each other or not properly cluster then this
graphical technique is not appropriate to use.
The second approach is to rely on analytic rotation method that is free of subjective
judgment. There are two different subtypes in this process; one is orthogonal rotation
Page 34 of 79
and another is oblique rotation. Many variations are observed with each type of
rotations. The third one is to define a target matrix before rotation. The main target of
this kind of rotation is to find the factor pattern that are closest to the given target
matrix.
One of the systems to calculate numerical measure of simplicity is the variability of
squared factor loading for each row (Jae-On Kim, Factor Analysis: Statistical Methods
and Practical Issues, 2014). Because variance is the average of the squad deviations
from the mean and its value becomes greatest when one component of the squared
loadings equal to the communality while the rest of the values remain zero. Therefore
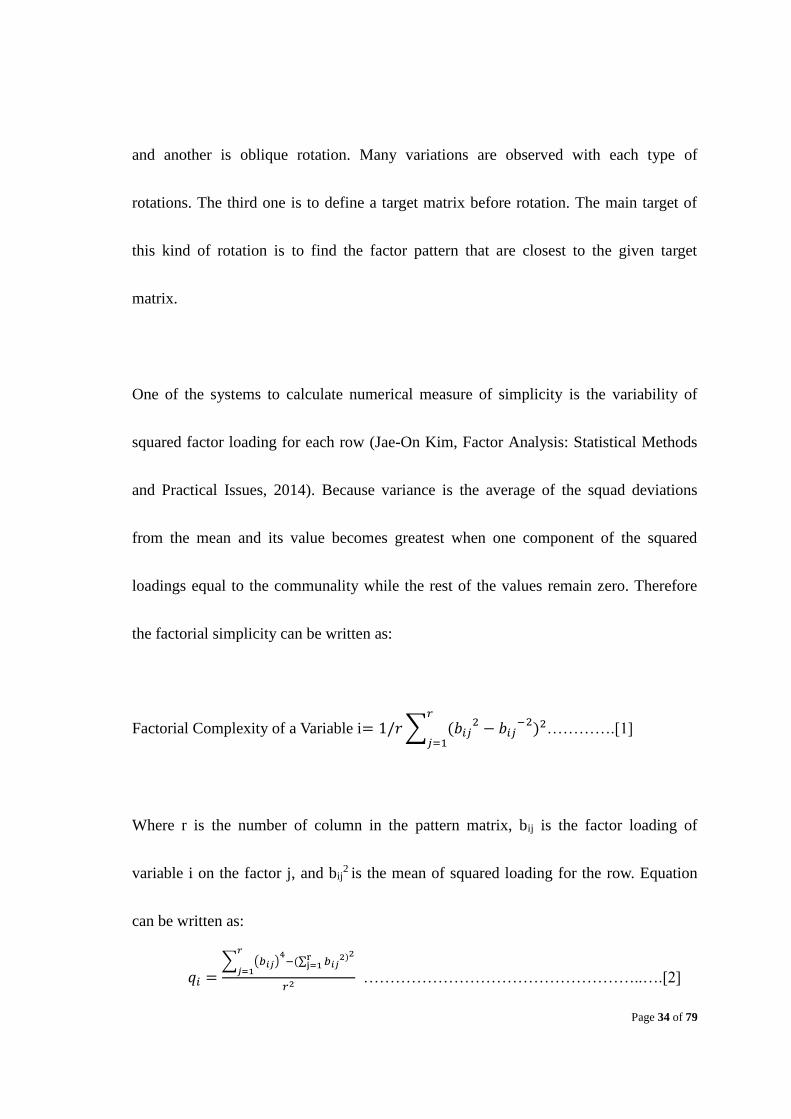
the factorial simplicity can be written as:
Factorial Complexity of a Variable i= 1/𝑟 ∑ (𝑏𝑖𝑗2 − 𝑏𝑖𝑗
−2)2𝑟
𝑗=1………….[1]
Where r is the number of column in the pattern matrix, bij is the factor loading of
variable i on the factor j, and bij2 is the mean of squared loading for the row. Equation
can be written as:
𝑞𝑖 =∑ (𝑏𝑖𝑗)
4−(∑ 𝑏𝑖𝑗
2)2rj=1
𝑟
𝑗=1
𝑟2 ……………………………………………..….[2]

Page 35 of 79
As the initial factor solution is given, both r and communalities of each variable are
fixed. So, the term after minus sign is fixed because in an orthogonal solution.
∑ 𝑏𝑖𝑗2 = ℎ𝑖
2𝑟𝑗=1
Then the overall simplicity can be obtained by summing qiforall the variables:
𝑞 = ∑ 𝑞𝑖 = ∑∑ (𝑏𝑖𝑗
4)−(∑ 𝑏𝑖𝑗2)2𝑟
𝑗=1𝑟𝑗=1
𝑟2𝑛𝑖=1
𝑛𝑖=1 …………………………………..[4]
If we maximize the value of q that means maximization of the following terms,
𝑄 = ∑ ∑ 𝑏𝑖𝑗4𝑟
𝑗=1𝑛𝑖=1 …………………………………………………….…[5]
This is because, the rest of the term of the equation [4] are constant. Interpretation of
variable becomes simple when few numbers of common factors involved in it. On the
other hand, interpretation of a factor becomes simpler when small number of variables
have high loading on the factors.
In case of varimax rotation, it maximizes the variance of the squared loadings for each
factor instead of maximizing variance of squared loadings of each variable. The
simplicity of a factor j is then:
𝑣𝑗 =𝑛 ∑ 𝑏𝑖𝑗
4𝑛𝑖=1 −(∑ 𝑏𝑖𝑗
2)2𝑛𝑖=1
𝑛2 …………………..……………………………[6]
We can see that the sum is of n variables and that the term after the minus sign does not
remain same as it was in case of equation number [2].
(∑ 𝑏𝑖𝑗2𝑛
𝑗=𝑖 )

Page 36 of 79
So, the overall measure of simplicity is:
V = ∑ 𝑣𝑗𝑟𝑗=1 =
∑ 𝑛 ∑ 𝑏𝑖𝑗4𝑛
𝑖=1𝑟𝑗=1 −(∑ 𝑏𝑖𝑗
2)𝑛𝑖=1
2
𝑛2 …………………………………[7]
This is known as row varimax criteria. Jae-On Kim mentioned about Kaiser’s
experiment (1958), that experiment showed that “the factor pattern obtained by varimax
rotation tends to be more invariant than that obtained by the quartimax when different
subsets of variables are factor analyzed”
(Jae-On Kim, Factor Analysis: Statistical Methods and Practical Issues, 2014).
2.3.4. Eigenvalue Specification:
One of the popular methods to specify factors while decomposing correlation matrix is
to specify eigenvalue more than 1. This simple method works well to provide result
consistent to researcher’s expectation and incase of samples from artificially created
population models. There are another criteria of eigenvalue is to identify factors that’s
eigenvalue is greater than zero when the reduced matrix is decomposed again. The logic
behind the strategy is that in a correlation matrix it provides even strict lower bound
common factors among variables. Eigenvalue is applied while communalities are
Page 37 of 79
applied and inserted in main diagonal. But it is not logical to extract all factors with
eigenvalue greater than zero, because there may be many negative eigenvalues.
Page 38 of 79
3. Methodology:
To answer the question, the demand side of the study, the research conducted a survey
to assess the customer’s feedback through questionnaire. The research data collection
based on the assumption that the consumption behavior and customer satisfaction
indicators across Japan are more or less similar, taking it in to account the cultural,
consumption pattern, language and buying habit similar in the population. Data for the
research has been collected from a specific area called Beppu city area on the basis of
the above assumption.
3.1. Data collection and preparation:
Basically there are two types of data, Primary data and secondary data. For this research
I choose primary data for clear and deep understanding. In this research target
population is the people who has purchasing power and has ability to evaluate services
they get from convenience stores. For this research, I chose to apply non-probability
sampling technique to collect data based on personal judgment and convenience.
Page 39 of 79
The first step in factor analysis is collecting relevant data for analysis. These basic data
then arrange in a systematic way, called a data matrix. The data matrix has two modes,
the entity mode represents cases or objects, the left side column of the table and the
other mode is variable modes represented by different column. I am going to do
exploratory factor analysis. One of the basic benefit to use exploratory analysis is there
are many existing programs that accept the covariance matrix as basic input data.
The second major step in factor analysis is to identify factors that can explain
correlations among the observed variables. To do so, I need to input the matrix into a
computer program to get the initial solution. There are many computer programs
available to run the test. Some of them are; a) maximum likelihood method; b)
least-squares method; c) Alpha factoring; d) Image factoring; e) principal components
analysis. I am going to use the principal component analysis because this one contains
special features such as KMO and Bartlett’s Test, Extraction Sums of Squared Loadings,
Varimax rotation and so on. The main concern is whether the smaller number of factors
can identify covariance among from a large number of variables.

Page 40 of 79
3.2. Sample size and statistical power:
For the survey, I distributed 100 survey questionnaires. 68 persons responded to the
survey. That means 68 customers replied about their convenience store’s shopping
experience. I am confident that the sample is adequately representing of the population.
Survey respondents were asked to reply about their convenience store shopping
experience. Survey asked respondents about their shopping experience so that I can
create a pattern of behavior.
The survey questionnaire contained customer satisfaction related questions. Most of the
questions used 5 points Likert scales. A Likert scale assumes that the intensity of
experience is linear. Likert scale is based on an assumption that attitude can be
measured (McLeod, 2008). SPSS, statistical data processing software has been used to
analyze the data. This software needs numerical value to analyze the information. So, a
5-pointlikert scale was designed where 1 represent strongly disagree, 2represent
disagree, 3 represent neither agree nor disagree, 4 represent agree and 5 represent
strongly agree. 1 coded as Female and 2 coded as male. Age group “less than 18” coded
as 1, age group “18-25” coded as 2, age group “26-32” coded as 3, age group “33-40”
coded as 4 and age group “above 40” coded as 5. The questionnaire items and the
Page 41 of 79
descriptive data are given in the Appendix.
Study participants did not receive any incentives for their participation in the survey.
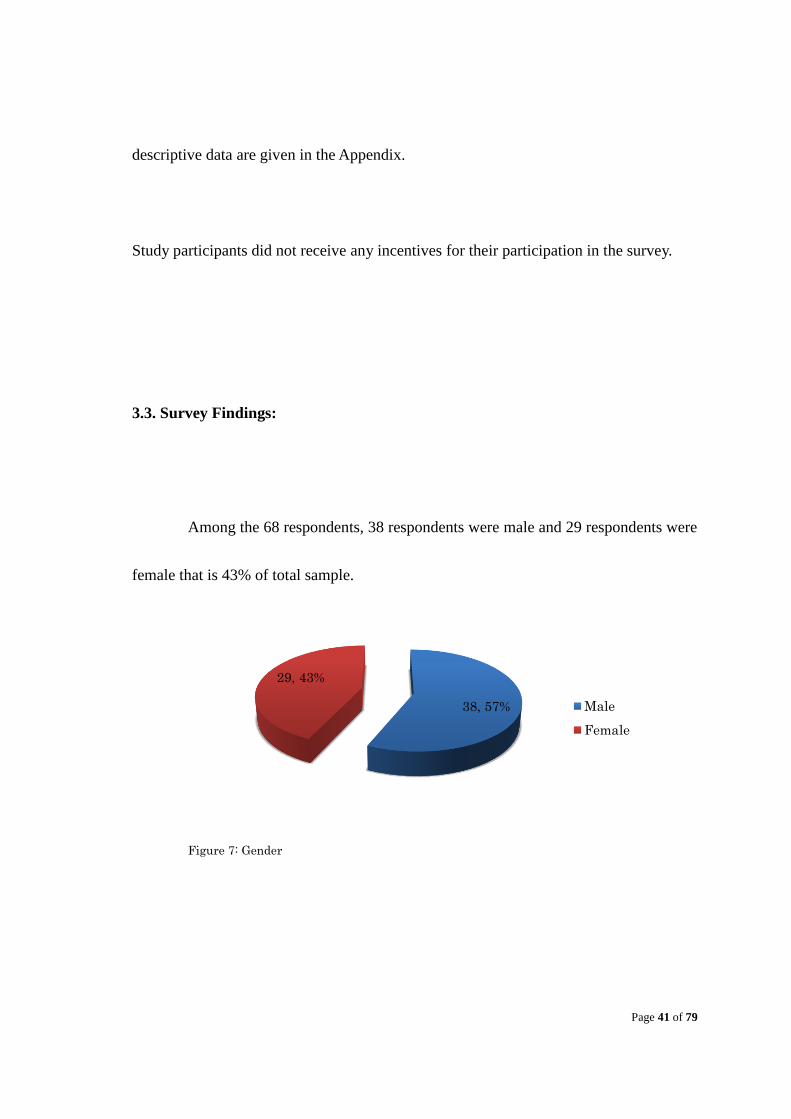
3.3. Survey Findings:
Among the 68 respondents, 38 respondents were male and 29 respondents were
female that is 43% of total sample.
Figure 7: Gender
38, 57%
29, 43%
Male
Female

Page 42 of 79
Respondent’s age were divided into five categories. Among them, 37% of respondents
were from age group “26-32”. The second largest age group was “33-40” contributes
34 % of the total respondent.
Figure 8: Age group of respondents
52 % of the respondents said that they are very satisfied about the location of the
convenience stores. 36.8% respondents reply that they are satisfied about the same, so
the overall satisfaction about stores location is around 90%.
3, 4%
23, 34%
25, 37%
12, 18%
5,
7%
Less than 18
18 - 25
26 - 32
33 - 40
41 and higher
Page 43 of 79
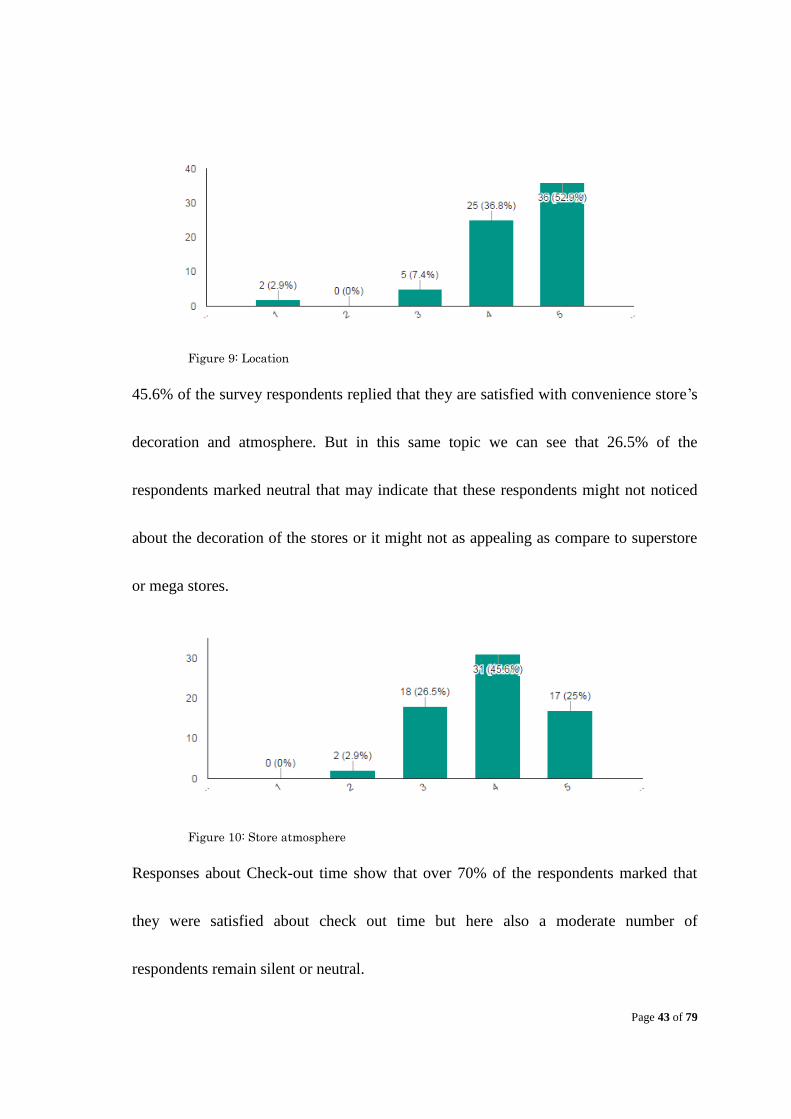
Figure 9: Location
45.6% of the survey respondents replied that they are satisfied with convenience store’s
decoration and atmosphere. But in this same topic we can see that 26.5% of the
respondents marked neutral that may indicate that these respondents might not noticed
about the decoration of the stores or it might not as appealing as compare to superstore
or mega stores.
Figure 10: Store atmosphere
Responses about Check-out time show that over 70% of the respondents marked that
they were satisfied about check out time but here also a moderate number of
respondents remain silent or neutral.

Page 44 of 79
Figure 11: Check-out-time
Significant number of respondents mentioned that they are satisfied about the
responsiveness of the convenience store’s staffs. 37.3 % among the total respondents
said they are very satisfied about the staff’s responsiveness.
Figure 12: Employee responsiveness
A significant number of respondents said that they use convenience store because it is
available for 7 days in a week and 24 hours a day and 64.7% respondents marked that
they are very satisfied for its availability.
Page 45 of 79
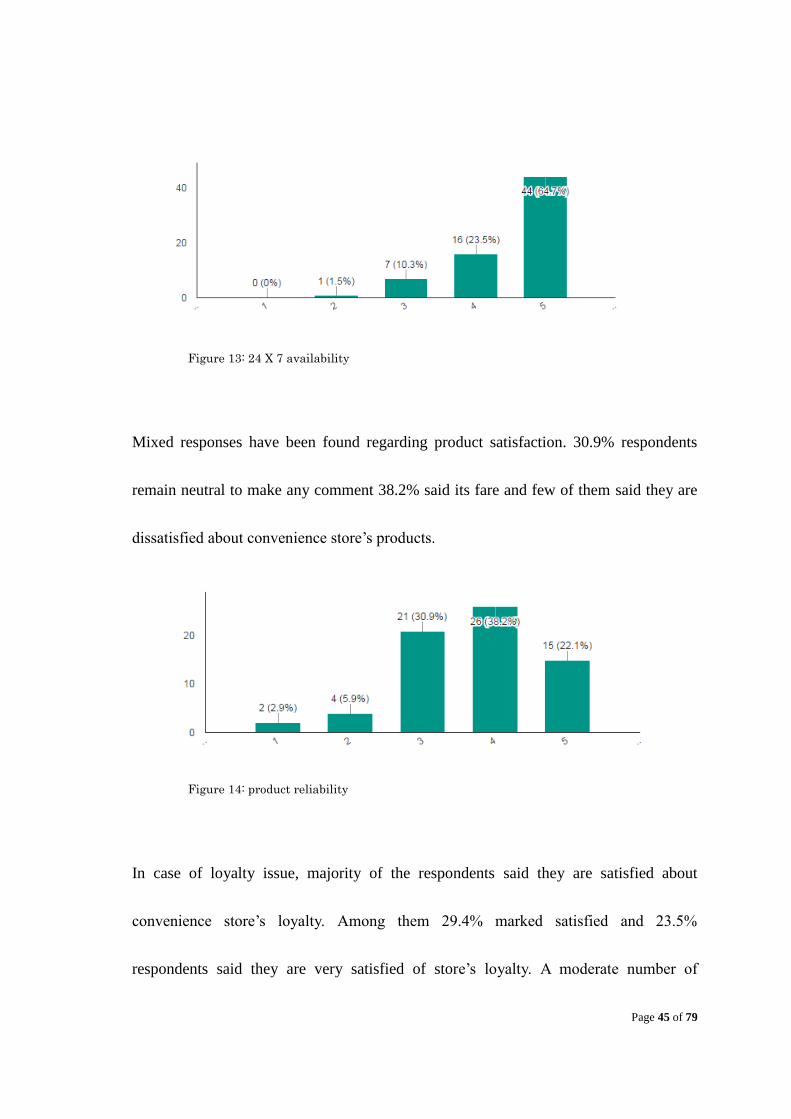
Figure 13: 24 X 7 availability
Mixed responses have been found regarding product satisfaction. 30.9% respondents
remain neutral to make any comment 38.2% said its fare and few of them said they are
dissatisfied about convenience store’s products.
Figure 14: product reliability
In case of loyalty issue, majority of the respondents said they are satisfied about
convenience store’s loyalty. Among them 29.4% marked satisfied and 23.5%
respondents said they are very satisfied of store’s loyalty. A moderate number of
Page 46 of 79
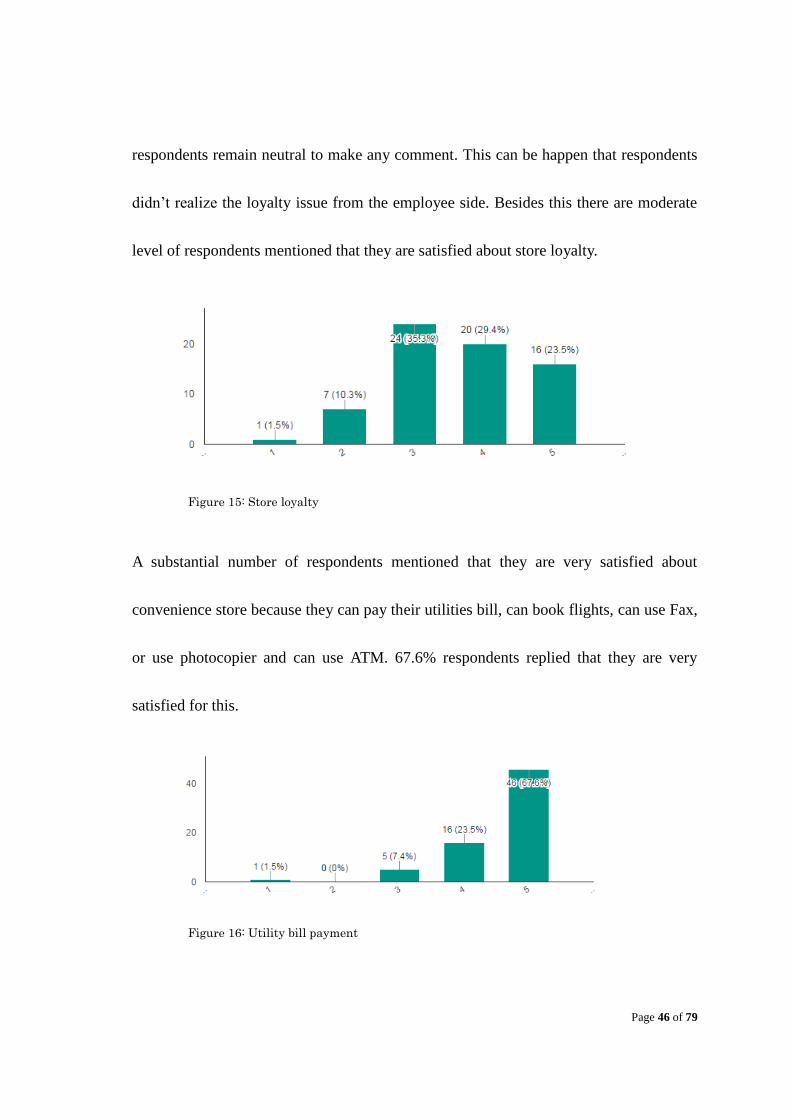
respondents remain neutral to make any comment. This can be happen that respondents
didn’t realize the loyalty issue from the employee side. Besides this there are moderate
level of respondents mentioned that they are satisfied about store loyalty.
Figure 15: Store loyalty
A substantial number of respondents mentioned that they are very satisfied about
convenience store because they can pay their utilities bill, can book flights, can use Fax,
or use photocopier and can use ATM. 67.6% respondents replied that they are very
satisfied for this.
Figure 16: Utility bill payment

Page 47 of 79
Significant and diverse results have been found when respondents were asked about the
price satisfaction of products convenience stores sell. 30.3% respondent marked
strongly dissatisfied and 27.3% respondents replied that they are dissatisfied about the
product price of convenience store. A total number of 57.6% respondents felt that
convenience store’s product price is higher than other stores.
Figure 17: Price
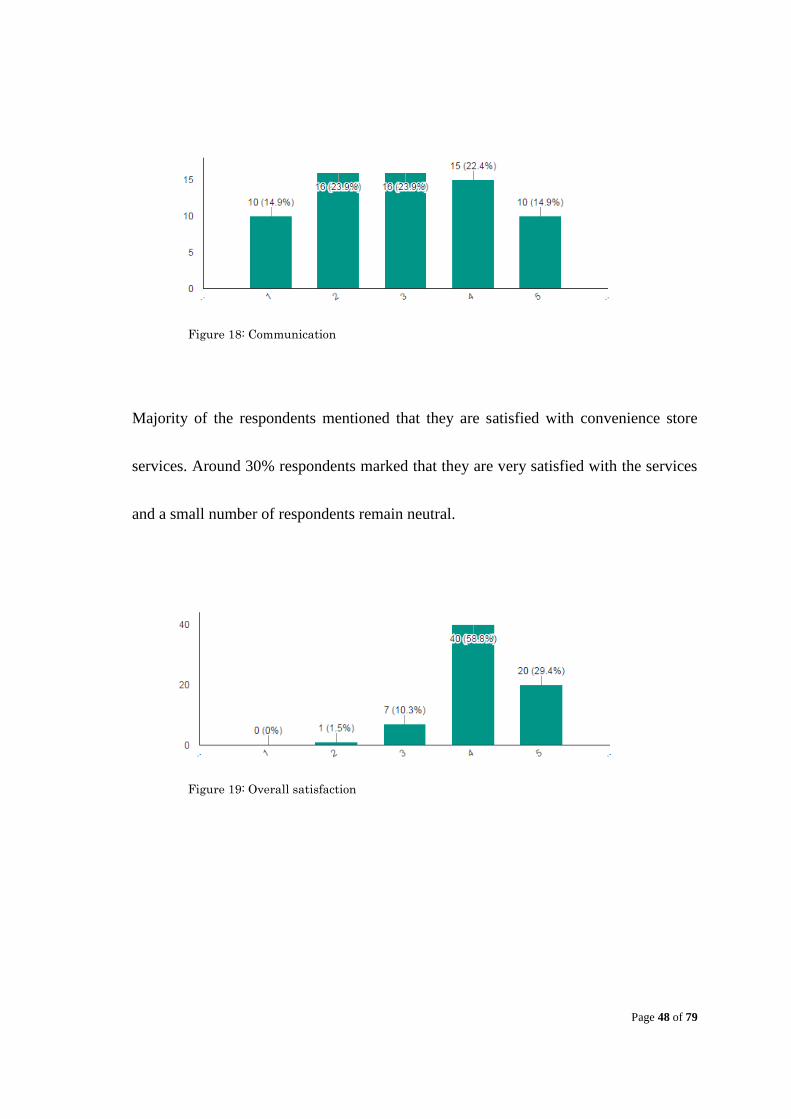
Mixed responses have been found from this category. 14.9% respondents strongly agree,
23.9% agree that language is a problem to communicate with the staff or to read the
levels of the product. A moderate number of respondents remain neutral and around
37% respondents believe that language was not a barrier for them to communicate with
the store employees and read the product levels.
Page 48 of 79
Figure 18: Communication
Majority of the respondents mentioned that they are satisfied with convenience store
services. Around 30% respondents marked that they are very satisfied with the services
and a small number of respondents remain neutral.
Figure 19: Overall satisfaction

Page 49 of 79
4. Result and Analysis:
1st analysis:
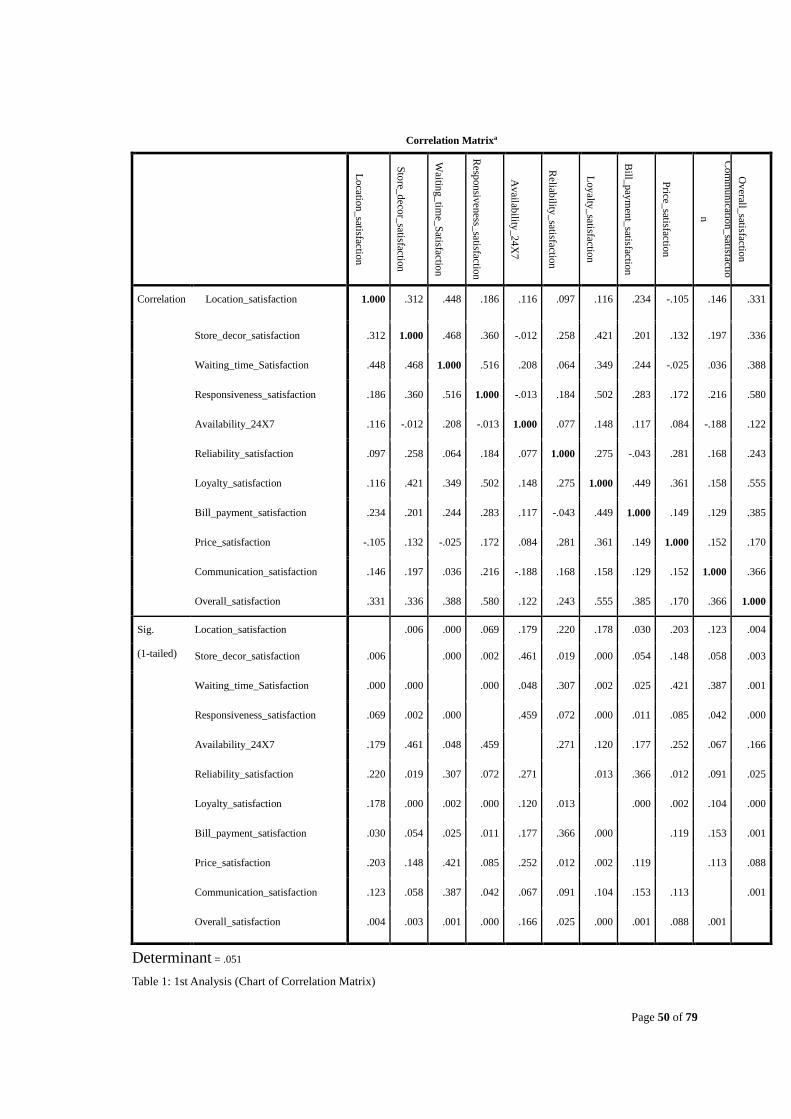
The below chart is showing correlation matrix that present correlations among variables.
Pearson Correlation measures the degree of the linear relationship between two
variables (Mo & Wang, 2015). Pearson correlation ranges from -1.0 to +1.0. Pearson
correlation is given by the letter r (Encyclopedia, 2016). If the r value is O or close to
zero then we can say that there is no relationship or very small relationship. Notice that
they are correlation of 1.0 in a diagonal line across the table. That is because each
variable should correlate perfectly with itself.
Below Correlation Matrix shows relationship among 11 variables. From the below chart,
I am looking for values higher than 0.5 and close to 1.0. But from the chart I cannot find
satisfactory values for correlations. There are two values .58 and .56 shows a moderate
level of correlation with overall satisfaction and employee responsiveness satisfaction;
overall satisfaction and store loyalty satisfaction respectively.
The issue about determinant is that if the value is O then there must be computational
problems with factor analysis and SPSS may not be able to do factor analysis. Here the
determinant is .051, which is satisfactory to run factor analysis.
Page 50 of 79
Table 1: 1st Analysis (Chart of Correlation Matrix)
Correlation Matrixa
Lo
cation_
satisfaction
Sto
re_d
ecor_
satisfaction
Waitin
g_
time_
Satisfactio
n
Resp
on
siven
ess_satisfactio
n
Av
ailability
_24
X7
Reliab
ility_
satisfaction
Loy
alty_
satisfaction
Bill_
pay
men
t_satisfactio
n
Price_
satisfaction
Co
mm
un
ication_
satisfactio
n
Ov
erall_satisfactio
n
Correlation Location_satisfaction 1.000 .312 .448 .186 .116 .097 .116 .234 -.105 .146 .331
Store_decor_satisfaction .312 1.000 .468 .360 -.012 .258 .421 .201 .132 .197 .336
Waiting_time_Satisfaction .448 .468 1.000 .516 .208 .064 .349 .244 -.025 .036 .388
Responsiveness_satisfaction .186 .360 .516 1.000 -.013 .184 .502 .283 .172 .216 .580
Availability_24X7 .116 -.012 .208 -.013 1.000 .077 .148 .117 .084 -.188 .122
Reliability_satisfaction .097 .258 .064 .184 .077 1.000 .275 -.043 .281 .168 .243
Loyalty_satisfaction .116 .421 .349 .502 .148 .275 1.000 .449 .361 .158 .555
Bill_payment_satisfaction .234 .201 .244 .283 .117 -.043 .449 1.000 .149 .129 .385
Price_satisfaction -.105 .132 -.025 .172 .084 .281 .361 .149 1.000 .152 .170
Communication_satisfaction .146 .197 .036 .216 -.188 .168 .158 .129 .152 1.000 .366
Overall_satisfaction .331 .336 .388 .580 .122 .243 .555 .385 .170 .366 1.000
Sig.
(1-tailed)
Location_satisfaction .006 .000 .069 .179 .220 .178 .030 .203 .123 .004
Store_decor_satisfaction .006 .000 .002 .461 .019 .000 .054 .148 .058 .003
Waiting_time_Satisfaction .000 .000 .000 .048 .307 .002 .025 .421 .387 .001
Responsiveness_satisfaction .069 .002 .000 .459 .072 .000 .011 .085 .042 .000
Availability_24X7 .179 .461 .048 .459 .271 .120 .177 .252 .067 .166
Reliability_satisfaction .220 .019 .307 .072 .271 .013 .366 .012 .091 .025
Loyalty_satisfaction .178 .000 .002 .000 .120 .013 .000 .002 .104 .000
Bill_payment_satisfaction .030 .054 .025 .011 .177 .366 .000 .119 .153 .001
Price_satisfaction .203 .148 .421 .085 .252 .012 .002 .119 .113 .088
Communication_satisfaction .123 .058 .387 .042 .067 .091 .104 .153 .113 .001
Overall_satisfaction .004 .003 .001 .000 .166 .025 .000 .001 .088 .001
Determinant = .051

Page 51 of 79
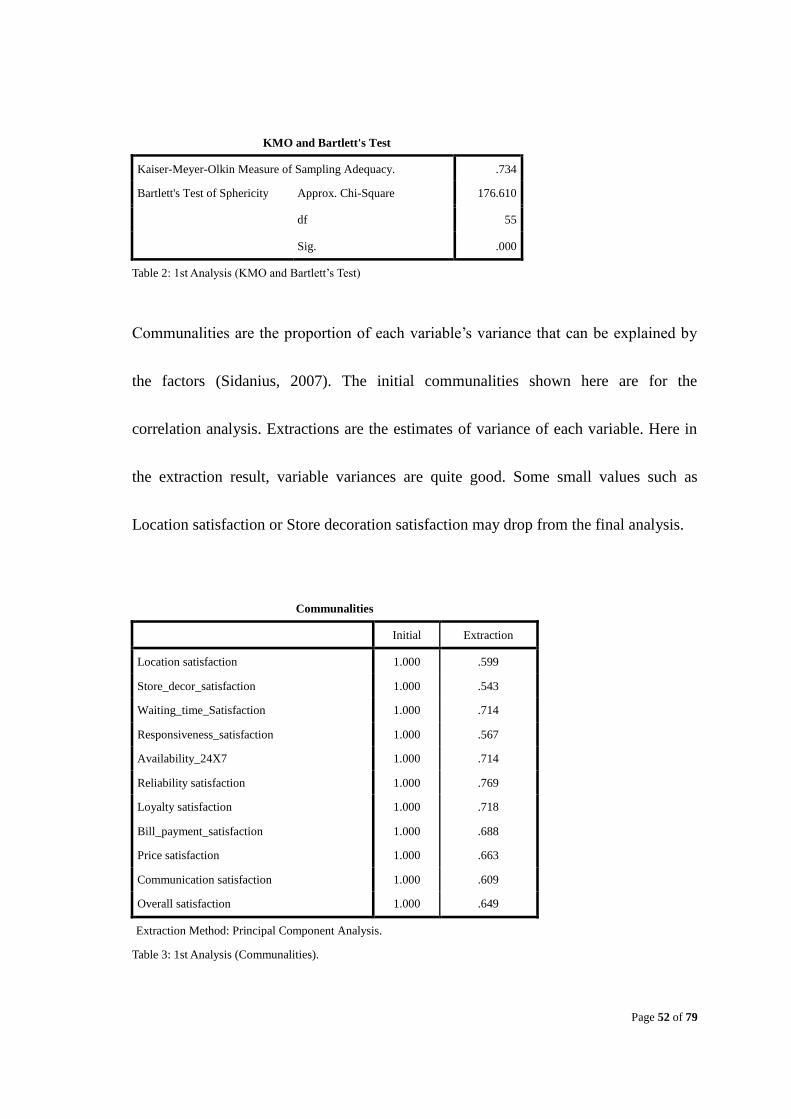
KMO and Bartlett’s Test:
Here the Kaiser-Meyer-Olkin measure of sampling adequacy is .734. The value of The
KMO represents the how small the partial correlations are, based on the original
correlation (SPSS Statistics support team, 2011). Kaiser-Meyer-Olkin measure of
sampling adequacy is close to1.0indicates that the data are adequate to do factor
analysis. KMO value less than 0.5 indicate that the factor analysis may not be useful.
This is happen when most of the zero-order correlations are positive. In my findings, I
have quite good KMO value near the expected KMO value and if I see the Correlation
Matrix chart, it reflects many partial positive correlations.
This analysis has Bartlett’s test of Sphericity, Chi-square value is approximate 176.610.
Also it shows the significance value that indicates that the correlation matrix is an
identity matrix (Sidanius, 2007). Bartlett’s lest of Sphericity test the hypothesis that the
variables of the dataset may not have any correlation and not suitable for structure
detection (Center). A smaller value less than 0.05 indicates significant usefulness of
dataset for factor analysis.
Page 52 of 79
KMO and Bartlett's Test
Kaiser-Meyer-Olkin Measure of Sampling Adequacy. .734
Bartlett's Test of Sphericity Approx. Chi-Square 176.610
df 55
Sig. .000
Table 2: 1st Analysis (KMO and Bartlett’s Test)
Communalities are the proportion of each variable’s variance that can be explained by
the factors (Sidanius, 2007). The initial communalities shown here are for the
correlation analysis. Extractions are the estimates of variance of each variable. Here in
the extraction result, variable variances are quite good. Some small values such as
Location satisfaction or Store decoration satisfaction may drop from the final analysis.
Communalities
Initial Extraction
Location satisfaction 1.000 .599
Store_decor_satisfaction 1.000 .543
Waiting_time_Satisfaction 1.000 .714
Responsiveness_satisfaction 1.000 .567
Availability_24X7 1.000 .714
Reliability satisfaction 1.000 .769
Loyalty satisfaction 1.000 .718
Bill_payment_satisfaction 1.000 .688
Price satisfaction 1.000 .663
Communication satisfaction 1.000 .609
Overall satisfaction 1.000 .649
Extraction Method: Principal Component Analysis.
Table 3: 1st Analysis (Communalities).
Page 53 of 79
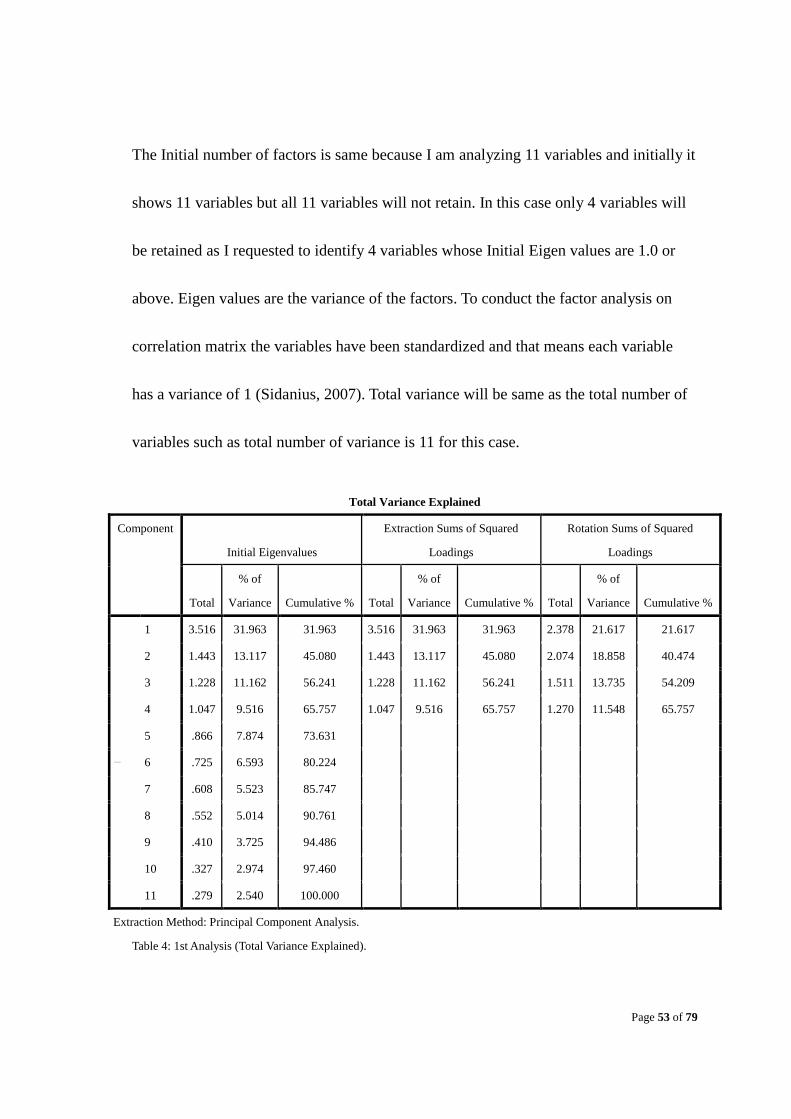
The Initial number of factors is same because I am analyzing 11 variables and initially it
shows 11 variables but all 11 variables will not retain. In this case only 4 variables will
be retained as I requested to identify 4 variables whose Initial Eigen values are 1.0 or
above. Eigen values are the variance of the factors. To conduct the factor analysis on
correlation matrix the variables have been standardized and that means each variable
has a variance of 1 (Sidanius, 2007). Total variance will be same as the total number of
variables such as total number of variance is 11 for this case.
Total Variance Explained
Component
Initial Eigenvalues
Extraction Sums of Squared
Loadings
Rotation Sums of Squared
Loadings
Total
% of
Variance Cumulative % Total
% of
Variance Cumulative % Total
% of
Variance Cumulative %
dimension0
1 3.516 31.963 31.963 3.516 31.963 31.963 2.378 21.617 21.617
2 1.443 13.117 45.080 1.443 13.117 45.080 2.074 18.858 40.474
3 1.228 11.162 56.241 1.228 11.162 56.241 1.511 13.735 54.209
4 1.047 9.516 65.757 1.047 9.516 65.757 1.270 11.548 65.757
5 .866 7.874 73.631
6 .725 6.593 80.224
7 .608 5.523 85.747
8 .552 5.014 90.761
9 .410 3.725 94.486
10 .327 2.974 97.460
11 .279 2.540 100.000
Extraction Method: Principal Component Analysis.
Table 4: 1st Analysis (Total Variance Explained).
Page 54 of 79
In Extraction Sums of Squared Loadings, total column shows the Eigenvalues. The first
factors contains to most variance as it consider as the highest eigenvalues. From the
next factors account for as much of the left over variance as it can and so on. % of
variance column shows how much percentage of variance each factor contains form
total variance (Sidanius, 2007). Cumulative percentage column shows the cumulative
percentage of variance of current and preceding factors. For example the fourth row
shows a value of 65.757%, means that first four factors together represent 65.757% of
total variance.
The values of the Rotation sums of the Squad Loadings column present the distribution
of variance after varimax rotation. Varimax maximize the variance and the total
variance is redistributed among the four extracted factors.

Page 55 of 79
Table 5: 1st Analysis (Scree Plot).
System puts the initial eigenvalues against component in a graph then got the above
scree plot. The scree plot shows eigenvalues against factor number. Above graph shows
that four factors have been identified whose eigenvalues are more than 1.0. We can see
that from the fifth factor, the line is almost flat. The reason behind the case is that each
following factor contains smaller and smaller amounts of total variance. The inflection
point is around component number 2 from where the eigenvalue jumped to 3.5.

Page 56 of 79
Component Matrixa
Component
1 2 3 4
Overall_satisfaction .790 .043 -.079 -.134
Loyalty_satisfaction .759 .223 .246 -.176
Responsiveness_satisfaction .737 .008 -.107 -.111
Waiting_time_Satisfaction .660 -.504 .023 .155
Store_decor_satisfaction .646 -.068 -.169 .306
Price_satisfaction .322 .664 .344 -.024
Location_satisfaction .471 -.526 -.201 .244
Availability_24X7 .171 -.259 .769 .162
Communication_satisfaction .372 .356 -.581 -.077
Reliability_satisfaction .371 .459 .083 .643
Bill_payment_satisfaction .538 -.105 .161 -.601
Table 6: 1st Analysis (Component Matrix).
The above component matrix shows that four components have been extracted.
Component matrix presents how variables are loaded in the components. We can see
that in component number 1, first 5 variables have loaded very high, in component
number 2, variable number 6 has loaded very high, in component number 3, variable
number 8 has loaded high and in component number 4, variable number 10 has loaded
high.
Page 57 of 79
Rotated Component Matrixa
Component
1 2 3 4
Bill_payment_satisfaction .787 .087 -.240 -.055
Loyalty_satisfaction .756 .164 .340 -.053
Overall_satisfaction .648 .402 .195 .175
Responsiveness_satisfaction .583 .410 .163 .180
Location_satisfaction .059 .769 -.068 -.004
Waiting_time_Satisfaction .307 .768 -.002 -.172
Store_decor_satisfaction .229 .597 .338 .142
Reliability_satisfaction -.037 .175 .858 .035
Price_satisfaction .437 -.335 .598 -.039
Availability_24X7 .158 .129 .145 -.807
Communication_satisfaction .244 .115 .196 .706
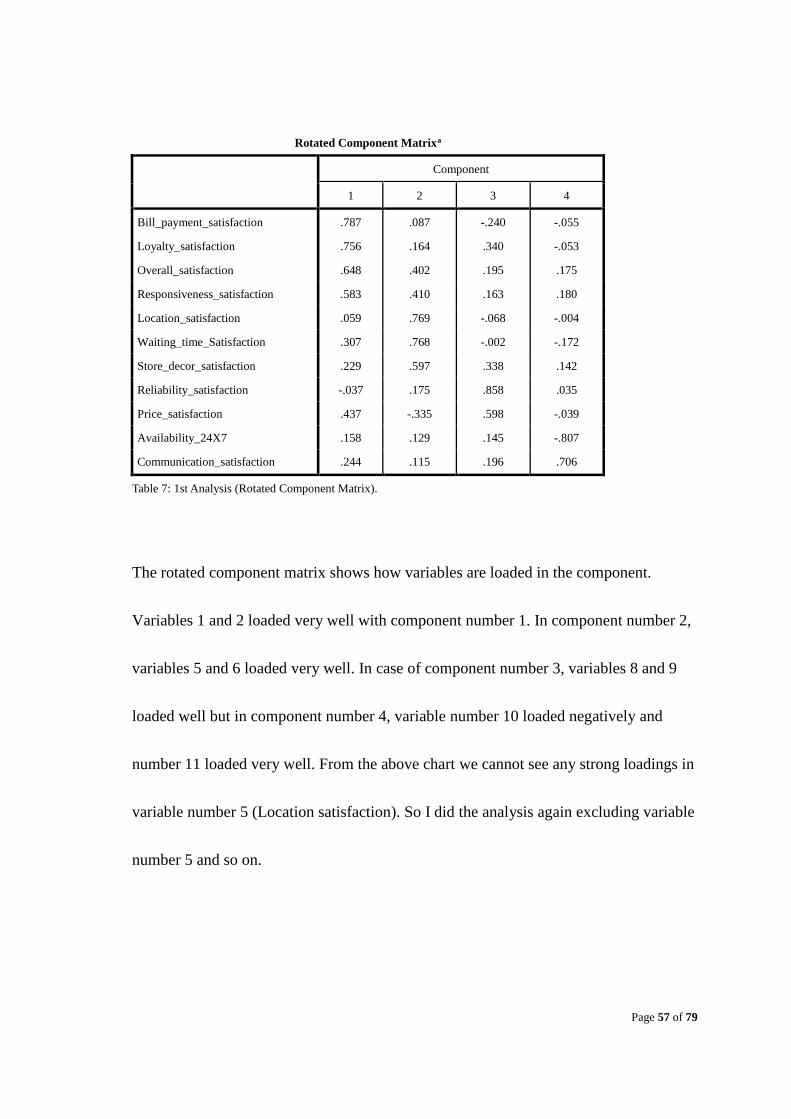
Table 7: 1st Analysis (Rotated Component Matrix).
The rotated component matrix shows how variables are loaded in the component.
Variables 1 and 2 loaded very well with component number 1. In component number 2,
variables 5 and 6 loaded very well. In case of component number 3, variables 8 and 9
loaded well but in component number 4, variable number 10 loaded negatively and
number 11 loaded very well. From the above chart we cannot see any strong loadings in
variable number 5 (Location satisfaction). So I did the analysis again excluding variable
number 5 and so on.
Page 58 of 79
Component Transformation Matrix
Component 1 2 3 4
dimension0
1 .729 .588 .340 .086
2 .164 -.637 .656 .369
3 .230 -.266 .198 -.915
4 -.624 .421 .643 -.140
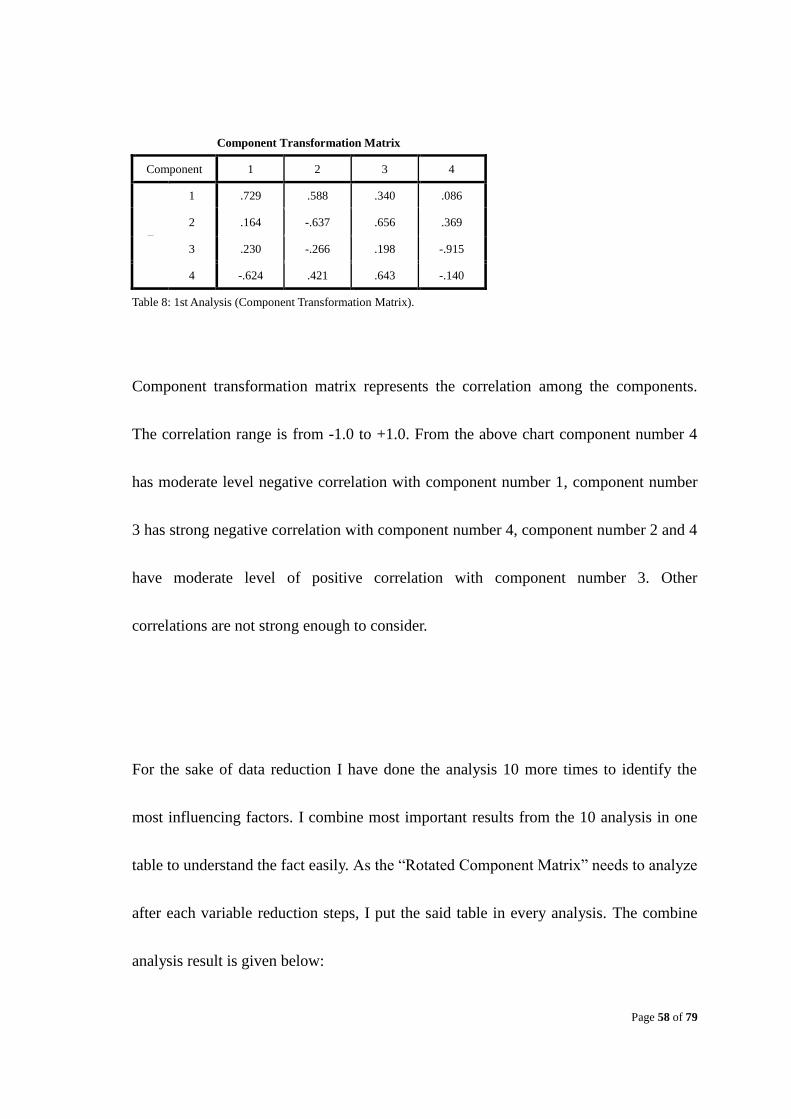
Table 8: 1st Analysis (Component Transformation Matrix).
Component transformation matrix represents the correlation among the components.
The correlation range is from -1.0 to +1.0. From the above chart component number 4
has moderate level negative correlation with component number 1, component number
3 has strong negative correlation with component number 4, component number 2 and 4
have moderate level of positive correlation with component number 3. Other
correlations are not strong enough to consider.
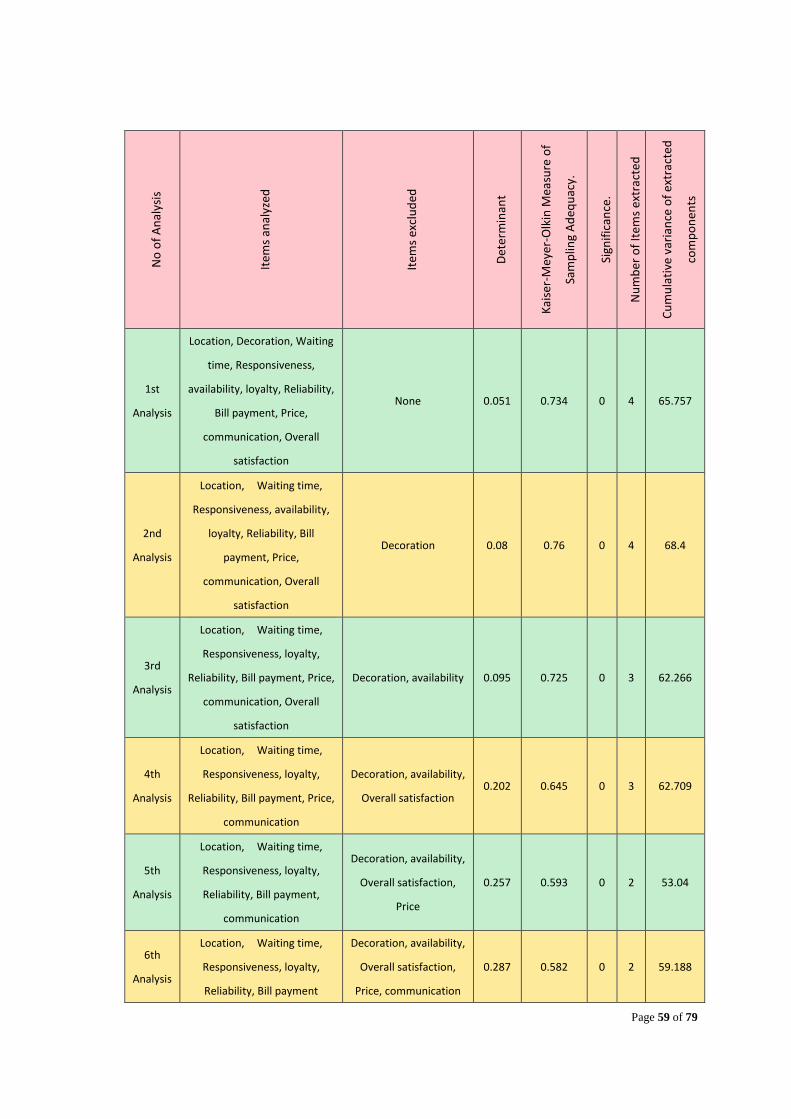
For the sake of data reduction I have done the analysis 10 more times to identify the
most influencing factors. I combine most important results from the 10 analysis in one
table to understand the fact easily. As the “Rotated Component Matrix” needs to analyze
after each variable reduction steps, I put the said table in every analysis. The combine
analysis result is given below:
Page 59 of 79
No
of
An
alys
is
Item
s an
alyz
ed
Item
s ex
clu
ded
Det
erm
inan
t
Kai
ser-
Mey
er-O
lkin
Mea
sure
of
Sam
plin
g A
deq
uac
y.
Sign
ific
ance
.
Nu
mb
er o
f It
ems
extr
acte
d
Cu
mu
lati
ve v
aria
nce
of
extr
acte
d
com
po
nen
ts
1st
Analysis
Location, Decoration, Waiting
time, Responsiveness,
availability, loyalty, Reliability,
Bill payment, Price,
communication, Overall
satisfaction
None 0.051 0.734 0 4 65.757
2nd
Analysis
Location, Waiting time,
Responsiveness, availability,
loyalty, Reliability, Bill
payment, Price,
communication, Overall
satisfaction
Decoration 0.08 0.76 0 4 68.4
3rd
Analysis
Location, Waiting time,
Responsiveness, loyalty,
Reliability, Bill payment, Price,
communication, Overall
satisfaction
Decoration, availability 0.095 0.725 0 3 62.266
4th
Analysis
Location, Waiting time,
Responsiveness, loyalty,
Reliability, Bill payment, Price,
communication
Decoration, availability,
Overall satisfaction 0.202 0.645 0 3 62.709
5th
Analysis
Location, Waiting time,
Responsiveness, loyalty,
Reliability, Bill payment,
communication
Decoration, availability,
Overall satisfaction,
Price
0.257 0.593 0 2 53.04
6th
Analysis
Location, Waiting time,
Responsiveness, loyalty,
Reliability, Bill payment
Decoration, availability,
Overall satisfaction,
Price, communication
0.287 0.582 0 2 59.188

Page 60 of 79
7th
Analysis
Location, Waiting time,
Responsiveness, loyalty, Bill
payment
Decoration, availability,
Overall satisfaction,
Price, communication,
Reliability
0.334 0.616 0 2 66.643
8th
Analysis
Waiting time,
Responsiveness, loyalty, Bill
payment
Decoration, availability,
Overall satisfaction
Price, communication,
Reliability, Location
0.446 0.667 0 1 53.446
9th
Analysis
Waiting time,
Responsiveness, loyalty, Bill
payment, Overall satisfaction
Decoration, availability,
Price, communication,
Reliability, Location
0.249 0.776 0 1 53.53
10th
Analysis
Responsiveness, loyalty,
Waiting time, Overall
satisfaction
Decoration, availability,
Price, communication,
Reliability, Location, Bill
payment
0.320 0.760 0 1 60.759
Table 9: 1st - 10th analysis (Combined result).
Table 9 shows that after 1st analysis, one of the variables have been reduced as a data
reduction process.
2nd Analysis:
In 1st analysis, Table 7, Rotated component matrix shows that Store decoration variable
didn’t load very well with any of the components. So, I decided to exclude this variable
and do the same factor analysis. In this case, determinant slightly increased but very
reasonable. Significant is very good .000. Kaiser-Meyer-Olkin measure of sampling
adequacy is also reasonable 0.734. 2nd analysis extracted 4 components and the total
variance is 68% that is better than 1st analysis(refer to Table 9: 1st -10th analysis
Page 61 of 79
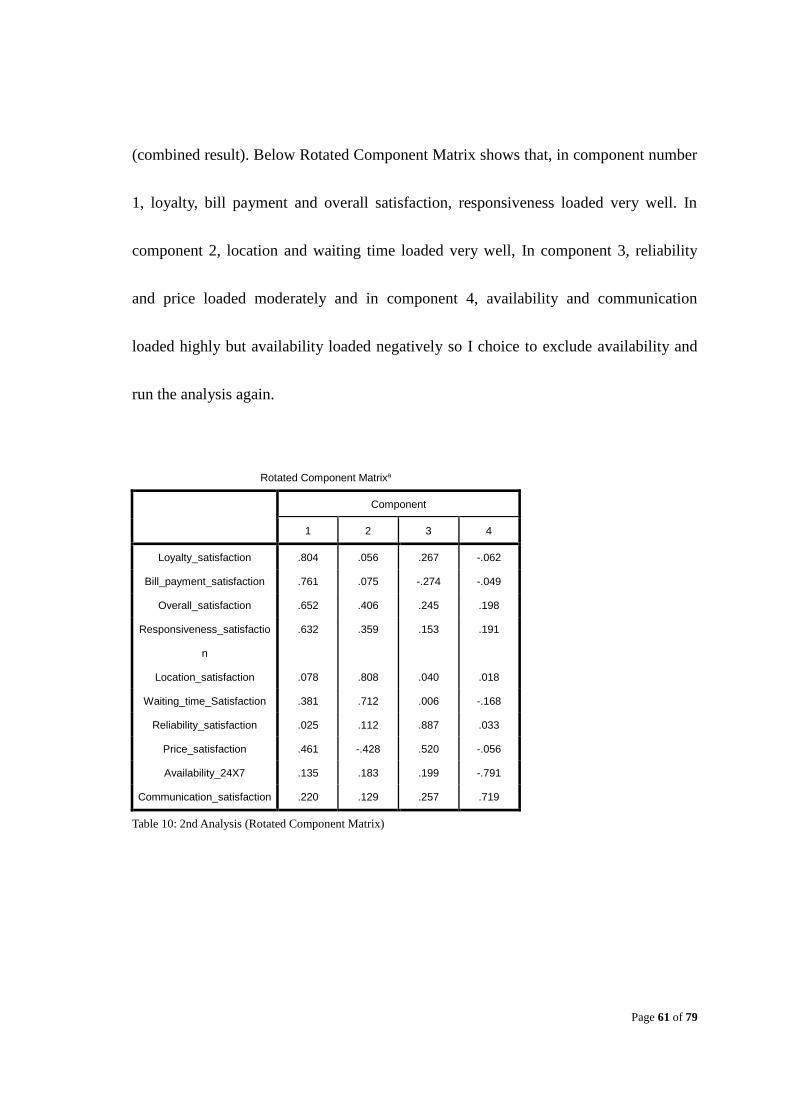
(combined result). Below Rotated Component Matrix shows that, in component number
1, loyalty, bill payment and overall satisfaction, responsiveness loaded very well. In
component 2, location and waiting time loaded very well, In component 3, reliability
and price loaded moderately and in component 4, availability and communication
loaded highly but availability loaded negatively so I choice to exclude availability and
run the analysis again.
Rotated Component Matrixa
Component
1 2 3 4
Loyalty_satisfaction .804 .056 .267 -.062
Bill_payment_satisfaction .761 .075 -.274 -.049
Overall_satisfaction .652 .406 .245 .198
Responsiveness_satisfactio
n
.632 .359 .153 .191
Location_satisfaction .078 .808 .040 .018
Waiting_time_Satisfaction .381 .712 .006 -.168
Reliability_satisfaction .025 .112 .887 .033
Price_satisfaction .461 -.428 .520 -.056
Availability_24X7 .135 .183 .199 -.791
Communication_satisfaction .220 .129 .257 .719
Table 10: 2nd Analysis (Rotated Component Matrix)
Page 62 of 79
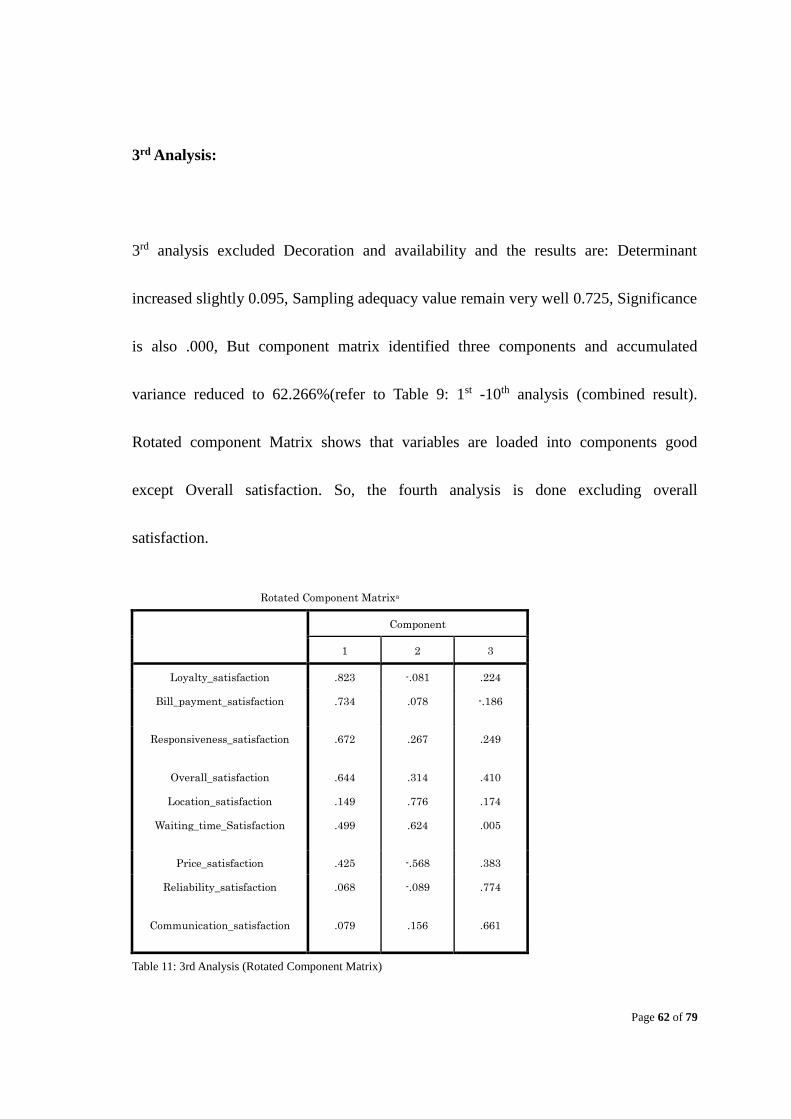
3rd Analysis:
3rd analysis excluded Decoration and availability and the results are: Determinant
increased slightly 0.095, Sampling adequacy value remain very well 0.725, Significance
is also .000, But component matrix identified three components and accumulated
variance reduced to 62.266%(refer to Table 9: 1st -10th analysis (combined result).
Rotated component Matrix shows that variables are loaded into components good
except Overall satisfaction. So, the fourth analysis is done excluding overall
satisfaction.
Rotated Component Matrixa
Component
1 2 3
Loyalty_satisfaction .823 -.081 .224
Bill_payment_satisfaction .734 .078 -.186
Responsiveness_satisfaction .672 .267 .249
Overall_satisfaction .644 .314 .410
Location_satisfaction .149 .776 .174
Waiting_time_Satisfaction .499 .624 .005
Price_satisfaction .425 -.568 .383
Reliability_satisfaction .068 -.089 .774
Communication_satisfaction .079 .156 .661
Table 11: 3rd Analysis (Rotated Component Matrix)
Page 63 of 79
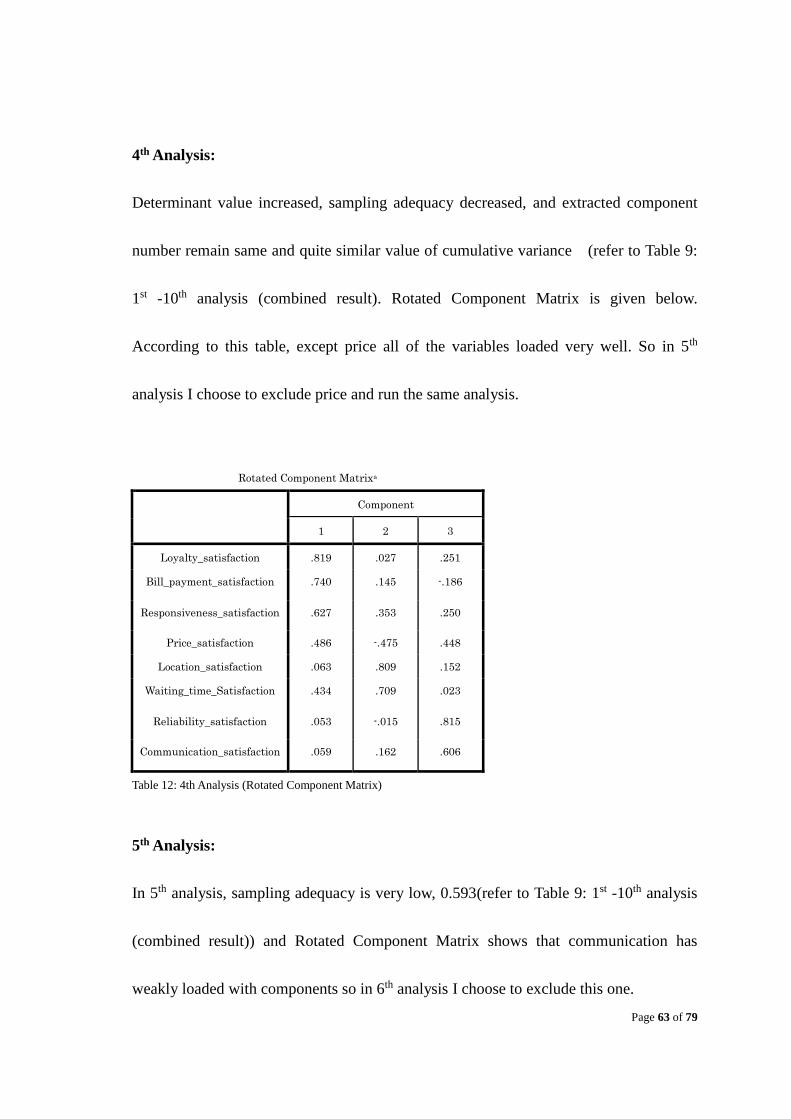
4th Analysis:
Determinant value increased, sampling adequacy decreased, and extracted component
number remain same and quite similar value of cumulative variance (refer to Table 9:
1st -10th analysis (combined result). Rotated Component Matrix is given below.
According to this table, except price all of the variables loaded very well. So in 5th
analysis I choose to exclude price and run the same analysis.
Rotated Component Matrixa
Component
1 2 3
Loyalty_satisfaction .819 .027 .251
Bill_payment_satisfaction .740 .145 -.186
Responsiveness_satisfaction .627 .353 .250
Price_satisfaction .486 -.475 .448
Location_satisfaction .063 .809 .152
Waiting_time_Satisfaction .434 .709 .023
Reliability_satisfaction .053 -.015 .815
Communication_satisfaction .059 .162 .606
Table 12: 4th Analysis (Rotated Component Matrix)
5th Analysis:
In 5th analysis, sampling adequacy is very low, 0.593(refer to Table 9: 1st -10th analysis
(combined result)) and Rotated Component Matrix shows that communication has
weakly loaded with components so in 6th analysis I choose to exclude this one.

Page 64 of 79
Rotated Component Matrixa
Component
1 2
Waiting_time_Satisfaction .740 .195
Bill_payment_satisfaction .704 .018
Location_satisfaction .689 -.201
Reliability_satisfaction -.137 .715
Responsiveness_satisfaction .502 .611
Loyalty_satisfaction .492 .608
Communication_satisfaction -.032 .589
Table 13: 5th Analysis (Rotated Component Matrix)
6th Analysis:
6th analysis also shows result very close to 5th analysis. Sampling adequacy rate is very
low near 0.5(refer to Table 9: 1st -10th analysis (combined result)). Two components are
extracted in this analysis and except reliability, every items loaded very well with
components.
Rotated Component Matrixa
Component
1 2
Loyalty_satisfaction .760 .290
Responsiveness_satisfaction .725 .330
Reliability_satisfaction .694 -.324
Location_satisfaction -.088 .756
Bill_payment_satisfaction .169 .691
Waiting_time_Satisfaction .408 .645
Table 14: 6th Analysis (Rotated Component Matrix)

Page 65 of 79
7th analysis:
Determinant still increased, sampling adequacy increased a bit too. Noticeably,
cumulative variance became 66.643% (refer to Table 9: 1st -10th analysis (combined
result)). Rotated Component matrix shows that Loyalty and responsiveness loaded
strongly with component 1, Location and waiting time loaded with component 2 but
location loaded negatively with component 1. So, for the better result, 8thanalysis will
exclude location.
Rotated Component Matrixa
Component
1 2
Loyalty_satisfaction .844 .066
Responsiveness_satisfaction .829 .111
Location_satisfaction -.076 .940
Waiting_time_Satisfaction .522 .569
Bill_payment_satisfaction .426 .500
Table 15: 7th Analysis (Rotated Component Matrix)
8th Analysis:
Determinant is very high, Variance is also low, sampling adequacy is also low, and so, it
cannot be the better choice (refer to Table 9: 1st -10th analysis (combined result)). I
choose to include overall satisfaction to get expected value.

Page 66 of 79
Component Matrixa
Component
1
Responsiveness_satisfaction .792
Loyalty_satisfaction .787
Waiting_time_Satisfaction .719
Bill_payment_satisfaction .612
Table 16: 8th Analysis (Rotated Component Matrix)
9th Analysis:
Significant improved has been observed in this analysis. Determinant became 0.249,
sampling adequacy value is also very good 0.776, extracted one component and
cumulative variance is 53.53% (refer to Table 9: 1st -10th analysis (combined result)).
Component Matrixa
Component
1
Overall_satisfaction .807
Responsiveness_satisfaction .791
Loyalty_satisfaction .778
Waiting_time_Satisfaction .669
Bill_payment_satisfaction .587
Table 17: 9th Analysis (Rotated Component Matrix)
Page 67 of 79
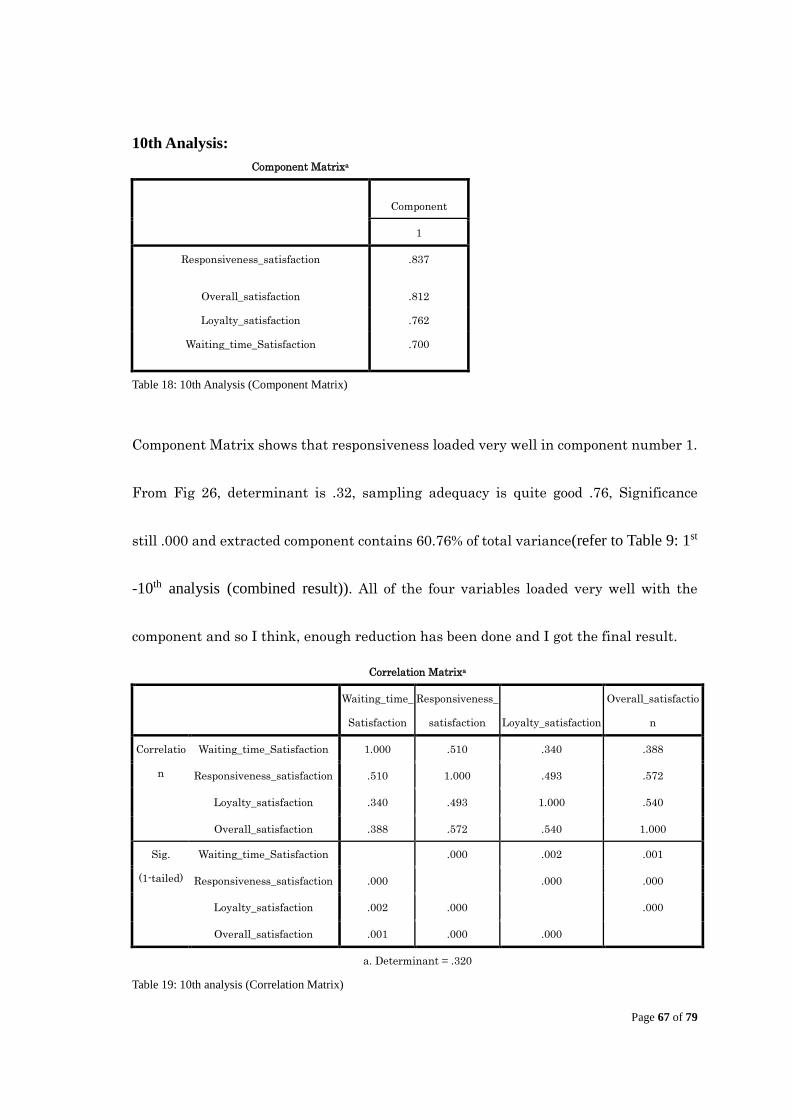
10th Analysis:
Component Matrixa
Component
1
Responsiveness_satisfaction .837
Overall_satisfaction .812
Loyalty_satisfaction .762
Waiting_time_Satisfaction .700
Table 18: 10th Analysis (Component Matrix)
Component Matrix shows that responsiveness loaded very well in component number 1.
From Fig 26, determinant is .32, sampling adequacy is quite good .76, Significance
still .000 and extracted component contains 60.76% of total variance(refer to Table 9: 1st
-10th analysis (combined result)). All of the four variables loaded very well with the
component and so I think, enough reduction has been done and I got the final result.
Correlation Matrixa
Waiting_time_
Satisfaction
Responsiveness_
satisfaction Loyalty_satisfaction
Overall_satisfactio
n
Correlatio
n
Waiting_time_Satisfaction 1.000 .510 .340 .388
Responsiveness_satisfaction .510 1.000 .493 .572
Loyalty_satisfaction .340 .493 1.000 .540
Overall_satisfaction .388 .572 .540 1.000
Sig.
(1-tailed)
Waiting_time_Satisfaction .000 .002 .001
Responsiveness_satisfaction .000 .000 .000
Loyalty_satisfaction .002 .000 .000
Overall_satisfaction .001 .000 .000
a. Determinant = .320
Table 19: 10th analysis (Correlation Matrix)

Page 68 of 79
One of the reasons to include Overall satisfaction is to measure correlation between
variables and overall satisfaction. Correlation matrix shows that responsiveness and
loyalty correlates with overall satisfaction.

Page 69 of 79
5. Limitations and suggestions for further research:
Although this study founds interesting and meaningful findings, there are some
limitations that should be discussed.
This research consider only convenience store sector among retail industry. Further
research can be done including overall retailing industry.
This study focuses on secondary data source to identified CRM practices and
attempted to collect as many relevant CRM activities as possible. As new CRM
practices evolving over time, the factors this study used will need to improve or
update.
Time period for this research was very short. An extensive further research should
be done to focus more CRM issues and including more sectors.

Page 70 of 79
6. Conclusion
From the data analysis I found the following outcomes:
Sampling adequacy0.76 indicates that the dataset are adequate to analysis.
Significance value of this test is .000 which shows that the test is perfectly
significant.
Correlation matrix shows that Employee responsiveness and store loyalty have
positive correlation with customer satisfaction.
Later on, “Total variance Explained” chart identified one underlying factors
those contain 60.76% of total variances.
After analyzing ‘Rotated Component Matrix’, we can see that variables such as
Loyalty satisfaction, and Responsiveness satisfaction loaded very well. Waiting
time and bill payment facility also loaded considerable.
So, the component number 1 carries most variables and has strong influence on
customer satisfaction. From the above analysis, we can say that store loyalty and
employee responsiveness have most influence on customer satisfaction.
These findings suggest that, convenience stores as well as other retailing
organizations can concentrate more on these services to attract their customers
and other retail stores such as supermarkets and departmental stores can

Page 71 of 79
implement these services to improve their CRM practices.
This study has some important managerial implications. Such as:
First of all this study identifies different customer relationship management
activities. Therefore superstores and departmental stores can use this report to
identify key activities and implement it to be successful.
This study found that there is considerable room for CRM issues to be improved.
Managers should evaluate the employee as well as overall store performance
effectively.
From the literature we have seen that improved CRM has positive effect to
improve profitability and sustainability in the competitive market place. So,
managers can emphasize on loyalty issue to increase customer retention rate and
increase word-of-mouth activity.

Page 72 of 79
7. Bibliography
Baran, G. S. (2008). Principles of Customer Relationship Management. USA:
South-Western Cengage Learning.
Bryan, B. (2002). Essentials of CRM: A Guide to Customer Relationship Management.
Wiley Publications.
Center, I. K. (n.d.). IBM Knowledge Center. Retrieved 05 09, 2016, from IBM Knowledge
Center:
http://www.ibm.com/support/knowledgecenter/SSLVMB_20.0.0/com.ibm.spss.statistics.c
s/fac_telco_kmo_01.htm
Chen, I. J., & Popvich, K. (2003). Understanding customer relationship management
(CRM): People, process and technology. Business Process Management Journal9.5 ,
672-688.
Chu, S. (2007). Improving Customer Relationship Management through Discovering of
Maintenance Patterns. Hong Kong Polytechnic University , 79.
Co.Ltd, S.-E. J. (2016, 04 30). Number of stores in each administrative reagion.
Retrieved from Sevel-Eleven Japan Co.Ltd:
http://www.sej.co.jp/company/en/n_stores.html
Cynthia, W., & S, S. D. ( 2009). Effect of service provider's communication style on
customer satisfaction in professional services setting: the moderating role of criticality
and service nature. The Journal of Services Marketing23.2. , 104-114.
Encyclopedia, W. T. (2016). Pearson product-moment correlation coefficient. Retrieved
from Wikipedia: The Free Encyclopedia:
https://en.wikipedia.org/wiki/Pearson_product-moment_correlation_coefficient
Gerstner, D. (2002). The key to better performance: Customer relationship management.
Northwestern Financial Review 187.14 , 20-23.
Graham, J. (2010). Critical Thinking in Consumer Behavior. New Jersey: Pearson
Education, Inc.,.
Homburg, X. L. (Apr. 2007). Neglected Outcomes of Customers Satisfacton. Journal of
Marketing, Vol. 71, No. 2 , 133-149.
J, A., London, M., Crom, S., & Jones, D. (1996). Relationships between employee
attitudes, customer satisfaction and departmental performance. The Journal of
Management Development , 62-75.
J. Joseph Cronin, J. &. (1992). Measuring Service Quality: A Rexamination and
extension. Journal of Marketing; 56,3. , 55.
Jae-On Kim, C. W. (2014). Factor Analysis: Statistical Methods and Practical Issues.
California: SAGE publications, Inc.

Page 73 of 79
Jae-On Kim, C. W. (2013). Introduction to Factor Analysis: What it is and how to do it.
California: SAGE publications, INC.
Japan Ministry of Economy, T. a. (2015). Japan Ministry of Economics, Trade and
Industry. Retrieved 05 01, 2016, from Japan Ministry of Economics, Trade and Industry:
http://www.meti.go.jp/english/statistics/tyo/syoudou_kakuho/index.html
Jayasankaraprasad, C., & Kumar, P. V. (December, 2012). Antecedents and
Consequences of Customr Satisfaction in Food & Grocery Retailing: An Empirical
Analysis. Decision, Vol. 39, , 3.
John R. Hauser, D. I. (1994). Customer Satisfaction Incentives. Marketing Science, Vol.
13, No. 4 , 327-350.
Kirkwood, C. W. (1998). System Dynamics Methods: A Quick Introduction. Ventana
Systems, Inc.
Koki, T. (Dec. 2001). An Inside Look at Convenience Stores. Nipponia.
Kumar, G. R. (2008). Interaction Orientation and Firm Performance. Journal of
Marketing, Vol. 72, No. 1 , 27-45.
Kumar, V., & Reinartz, W. (2012). Customer Relationship Management: Concept,
Strategy and Tools. Springer.
Lawson. (2014, 02). Corporate Profile. Retrieved from Lawson:
http://lawson.jp/en/about/profile/
Liao, H., & Chuang, A. (2004). A Multilevel Investigation of Factors Influencing
Employee Service Performance and Customer Outcomes. The Academy of Management
Journal, Vol. 47, No. 1 , 41-58.
Liao, H., & Chuang, A. (2004). A Multilevel investigation of Factors Influencing
Employee service Perfromance and customer outcomes. Academy of Management
Journal , Vol. 47. No. 1, 41-58.
Mart, F. (2016, 02 29). Company Profile. Retrieved from Family Mart:
http://www.family.co.jp/english/company/
McLeod, S. (2008). Likert Scale. Retrieved 05 16, 2016, from
www.simplypsychology.org/likert-scale.html
Mo, Q., & Wang, J. (2015). MIrExpress: A Database for Gene Coexpression Correlation
in Immune Cells Based on Mutual Information and Pearson Correlation. Journal of
Immunology Research .
R. Guati, G. (2000). Get the Right Mix of Bricks & Clicks. Harvard Business Review ,
214.
Review, N. A. (2014, 07 23). Japan's top convenience stores dominate like never before.
Retrieved from Nikkei Asian Review:

Page 74 of 79
http://asia.nikkei.com/Business/Consumers/Japan-s-top-convenience-stores-dominate-li
ke-never-before
Robinson, R. C. (1978). Measurement of Consumer Satisfaction: An Innovation. Journal
of Marketing, Vol. 42, No. 3 , 8-58.
Russell, J. (Jan-Mar 2000). Convenience in Store: Japan's quick-Stop Retailers. Japan
Quarterly , 83.
Sidanius, J. (2007, 11 24). Annotated SPSS Output. Retrieved from Institute for Digital
Research and Education: http://www.ats.ucla.edu/stat/spss/output/factor1.htm
Sivada, E. &.-P. (2000). An examination of the relationship between service quality,
customer satisfaction, and store loyalty. International Journal of Retail & Distribution
Management , 28(2), 73-82.
SPSS Statistics support team, I. (2011, 11 15). Kaiser-Meyer-Olkin measure for identity
correlation matrix. Retrieved 05 09, 2016, from IBM:
http://www-01.ibm.com/support/docview.wss?uid=swg21479963
Taylor, S. A., & Baker, T. L. (1994). An Assessment of the Relationship Between Service
Quality and Customer Satisfaction in the Formation of Consumers' Purchase Intentions.
Journal of Retailing, Volume 2 , 163-178.
Tim Coltman, T. M. (2011). Customer relationship management and firm performance.
Journal of Information Technology , 205-2019.
Times, T. J. (2014, 06 25). Opinion. Retrieved 05 20, 2016, from The Japan Times:
http://www.japantimes.co.jp/opinion/2014/06/25/editorials/winds-change-retail-industry/
#.Vz575n197cu
Werner Reinartz, M. K. ( Aug., 2004). The Customer Relationship Management Process:
Its Measurement and Impact onPerformance. Journal of Marketing Research , Vol. 41,
No. 3, pp. 293-305.
Wikipedia. (n.d.). Wikipedia The Free Encyclopedia. Retrieved 05 01, 2016, from
https://en.wikipedia.org/wiki/Convenience_store
Yuanqiong He, W. L. (Septermber, 2011). Service climate, employee commitment and
customer satisfaction. International Journal of Contemporary Hospitality Management,
Vol. 23, No. 5 , 592-6119.
Zeitaml, L. &. (1996). The Behavioral Consequences Service Quality. The journal of
Marketing .
Zineldin, M. (2006). The royalty of loyalty: CRM, quality. Journal of Consumer
Marketing , 430-437.
Zubey, W. W. (2007). Customer Relationship Management. Massachusetts: Thomson
Course Technology.

Page 75 of 79
8. Appendix
1. Survey questionnaire:

Page 76 of 79

Page 77 of 79
2. Survey Responses:
Gen
der
Ag
e
Lo
cation
satisfaction
Sto
re deco
ration
Waitin
g tim
e
Staff
respo
nsiv
eness
24 X
7 av
ailability
Pro
du
ct reliability
Sto
re loyalty
Bill p
aym
ent
Price
Co
mm
un
ication
Ov
erall satisfaction
33-40 4 4 4 4 5 4 5 5
4
Female 26 - 32 5 5 5 4 5 5 3 4 2 5 5
Male 26 - 32 4 5 4 4 5 4 4 5 3 3 4
Female 18 - 25 5 3 4 5 5 4 3 5 3 2 4
Male 18 - 25 5 3 3 3 5 5 2 1 1 1 3
Male 26 - 32 5 3 5 5 5 3 3 5 1 4 5
Female 18 - 25 4 4 3 5 3 5 3 5 2 2 4
Male 18 - 25 5 4 4 4 5 5 5 5 1 4 5
Male 18 - 25 5 5 5 4 5 3 2 4 1 2 4
Male 26 - 32 4 3 3 4 5 4 3 4 4 4 4
Female 26 - 32 5 4 5 5 5 3 5 5 3 2 5
Female 18 - 25 3 2 3 1 5 2 2 5 3 1 2
Male 18 - 25 5 5 5 5 4 4 5 5 2 4 5
Male 18 - 25 4 4 4 4 4 4 3 5 3 3 4
Male 33 - 40 3 4 3 4 4 3 3 3 4 2 3
Male 26 - 32 4 4 3 4 4 2 5 5 2 2 5
Male 26 - 32 4 4 3 3 5 3 3 5 2 3 4
Female 26 - 32 4 3 5 5 3 1 3 4 1 3 4
Female 18 - 25 4 3 2 3 5 4 4 5 2 2 4
Male 26 - 32 4 4 3 4 4 3 3 4 1 1 4
Female 26 - 32 5 4 4 2 4 4 3 5 3 2 4
Male 26 - 32 5 4 3 2 4 2 2 4 1 4 3
Female 26 - 32 4 4 4 4 3 4 3 4 2 3 4
Male 18 - 25 5 5 5 5 3 3 3 5 1 3 4
Female 26 - 32 4 4 4 5 5 4 3 5 3 3 4
Male 18 - 25 4 4 3 3 4 3 3 4 2 3 4
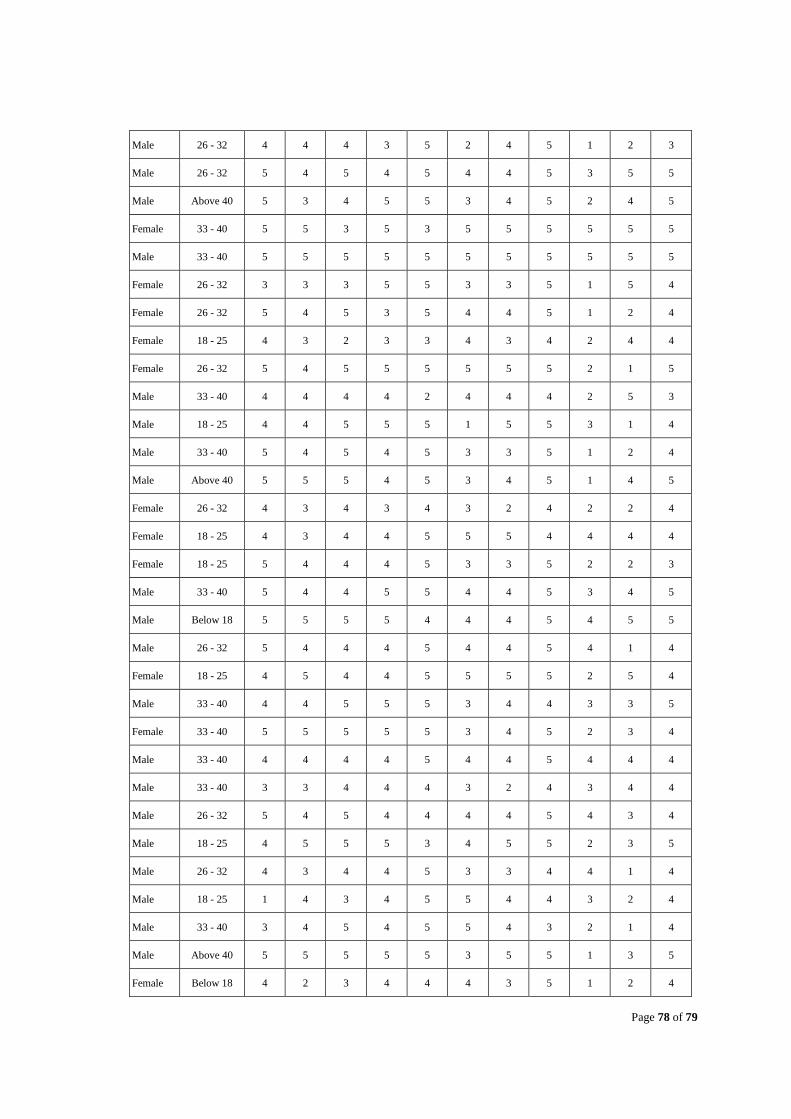
Page 78 of 79
Male 26 - 32 4 4 4 3 5 2 4 5 1 2 3
Male 26 - 32 5 4 5 4 5 4 4 5 3 5 5
Male Above 40 5 3 4 5 5 3 4 5 2 4 5
Female 33 - 40 5 5 3 5 3 5 5 5 5 5 5
Male 33 - 40 5 5 5 5 5 5 5 5 5 5 5
Female 26 - 32 3 3 3 5 5 3 3 5 1 5 4
Female 26 - 32 5 4 5 3 5 4 4 5 1 2 4
Female 18 - 25 4 3 2 3 3 4 3 4 2 4 4
Female 26 - 32 5 4 5 5 5 5 5 5 2 1 5
Male 33 - 40 4 4 4 4 2 4 4 4 2 5 3
Male 18 - 25 4 4 5 5 5 1 5 5 3 1 4
Male 33 - 40 5 4 5 4 5 3 3 5 1 2 4
Male Above 40 5 5 5 4 5 3 4 5 1 4 5
Female 26 - 32 4 3 4 3 4 3 2 4 2 2 4
Female 18 - 25 4 3 4 4 5 5 5 4 4 4 4
Female 18 - 25 5 4 4 4 5 3 3 5 2 2 3
Male 33 - 40 5 4 4 5 5 4 4 5 3 4 5
Male Below 18 5 5 5 5 4 4 4 5 4 5 5
Male 26 - 32 5 4 4 4 5 4 4 5 4 1 4
Female 18 - 25 4 5 4 4 5 5 5 5 2 5 4
Male 33 - 40 4 4 5 5 5 3 4 4 3 3 5
Female 33 - 40 5 5 5 5 5 3 4 5 2 3 4
Male 33 - 40 4 4 4 4 5 4 4 5 4 4 4
Male 33 - 40 3 3 4 4 4 3 2 4 3 4 4
Male 26 - 32 5 4 5 4 4 4 4 5 4 3 4
Male 18 - 25 4 5 5 5 3 4 5 5 2 3 5
Male 26 - 32 4 3 4 4 5 3 3 4 4 1 4
Male 18 - 25 1 4 3 4 5 5 4 4 3 2 4
Male 33 - 40 3 4 5 4 5 5 4 3 2 1 4
Male Above 40 5 5 5 5 5 3 5 5 1 3 5
Female Below 18 4 2 3 4 4 4 3 5 1 2 4
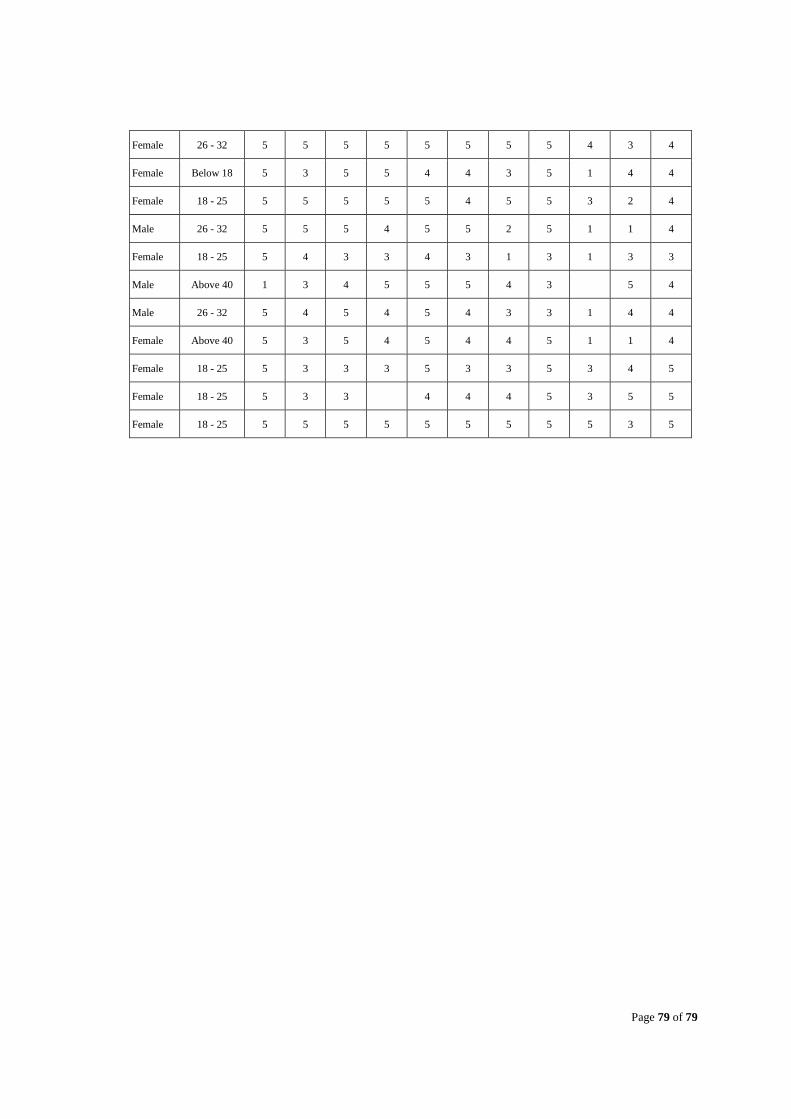
Page 79 of 79
Female 26 - 32 5 5 5 5 5 5 5 5 4 3 4
Female Below 18 5 3 5 5 4 4 3 5 1 4 4
Female 18 - 25 5 5 5 5 5 4 5 5 3 2 4
Male 26 - 32 5 5 5 4 5 5 2 5 1 1 4
Female 18 - 25 5 4 3 3 4 3 1 3 1 3 3
Male Above 40 1 3 4 5 5 5 4 3
5 4
Male 26 - 32 5 4 5 4 5 4 3 3 1 4 4
Female Above 40 5 3 5 4 5 4 4 5 1 1 4
Female 18 - 25 5 3 3 3 5 3 3 5 3 4 5
Female 18 - 25 5 3 3
4 4 4 5 3 5 5
Female 18 - 25 5 5 5 5 5 5 5 5 5 3 5
Top Related