


Languages
Pages
Legal


Paul PangPaul PangManaging DirectorManaging Director
CMAI ChinaCMAI China
Global Petrochemical Industry Outlook
Global Petrochemical Industry Outlook
2011 Presentation to CSPC2011 Presentation to CSPCSingaporeSingapore ShanghaiShanghai HoustonHouston New YorkNew York LondonLondon DüsseldorfDüsseldorf DubaiDubai
May 17, 2011May 17, 2011Tianjin, ChinaTianjin, China
BangkokBangkok
Presentation OutlinePresentation OutlinePresentation OutlinePresentation Outline
EconomyEconomy
EnergyEnergy
2011 Presentation to CSPC2011 Presentation to CSPC
PetrochemicalPetrochemical

5959
6161
6363Trillions of 2007 Trillions of 2007 U.S. DollarsU.S. Dollars
Global GDP Through 2016Global GDP Through 2016Global GDP Through 2016Global GDP Through 2016
2011 Presentation to CSPC2011 Presentation to CSPC
5353
5555
5757
0606 0707 0808 0909 1010 1111 1212
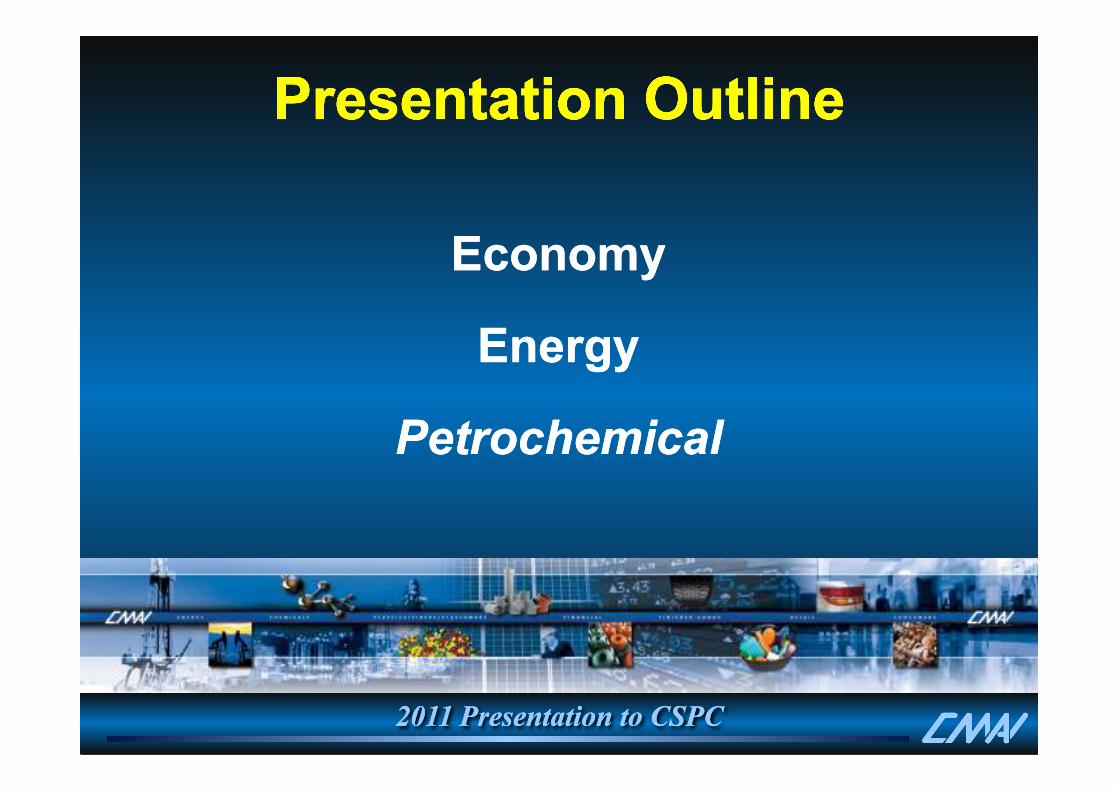
Where Will Growth Come From?Where Will Growth Come From?Where Will Growth Come From?Where Will Growth Come From?
U.S. & U.S. & CanadaCanada
28%28%Euro ZoneEuro Zone
27%27%
Contribution Contribution to Growth to Growth Through 2016Through 2016
25%25% 14%14%
$59$59
2011 Presentation to CSPC2011 Presentation to CSPC
JapanJapan7%7%
Rest of Rest of WorldWorld38%38%
3%3%
58%58%
$59$59TrillionTrillion
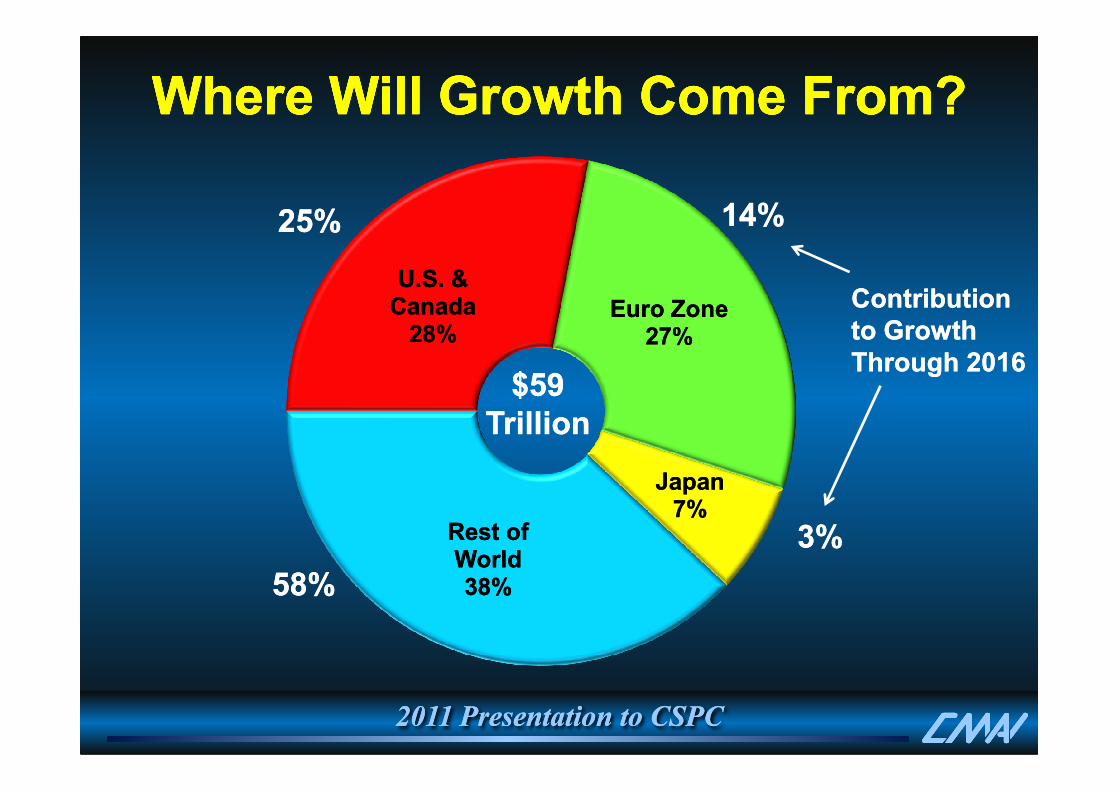
Where Will Growth Come From?Where Will Growth Come From?Where Will Growth Come From?Where Will Growth Come From?
U.S. & U.S. & CanadaCanada
26%26%
Euro ZoneEuro Zone25%25%
$73$73
2011 Presentation to CSPC2011 Presentation to CSPC
JapanJapan6%6%
Rest of Rest of WorldWorld43%43%
$73$73TrillionTrillion

8
12
16
4
6
8
Economic Outlook
Trillion U.S. Dollar (2007 Constant )Trillion U.S. Dollar (2007 Constant ) Growth Rate, PercentGrowth Rate, Percent
2011 Presentation to CSPC2011 Presentation to CSPC
-4
0
4
0
2
2006 2007 2008 2009 2010 2011 2012 2013 2014 2015
China GDP Wld Avg Growth Rate China Growth Rate

EnergyEnergy
2011 Presentation to CSPC2011 Presentation to CSPC

Crude Oil Prices Are Expected to Remain High Driven Crude Oil Prices Are Expected to Remain High Driven By Growing Demand and Supply Concerns . . .By Growing Demand and Supply Concerns . . .
Crude Oil Prices Are Expected to Remain High Driven Crude Oil Prices Are Expected to Remain High Driven By Growing Demand and Supply Concerns . . .By Growing Demand and Supply Concerns . . .
Dollars per Barrel
60
80
100
120Brent Current
Brent Constant 2011$
WTI Current
WTI Constant 2011$
2011 Presentation to CSPC2011 Presentation to CSPC8
0
20
40
60
2000 2005 2010 2015

Global Industry OverviewGlobal Industry Overview
2011 Presentation to CSPC2011 Presentation to CSPC
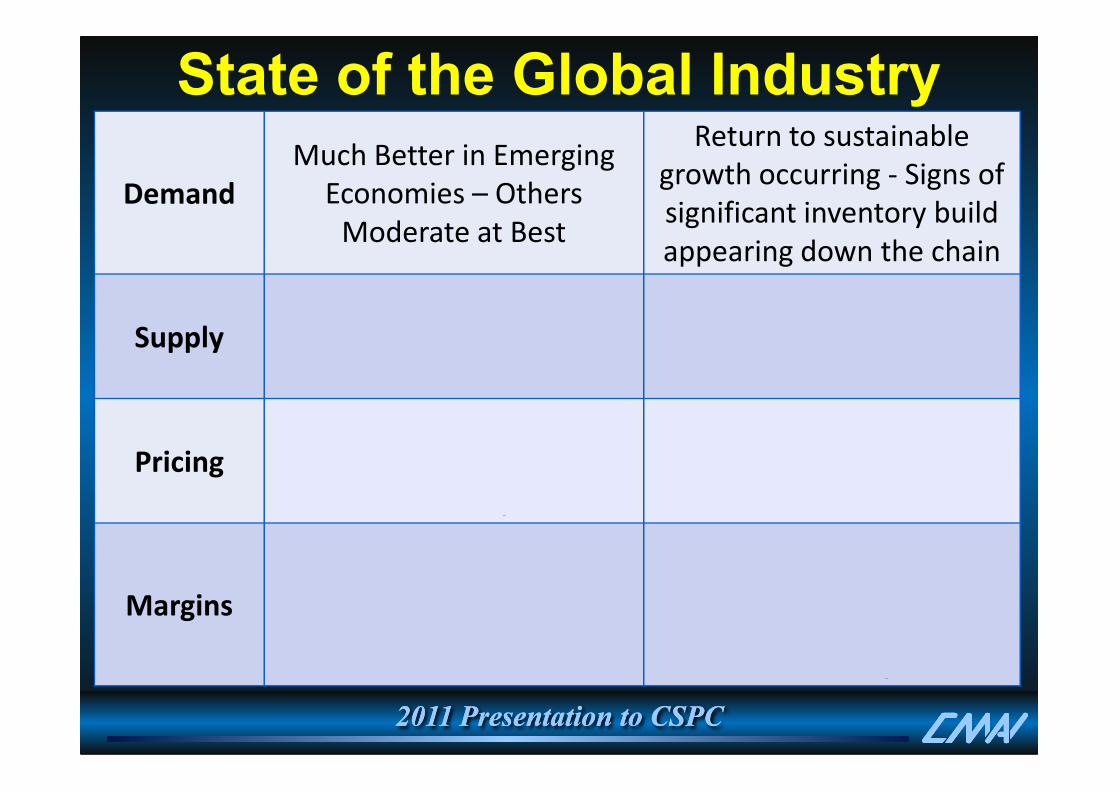
State of the Global Industry
Demand
Much Better in Emerging
Economies – Others
Moderate at Best
Return to sustainable
growth occurring - Signs of
significant inventory build
appearing down the chain
Supply
Less New Capacity on
Horizon – High Cost
Capacity out of market.
Market is balanced to tight
due to dislocations and
“cost-induced” discipline
2011 Presentation to CSPC2011 Presentation to CSPC
Pricing
Reaching record levels on
all fronts – severe cost push
inflates floor prices
Consolidations have helped
producers; higher prices
will impact growth
Margins
“Super Cycle” for integrated
gas position; bare
minimums for market
clearing producers
Results are more region
and value chain specific.
Benefits of integration
have become very obvious
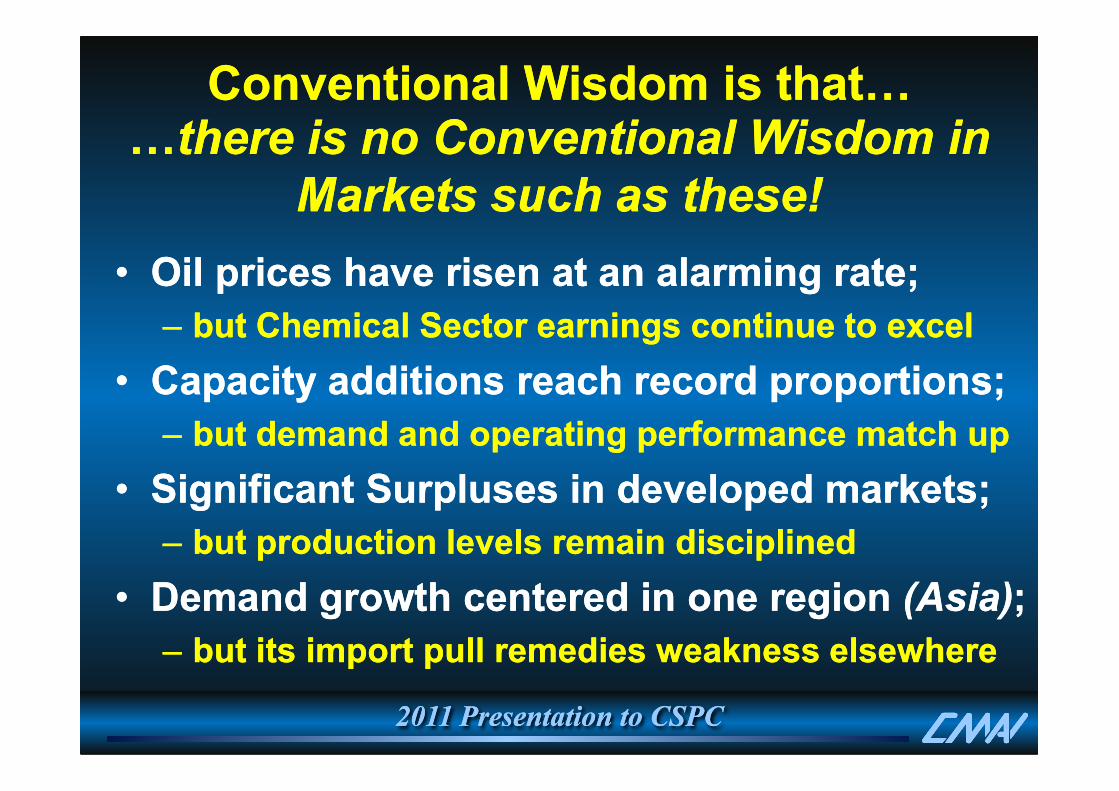
??there is no Conventional Wisdom in there is no Conventional Wisdom in
Markets such as these!Markets such as these!
•• Oil prices have risen at an alarming rate;Oil prices have risen at an alarming rate;
–– but Chemical Sector earnings continue to excelbut Chemical Sector earnings continue to excel
•• Capacity additions reach record proportions;Capacity additions reach record proportions;
Conventional Wisdom is that?Conventional Wisdom is that?
2011 Presentation to CSPC2011 Presentation to CSPC
•• Capacity additions reach record proportions;Capacity additions reach record proportions;
–– but demand and operating performance match upbut demand and operating performance match up
•• Significant Surpluses in developed markets;Significant Surpluses in developed markets;
–– but production levels remain disciplinedbut production levels remain disciplined
•• Demand growth centered in one region Demand growth centered in one region (Asia)(Asia);;
–– but its import pull remedies weakness elsewherebut its import pull remedies weakness elsewhere
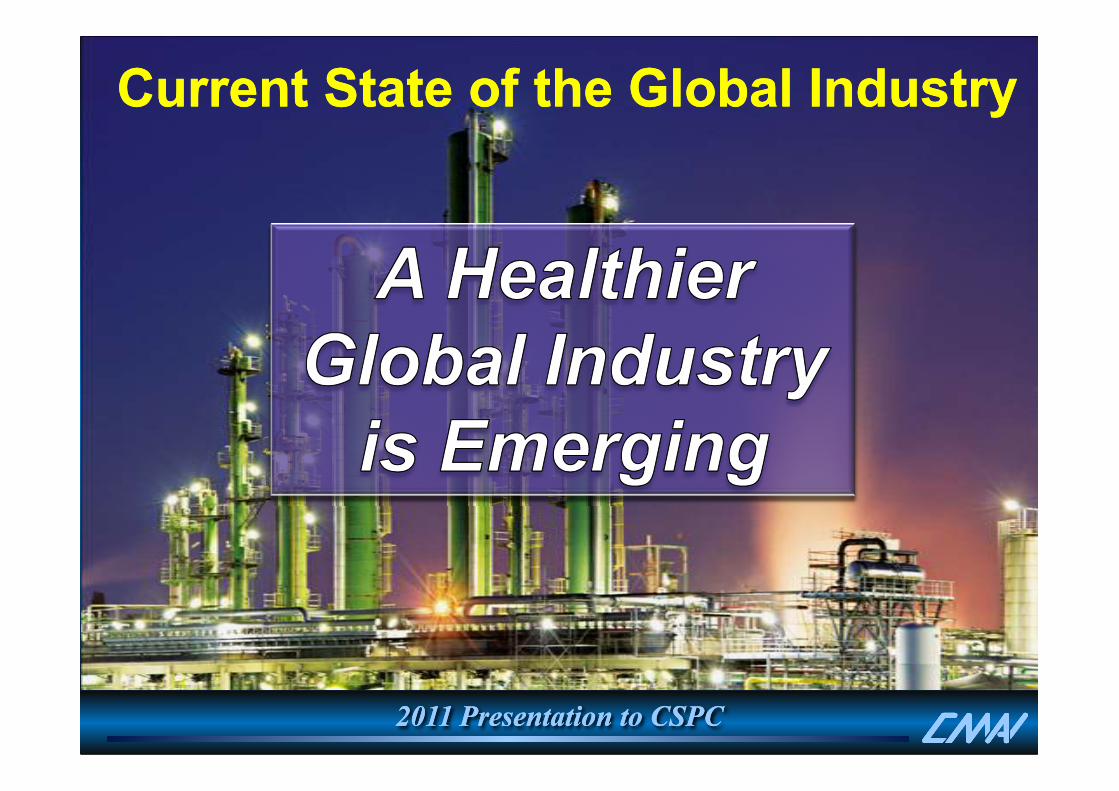
Current State of the Global IndustryCurrent State of the Global Industry
2011 Presentation to CSPC2011 Presentation to CSPC
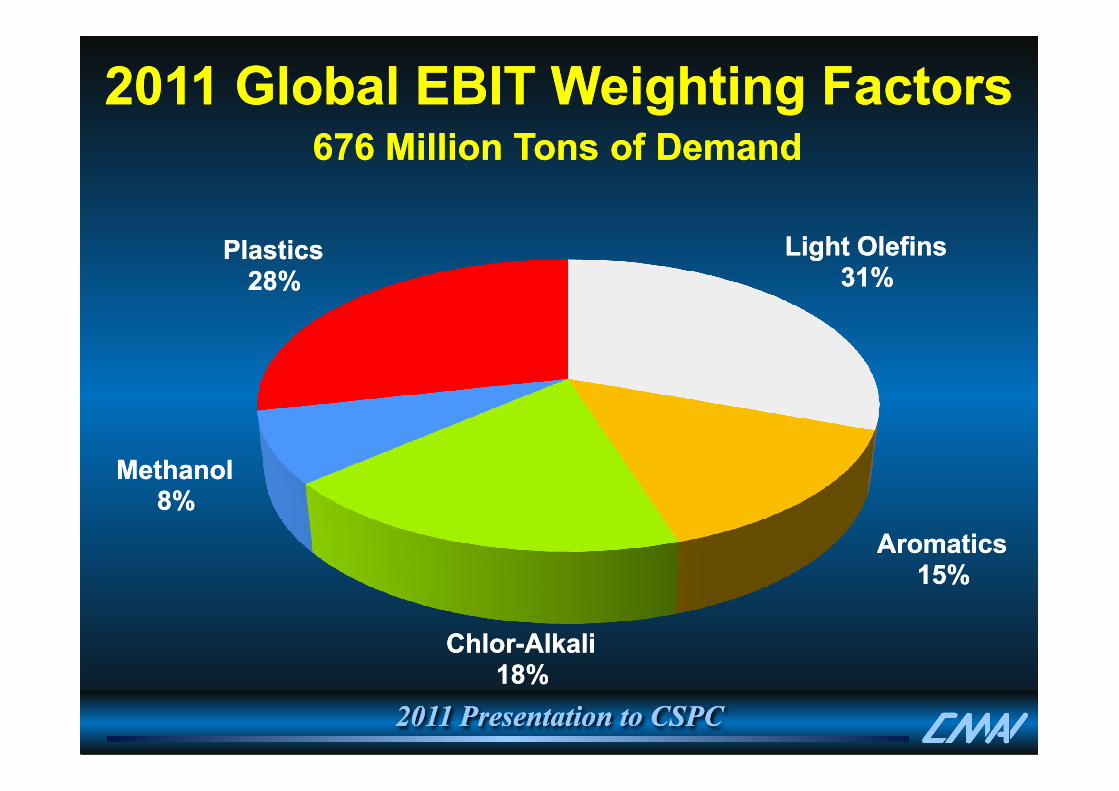
Light OlefinsLight Olefins31%31%
PlasticsPlastics28%28%
2011 Global EBIT Weighting Factors2011 Global EBIT Weighting Factors676 Million Tons of Demand676 Million Tons of Demand
2011 Presentation to CSPC2011 Presentation to CSPC
AromaticsAromatics15%15%
ChlorChlor--AlkaliAlkali18%18%
MethanolMethanol8%8%
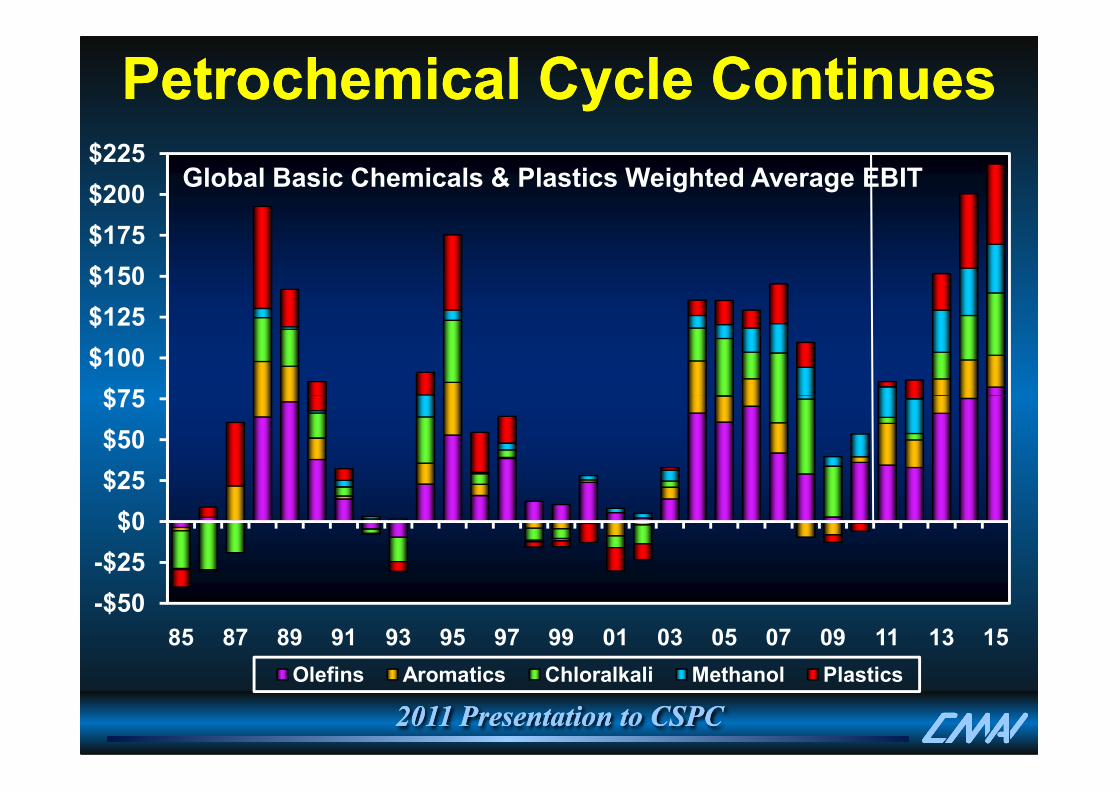
$75
$100
$125
$150
$175
$200
$225Global Basic Chemicals & Plastics Weighted Average EBIT
Petrochemical Cycle ContinuesPetrochemical Cycle Continues
2011 Presentation to CSPC2011 Presentation to CSPC
-$50
-$25
$0
$25
$50
$75
85 87 89 91 93 95 97 99 01 03 05 07 09 11 13 15
Olefins Aromatics Chloralkali Methanol Plastics

30
40
50
60
Basic Chemicals & PlasticsGlobal Demand Recovery and Growth are Impressive
•• Sharp decline Sharp decline followed by a followed by a sharp recovery in sharp recovery in the Developing the Developing World World (BRICs)(BRICs)
•• New spending New spending supports growth:supports growth:
Millions of Metric Tons Millions of Metric Tons
6%
8%
10%
12%
Percent Annual GrowthPercent Annual Growth
Demand ChangeDemand Change
Demand Change (%)Demand Change (%)
2011 Presentation to CSPC2011 Presentation to CSPC
-30
-20
-10
0
10
20
30
2000 2005 2010 2015
supports growth:supports growth:
–– Consumption Consumption levels risinglevels rising
–– Especially in Especially in ChinaChina
•• Concern Concern about about capacity capacity overhang overhang delays future delays future investment investment plansplans
-6%
-4%
-2%
0%
2%
4%
6%
Capacity AdditionsCapacity AdditionsCapacity Additions

Cumulative Production GrowthCumulative Production Growth
Million Metric TonsMillion Metric Tons
Cumulative Production GrowthCumulative Production Growth
Million Metric TonsMillion Metric Tons
500500500500
600600600600
700700700700
800800800800
Developing CountriesDeveloping CountriesDeveloping CountriesDeveloping Countries
Middle East Middle East (Hydrocarbon Rich)(Hydrocarbon Rich)Middle East Middle East (Hydrocarbon Rich)(Hydrocarbon Rich)Middle East Middle East (Hydrocarbon Rich)(Hydrocarbon Rich)
Developed CountriesDeveloped CountriesDeveloped CountriesDeveloped Countries
Growth Favors Labor & Hydrocarbon AdvantageGrowth Favors Labor & Hydrocarbon Advantage
•• Production growth is Production growth is indicative economic indicative economic development and/or development and/or relative cost positionrelative cost position
•• Mature Economies need Mature Economies need an export cost advantage an export cost advantage to advance productionto advance production
2011 Presentation to CSPC2011 Presentation to CSPC
0000
100100100100
200200200200
300300300300
400400400400
500500500500
90909090 95959595 00000000 05050505 10101010 15151515 20202020
Developed CountriesDeveloped CountriesDeveloped CountriesDeveloped Countries•• Developing economics Developing economics
attract local investment attract local investment to support local demandto support local demand
•• International Markets are International Markets are the perfect remedy for a the perfect remedy for a slow or lessslow or less--developed developed domestic environment domestic environment
-- if you can competeif you can compete
2020
2525
3030
35352010-2015
67%Share of Global Total:Share of Global Total:
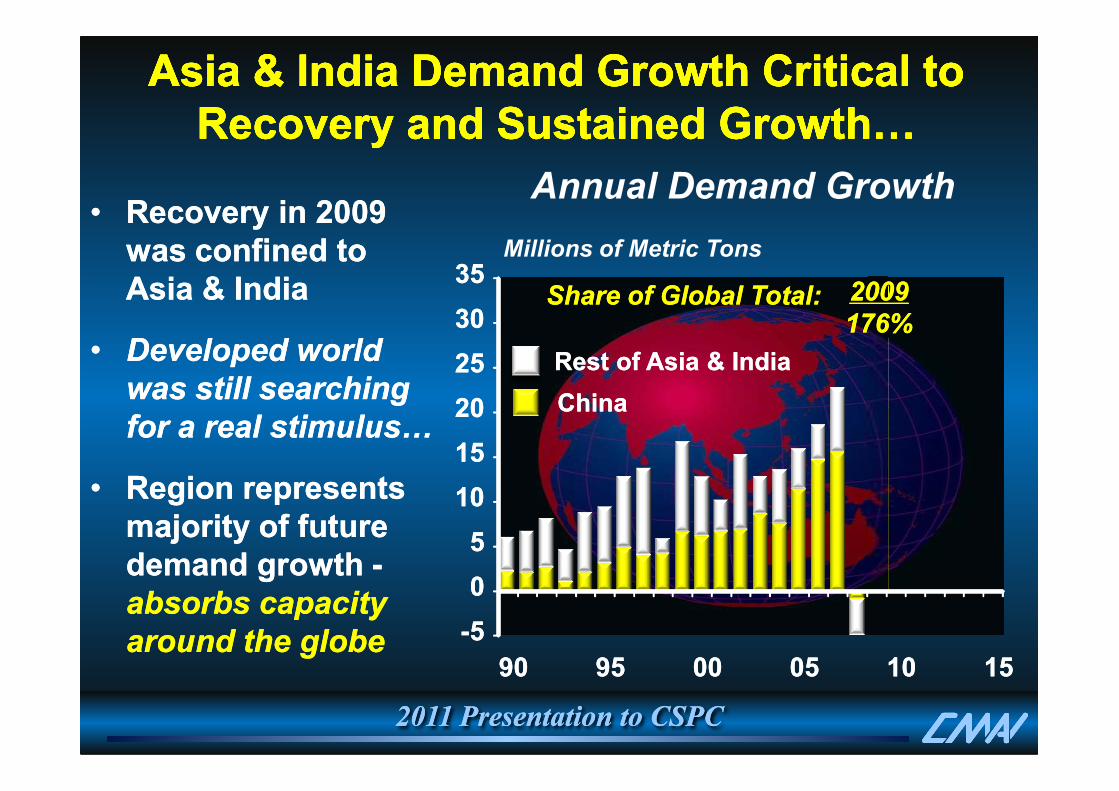
Asia & India Demand Growth Critical to Asia & India Demand Growth Critical to Recovery and Sustained Growth?Recovery and Sustained Growth?
Asia & India Demand Growth Critical to Asia & India Demand Growth Critical to Recovery and Sustained Growth?Recovery and Sustained Growth?
•• Recovery in 2009 Recovery in 2009 was confined to was confined to Asia & IndiaAsia & India
•• Developed world Developed world
was still searching was still searching
Millions of Metric Tons
Annual Demand Growth
ChinaChina
Rest of Asia & IndiaRest of Asia & India
20092009
176%176%
2011 Presentation to CSPC2011 Presentation to CSPC
--55
00
55
1010
1515
2020
9090 9595 0000 0505 1010 1515
was still searching was still searching
for a real stimulus/for a real stimulus/
•• Region represents Region represents majority of future majority of future demand growth demand growth --absorbs capacity absorbs capacity
around the globearound the globe
ChinaChina
4040
5050
6060
7070
8080
4040
5050
6060
7070
8080
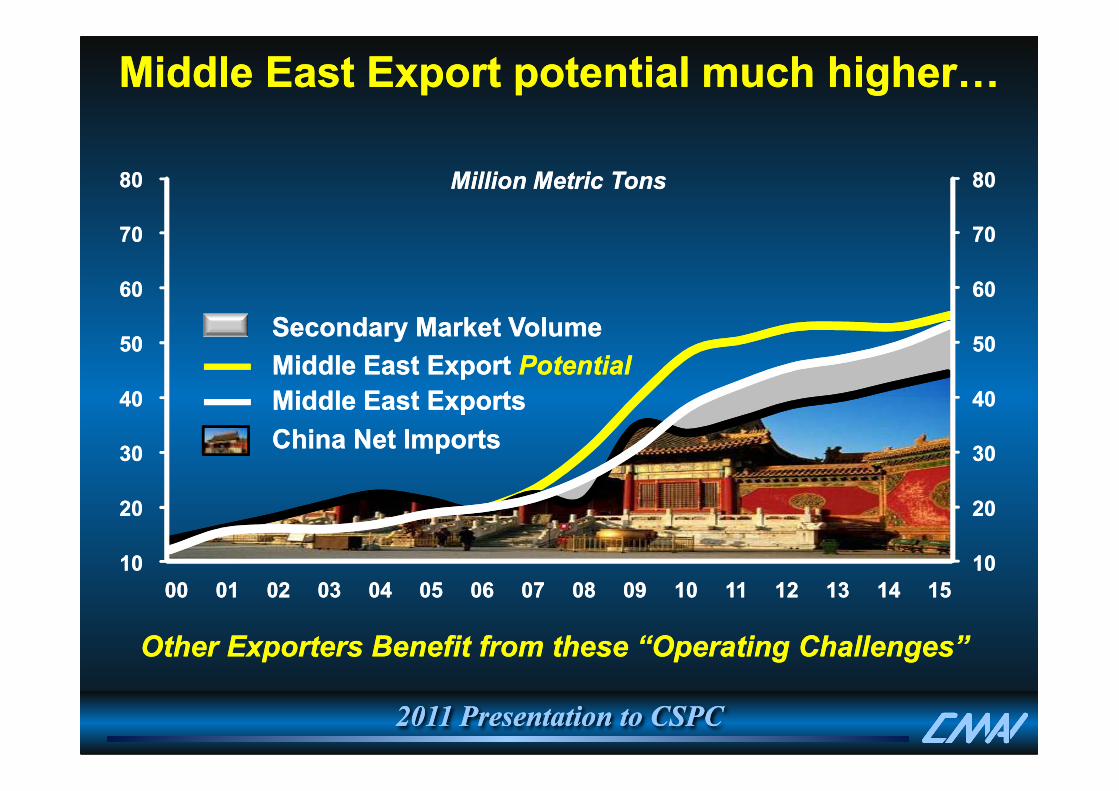
Middle East Export potential much higher?Middle East Export potential much higher?
Middle East Export Middle East Export PotentialPotential
Secondary Market VolumeSecondary Market Volume
Middle East ExportsMiddle East Exports
Million Metric TonsMillion Metric Tons
2011 Presentation to CSPC2011 Presentation to CSPC
1010
2020
3030
4040
1010
2020
3030
4040
0000 0101 0202 0303 0404 0505 0606 0707 0808 0909 1010 1111 1212 1313 1414 1515
China Net Imports China Net Imports
Middle East ExportsMiddle East Exports
Other Exporters Benefit from these “Operating Challenges”Other Exporters Benefit from these “Operating Challenges”
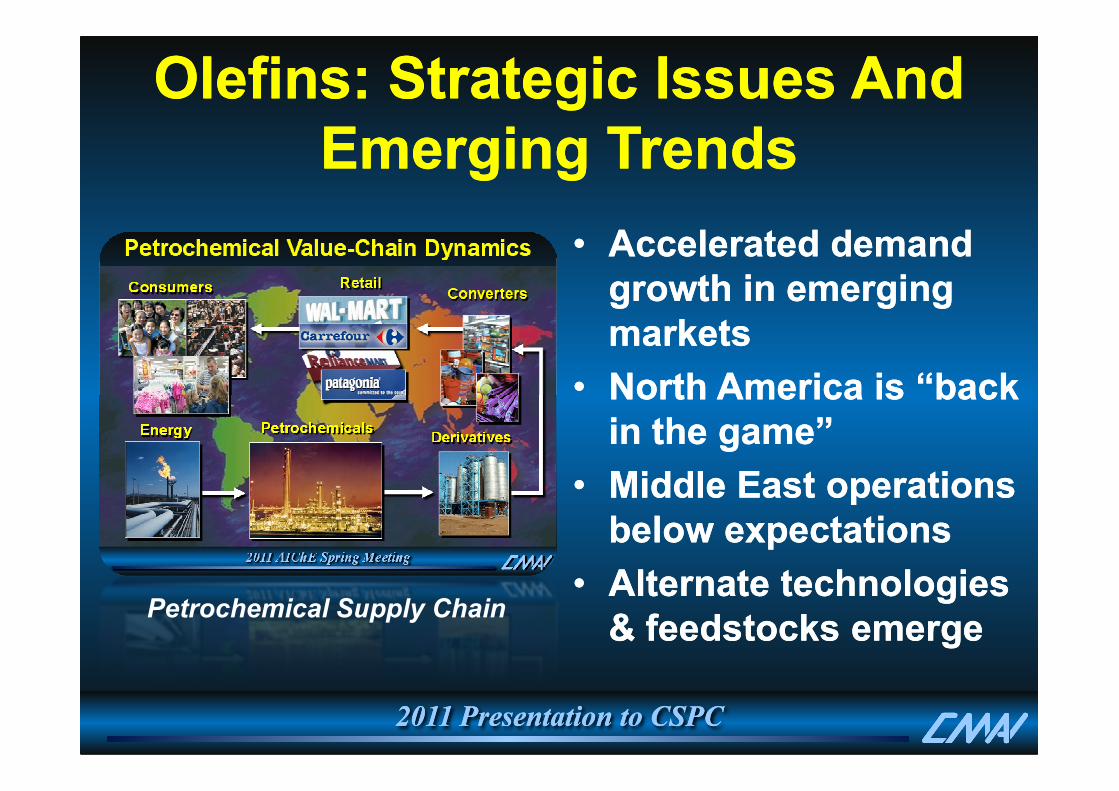
Olefins: Strategic Issues And Emerging Trends
Olefins: Strategic Issues And Emerging Trends
•• Accelerated demand Accelerated demand growth in emerging growth in emerging marketsmarkets
•• North America is “back North America is “back
2011 Presentation to CSPC2011 Presentation to CSPC
•• North America is “back North America is “back in the game”in the game”
•• Middle East operations Middle East operations below expectationsbelow expectations
•• Alternate technologies Alternate technologies & feedstocks emerge& feedstocks emerge
Petrochemical Supply Chain
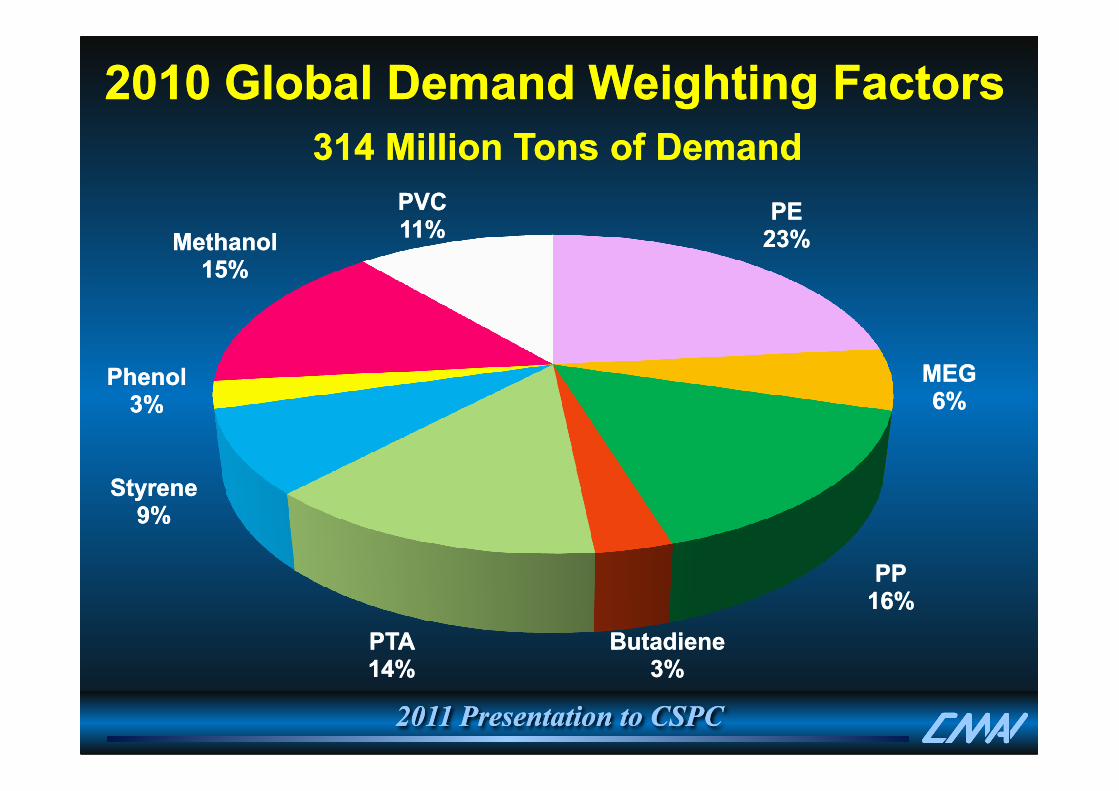
2010 Global Demand Weighting Factors2010 Global Demand Weighting Factors
314 Million Tons of Demand314 Million Tons of Demand
PEPE23%23%
MEGMEG6%6%
PhenolPhenol3%3%
MethanolMethanol15%15%
PVCPVC11%11%
2011 Presentation to CSPC2011 Presentation to CSPC
6%6%
PPPP16%16%
ButadieneButadiene3%3%
PTAPTA14%14%
StyreneStyrene9%9%
3%3%
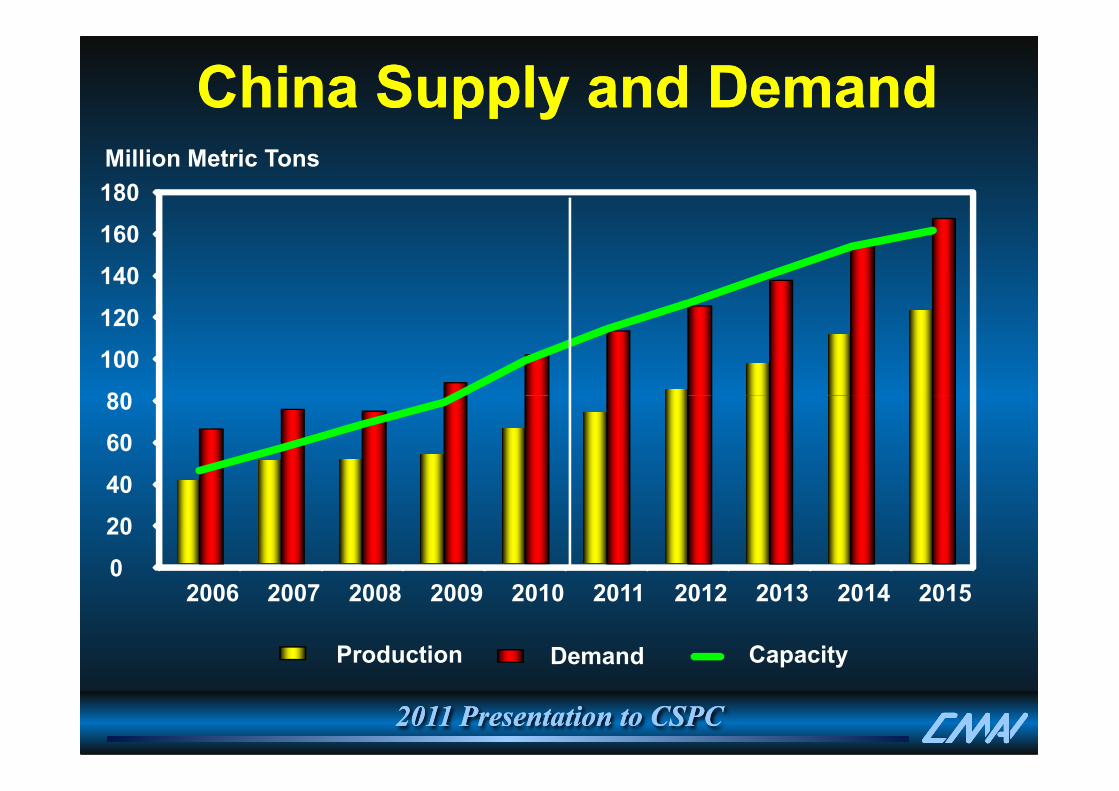
China Supply and DemandChina Supply and Demand
80
100
120
140
160
180
Million Metric Tons
2011 Presentation to CSPC2011 Presentation to CSPC
0
20
40
60
80
2006 2007 2008 2009 2010 2011 2012 2013 2014 2015
Production Demand Capacity

Major Petrochemical ProjectsMajor Petrochemical ProjectsDaqing PCDaqing PCC2: 600 KTAC2: 600 KTAQ1/2013Q1/2013
Fushun PCFushun PCC2: 800 KTAC2: 800 KTAQ2/2012Q2/2012
Sichuan PCSichuan PC
Urumqi PCUrumqi PCPX: 1,000 KTAPX: 1,000 KTAQ2/2011Q2/2011
Shanghai PCShanghai PC
BohaiBohaiChemChemC3: 600 KTAC3: 600 KTAQ4/2012Q4/2012
2011 Presentation to CSPC2011 Presentation to CSPC
C2: 800 KTA/PX: 650 KTAC2: 800 KTA/PX: 650 KTAQ1/2012Q1/2012
Wuhan PCWuhan PCC2: 800 KTAC2: 800 KTAQ1/2013Q1/2013
Shanghai PCShanghai PCC2: 600 KTAC2: 600 KTAQ1/2014Q1/2014
Hainan RefHainan RefPX: 600 KTAPX: 600 KTAQ3/2012Q3/2012
Sinopec/KPC JVSinopec/KPC JVC2: 1,000 KTAC2: 1,000 KTAQ1/2015Q1/2015
Tenlong PCTenlong PCPX: 800 KTAPX: 800 KTAMid/2012Mid/2012
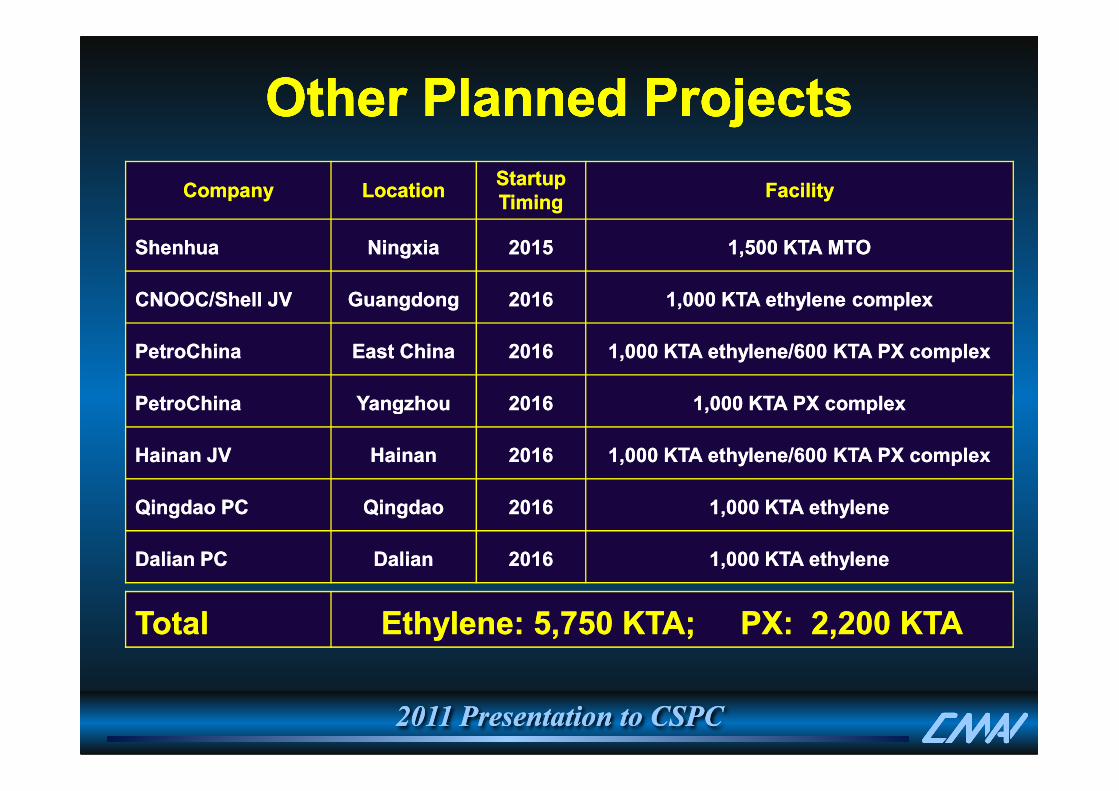
CompanyCompany LocationLocationStartup Startup TimingTiming
FacilityFacility
ShenhuaShenhua NingxiaNingxia 20152015 1,500 KTA MTO1,500 KTA MTO
CNOOC/Shell JV CNOOC/Shell JV GuangdongGuangdong 20162016 1,000 KTA ethylene complex1,000 KTA ethylene complex
PetroChinaPetroChina East ChinaEast China 20162016 1,000 KTA ethylene/600 KTA PX complex1,000 KTA ethylene/600 KTA PX complex
PetroChinaPetroChina YangzhouYangzhou 20162016 1,000 KTA PX complex1,000 KTA PX complex
Other Other Planned ProjectsPlanned ProjectsOther Other Planned ProjectsPlanned Projects
2011 Presentation to CSPC2011 Presentation to CSPC
PetroChinaPetroChina YangzhouYangzhou 20162016 1,000 KTA PX complex1,000 KTA PX complex
Hainan JVHainan JV HainanHainan 20162016 1,000 KTA ethylene/600 KTA PX complex1,000 KTA ethylene/600 KTA PX complex
Qingdao PCQingdao PC QingdaoQingdao 20162016 1,000 KTA ethylene1,000 KTA ethylene
Dalian PCDalian PC DalianDalian 20162016 1,000 KTA ethylene1,000 KTA ethylene
TotalTotal Ethylene: 5,750 KTA; PX: 2,200 KTAEthylene: 5,750 KTA; PX: 2,200 KTA
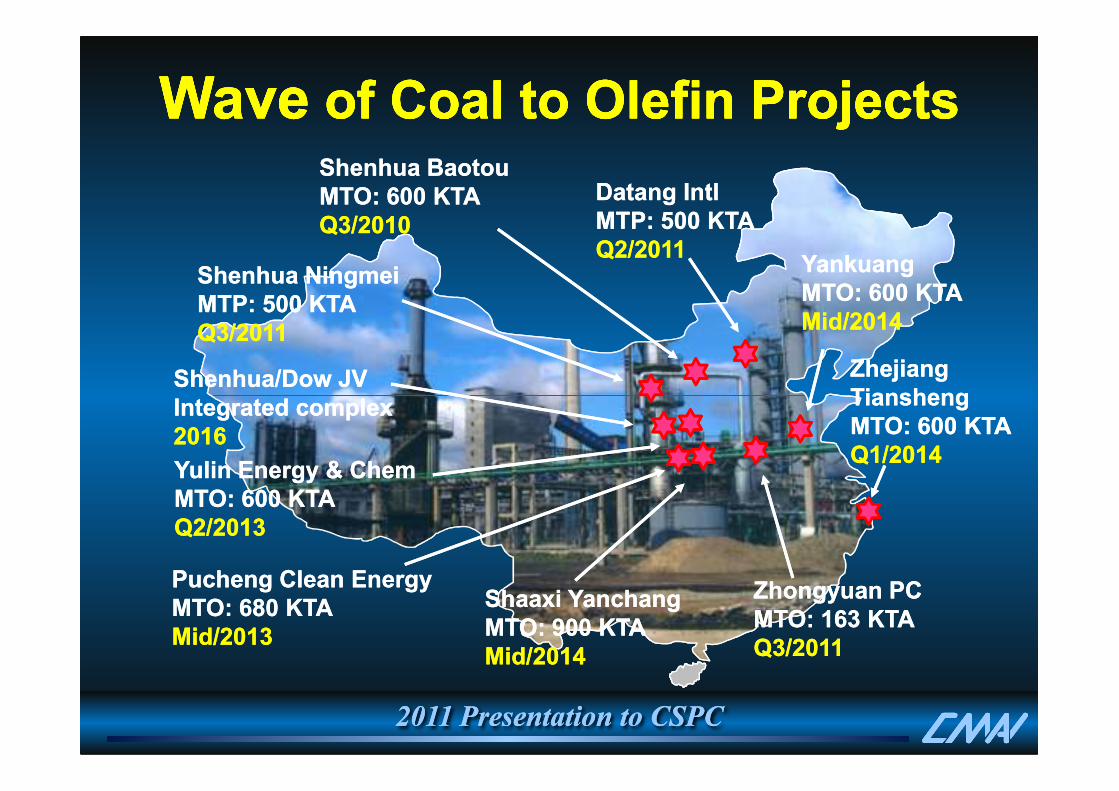
WaveWave of Coal to Olefin Projectsof Coal to Olefin ProjectsWaveWave of Coal to Olefin Projectsof Coal to Olefin Projects
Shenhua/Dow JVShenhua/Dow JVIntegrated complexIntegrated complex
Shenhua BaotouShenhua BaotouMTO: 600 KTAMTO: 600 KTAQ3/2010Q3/2010
Shenhua NingmeiShenhua NingmeiMTP: 500 KTAMTP: 500 KTAQ3/2011Q3/2011
DatangDatang IntlIntlMTP: 500 KTAMTP: 500 KTAQ2/2011Q2/2011
YankuangYankuangMTO: 600 KTAMTO: 600 KTAMid/2014Mid/2014
Zhejiang Zhejiang TianshengTiansheng
2011 Presentation to CSPC2011 Presentation to CSPC
Integrated complexIntegrated complex20162016
Yulin Energy & Yulin Energy & ChemChemMTO: 600 KTAMTO: 600 KTAQ2/2013Q2/2013
PuchengPucheng Clean EnergyClean EnergyMTO: 680 KTAMTO: 680 KTAMid/2013Mid/2013
ZhongyuanZhongyuan PCPCMTO: 163 KTAMTO: 163 KTAQ3/2011Q3/2011
ShaaxiShaaxi YanchangYanchangMTO: 900 KTAMTO: 900 KTAMid/2014Mid/2014
TianshengTianshengMTO: 600 KTAMTO: 600 KTAQ1/2014Q1/2014

“Global Chemicals” “Global Chemicals” Summary PerspectivesSummary Perspectives
“Global Chemicals” “Global Chemicals” Summary PerspectivesSummary Perspectives
Developed Developed World MaturesWorld Matures
•• Lower DemandLower Demand
•• Higher Imports Higher Imports (Finished Goods)(Finished Goods)
Developing Developing World ExpandsWorld Expands
•• More CapacityMore Capacity
•• Higher ImportsHigher Imports
2011 Presentation to CSPC2011 Presentation to CSPC
•• Higher Imports Higher Imports (Finished Goods)(Finished Goods)
•• Higher ImportsHigher Imports
(Raw Materials)(Raw Materials)
New Gulf (ME) New Gulf (ME) Advantage Advantage RemainsRemains
•• Higher ExportsHigher Exports
•• Diverse CapacityDiverse Capacity
Renewed Renewed Gulf (GOM) Gulf (GOM) ReemergesReemerges
•• Wide Oil vs Gas GapWide Oil vs Gas Gap
•• Higher ExportsHigher Exports
Top Related