


Languages
Pages
Legal

Confidential property of UnitedHealth Group. Do not distribute or reproduce without the express permission of UnitedHealth Group.Confidential property of UnitedHealth Group. Do not distribute or reproduce without the express permission of UnitedHealth Group.
Improving the Provider Experience Administrative Simplification – Collaborative Approach Delivers Results
WCBF Lean, Six Sigma and Business Improvement in Healthcare SummitMay 12-13 2010, New Orleans
Deborah Smith-Fedon
Director, Process Performance Program
Provider Service Quality, UnitedHealthcare
Confidential property of UnitedHealth Group. Do not distribute or reproduce without the express permission of UnitedHealth Group.
Process Performance ProgramMutual Benefits
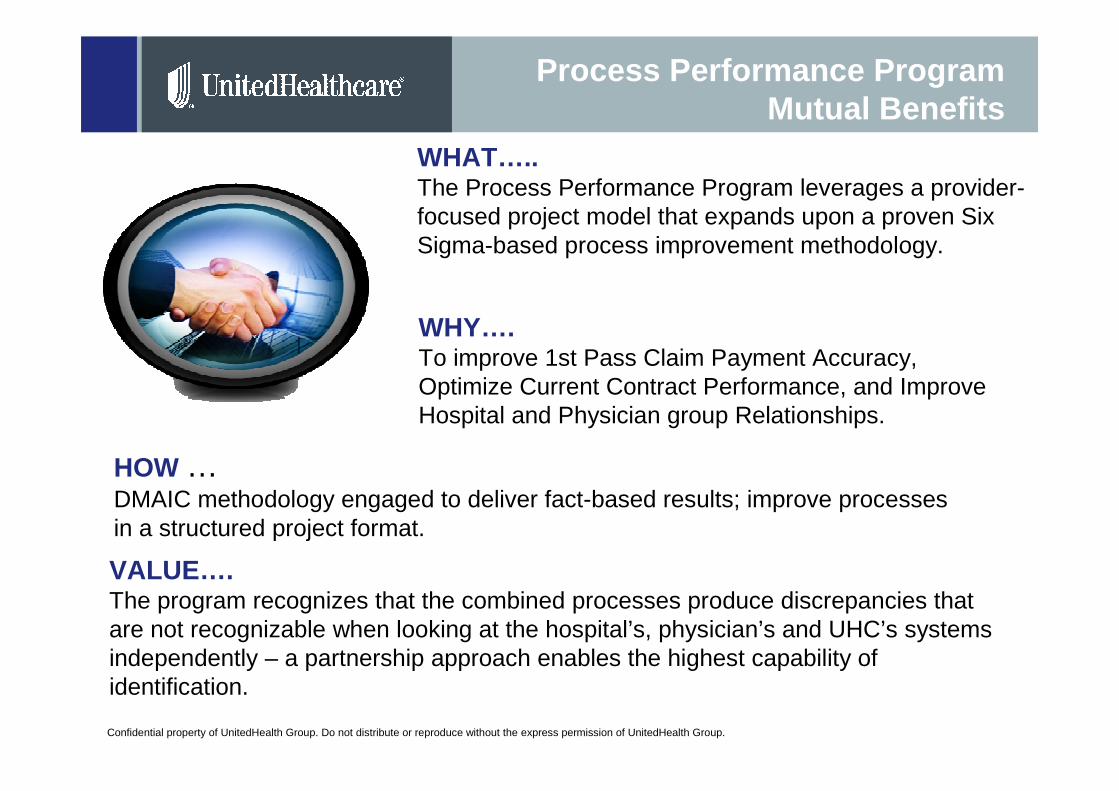
WHAT…..The Process Performance Program leverages a provider-focused project model that expands upon a proven Six Sigma-based process improvement methodology.
WHY….To improve 1st Pass Claim Payment Accuracy, Optimize Current Contract Performance, and Improve Hospital and Physician group Relationships.
VALUE….The program recognizes that the combined processes produce discrepancies that are not recognizable when looking at the hospital’s, physician’s and UHC’s systems independently – a partnership approach enables the highest capability of identification.
HOW …DMAIC methodology engaged to deliver fact-based results; improve processesin a structured project format.
Confidential property of UnitedHealth Group. Do not distribute or reproduce without the express permission of UnitedHealth Group.
Observation
Individual Value
19017115213311495765738191
0.9
0.8
0.7
0.6
0.5
0.4
0.3
0.2
0.1
0.0
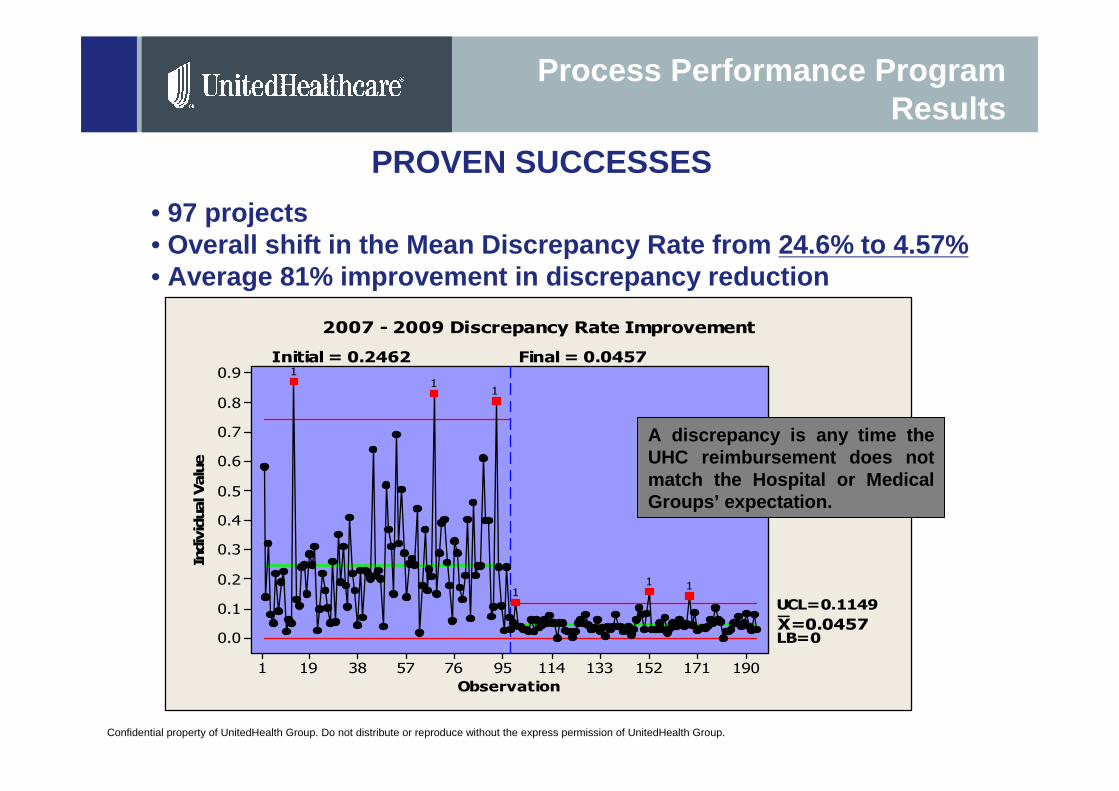
_X=0.0457
UCL=0.1149
LB=0
Initial = 0.2462 Final = 0.0457
11
1
11
1
2007 - 2009 Discrepancy Rate Improvement
Process Performance ProgramResults
PROVEN SUCCESSES
• 97 projects• Overall shift in the Mean Discrepancy Rate from 24.6% to 4.57%• Average 81% improvement in discrepancy reduction
A discrepancy is any time the UHC reimbursement does not match the Hospital or Medical Groups’ expectation.
Confidential property of UnitedHealth Group. Do not distribute or reproduce without the express permission of UnitedHealth Group.
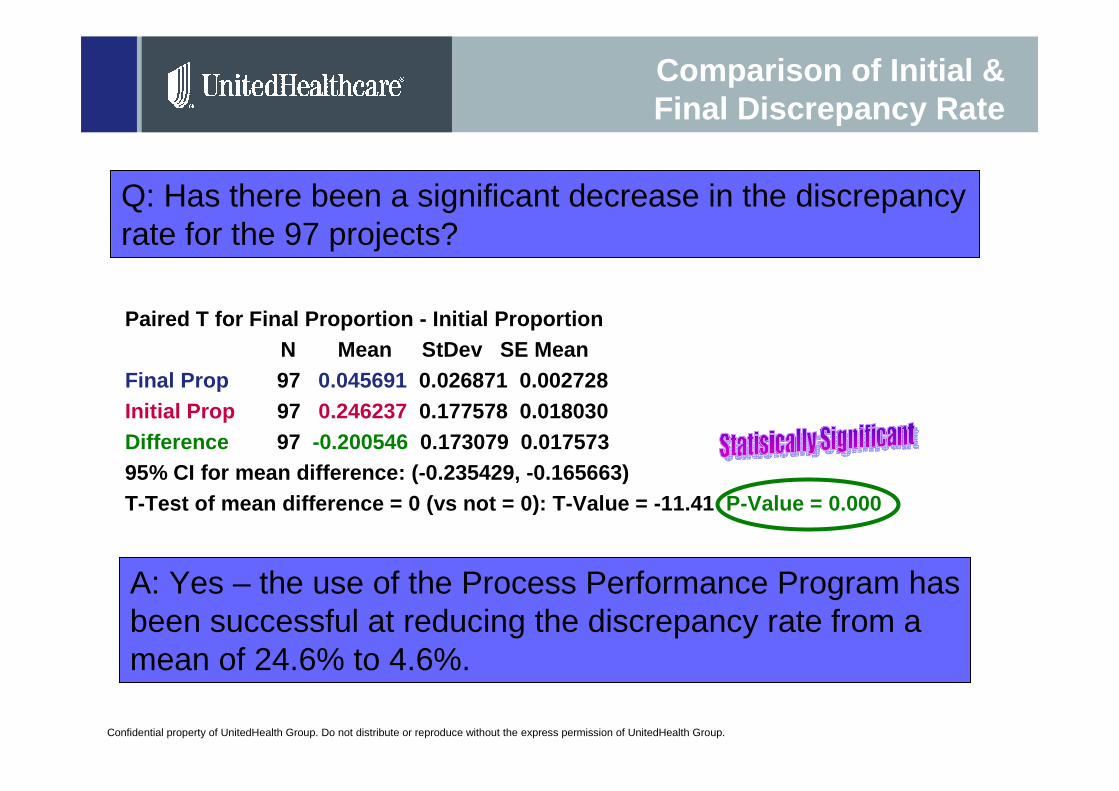
Comparison of Initial & Final Discrepancy Rate
Paired T for Final Proportion - Initial ProportionN Mean StDev SE Mean
Final Prop 97 0.045691 0.026871 0.002728Initial Prop 97 0.246237 0.177578 0.018030Difference 97 -0.200546 0.173079 0.01757395% CI for mean difference: (-0.235429, -0.165663)T-Test of mean difference = 0 (vs not = 0): T-Value = -11.41 P-Value = 0.000
Q: Has there been a significant decrease in the discrepancy rate for the 97 projects?
A: Yes – the use of the Process Performance Program has been successful at reducing the discrepancy rate from a mean of 24.6% to 4.6%.
Confidential property of UnitedHealth Group. Do not distribute or reproduce without the express permission of UnitedHealth Group.Confidential property of UnitedHealth Group. Do not distribute or reproduce without the express permission of UnitedHealth Group.
Process Performance ProgramProgram Overview
Confidential property of UnitedHealth Group. Do not distribute or reproduce without the express permission of UnitedHealth Group.6
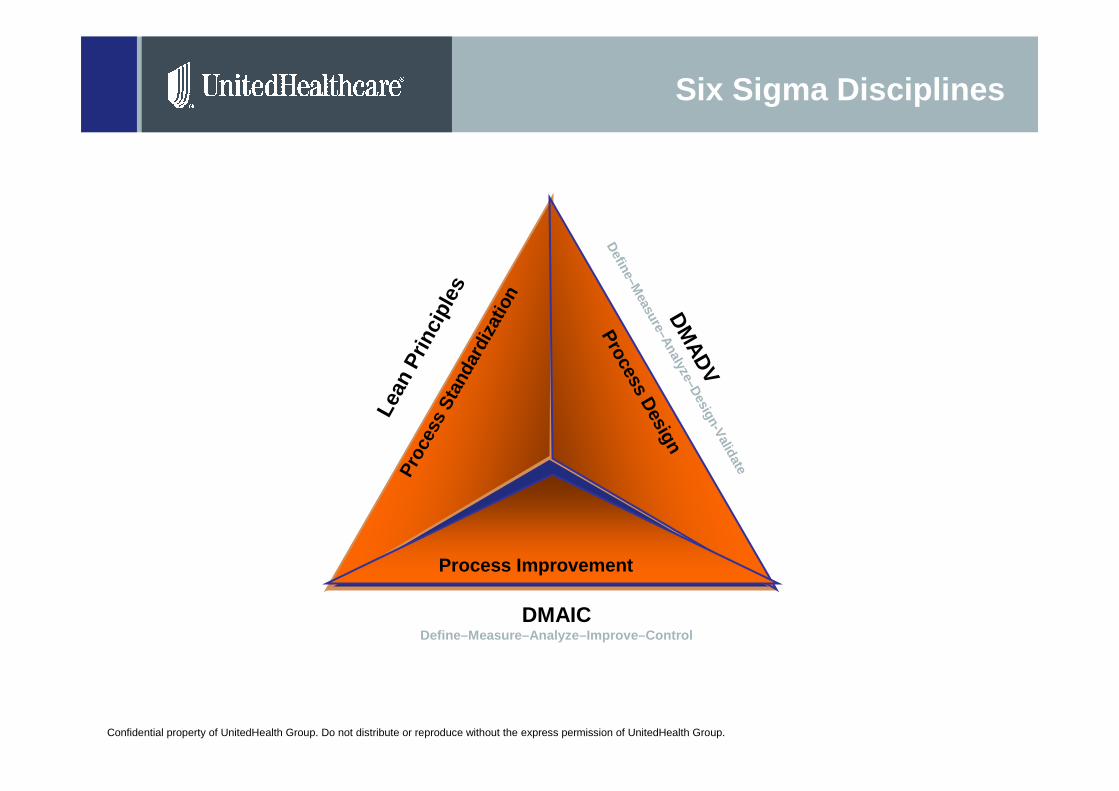
Six Sigma Disciplines
Proc
ess
Stan
dard
izat
ion
Process Design
Process Improvement
DMAICDefine–Measure–Analyze–Improve–Control
Lean
Prin
cipl
esD
MA
DV
Define–M
easure–Analyze–D
esign-Validate
Confidential property of UnitedHealth Group. Do not distribute or reproduce without the express permission of UnitedHealth Group.
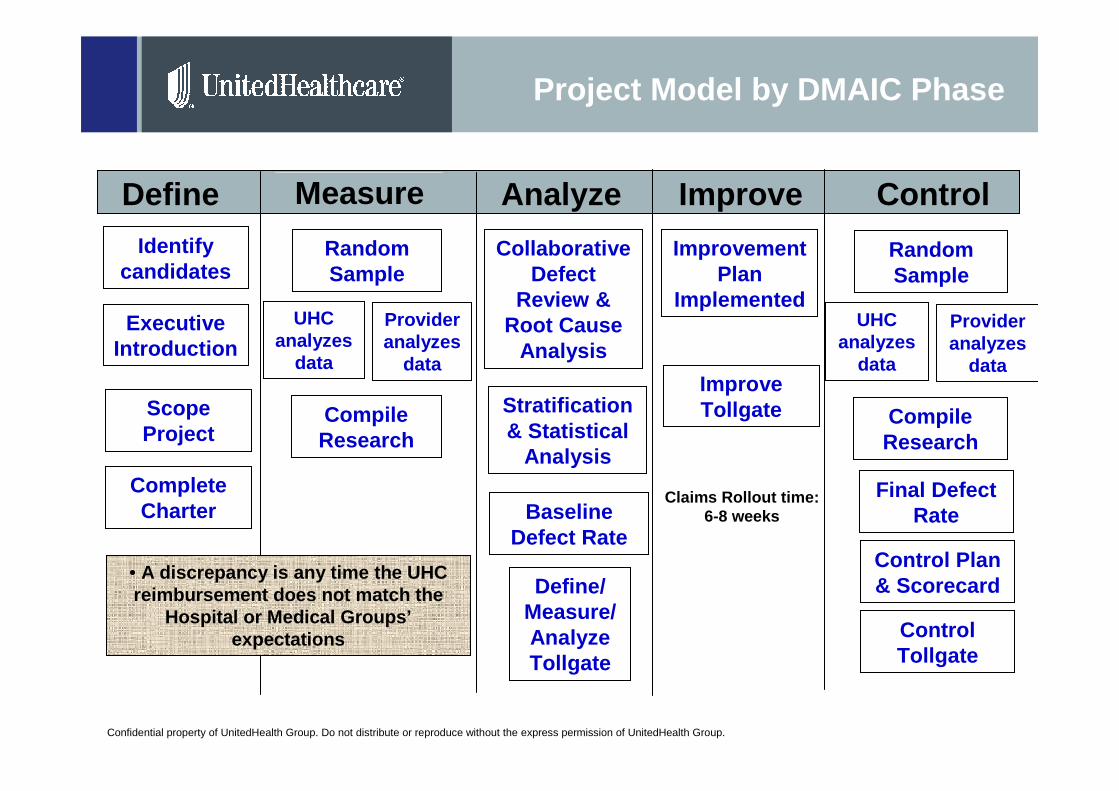
Project Model by DMAIC Phase
Define ControlImproveAnalyzeMeasure
Identify candidates
Executive Introduction
Scope Project
Complete Charter
Random Sample
UHC analyzes
data
Provider analyzes
data
Compile Research
Baseline Defect Rate
Collaborative Defect
Review & Root Cause
Analysis
Stratification & Statistical
Analysis
Define/ Measure/ Analyze Tollgate
Improvement Plan
Implemented
Improve Tollgate
Claims Rollout time: 6-8 weeks
Final Defect Rate
Control Plan & Scorecard
Control Tollgate
Random Sample
UHC analyzes
data
Provider analyzes
data
Compile Research
• A discrepancy is any time the UHC reimbursement does not match the
Hospital or Medical Groups’expectations
Confidential property of UnitedHealth Group. Do not distribute or reproduce without the express permission of UnitedHealth Group.
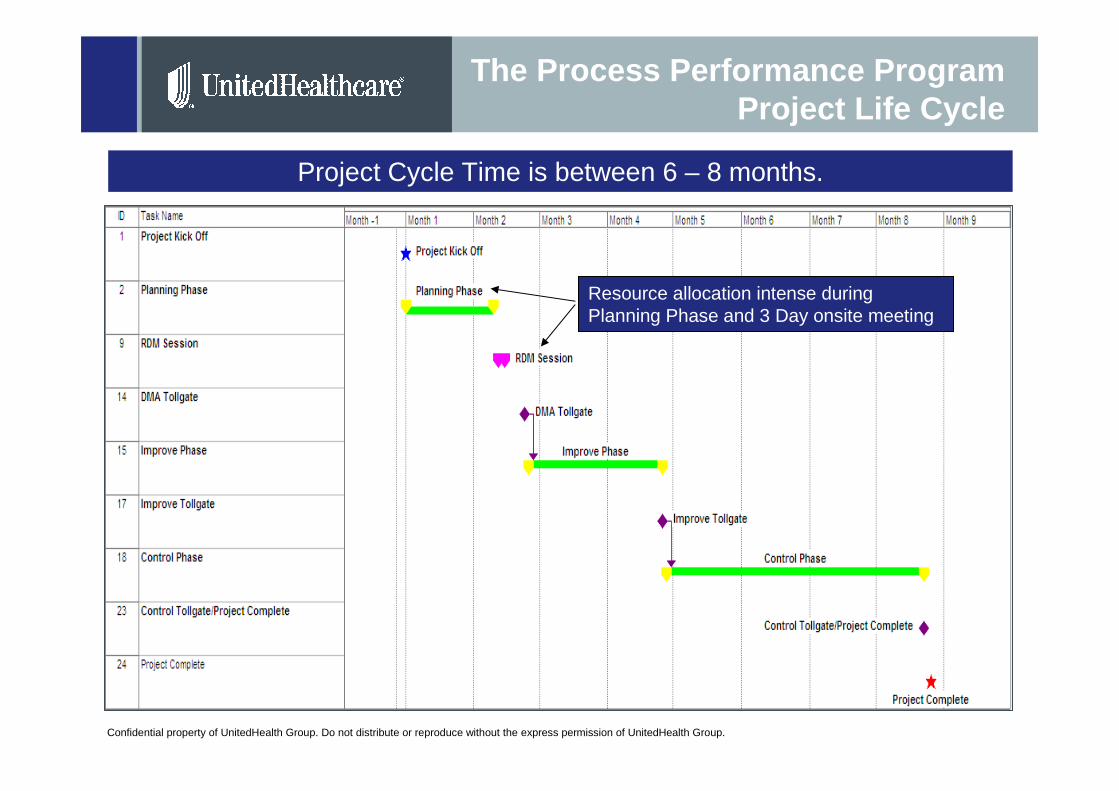
The Process Performance Program Project Life Cycle
Project Cycle Time is between 6 – 8 months.
Resource allocation intense during Planning Phase and 3 Day onsite meeting
Confidential property of UnitedHealth Group. Do not distribute or reproduce without the express permission of UnitedHealth Group.
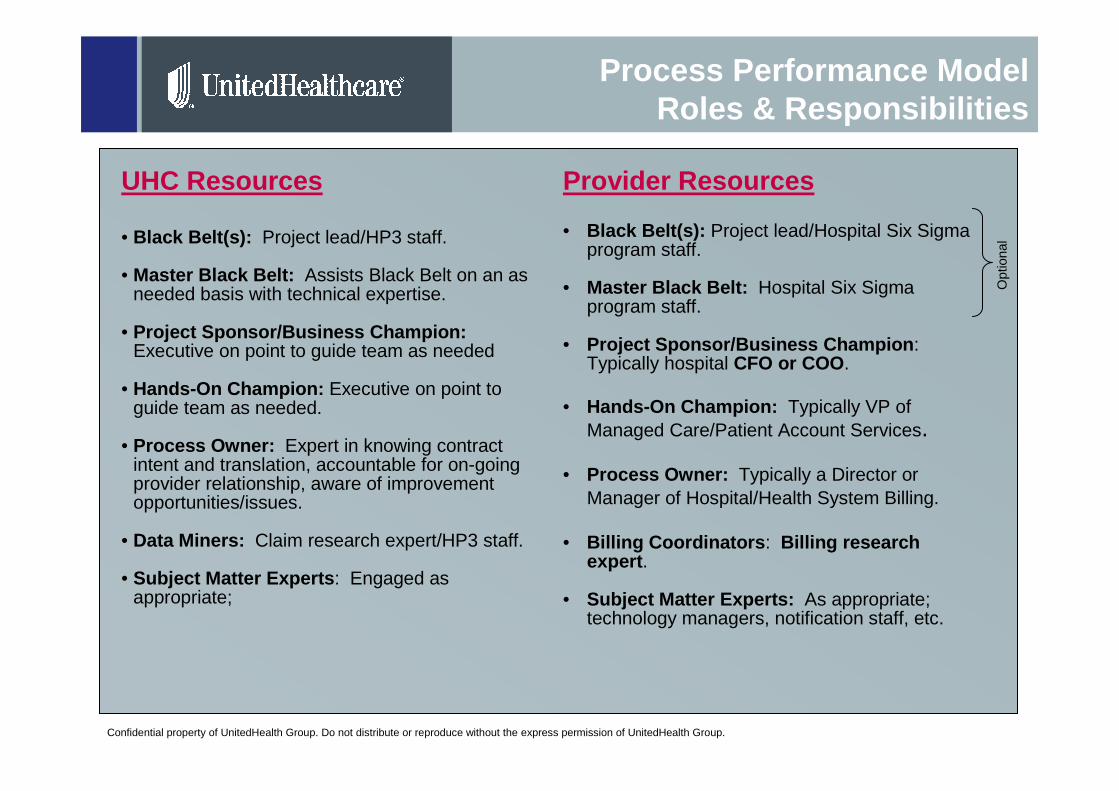
Process Performance ModelRoles & Responsibilities
UHC Resources
• Black Belt(s): Project lead/HP3 staff.
• Master Black Belt: Assists Black Belt on an as needed basis with technical expertise.
• Project Sponsor/Business Champion: Executive on point to guide team as needed
• Hands-On Champion: Executive on point to guide team as needed.
• Process Owner: Expert in knowing contract intent and translation, accountable for on-going provider relationship, aware of improvement opportunities/issues.
• Data Miners: Claim research expert/HP3 staff.
• Subject Matter Experts : Engaged as appropriate;
Provider Resources
• Black Belt(s): Project lead/Hospital Six Sigma program staff.
• Master Black Belt: Hospital Six Sigma program staff.
• Project Sponsor/Business Champion : Typically hospital CFO or COO .
• Hands-On Champion: Typically VP of Managed Care/Patient Account Services.
• Process Owner: Typically a Director or Manager of Hospital/Health System Billing.
• Billing Coordinators : Billing research expert .
• Subject Matter Experts: As appropriate; technology managers, notification staff, etc.
Opt
iona
l
Confidential property of UnitedHealth Group. Do not distribute or reproduce without the express permission of UnitedHealth Group.
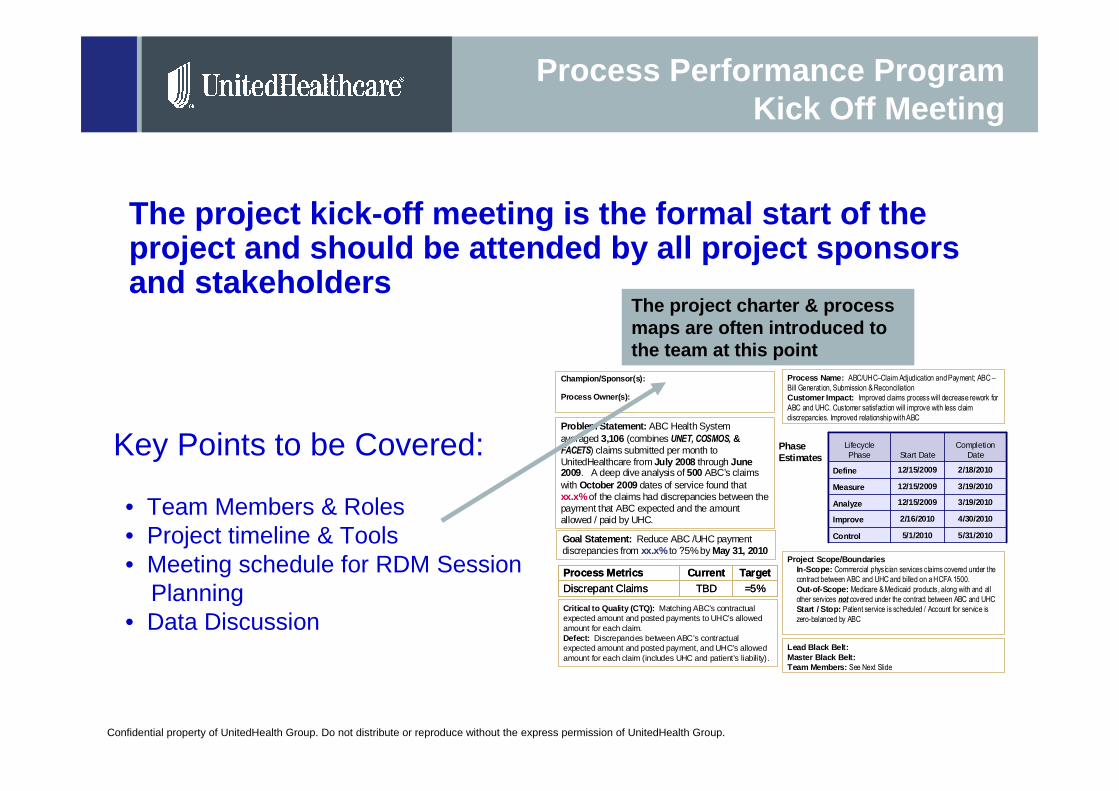
Process Performance Program Kick Off Meeting
The project kick-off meeting is the formal start of the project and should be attended by all project spons ors and stakeholders
Key Points to be Covered:
• Team Members & Roles• Project timeline & Tools• Meeting schedule for RDM Session
Planning• Data Discussion
Champion/Sponsor(s):
Process Owner(s):
Problem Statement: ABC Health System averaged 3,106 (combines UNET, COSMOS, & FACETS) claims submitted per month to UnitedHealthcare from July 2008 through June 2009. A deep dive analysis of 500 ABC’s claims with October 2009 dates of service found that xx.x %of the claims had discrepancies between the payment that ABC expected and the amount allowed / paid by UHC.
Critical to Quality (CTQ): Matching ABC’s contractual expected amount and posted payments to UHC’s allowed amount for each claim.Defect: Discrepancies between ABC’s contractual expected amount and posted payment, and UHC’s allowed amount for each claim (includes UHC and patient’s liability).
Lead Black Belt: Master Black Belt: Team Members: See Next Slide
Process Name: ABC/UHC–Claim Adjudication and Payment; ABC –
Bill Generation, Submission & Reconciliation
Customer Impact: Improved claims process will decrease rework for
ABC and UHC. Customer satisfaction will improve with less claim
discrepancies. Improved relationship with ABC
Project Scope/BoundariesIn-Scope: Commercial physician services claims covered under the contract between ABC and UHC and billed on a HCFA 1500.
Out-of-Scope: Medicare & Medicaid products, along with and all other services not covered under the contract between ABC and UHC
Start / Stop: Patient service is scheduled / Account for service is zero-balanced by ABC
Goal Statement: Reduce ABC /UHC payment discrepancies from xx.x % to ?5%by May 31, 2010
PhaseEstimates
5/31/20105/1/2010Control
4/30/20102/16/2010Improve
3/19/201012/15/2009Analyze
3/19/201012/15/2009Measure
2/18/201012/15/2009Define
Completion DateStart Date
Lifecycle Phase
5/31/20105/1/2010Control
4/30/20102/16/2010Improve
3/19/201012/15/2009Analyze
3/19/201012/15/2009Measure
2/18/201012/15/2009Define
Completion DateStart Date
Lifecycle Phase
=5%TBDDiscrepant Claims
TargetCurrentProcess Metrics=5%TBDDiscrepant Claims
TargetCurrentProcess Metrics
The project charter & process maps are often introduced to the team at this point
Confidential property of UnitedHealth Group. Do not distribute or reproduce without the express permission of UnitedHealth Group.
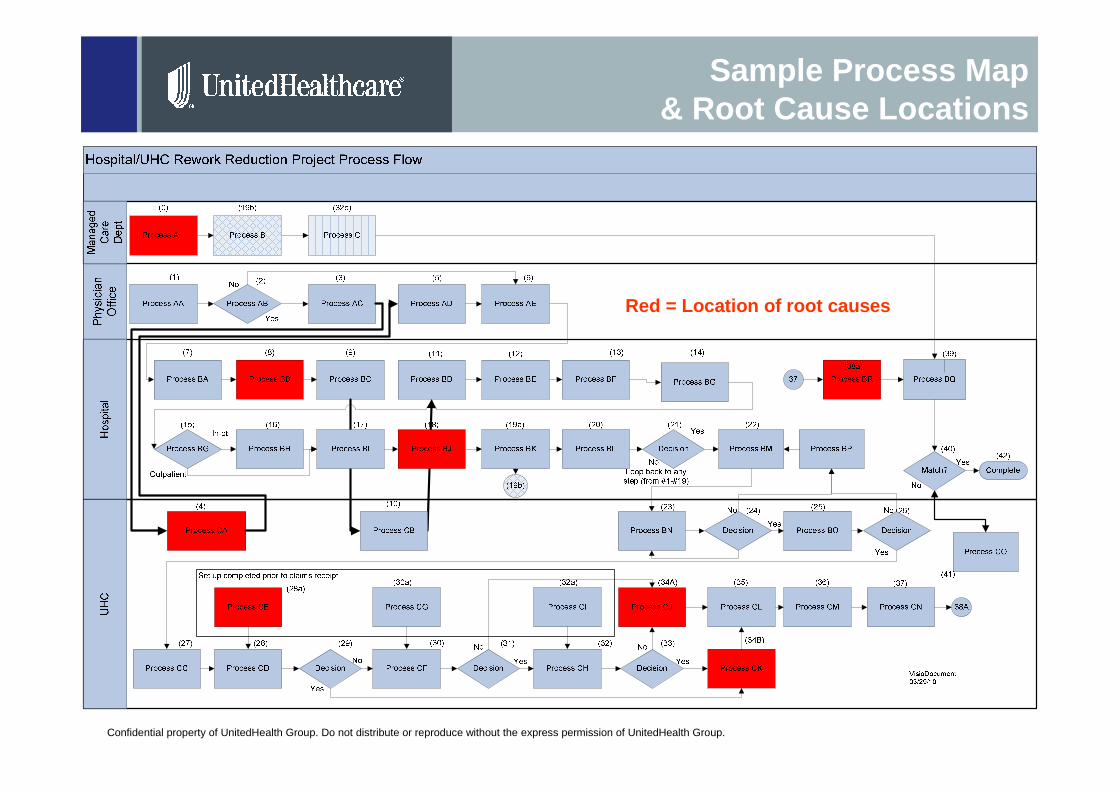
Red = Location of root causes
Sample Process Map & Root Cause Locations
Confidential property of UnitedHealth Group. Do not distribute or reproduce without the express permission of UnitedHealth Group.
Project Data Requirements
• Discrepancy Definition: A discrepancy is any time the UHC reimbursement does not match the Hospital or Medical Groups’ expectations.
• Data Population = 1-3 months of service dates (depending on monthly volume)
• 300-500 random sample of claims extracted from population
• A MSA tool is populated using random sample data. This tool is used by BOTH organizations to identify discrepancies within the sample prior to the onsite RDM.
Confidential property of UnitedHealth Group. Do not distribute or reproduce without the express permission of UnitedHealth Group.
Percent
Count 60
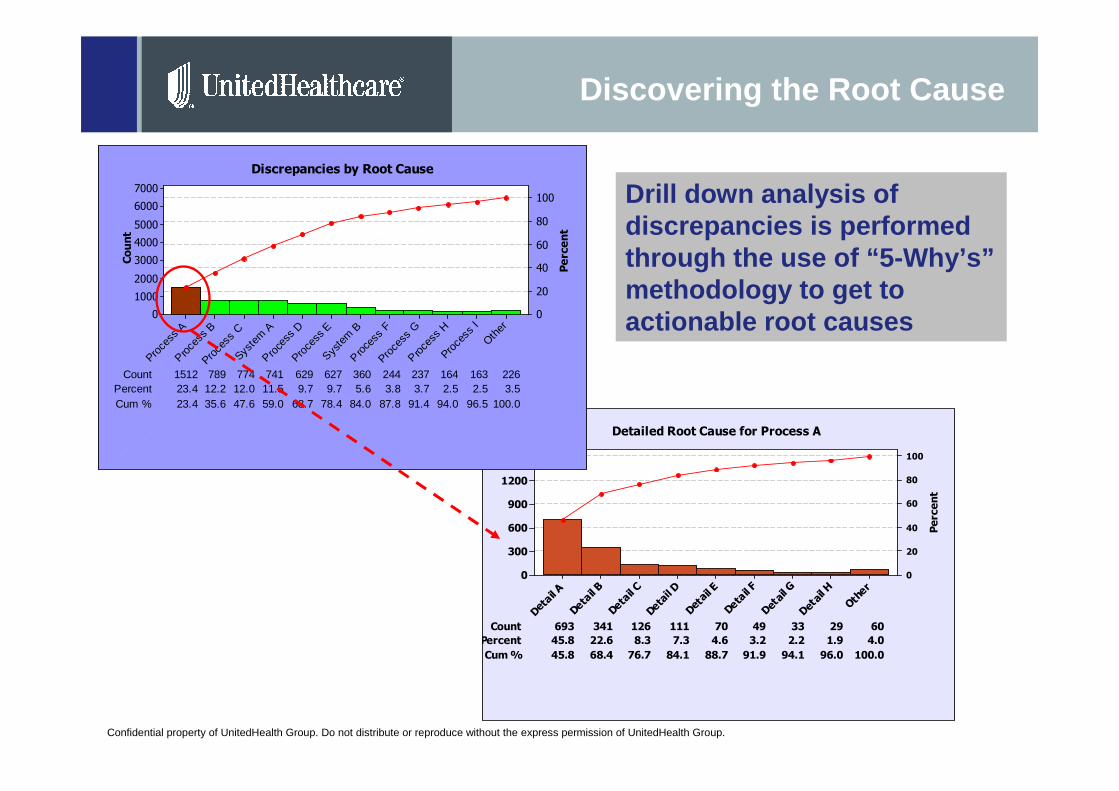
Percent 45.8 22.6 8.3 7.3 4.6 3.2 2.2 1.9
693
4.0
Cum % 45.8 68.4 76.7 84.1 88.7 91.9 94.1 96.0
341
100.0
126 111 70 49 33 29
Other
Detail H
Detail G
Detail F
Detail E
Detail D
Detail C
Detail B
Detail A
1500
1200
900
600
300
0
100
80
60
40
20
0
Detailed Root Cause for Process A
Discovering the Root Cause
Drill down analysis of discrepancies is performed through the use of “5-Why’s”methodology to get to actionable root causes
Count
Percent
Count 237 164 163 226Percent 23.4 12.2 12.0 11.5 9.7
15129.7 5.6 3.8 3.7 2.5 2.5 3.5
Cum % 23.4 35.6
789
47.6 59.0 68.7 78.4 84.0 87.8 91.4 94.0 96.5 100.0
774 741 629 627 360 244
Other
Proce
ss I
Proce
ss H
Proce
ss G
Proce
ss F
Syste
m B
Proce
ss E
Proce
ss D
Syste
m A
Proce
ss C
Proce
ss B
Proce
ss A
7000
6000
5000
4000
3000
2000
1000
0
100
80
60
40
20
0
Discrepancies by Root Cause
Confidential property of UnitedHealth Group. Do not distribute or reproduce without the express permission of UnitedHealth Group.
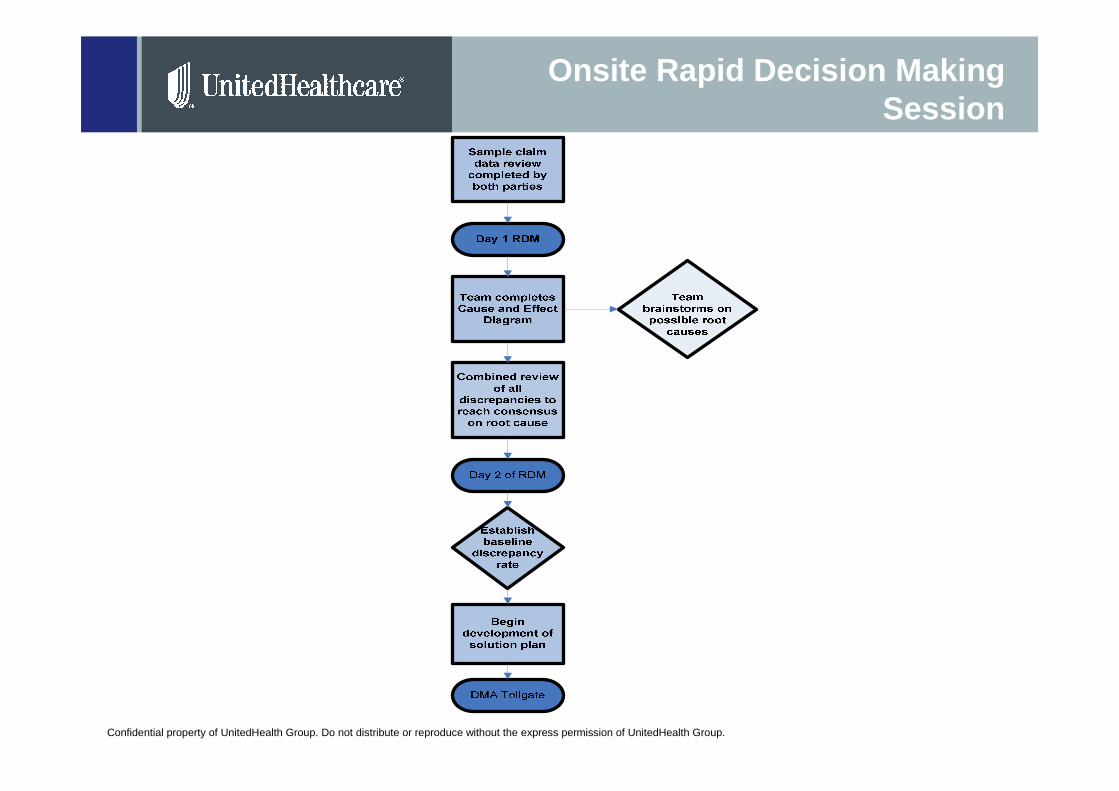
Onsite Rapid Decision Making Session
Confidential property of UnitedHealth Group. Do not distribute or reproduce without the express permission of UnitedHealth Group.
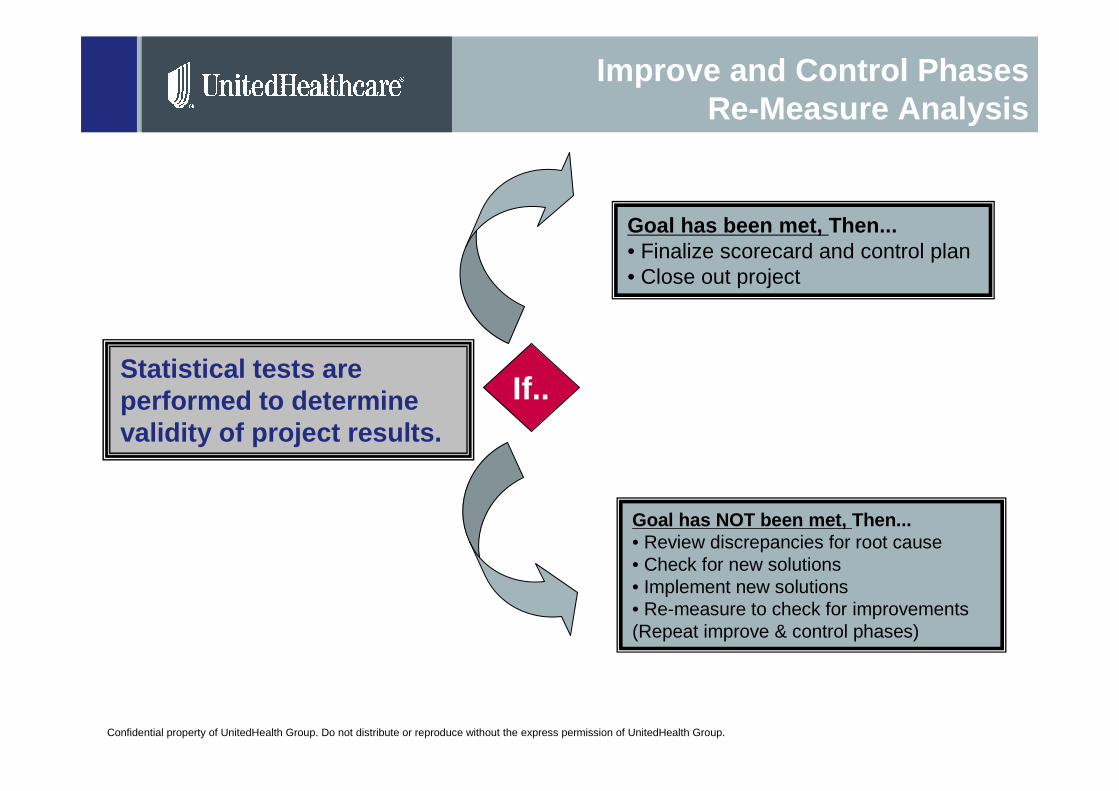
Improve and Control PhasesRe-Measure Analysis
If..
Goal has been met, Then...• Finalize scorecard and control plan• Close out project
Goal has NOT been met, Then...• Review discrepancies for root cause• Check for new solutions• Implement new solutions• Re-measure to check for improvements(Repeat improve & control phases)
Statistical tests are performed to determine validity of project results.
Confidential property of UnitedHealth Group. Do not distribute or reproduce without the express permission of UnitedHealth Group.16
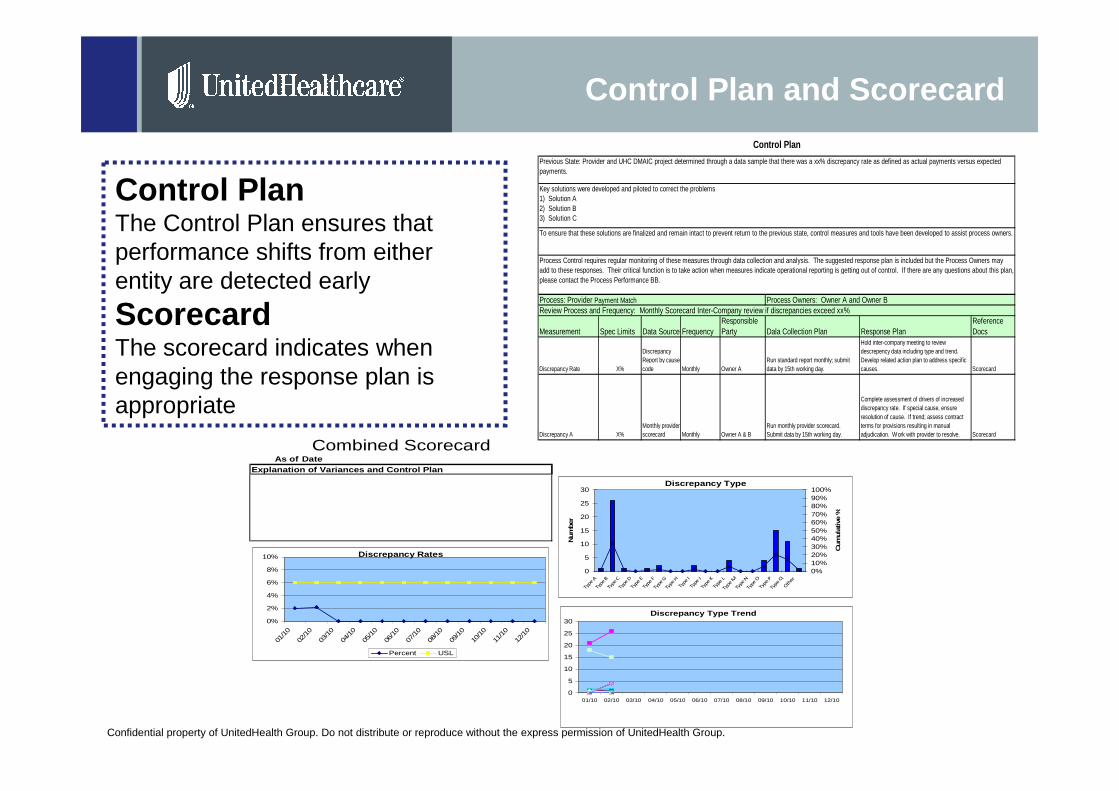
Control Plan and Scorecard
Control PlanThe Control Plan ensures that performance shifts from either entity are detected early
ScorecardThe scorecard indicates when engaging the response plan is appropriate
As of DateCombined Scorecard
Explanation of Variances and Control Plan
Discrepancy Type
0
5
10
15
20
25
30
Type
ATy
pe B
Type
CTy
pe D
Type
ETy
pe F
Type
GTy
pe H
Type
ITy
pe J
Type
KTy
pe L
Type
MTy
pe N
Type
OTy
pe P
Type
QO
ther
Num
ber
0%10%20%30%40%50%60%70%80%90%100%
Cum
ulat
ive
%
Discrepancy Type Trend
0
5
10
15
20
25
30
01/10 02/10 03/10 04/10 05/10 06/10 07/10 08/10 09/10 10/10 11/10 12/10
Discrepancy Rates
0%
2%
4%
6%
8%
10%
01/1
0
02/1
0
03/1
0
04/1
0
05/1
0
06/1
0
07/1
0
08/1
0
09/1
0
10/1
0
11/1
0
12/1
0
Percent USL
Measurement Spec Limits Data Source FrequencyResponsible Party Dala Collection Plan Response Plan
Reference Docs
Discrepancy Rate X%
Discrepancy Report by cause code Monthly Owner A
Run standard report monthly; submit data by 15th working day.
Hold inter-company meeting to review descrepency data including type and trend. Develop related action plan to address specific causes. Scorecard
Discrepancy A X%Monthly provider scorecard Monthly Owner A & B
Run monthly provider scorecard. Submit data by 15th working day.
Complete assessment of drivers of increased discrepancy rate. If special cause, ensure resolution of cause. If trend; assess contract terms for provisions resulting in manual adjudication. Work with provider to resolve. Scorecard
Control Plan
Process: Provider Payment Match Process Owners: Owner A and Owner BReview Process and Frequency: Monthly Scorecard Inter-Company review if discrepancies exceed xx%
Previous State: Provider and UHC DMAIC project determined through a data sample that there was a xx% discrepancy rate as defined as actual payments versus expected payments.
Key solutions were developed and piloted to correct the problems 1) Solution A2) Solution B3) Solution C
To ensure that these solutions are finalized and remain intact to prevent return to the previous state, control measures and tools have been developed to assist process owners.
Process Control requires regular monitoring of these measures through data collection and analysis. The suggested response plan is included but the Process Owners may add to these responses. Their critical function is to take action when measures indicate operational reporting is getting out of control. If there are any questions about this plan, please contact the Process Performance BB.
Confidential property of UnitedHealth Group. Do not distribute or reproduce without the express permission of UnitedHealth Group.
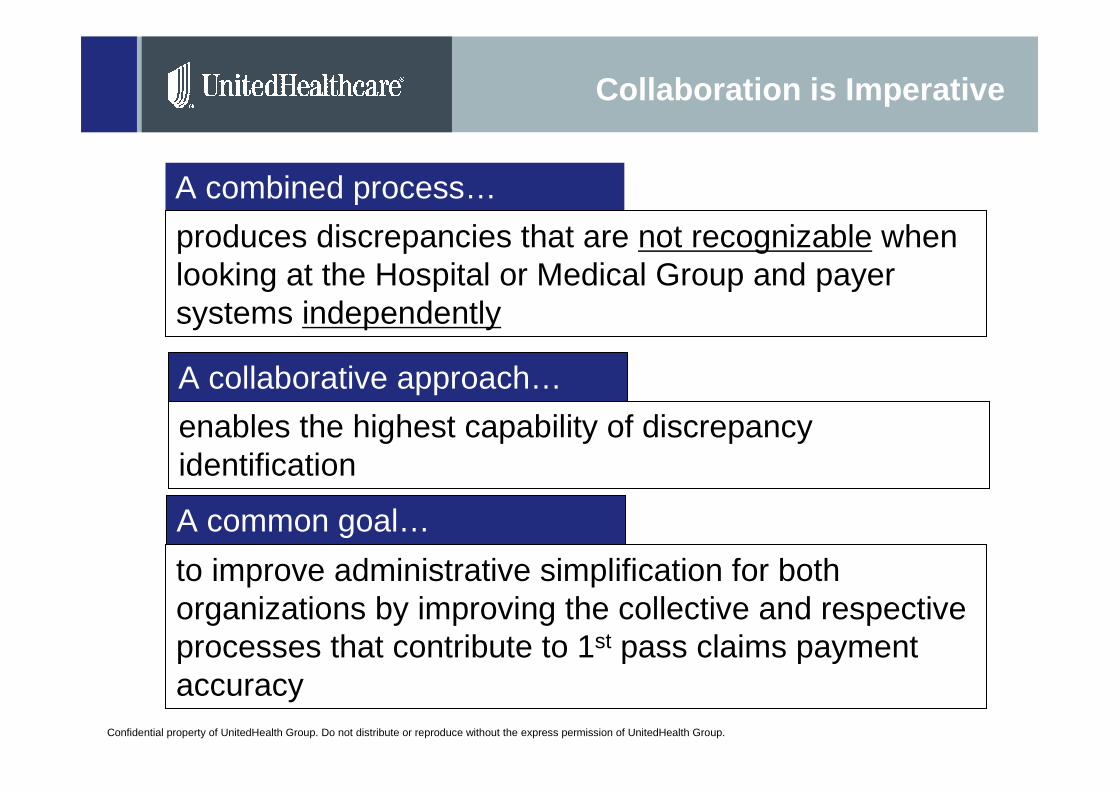
Collaboration is Imperative
A combined process…
produces discrepancies that are not recognizable when looking at the Hospital or Medical Group and payer systems independently
A collaborative approach…
enables the highest capability of discrepancy identification
A common goal…
to improve administrative simplification for both organizations by improving the collective and respective processes that contribute to 1st pass claims payment accuracy
Confidential property of UnitedHealth Group. Do not distribute or reproduce without the express permission of UnitedHealth Group.
This is Just the Beginning . . .
Top Related