


Languages
Pages
Legal

YANG LIU
Implementing Sustainable Competitive
Advantage for Proactive Operations in
Global Turbulent Business
Environments
ACTA WASAENSIA NO 227
INDUSTRIAL MANAGEMENT 19
UNIVERSITAS WASAENSIS 2010
Reviewers Professor Pekka Kess
University of Oulu
Department of Industrial Engineering and Management
P.O.Box 4610
90014 University of Oulu
Finland
Professor Kefan Xie
Wuhan University of Technology
School of Management
205 Luoshi Road
Wuhan 430070
P.R.China

III
Julkaisija Julkaisuajankohta Vaasan yliopisto Syyskuu 2010 Tekijä(t) Julkaisun tyyppi
Artikkelikokoelma Julkaisusarjan nimi, osan numero
Yang Liu
Acta Wasaensia, 227 Yhteystiedot ISBN
978–952–476–314–1 ISSN 0355–2667, 1456–3738 Sivumäärä Kieli
Vaasan yliopisto Teknillinen tiedekunta Tuotantotalouden yksikkö PL 700 65101 Vaasa 207 Englanti Julkaisun nimike Kestävän kilpailuedun toteuttaminen ennakoivaan operatiiviseen toimintaan globaalissa turbulenttisessa liiketoimintaympäristössä Tiivistelmä Tulevaisuuden valmistustoiminnan kilpailukyky dynaamisessa ja monimutkais-essa liiketoimintaympäristössä perustuu ennakoivaan strategiaan. Tutkimuksen tavoitteena on tunnistaa ja kehittää operatiivista kilpailukykyä kestävällä tavalla. Kestävä kilpailuetu muodostuu kilpailukykyisen liiketoimintastrategian hyödyntä-misestä liiketoimintatilanteiden hallinnassa. Nopeita strategioita hyödyntämällä integroidaan valmistus- ja teknologiastrategiat päätöksentekijöiden muutosjohta-misen profiileihin. Tutkimuskysymykset ovat: 1. Miten valmistustoiminnan kilpailukykyä voidaan arvioida? 2. Miten dynaamisia päätöksiä voidaan hyödyntää toiminnan hallinnassa glo-
baalissa turbulenttisessa liiketoimintaympäristössä? 3. Miten kilpailukykypotentiaalia on mahdollista kehittää kestävällä tavalla? Tutkimuskysymyksiin etsittiin vastauksia viiden artikkelin avulla ja soveltamalla systeemi- ja kontigenssiteoriaa holistisen mallin muodostamiseen. Tutkimuksessa kehitetään teoreettinen lähestymistapa mallintamiseen, jossa integroidaan ne ydintekijät, jotka vaikuttavat operatiivisen kilpailukyvyn suorituskykyyn. Eli yh-distämällä valmistusstrategia ja muutosjohtaminen yrityksen teknologiatasoon voidaan käsitteellisten analyyttisten mallien avulla arvioida kilpailukyvyn tasoa kokonaisuutena. Dynaamisen päätöksenteon tukena on hyödynnetty Sense & Respond -menetel-mää resurssiallokaatioiden optimoimiseksi ja strategioiden muokkaamiseksi ope-ratiivisen kilpailukykypotentiaalin kehittämiseksi kestävällä tavalla. Globaalissa kontekstissa tehty empiirinen tutkimus osoittaa, että kuvatun kaltainen ennakoiva toimintatapa on keskeistä kestävän kilpailuedun toteuttami-sessa. Tutkimus kokoaa yhteen aiheen teoreettisen keskustelun ja käytännön hyö-dyt toiminnan johtamisesta globaalissa turbulentissa liiketoimintaympäristössä. Asiasanat Valmistusstrategia, transformationaalinen johtaminen, teknologiastrategia, operatiivinen kilpailukyky, strateginen ketteryys, dynaamiset päätökset, ennakoiva toiminta, kestävä kilpailuetu, turbulenttinen liiketoimintaympäristö

V
Publisher Date of publication Vaasan yliopisto September 2010 Author(s) Type of publication
Selection of Articles Name and number of series
Yang Liu
Acta Wasaensia, 227 Contact information ISBN
978–952–476–314–1 ISSN 0355–2667, 1456–3738 Number of pages
Language
University of Vaasa Faculty of Technology Department of Production P.O. Box 700 FI–65101 Vaasa Finland 207 English Title of publication Implementing Sustainable Competitive Advantage for Proactive Operations in Global Turbulent Business Environments Abstract The future competitiveness of manufacturing operations under dynamic and com-plex business environments relies on forward-thinking strategies. The objective of this work is to identify and develop the operational competitiveness in a sustain-able manner by implementing Sustainable Competitive Advantage (SCA) for managing dynamic business situations. The research objective is explored through the following research questions: 1. How can competitiveness in manufacturing operations be evaluated? 2. How can dynamic decisions be utilized to manage operations in global turbu-
lent business environments? 3. How can competitiveness potential be developed in a sustainable manner? To answer the research questions, this work presents five articles and applies sys-tems and contingency theories to build a holistic system. It develops a theoretical approach to modelling and integrating the core factors which affect operational competitiveness performance, i.e. manufacturing strategy and transformational leadership with technology level, into conceptual analytical models to evaluate overall competitiveness, and utilizes Sense & Respond (S&R) for dynamic deci-sion-making to optimize resource allocations and adjust strategies in order to de-velop competitiveness potential in a sustainable manner. Such proactive operations are proposed in this study as the key to implementing SCA with empirical research carried out in a global context, which provide both theoretical significance and also practical benefit to conclude the experience of managing operations in global turbulent business environments. Keywords Manufacturing strategy, transformational leadership, technology strategy, opera-tional competitiveness, strategic agility, dynamic decisions, proactive operations, sustainable competitive advantage (SCA), turbulent business environments

VII
ACKNOWLEDGEMENTS
I would like to express my deepest gratitude to my supervisor, Prof. Josu Takala at the University of Vaasa for his constant guidance, encouragement, support and intensive examination of this dissertation. He is not only my academic advisor of my doctoral studies but also a mentor and good friend in my career and life. He has motivated me a lot in my research interest in industrial management, which has led to fruitful research work.
I would like to thank the reviewers of my dissertation, Prof. Pekka Kess from the University of Oulu, Finland and Prof. Kefan Xie from Wuhan University of Technology, China, for your very valuable feedback and comments to improve this manuscript.
My appreciation also goes to the editors and reviewers who gave valuable critique to improve my research work and publications, especially Distinguished Prof. Chinho Lin from National Cheng Kung University, Prof. Binshan Lin from Lou-isiana State University in Shreveport, Dr. Kongkiti Phusavat from Kasetsart Uni-versity, and Prof. Kristina Zgodavova from Technical University of Košice.
Many thanks to our partner universities in China for their close collaboration and joint effort in providing assistance to carry out the empirical research, particularly Dr. Shubin Si and Prof. Shudong Sun, Department of Industrial Engineering, Northwestern Polytechnical University; Dr. Yun Chen and Qian Wu, School of Management, Wuhan University of Technology; Prof. Gang Liu, Dr. Dan Chen and Yan Shi, School of Management, Shandong University; and also School of Management, Huazhong University of Science & Technology; School of Elec-tronics and Information, Tongji University; School of International Business Ad-ministration, Shanghai University of Finance and Economics.
I am grateful to Adj. Prof. Marja Naaranoja, Head of Industrial Management at the University of Vaasa who has been very helpful to improve my dissertation, and the science and publication editor Virpi Juppo and the publication secretary Tarja Salo for making this dissertation into a publishable format, as well as the researchers and staff of Industrial Management at the University of Vaasa: Prof. Tauno Kekäle, Prof. Petri Helo, Dr. Yohanes Kristianto, Rayko Toshev, Tanatip Kamdee, Ye Liu, Jussi Pennanen, Antti Kukkola, Antti Rajala, Ari Haapanen, Mikael Ehrs, Ulla Laakkonen for all kinds of help, and John Shepherd for English proofreading of the thesis; and also to my advisors Prof. Riku Jäntti at Helsinki University of Technology and Prof. Mohammed Elmusrati at the University of Vaasa for supporting my minor studies in Telecommunication Engineering.
VIII
My sincere thanks also go to my employers at Vaasa University of Applied Sci-ences, Jorma Tuominen, Dean of Technology and Communication, and Kalevi Ylinen, Head of Department of Information Technology, and all the colleagues and students who encouraged and supported me in accomplishing my doctoral studies in addition to my full time job.
Finally, I would like to thank my parents, my girlfriend and all people who sup-ported me during this most difficult time. This work could have never been achieved without your constant encouragement.
Vaasa, September 2010
Yang Liu
IX
Contents
ACKNOWLEDGEMENTS ................................................................................VII
ARTICLES........................................................................................................ XIII
1 INTRODUCTION ........................................................................................... 1 1.1 Background and objective .................................................................... 1
1.1.1 Operational competitiveness................................................ 2 1.1.2 Strategic agility .................................................................... 4 1.1.3 Sustainable competitive advantage ...................................... 5
1.2 Research questions................................................................................ 7 1.3 Review of key terms in this work ......................................................... 8 1.4 Structure of the thesis ......................................................................... 10
2 THEORETICAL FOUNDATIONS............................................................... 11 2.1 Research design .................................................................................. 11
2.1.1 Research strategy ............................................................... 11 2.1.2 Research approach ............................................................. 13 2.1.3 Research methodology....................................................... 15
2.2 Analytical models ............................................................................... 19 2.2.1 Manufacturing strategy ...................................................... 20 2.2.2 Transformational leadership with technology level........... 21 2.2.3 Overall competitiveness..................................................... 25 2.2.4 Sense and respond.............................................................. 25
2.3 Implementing sustainable competitive advantage .............................. 27
3 SUMMARY OF PUBLICATIONS ............................................................... 29 3.1 Overview of papers............................................................................. 29 3.2 Summary of individual papers............................................................ 31
3.2.1 Paper 1: Global manufacturing strategies require “dynamic engineers”? Case study in Finnish industries .... 31
3.2.2 Paper 2: Competitiveness of Chinese high-tech manufacturing companies in global context ...................... 33
3.2.3 Paper 3: Benchmarking and developing the operational competitiveness of Chinese state-owned manufacturing enterprises in a global context............................................ 36
3.2.4 Paper 4: Modelling and evaluation of operational competitiveness of manufacturing enterprises................... 37
3.2.5 Paper 5: Competitiveness development of Chinese manufacturing enterprises in global context for crisis management.............................................................. 39
4 EMPIRICAL RESEARCH ............................................................................ 41 4.1 Overview of analysis process ............................................................. 41
X
4.2 Data processing and analysis...............................................................42 4.2.1 AHP analysis of raw data ...................................................42 4.2.2 Analytical evaluation of MSI and TLI ...............................43 4.2.3 Correlation analysis of MSI vs TLI....................................44 4.2.4 Development analysis of OCI potential..............................46
4.3 Findings ...............................................................................................49 4.3.1 Performance of MSI ...........................................................49 4.3.2 Performance of TLI ............................................................49 4.3.3 Performance of MSI vs TLI................................................50 4.3.4 Performance of OCI............................................................51
4.4 Summary .............................................................................................51
5 DISCUSSION AND CONCLUSIONS ..........................................................52 5.1 Findings and contributions ..................................................................52 5.2 Theoretical and practical implications.................................................54 5.3 Validity and reliability.........................................................................54 5.4 Research limitations ............................................................................55 5.5 Future research ....................................................................................56
REFERENCES .....................................................................................................58
APPENDICES ......................................................................................................69 Appendix A: Questionnaires...........................................................................69
A.1 Manufacturing strategy.......................................................69 A.2 Transformational leadership with technology level ...........71 A.3 Sense and respond ..............................................................76
Appendix B: Matlab code...............................................................................78 Appendix C: Articles ......................................................................................85
C.1 Paper 1: Global manufacturing strategies require “dynamic engineers”? Case study in Finnish industries.....85
C.2 Paper 2: Competitiveness of Chinese high-tech manufacturing companies in global context.....................105
C.3 Paper 3: Benchmarking and developing the operational competitiveness of Chinese state-owned manufacturing enterprises in a global context ..........................................123
C.4 Paper 4: Modelling and evaluation of operational competitiveness of manufacturing enterprises .................145
C.5 Paper 5: Competitiveness development of Chinese manufacturing enterprises in global context for crisis management ............................................................165
XI
Figures
Figure 1. Implementation of SCA................................................................... 28 Figure 2. Logical connections between the papers ......................................... 30 Figure 3. Flowchart for empirical research..................................................... 41 Figure 4. MSI vs TLI of case companies in China ......................................... 44 Figure 5. MSI vs TLI of case companies in Finland....................................... 44 Figure 6. MSI vs TLI of case companies in Slovakia..................................... 45 Figure 7. MSI vs TLI of case companies in Spain.......................................... 45 Figure 8. MSI vs TLI of case companies in Iceland ....................................... 45 Figure 9. Linear regression functions of sorted MSI and TLI ........................ 47 Figure 10. OCI case comparisons before, during, and after crisis .................... 48 Figure 11. Improved OCI during crisis with case comparisons........................ 48
Tables
Table 1. Assessment of trustworthiness ........................................................ 18 Table 2. How TI affects RI under different business situations .................... 23 Table 3. Overview of novelty of papers and author’s contributions ............. 29 Table 4. Relevance of papers to research questions ...................................... 30 Table 5. Evaluation results of MSI................................................................ 42 Table 6. Evaluation results of TLI................................................................. 43 Table 7. Sorted MSI and TLI......................................................................... 47
Abbreviations
A Analyzer AC After Crisis AHP Analytic Hierarchy Process BC Before Crisis BS Basic technology BT Building Trust and confidence C Cost CEO Chief Executive Officer CFI Critical Factor Index CHIMC Chinese High-tech International Manufacturing Company CHIRDC Chinese High-tech Independent Research Development Company CHRMC Chinese High-tech Regional Manufacturing Company CL Controlling Leadership CLMME Chinese Large and Medium-sized Manufacturing Enterprise CR Core technology CSOME Chinese State-Owned Manufacturing Enterprise
XII
D Defender DC During Crisis DL Deep Leadership EE Extra Effort EF Effectiveness F Flexibility GDP Gross Domestic Product GMSS Global Manufacturing Strategies IC Individualized Consideration ICR Inconsistency Ratio IM Inspirational Motivation IS Intellectual Stimulation IT Information systems LI Leadership behaviour Index / Leadership Index MSI Manufacturing Strategy Index OCI Overall Competitiveness Index OI Outcome direction Index / Outcome Index OR Organization (groups, teams) P Prospector PC Processes PL Passive Leadership PT People, Technology and know-how Q Quality R Reactor R&D Research and Development RAL Responsiveness, Agility and Leanness RBL Research Based Learning RI Resource allocation Index / Resource Index RQ Research Question S&R Sense and Respond SA Satisfaction SCA Sustainable Competitive Advantage SH Spearhead technology T Time (delivery) TI Technology level Index / Technology Index TLI Total Leadership Index
XIII
ARTICLES
[1] Josu Takala, Jarkko Hirvelä, Yang Liu, Dušan Malindžák (2007). Global
manufacturing strategies require “dynamic engineers”?: Case study in Finnish industries. Industrial Management & Data Systems, Vol. 107, No. 3, pp. 326-344, Emerald Group Publishing Limited, Bingley, UK, ISSN 0263-5577........................................................................................ 85
[2] Shubin Si, Josu Takala, Yang Liu (2009). Competitiveness of Chinese high-tech manufacturing companies in global context. Industrial Management & Data Systems, Vol. 109, No. 3, pp. 404-424, Emerald Group Publishing Limited, Bingley, UK, ISSN 0263-5577. .................. 105
[3] Shubin Si, Yang Liu, Josu Takala, Shudong Sun (2010). Benchmarking and developing the operational competitiveness of Chinese state-owned manufacturing enterprises in a global context. International Journal of Innovation and Learning, Vol. 7, No. 2, pp. 202-222, Inderscience Publishers, Geneva, Switzerland, ISSN 1471-8197................................ 123
[4] Yang Liu, Josu Takala (2009). Modelling and evaluation of operational competitiveness of manufacturing enterprises. Quality Innovation Prosperity, Vol. XIII, No. 2, pp. 1-19, Technical University of Košice, Košice, Slovakia, ISSN 1335-1745......................................................... 145
[5] Yang Liu, Josu Takala (2010). Competitiveness development of Chinese manufacturing enterprises in global context for crisis management. International Journal of Management and Enterprise Development, Vol. 9, No. 1, pp. 87-115, Inderscience Publishers, Geneva, Switzerland, ISSN 1468-4330...................................................................................... 165

1 INTRODUCTION
1.1 Background and objective
From an economic perspective the future never seems clear, but high performance businesses have the ability to navigate through uncertainty and emerge ever stronger. How do they do it? Experience on the world’s most successful compa-nies shows that winners follow certain common principles. Companies that come through strongest actually use economic disruption to improve their competitive-ness. This study aims to find out how to make this possible.
The future competitiveness of manufacturing operations under dynamic and com-plex business situations relies on forward-thinking strategies. The objective of this work is to identify and develop operational competitiveness in a sustainable manner and implement sustainable competitive advantage (SCA) by integrating manufacturing and technology strategies with the transformational leadership profiles of decision makers in order to manage proactive operations in global tur-bulent business environments such as the current global economic crisis, which has badly hit the whole world’s economy.
This study aims to create integrative methods, techniques and tools to analyze the development of operational competitiveness in global context. These include e.g. the following:
Observation and evaluation of operational strategy excellence and transforma-tional leadership to support decision-making processes.
Scenario analysis of the development of business environments and methods in order to identify success factors of new business concepts with dynamic deci-sion-making to optimize resource allocations by sense & respond methodol-ogy, and by integrating manufacturing strategy with transformational leader-ship and technology level to evaluate and benchmark overall operational com-petitiveness in technology and knowledge intensive business areas.
Methods and tools for identifying success factors in developing the operational competitiveness under turbulent business situations in a sustainable manner against the highest benchmarks in the world, which may include e.g. situ-ational or long term success in dealing with global economic crisis and emerg-ing more competitive.
2 Acta Wasaensia
1.1.1 Operational competitiveness
The strategic importance of manufacturing or operations has long been recognised by Skinner (1974). The theoretical reference framework for competitiveness in manufacturing operations starts from the resource-based view of a firm for case study (Wernerfelt 1984; Menguc, Auh & Shih 2007). Since 1970s the competitive strategies in manufacturing have changed dramatically from focused to multi-focused competitive priorities (Wheelwright 1978). Companies should typically utilize multi-focused competitive strategies in a holistic way based on their busi-ness strategies (Porter 1980). Competitive priorities belong to the first phase of manufacturing strategies, which act as the bridge between business strategy and the manufacturing objectives (Kim & Arnold 1996). Competitive priorities are the crucial decisive variables to manage manufacturing operations in a global context and indicate strategies emphasizing the development of certain manufacturing capabilities that improve operational competitiveness. Takala (2002) presents a justification of multi-focused manufacturing strategies. Miles & Snow (1978) define four company groups which include prospector, analyzer, defender and reactor. They suggest that in contrast to the three stable groups, which are pros-pector, analyzer and defender, reactor does not lead to a consistent and stable or-ganization and it is advised that the company changes over to one of the other three stable groups. Therefore this research focuses on these three stable groups and will leave reactor in future research. Based on this theory, Takala et al. (2007b) introduce unique analytical models to evaluate global competitiveness rankings for manufacturing strategies in prospector, analyzer and defender groups according to the multi-criteria priority weights of Q (Quality), C (Cost), T (Time/delivery) and F (Flexibility), which the companies can and must have such high performances simultaneously (Gerwin 1993). Such analytical models are used to gain insight into the influences and sensitivities of various parameters and processes in the alteration of manufacturing strategies. In China, the most dy-namic market, Liu et al. (2008) for the first time have applied such analytical models to analyze and improve the operational competitiveness by adjusting competitive priorities in the manufacturing strategy. Si, Takala & Liu (2009), Liu, Si & Takala (2009), and Liu & Takala (2009a; 2010a) compare the operational competitiveness strategies in China and other countries in the global context by utilizing the same analytical models in order to analyze different characteristics of manufacturing strategies in different markets and suggest how companies can improve their operational competitiveness. But the adjustment of manufacturing strategy alone is not enough to improve the overall competitiveness in developing the business in new business situations. Burns (1978) differentiates transaction and transformational leadership. Transactional leaders lead through social ex-change, like politicians lead by exchanging one thing for another. Transforma-
Acta Wasaensia 3
tional leaders are those who stimulate and inspire followers to both achieve ex-traordinary outcomes and develop their own leadership capacity. Burns (2003) defines transformational leadership as a process where leaders and followers en-gage in a mutual process of raising one another to higher levels of morality and motivation. His view is that transformational leadership is more effective than transactional leadership, where the appeal is to more selfish concerns. An appeal to social values thus encourages people to collaborate, rather than working as in-dividuals and potentially competitively with one another. He also views transfor-mational leadership as an ongoing process rather than the discrete exchanges of the transactional approach. Menguc et al. (2007) suggest that improvements in transformational leadership based competencies should lead to marketplace posi-tional advantages through competitive strategies. Therefore, manufacturing strat-egy is one important factor and transformational leadership is another essential factor in improving overall competitiveness, whether in prosperity or adversity, and the latter can be even more decisive (Bass 1985). Bass & Avolio (1994) pro-vide evidence of the benefits and effectiveness of transformational leadership in terms of leadership and the training of leaders. Transformational leaders help their subordinates to learn and develop as individuals by encouraging and motivating them with a versatile repertoire of behavioural and decision-making capability (Bass & Avolio 1994; Bass 1997). Takala et al. (2008) introduce unique analyti-cal models to evaluate the level of outcome direction, leadership behaviour and resource allocation of transformational leadership. Tracey, Vonderembse & Lim (1999) suggest that organizations must formulate strategic plans that are consis-tent with the use of manufacturing technology to be successful in this globally competitive and rapidly changing environment. O’Regan & Ghobadian (2005) suggest that the level of technology deployed will impact on the overall strategic planning process and its main drivers: leadership and organisational culture re-sulting in differing levels of corporate performance. Moore (1991) describes the chasm theory that technology-based products require marketing strategies that differ from those in other industries, and explores marketing stages through a dis-cussion of the “Technology Adoption Life Cycle” which follows a product from birth to death and suggests a course of action for each phase as high-tech compa-nies engage in traditional business strategies (i.e. strategic partnerships, competi-tive advantage, positioning, and organizational leadership). Moore (1995) extends his “Technology Adoption Life Cycle” model to incorporate three distinct main-stream market stages, i.e. a pre-hypergrowth era of niche markets, the mass- mar-ket phenomenon of hypergrowth itself and a post-hypergrowth era of mass cus-tomization. Moore (2004) details market dynamics of hypergrowth, and explains how to pool resources, gain supporters during pre-tornado phase, then how to unleash them once the tornado hits. Based on these three stages, in this study three different technology levels are proposed to be adopted in technology strat-
4 Acta Wasaensia
egy. From these implications, transformational leadership is in this study further extended by integrating with technology strategy as part of resource allocation , in which technology level is classified as spearhead technology used mainly for pre-hypergrowth, core technology used mainly for mass-hypergrowth, and basic tech-nology used mainly for post-hypergrowth. The objective here is to create a holis-tic model to integrate together manufacturing strategy and transformational lead-ership with technology level, for a more comprehensive evaluation of overall competitiveness in identifying and developing operational competitiveness poten-tial in a sustainable manner.
To validate the created analytical models, the empirical research continues case studies in several countries with deeper insight analysis of the overall competi-tiveness of manufacturing enterprises and suggests how to make dynamic adjust-ments in order to improve operational competitiveness potential to manage in turbulent business situations such as global financial crisis. The related case stud-ies include benchmarking and development of the overall competitiveness of mul-tiple case companies in a global context, which emphasize more proactive opera-tions to improve competitiveness potential in regional and global markets during economic crisis and forecasting ongoing business in economic upturn after crisis.
1.1.2 Strategic agility
Olli-Pekka Kallasvuo, Nokia’s CEO captures well the need for strategic agility in an interview in the Financial Times, 4 December 2006: “Five to ten years ago you would set your vision and strategy and then start following it. That does not work any more. Now you have to be alert every day, week and month to renew your strategy.” (Young 2008). According to Doz & Kosonen (2008), companies have traditionally responded to change through strategic planning and the foresight offered by scenarios, or through corporate ventures and entrepreneurial drive. Today’s change is both fast, where ventures can provide an answer, and also complex, in the sense that it results from multiple hard-to-forecast systemic inter-actions, where strategic planning no longer fits because change is fast and unpre-dictable. The list of industries engulfed by fast complex strategic change grows longer every day, and so does the need for strategic agility. The key idea of fast strategy is strategic agility. Doz & Kosonen (2008) define strategic agility as the ability to continuously adjust and adapt strategic direction in core business, as a function of strategic ambitions and changing circumstances, and to create not just new product and services, but also new business models and innovative ways to create value for a company. Three key dimensions of strategic agility for enabling capabilities are defined:
Acta Wasaensia 5
Strategic sensitivity: both the sharpness of perception and the intensity of awareness and attention. Forecasting is only as good as our ability to under-stand an environment and react to it (Kast & Rosenzweig 1985). Strategy can-not be based only on exceptional forecasting. Companies need more informa-tion, and it must be learnt fast to adjust to the changes of business situations like the influence of a global economic crisis. Fast operation by fast learning with innovative adaptation is the competitive weapon No. 1 (Bogan & English 1994).
Resource fluidity: the internal capability to reconfigure business systems and redeploy resources rapidly. Rapid changes in resource allocations are challeng-ing.
Collective commitment: the ability of the top team to make bold decisions fast, without being bogged down in win-lose politics at the top. The corporation needs communicative culture with value creation and each business needs to be strong but still collaborative with joint commitments. Where strategic agil-ity is needed most is also the most difficult place to make decisions (Berman & Hagan 2006).
The time frame of fast strategy used in this research is defined from some months up to one year, to deal with turbulent business situations such as major economic crises which last from around one year up to some years. The reactions needed for strategic agility is of course much faster than the changes of the business envi-ronments, which means that the organizations must also change accordingly, as Chandler (1962) claims that the structure follows the strategy. When strategy is changed fast in an agile manner, the structure has to follow. However the time frame of changing frequency defined in this research suggests that it is still slower than forming a reactor type of organization. Therefore the main focus is to study the agile changing between the three stable groups which are prospector, analyzer and defender. This research does not study very fast reactor behaviour but it is proposed as another promising group to be studied more in future research.
1.1.3 Sustainable competitive advantage
Competitive advantage has been studied strongly ever since 1980s (Porter 1980; 1985). According to Porter (1985), the only competitive global business strategies would be based on differentiation by unique specialization in terms of quality or product or service technology or cost leadership. When Peters & Waterman (1982) effectively introduce the world of business to the notion of excellence per se, the unwavering pursuit of excellence provides the basis for an unmatchable
6 Acta Wasaensia
competitive advantage. Peters (2010) claims that “excellence in execution” was, is, wherever, and forever will be sustainable competitive advantage (SCA) No. 1. Hayes & Wheelwright (1984) and Hayes, Wheelwright & Clark (1988) strongly recommend a high level of involvement by manufacturing managers in the strate-gic planning process of business units for the attainment of superior competitive performance. Wernerfelt (1984) and Barney (1991) derive SCA from the re-sources and capabilities that must have four attributes: valuable, rare, imperfectly imitable and not substitutable. Avella, Fernández & Vázquez (2001) consider that the emphasis on certain manufacturing competitive priorities or capabilities and decisions or practices on the key decision areas and their internal coherence can be the base for achieving sustainable or lasting advantage over competitors, thus producing superior business performance. Barney, Wright & Ketchen (2001) sug-gest SCA as a resource-based strategy, which evidently is a very powerful busi-ness strategy today. Firms that can sustain their competitive advantage are able to outperform others in the long run.
The critical issue is to discover attractive industries with a low level of rivalry. A firm gains and sustains competitive advantage by implementing strategies that meet customer demands through the exploitation of rare and costly-to-imitate capabilities such as unique history or unique resources, close relationships with suppliers and customers and relationship with its employees. For example cost leadership strategy means significant cost disadvantage for competitors trying to imitate the successful firm’s resources, and product differentiation strategy means added value, enabling firms to charge prices higher than the firm’s average total costs. In dynamic, rapidly changing markets the development is so fast that SCA is not necessarily possible. SCA may not last forever, and if the markets change radically the capabilities that were valuable may no longer be valuable, which means the redesign of SCA is needed.
SCA is conceptualized as: whether the firm has gained superior financial and market advantages (Day & Wensley 1988) and whether it is possible for competi-tors to duplicate the firm’s competitive strategy (Barney 1991; Grant 1991) and distinctive capabilities on which advantages have been founded (Grant 1991; Hall 1993). There are different views on how to gain SCA for firms, and this topic has become an important research area in strategic management. Recent research identifies varies sources of SCA by developing from many aspects, such as par-ticular core competency (Fiol 2001), global resources (Fahy 2002), knowledge and competence (Lubit 2001; Johannessen & Olsen 2003), marketing innovation (Ren, Xie & Krabbendam 2009), positive psychological capital (Toor & Ofori 2010), etc.
Acta Wasaensia 7
In this work, SCA is identified as the advantage to implement fast strategies by fast learning, and a unique SCA is proposed. With years of research in global manufacturing strategy, operational competitiveness analysis, transformational leadership and resource allocation options based on sense & respond methodol-ogy to evaluate and develop operational competitiveness and transformational capabilities, previous work is connected to this work by taking the impact of the global financial crisis into account, and evaluating how manufacturing companies are able to manage in such crisis situations by adjusting their manufacturing strat-egy and transformational leadership with technology level to improve operational performance. All these areas have been studied separately but this integration is novel. Such strategic adjustments and transformational capabilities of an organi-zation are proposed in this research as unique SCA for proactive operations in global turbulent business environments.
1.2 Research questions
From the background and objectives, the following research questions (RQ) can be formulated: RQ1. How can competitiveness in manufacturing operations be evaluated? RQ2. How can dynamic decisions be utilized to manage operations in global
turbulent business environments? RQ3. How can competitiveness potential be developed in a sustainable manner?
To answer these research questions, this work starts from studies and analysis of multi-criteria competitiveness priorities in manufacturing operations. Then based on these, it develops a theoretical approach to modelling and integrating the core factors which affect the operational competitiveness performance, i.e. manufac-turing strategy and transformational leadership with technology level into concep-tual analytical models to evaluate overall competitiveness performance, and through sense & respond for dynamic decisions to optimize resource allocations and adjust strategies in order to improve operational competitiveness potential in a sustainable manner. The answers to the research questions also explain how to identify and connect the evaluation of overall competitiveness performance with the implementation of SCA to deal with global turbulent business environments.
To validate the answers, through empirical research the developed analytical models are tested with case studies internationally in terms of how they can in practice improve the operational competitiveness under dynamic and unforeseen business situations such as dealing with economic crisis and expanding the busi-ness in a global context.
8 Acta Wasaensia
1.3 Review of key terms in this work
Implementation – Crittenden and Crittenden (2008) propose that implementation is a critical cornerstone or ally in the building of a capable organization, and the use of the appropriate levers of implementation is the pivotal hinge in the devel-opment of the organization. Brenes, Mena & Molina (2008) put forwards five dimensions of analysis having an impact on the implementation of business strat-egy which are strategy formulation process, systematic execution, implementation control and follow-up, CEO’s leadership and suitable, motivated management and employees, and, finally, corporate governance (board and shareholders) leading the change. Haugen & Davis (2010) suggest that strategy implementation is es-sential to organizational transformation and the development of competitive ad-vantage. Other recent research also addresses the importance of strategy imple-mentation (O’Reilly et al. 2010; Lin & Hsieh 2010). Slater, Olson & Hult (2010) argue that effective strategy implementation is at least as important as, if not more important than, developing a brilliant strategy, and business success requires a fit between strategy and organizational architecture. Implementation of strategies in this work mainly involves the identification of SCA and how to realize the pro-posed SCA by evaluating and developing the required core factors in decision-making processes with real market tests in weak form and even semi-strong form based on Kasanen, Lukka & Siitonen (1993). However the real challenges of the implementation requiring changes in the organizations are not addressed as main objective here but will be studied in future research.
Sustainability – Carraher, Buckley & Carraher (2008) examine some of the major challenges in performing research on sustainable strategic management with an emphasis on accurately assessing the extent to which strategies actually result in true organizational change. Galbreath (2009) adds to the strategy-sustainability discussion and explains a conceptual framework that addresses sustainability. Coombs (2010) views the sustainability challenges as one means by which sus-tainability connects with crisis management. Taneja, Pryor & Zhang (2010) sug-gest that crisis management is a strategic and tactical leadership imperative which can positively or negatively impact an organisation’s or a nation’s competitive capability and potential for long-term success, survival, and sustainability. In this work the sustainable strategic development is considered as the key to manage turbulent situations such as economic crisis.
Competition – Competition is the battle between businesses to win consumer ac-ceptance and loyalty. It is the intra- or inter-market rivalry between businesses trying to obtain a larger market share. Karuna (2007) suggests that competition can reflect several dimensions: product substitutability, market size, and entry
Acta Wasaensia 9
costs, given the level of industry concentration. Tang (2006) identifies four main indicators for competition, which is associated with a firm’s competitive envi-ronment: easy substitution of products, constant arrival of competing products, quick obsolescence of products, and rapid change of production technologies. Tjosvold et al. (2006) indicate that internal motivation to compete and the strat-egy of competing fairly are found to be the most powerful influences on the con-structiveness of competition. In this work, competition refers to same common objectives, such as to achieve better market position and financial goals etc, espe-cially from the case companies’ points of view.
Proactive operations – Haro-Domínguez, Ortega-Egea & Tamayo-Torres (2010) show that the proactive characters adopted by managers directly influence the decision-making process, and success in this kind of decision is of vital impor-tance to the firm. Tsai, Chou & Kuo (2008) indicate that responsive and proactive market orientations are important determinants of new product performance. Srinivasan, Rangaswamy & Lilien (2005) propose proactive marketing in a reces-sion as an opportunity and development and execution of a response to capitalize on the perceived opportunity created by the change, and show that firms which have a proactive marketing response in a recession achieve superior business per-formance even during the recession. This is closely related to the background of this work, as some firms view recessions as opportunities to strengthen their busi-nesses, invest aggressively and establish their advantage over their weaker com-petitors, whereas others cut back, waiting for the recession to pass. This work proposes that the key of proactive operations is measuring and adjusting strategies fast all the time, and then it investigates the performance of such proactive opera-tions especially in recession.
Global business – Jeannet (2007) claims that global business causes increasing complexity in strategies and strategy developments. Samiee (2008) suggests that numerous changes in the global business climate have intensified global competi-tion through new forms of competition as well as the addition of new competitors, and as a result domestic and international firms have to develop and implement new strategies that are aligned with the current global competitive realities. Ham-ilton (2009) proposes a framework that offers positioning and revitalizing ap-proaches by which high performing global businesses may strategically meet their global business challenges to capture business competitiveness and yield addi-tional benefit to the global business. In this work the main objective is how to locate traditional manufacturing operations in an operationally competitive way, so the global business refers to global traditional manufacturing industries, and how to develop competitive strategies for their global operations.
10 Acta Wasaensia
Turbulent business environment – The business environment addresses manage-rial issues in the social, political, economic, competitive, and technological envi-ronments of business. Suikki, Tromstedt & Haapasalo (2006) propose that today’s turbulent business environment characterized by uncertainty and inability to pre-dict the future is extremely challenging, and thus requires the development of new competences. Chong (2004) outlines a practical approach to improving organiza-tional crisis-preparedness in today’s highly uncertain and turbulent business envi-ronment and also suggests that crisis management is a critical component of con-temporary strategic management. In this work the business environment is de-fined mainly as operations under economic crisis, more specifically it refers to a turbulent business environment which is dynamic and frequently changing within a time frame from some months up to one year, under heavy influences of global financial crisis, “China effect” and governmental behaviour (Takala et al. 2007a; Liu & Takala 2010b).
1.4 Structure of the thesis
The structure of this thesis is divided into five chapters as follows.
Chapter 1 introduces the background and objective of this research, where a gen-eral description of the work is presented. Then the three research questions are formulated from the research scope and key terms are reviewed for this research.
Chapter 2 describes theoretical foundations, where the research design, analytical models and implementation of SCA are presented in detail.
Chapter 3 summarizes all five selected publications included in this thesis. It pro-vides an overall and also summary of each publication.
Chapter 4 is dedicated to the empirical research, where a complete example of a case study is presented thoroughly to demonstrate the methods and applicability of the theories created in this work. The related analysis and findings of this case study are also presented.
Chapter 5 presents general discussion and conclusions. It concludes the main findings and contributions, theoretical and practical implications, validity and reliability, research limitations and also recommendations for further research.
Acta Wasaensia 11
2 THEORETICAL FOUNDATIONS
2.1 Research design
2.1.1 Research strategy
In general, research strategy is based on epistemology and ontology, which are the relevance of philosophy to the practice of research. Epistemology means the-ory of knowledge, which examines what is the new knowledge to be created or developed. According to Hirschheim, Klein & Lyytinen (1995: 20) epistemology denotes the nature of human knowledge and understanding that can possibly be acquired through different types of inquiry and alternative methods of investiga-tion. Ontology examines how new knowledge is acquired in general. Wand & Weber (1993: 220) refer to ontology as a branch of philosophy concerned with articulating the nature and structure of the world. Kuhn (1996) defines a scientific paradigm as what is to be observed and scrutinized, the kind of questions that should be asked and answers obtained in relation to this subject, how these ques-tions are to be put, and how the results of scientific investigations should be inter-preted. Guba & Lincoln (1994) categorize alternative inquiry paradigms accord-ing to their stance on the following three types of questions: the ontological ques-tion seeks what is the form and nature of reality and therefore what is there that can be known about it; the epistemological question seeks what is the nature of the relationship between the knower or would-be knower and what can be known; and the methodological question seeks how the inquirer can go about finding out whatever he or she believes can be known.
The epistemological viewpoint of this research will focus on what is the new knowledge to be developed, which is the integration of the analytical models of manufacturing strategy and transformational leadership with technology level together to implement fast strategies as the SCA for proactive operations. This new knowledge is more and more demanded thanks to the need of agile strategies and global operations in a turbulent business environment, as more and more complex and forward thinking operations must be planned beforehand. The onto-logical viewpoint of this research will focus on what to be studied, how to acquire and describe the new knowledge, which in practice is to study how to make the integration framework through empirical research, with assumption that this model is to deal with major economic crises which last from around one year up to some years.
12 Acta Wasaensia
Bryman (2004) suggests the nature of logical relationship between theory and research is deduction where theory guides research, and induction where theory is an outcome of research. Kovács & Spens (2005) review deduction, induction and abduction, their possibilities and implications for research. Deduction follows a conscious direction from a general law to a specific case, using theory to create hypotheses or provisional statements that are then tested in the field. It scans the-ory e.g. in a literature review, derives logical conclusions from this theory and presents them in the form of hypotheses or propositions, tests these in an empiri-cal setting and then presents its general conclusions based on the corroboration or falsification of its self-generated hypotheses or propositions. Induction reasons through moving from a specific case or a collection of observations to general law, using individual cases in building a more general theory. It follows the oppo-site path of deduction, where the knowledge of a general frame or literature is not definitely necessary. Instead, observations about the world will lead to emerging propositions and their generalization in a theoretical frame. Abduction neither follows the pattern of pure deduction nor of pure induction. The logical sequence of deduction is from rule to case to result, and induction is from case to result to rule, whereas abduction follows another process – from rule to result to case (Taylor, Fisher & Dufresne 2002; Danermark 2001). This work uses mainly de-duction to test and evaluate the analytical models in empirical research by carry-ing out case studies internationally. It also uses some induction to build theory from case study research (Wilson & Vlosky 1997), for example the integration of individual models of manufacturing strategy, transformational leadership and technology level to construct a holistic model of overall competitiveness perform-ance and using sense & respond to develop competitiveness potential, and addi-tionally in the finding of the analyzer group being the most competitive group during economic crisis from the analysis of manufacturing strategy adjustments.
There are various types of strategies for conducting research in management and social sciences. Research strategies are categorized e.g. as bridge, transfer, appli-cation and their characteristics can be event-based, systemic and analytic (Reis-man 1988; Arbnor & Bjerke 1994, 1997). Reisman (1988) introduces concepts such as ripple strategy, embedding strategy, bridging strategy, transfer of technol-ogy strategy, creative application strategy, structuring strategy, and empirical validation strategy. This work uses mainly the following research strategies. Rip-ple strategy is used to develop analytical models based on analysis and evaluation of multi-focused competitiveness priorities. Embedding strategy and bridging strategy are used to integrate the analytical models of core factors which affect operational competitiveness, such as manufacturing strategy and transformational leadership with technology level, using sense & respond to develop overall com-petitiveness potential for proactive operations. Empirical validation strategy is

Acta Wasaensia 13
used to validate the developed analytical models and theories by performing em-pirical studies in several different countries. The characteristics of the research strategies used in this work are mainly systemic and analytic.
Eisenhardt (1989) describes case study as a research strategy for building theories which focus on understanding the dynamics present within single settings. Wilson & Vlosky (1997) apply such philosophy in a similar way for more detailed and profiled constructions for the implementation of manufacturing strategies in part-nering relationships. Situational case studies, under dynamic business conditions, can effectively be carried out by building inductively new theories by hermeneu-tic case study research. These mostly qualitative case studies can be realized in a reliable way by using Sykes’s (1990; 1991) idea about “careful documentation” of the cases. Yin (1994) describes the design of case study research. The validity and reliability in experimental research design are also addressed in the design of case study research which is supported by qualitative (Sykes 1991) and quantita-tive analytical methods as well. Robson (1993) suggests that designing a case study needs the following: conceptual framework, research questions, sampling strategy, data collection methods and instruments. Case studies for the empirical research work in this study are therefore designed based on all these points.
2.1.2 Research approach
Arbnor & Bjerke (1997) describe the creation of a methodological approach as a process of combining the theory of science and methodology. Systems thinking is a holistic way of thinking, applied in the systems sciences, by which the observer considers the part of reality he observes as a system (Kast & Rosenzweig 1972; Kramer & De Smit 1977). Contingency theory is a class of behavioural theory that claims that there is no best way to organize a corporation, to lead a company, or to make decisions, but instead, the optimal course of action is contingent upon the internal and external situation (Kast & Rosenzweig 1985). Holweg (2005) applies the systems approach and contingency theory to review existing contribu-tions and synthesises them into a conceptual model identifying the key factors of responsiveness, which is very similar to the nature of this work. Therefore this work is proposed to be carried out by systems and contingency based approach.
Kasanen, Lukka & Siitonen (1991; 1993) propose and describe the constructive approach to management accounting research as “problem-solving through the construction of organizational procedures or models”. In this work the construct is the integrative holistic system. Kasanen, Lukka & Siitonen (1993) also propose a market-based validation for assessing this aspect of a construction and have de-veloped a market test based on the concept of innovation diffusion as follows.
14 Acta Wasaensia
Weak market test refers to whether any manager has been willing to apply the construction in question in actual decision making. Semi-strong market test refers to whether the construction has become widely adopted by companies. Strong market test refers to whether the business units applying the construction system-atically have produced better than those are not using it. For this work it is feasi-ble to apply constructive research approach with at least weak market test and even semi-strong market test to validate and implement the research objectives.
The action research of this work to interact with case companies to identify and implement SCA is considered as a kind of consulting service through which the acts of consultant are applied to an organization. The role of the researcher in the ontology (objectivity/subjectivity) discussion is considered as that of a consultant. Schein (1988) argues that there are three specific categories or models that define the role of the consultant in the modern organization. These models include (a) purchase of expertise, (b) doctor-patient, and (c) process consultation. Depending on the organizational scenario, one or more of these models may be applied to different changes in the organizational setting (Schein 1987; 1988; 1992; 1999). Schein (1988) defines the first role of the consultation as purchase of expertise model and specifically Schein (1999) describes this model as one in which the client hires the consultant to bring a separate and autonomous perspective on the industry or company setting to the issues that exist (Canback 1998; 1999). The doctor-patient model is another form of consultation outlined by Schein (1988), which is linked to a close relationship between the consultant and the organiza-tional leadership and the application of an individualized diagnostic process. In this relationship, the consultant works as the “doctor”, diagnosing the individual problems of the client and then uses a systematic approach based on his/her own experiences to create a plan for change (Canback 1998; 1999). In the process con-sultation model, the consultant acts as a facilitator by providing the client with methodological tools for assessing or defining the problem and locating the best potential solutions (Canback 1998; 1999). The consultant works with the organi-zation to find internal methods for resolving the issues and for implementing change, utilizing existing resources within the organization. This work uses the latter two models to allow effective interaction between the empirical studies of the case companies and the research theories.
In summary, this work is developed based on all the previous research. First, it utilizes a theoretical approach of modelling the core factors which influence the operational competitiveness performance, i.e. manufacturing strategy and trans-formational leadership with technology level into conceptual analytical models in order to evaluate overall competitiveness. Then, the proposed analytical models are used in the empirical research for evaluating and developing the operational
Acta Wasaensia 15
competitiveness potential of the case companies under dynamic and unforeseen business situations such as dealing with the economic crisis and expanding the business in a global context. Finally, the case companies in various countries are evaluated with the proposed analytical models and their performances are bench-marked in a global context to conclude the experience of managing operations in global turbulent business environments.
2.1.3 Research methodology
As the main contribution of this study is the integration of manufacturing strategy and transformational leadership with technology level, it requires a new design in the research methodology that how to use the classic methods to integrate. The new method utilizes pairwise comparisons with analytic hierarchy process (AHP), which is a structured technique for dealing with complex decisions, to interview the experts in case studies in order to prioritize their decisions. The research methods include literature survey, descriptive conceptual analysis, analyzing qualitative data including talks, texts and interactions based on Silverman (2001) and also quantitative data, classification by simple statistics, and finally using Kasanen, Lukka & Siitonen’s (1991; 1993) constructive research approach with weak market tests and pilots for implementing the strategies.
AHP
The Analytic Hierarchy Process (AHP) method is a multi-attribute decision in-strument that allows considering quantitative, qualitative measures and making tradeoffs (Saaty 1980). The AHP is used in this study to deal with the empirical part, which includes analyzing questionnaires and calculating the weighting of the main criteria and sub-criteria. AHP is aimed at integrating different measures into a single overall score for ranking decision alternatives with pairwise comparisons of chosen attributes (Rangone 1996). It utilizes pairwise comparisons by inter-viewing the experts within the whole organization. AHP based models can com-prehensively explore the varying degrees of importance of the indicators and drivers of competitiveness (Sirikrai & Tang 2006). AHP based instruments, e.g. forms and questionnaires have been used in our previous case studies for more than 20 years in successful analysis of case companies, and some similar applica-tions of AHP are used in e.g. Zahedi (1989), Rangone (1996), Sun (2004), Banuls & Salmeron (2008), and their validity and reliability are proven. The inconsis-tency ratio (icr) is calculated to assure the internal validity of pairwise comparison results. Only matrixes with icr value of less than 0.10, and less than 0.30 in smaller groups with competent informants, can be used for reliable decision-making. Otherwise the answers are considered invalid and will not be used. Fur-
16 Acta Wasaensia
thermore, some redundant open questions are used in addition to the pairwise comparisons in the questionnaires to add more internal validity to the answers.
The procedures for utilizing AHP in the case studies are as follows. The first step is to establish the model of hierarchy structure for the goal. In this study, the hier-archy models for the evaluation of manufacturing strategy from Takala et al. (2007b) and transformational leadership from Takala et al. (2008) are constructed, and these serve as the theoretical framework. The second step is the comparison of the alternatives and the criteria. They are pairwise compared with respect to each element of the next higher level. The third step is connecting the compari-sons to obtain the priorities of the alternatives with respect to each criterion and the weights of each criterion with respect to the goal. The local priorities are then multiplied by the weights of the respective criteria. The results are summed up to get the overall priority of each alternative.
Case study
Case studies are detailed investigations of individuals, groups, institutions or other social units, which attempt to analyze the variables relevant to the subject under study. The principle difference between case studies and other research studies is that the focus of attention is the individual case and not the whole popu-lation of cases. Most studies search for what is common and pervasive. However, in the case study, the focus may not be on generalization but on understanding the particulars of that case in its complexity. A case study focuses on a bounded sys-tem, usually under natural conditions, so that the system can be understood in its own habitat (Stake 1988; 1995).
In this work the empirical research is based on carrying out numerous case studies of companies from different countries and analyzing them with existing analytical models and creating new analytical models for further evaluation. Therefore the selection of the case companies must be mostly representative, well performing and highly experienced in managing global turbulent business situations. As a result, the empirical studies are focused on case companies in the most dynamic market and best performer in crisis management – China, especially large and medium-sized manufacturing enterprises, and comparing their operational per-formances in the global context. The case companies have been chosen from the backbone industries of the Chinese economy. They cover industries including iron & steel, non-ferrous metal, mining, chemistry, construction, energy, machin-ery, equipment, research & development, service and logistics. Based on such a wide variation of industries and good performance in exercising of strategy and leadership, the chosen case companies are well representative of the industries in China in the empirical research.
Acta Wasaensia 17
For side-by-side comparisons in the performance of crisis management, a number of large and medium-sized manufacturing case companies of comparable size and in similar industries are also chosen from several European countries, including Finland, which is known for its highly competitive technologies; Slovakia, which is a manufacturing base for many European and multinational companies; Spain, which is another major European manufacturing centre; and Iceland, which has been badly hit by the economic crisis. In each country there is around 4 to 5 case companies studied. All the case studies are carried out using exactly the same methodologies, by using both basic constructions for the analysis and synthesis starting from the analysis of economies, and going on with integration, weak market tests and implementation microstructures and results of the competitive priorities in the strategies. All the case companies are represented with codes, which can be neither recognized nor speculated about as to their real names. The code used to represent case companies is composed of a two-letter country code based on International Organization for Standardization (2010) ISO 3166-1-alpha-2 code elements and two-letter identification plus a number: e.g. FI_VC-1 represents a case company in Finland and CN_WG-9 represents another case company in China. The questionnaires for all the case studies are developed based on manufacturing strategy by Takala et al. (2007b) and transformational leader-ship by Takala et al. (2008), which are listed in Appendix A.
Questionnaires, data collection and analysis
The data of case companies in different countries are collected in the same man-ner: by asking senior managers or directors to answer the questionnaires from different organizations and departments. The interviewees are normally decision makers and middle management groups in the case companies, who have good knowledge about the operations of the case companies, and the number of infor-mants is dependent on the size of the case company. The interviewed high compe-tence experts should be representative to know well the operations of the studied case company. The data collected typically from limited and described applica-tion problems is mainly qualitative in nature and its validity and reliability can be ensured by improving the required careful documentation of the cases (Sykes 1990; 1991). From the same case company inconsistent results have been left out. Firstly, the managers or directors are trained to understand every item of the ques-tionnaires correctly by interview, email or telephone. Secondly, after they finish the questionnaires, the answers are analyzed with AHP software. Thirdly, the dis-cussion with the managers or directors reveals the results and verifies the validity and reliability of the data further.
18 Acta Wasaensia
To study manufacturing strategy, the competitiveness priorities are listed in the AHP questionnaires as the main criteria, consisting of quality, cost, time/delivery, and flexibility. The main criteria are typical items used in evaluating the competi-tiveness priorities in multi-focused manufacturing strategies (Spina et al. 1996). They are formed based on typical case studies and instruments used in interviews. The sub-criteria involve 19 criteria, such as low defect rate, low cost, fast deliv-ery, broad product line, etc. The weights are statistically measured for further analysis with analytical models (Takala et al. 2007b). To study transformational leadership, the leadership profiles are empirically measured with the theoretical frame of reference by AHP questionnaires (Takala et al. 2006). Statistical tests are made to find out the logic in the leadership profiles to increase accuracy in the profiles, and in parallel the analytical models are built by induction and tested statistically to measure leadership skills by leadership indexes from resource utili-zations to leadership behaviours and finally to outcome directions and outcomes. Analytical models are further used to measure the effectiveness of leadership ac-tions within different areas of outcomes and to find out the correlation between these outcomes and leadership indexes in a forecasting way (Takala et al. 2008). To study technology level, the weights of spearhead technology, core technology, and basic technology are collected by interviewing the expert informants directly (Tuominen et al. 2003). All the collected answers are further analyzed with ana-lytical models for evaluation of operational competitiveness.
Validity and reliability
The fundamental concerns for quantitative research are validity, reliability, gener-alizability and objectivity, while for qualitative research are credibility, depend-ability, transferability and confirmability (Sinkovics, Penz & Ghauri 2008).
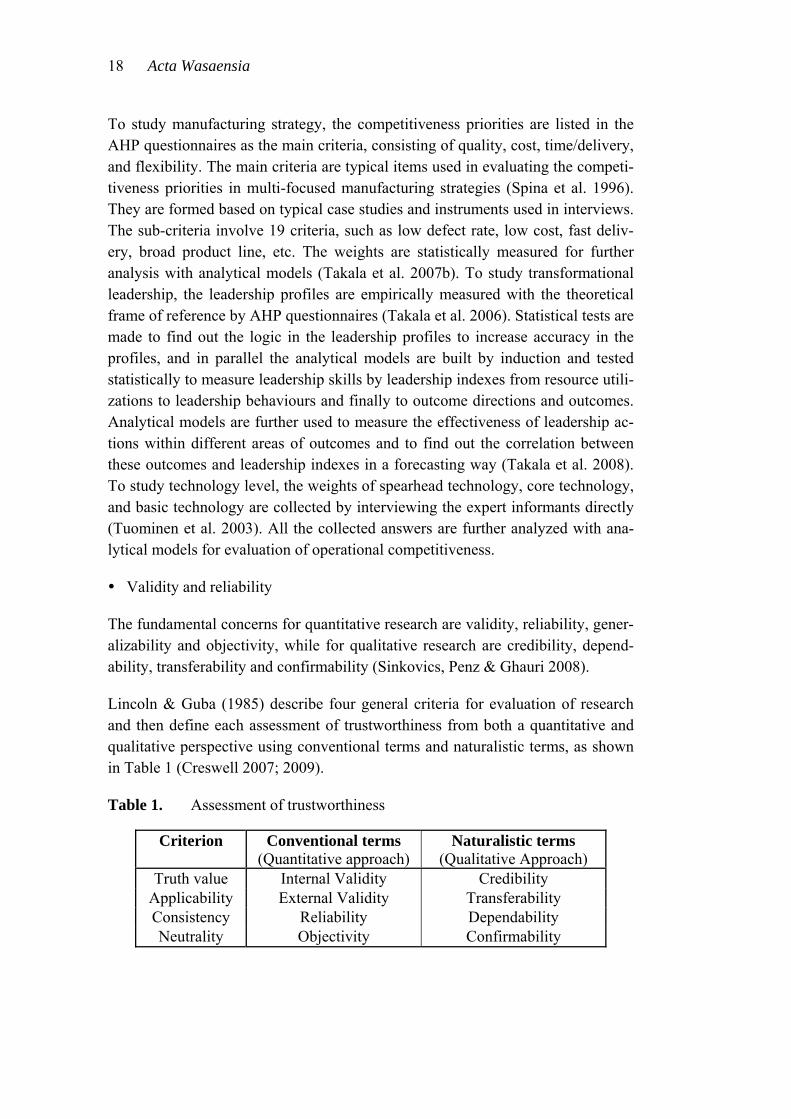
Lincoln & Guba (1985) describe four general criteria for evaluation of research and then define each assessment of trustworthiness from both a quantitative and qualitative perspective using conventional terms and naturalistic terms, as shown in Table 1 (Creswell 2007; 2009).
Table 1. Assessment of trustworthiness
Criterion Conventional terms (Quantitative approach)
Naturalistic terms (Qualitative Approach)
Truth value Internal Validity Credibility Applicability External Validity Transferability Consistency Reliability Dependability Neutrality Objectivity Confirmability
Acta Wasaensia 19
Lincoln & Guba (1985) measure the quality of quantitative research based on the conventional terms of internal validity, external validity (generalizability), reli-ability, and objectivity. Internal validity refers to the extent to which the findings accurately describe reality. External validity refers to the ability to generalize findings across different settings. Making generalizations involves a trade-off between internal and external validity. In order to make generalizable statements that apply to many contexts, one can include only limited aspects of each local context. Reliability depends on the repeatability of the procedure and minimal error among trials. Objectivity of the researcher requires external use of instru-ments and explicit methods that are not specific to the researcher. (Rapoport 2000)
Guba (1981) outlines credibility, transferability, dependability, and confirmability as naturalistic terms to assess the quality and trustworthiness of qualitative re-search based on naturalistic terms, through which the overall validity is judged. Credibility ensures that the true value of the argument emerges from the data, strengthened by triangulation and member checks. Dependability speaks to the consistency of the research, which records and overlaps data. Transferability to other settings depends on a thick description in which the similarities and differ-ences are apparent. Confirmability offers neutrality in the sense that triangulation and alternative explanations reveal avoidable biases of the researcher.
2.2 Analytical models
In this study, overall competitiveness is evaluated based on two core factors, i.e. manufacturing strategy and transformational leadership. The technology level is considered to be part of the resources of transformational leadership. The sense & respond model is used to help in dynamic decision-making to describe, evaluate, benchmark and optimize lower level resource allocations to meet the performance requirements in all the interest groups inside and outside the organization and in turn to improve higher level strategies.
Existing analytical models of manufacturing strategy and transformational leader-ship with technology level from Liu & Takala (2009b; 2010b) and the sense & respond model from Ranta & Takala (2007) are reviewed and examined. These models are integrated to develop a new holistic model to evaluate and develop overall competitiveness potential.
20 Acta Wasaensia
2.2.1 Manufacturing strategy
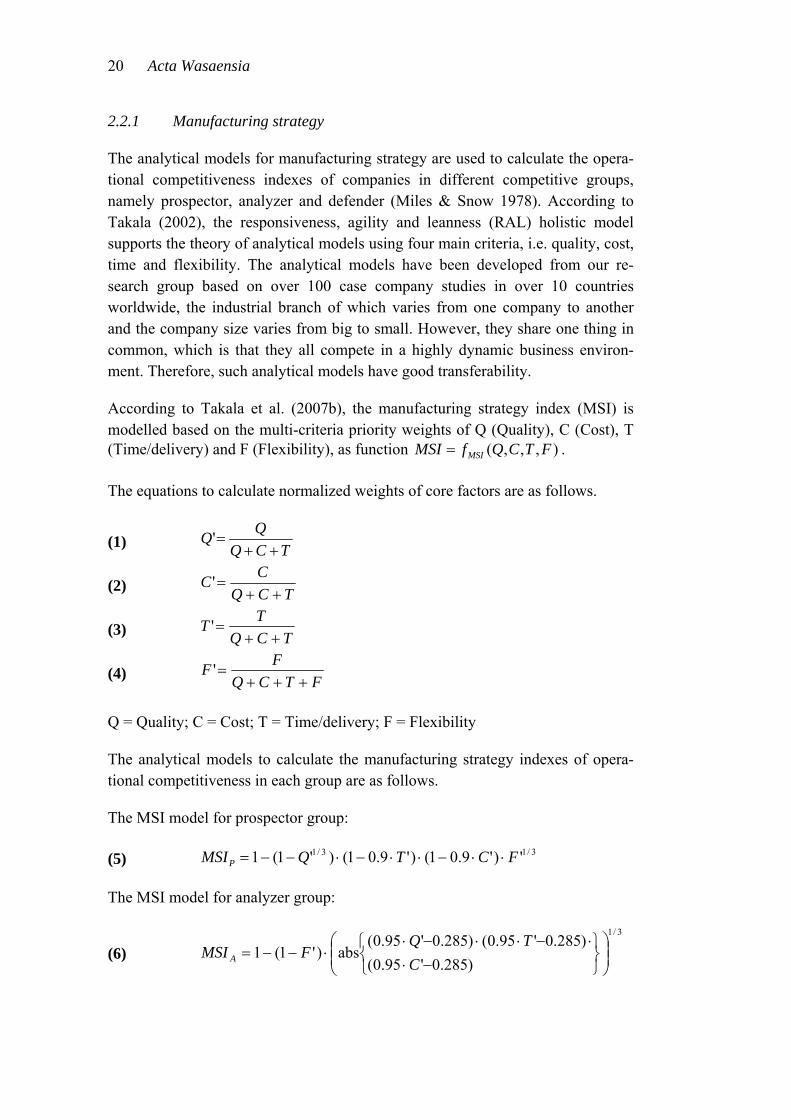
The analytical models for manufacturing strategy are used to calculate the opera-tional competitiveness indexes of companies in different competitive groups, namely prospector, analyzer and defender (Miles & Snow 1978). According to Takala (2002), the responsiveness, agility and leanness (RAL) holistic model supports the theory of analytical models using four main criteria, i.e. quality, cost, time and flexibility. The analytical models have been developed from our re-search group based on over 100 case company studies in over 10 countries worldwide, the industrial branch of which varies from one company to another and the company size varies from big to small. However, they share one thing in common, which is that they all compete in a highly dynamic business environ-ment. Therefore, such analytical models have good transferability.
According to Takala et al. (2007b), the manufacturing strategy index (MSI) is modelled based on the multi-criteria priority weights of Q (Quality), C (Cost), T (Time/delivery) and F (Flexibility), as function ),,,( FTCQfMSI MSI .
The equations to calculate normalized weights of core factors are as follows.
(1) TCQ
'
(2) TCQ
CC
'
(3) TCQ
TT
'
(4) FTCQ
FF
'
Q = Quality; C = Cost; T = Time/delivery; F = Flexibility
The analytical models to calculate the manufacturing strategy indexes of opera-tional competitiveness in each group are as follows.
The MSI model for prospector group:
(5) 3/13/1 ')'9.01()'9.01()'1(1 FCTQMSIP
The MSI model for analyzer group:
(6)
3/1
)285.0'95.0(
)285.0'95.0()285.0'95.0(abs)'1(1
C
TQFMSI A
Acta Wasaensia 21
The MSI model for defender group:
(7) 3/13/1 ')'9.01()'9.01()'1(1 FQTCMSID
2.2.2 Transformational leadership with technology level
The theoretical frame of the analytical models is based on the theory of transfor-mational leadership (Bass 1997). A holistic but very simple model of a human being from resource allocations to behaviour and finally to outcome directions and outcomes has been built based on psychic, social, functional, organizational and structural factors and put together according to the sand cone model and par-ticipation objectives in leadership of an organization (Takala et al. 2006). A modi-fied sand cone model by integrating technology level into part of the resources is proposed in Liu & Takala (2010b), based on which the new analytical models have been developed. The sand cone model from operations management litera-ture (Ferdows & De Meyer 1990) presents a model of cumulative layers of manu-facturing performance dimensions. The model implies the idea that companies need to develop their performance in certain stages in order to achieve higher lev-els of competitive performance. The prescriptive order of mutually supportive and enabling success factors is to proceed from quality, to delivery performance, then flexibility and finally to cost effectiveness. In this manner, the often-competitive dimensions of performance need to be viewed as a whole, and performance and capabilities thought about on a longer-term basis. The conceptual model with sand cone has similar basic ideas to the model of deep leadership (Nissinen 2001) in which the potential in professional skills and resources is transformed to out-comes of activities with the help and support of leadership process and behaviour.
Technology is understood as know-how of human competence, a relevant part of resource-based strategy, including all types of assets and resources, or strategic networking for collaborations by using partnerships (Braun 1998; Takala 1997). The technology levels are categorized as spearhead technology (SH), core tech-nology (CR), and basic technology (BS), and are defined as follows. SH: Technologies that are more orientated towards the future. CR: Core competitive technologies that are in use today. BS: Technologies that are commonly used everywhere and can be outsourced
or purchased from other companies.
Based on the analytical models for transformational leadership proposed by Ta-kala et al. (2008), these are further developed by integrating technology into re-sources for the evaluation of leadership indexes and outcomes of transformational
22 Acta Wasaensia
leadership. These models are the outcome direction index (OI) which balances the directions; the leadership behaviour index (LI) which measures deep leadership, the maximum passive and/or controlling leadership and the utilization of the cor-nerstones of deep leadership in different ways; and the resource allocation index (RI) which balances the utilization of human resources. The outcome index (OI) is based on the weighting of factors, i.e. extra effort (EE), satisfaction (SA), effec-tiveness (EF), and therefore OI is modelled as the function ),,( EFSAEEfOI OI .
The leadership index (LI) is based on the weighting of factors, i.e. deep leadership (DL), passive leadership (PL), controlling leadership (CL) and individualized consideration (IC), inspirational motivation (IM), intellectual stimulation (IS), building trust and confidence (BT), and therefore LI is modelled as the function
),,,,,,( BTISIMICCLPLDLfLI LI . The resource index (RI) is based on the
weighting of factors, i.e. people/technology/know-how (PT), processes (PC), in-formation systems (IT), organizations of groups/teams (OR) and technology level index (TI), where TI is based on the weighting of factors, i.e. spearhead technol-ogy (SH), core technology (CR), and basic technology (BS), therefore TI is mod-elled as the function ),,( BSCRSHfTI TI and RI is modelled as the function
),,,,( TIORITPCPTfRI RI . The total leadership index (TLI) is still modelled as
the function ),,( RILIOIfTLI TLI as in previous studies, however, the difference
of the new definition of TLI is that TI has been considered to be integrated into transformational leadership as a special part of RI in leadership. All the weighting of factors used to calculate OI LI, RI and TI, such as EE, SA, EF, DL, PL, CL, IC, IM, IS, BT, PT, PC, IT, OR are percentages derived from the AHP analysis and SH, CR, BS are percentages obtained directly from the questionnaire.
The modelling of technology level is different from the other variables because of its particularity in transformational leadership. Here a brand new idea to model the effect of technology level index to resource index is proposed. According to the principles of how the resource index has been constructed, the effects are de-fined as follows. A. Excessive know-how, meaning that caused by not the right technology be-
longs directly as an extra weight to the warehouse of know-how (PT), and lowers the weights in PC, IT or OR, lowering in both cases the resource index RI in a linear manner.
B. The right technology, meaning that fitting to the manufacturing stages, in-creases PC, IT or OR, and decreases the know-how (PT) warehouse that caused by not the right technology, and it increases in both cases the resource index RI in a linear manner.
Definitions A and B, together with expert opinions from the case companies and equation for modelling RI are used for the analysis. The weights of SH/CR/BS have been collected by interviewing experts especially as to how significant or
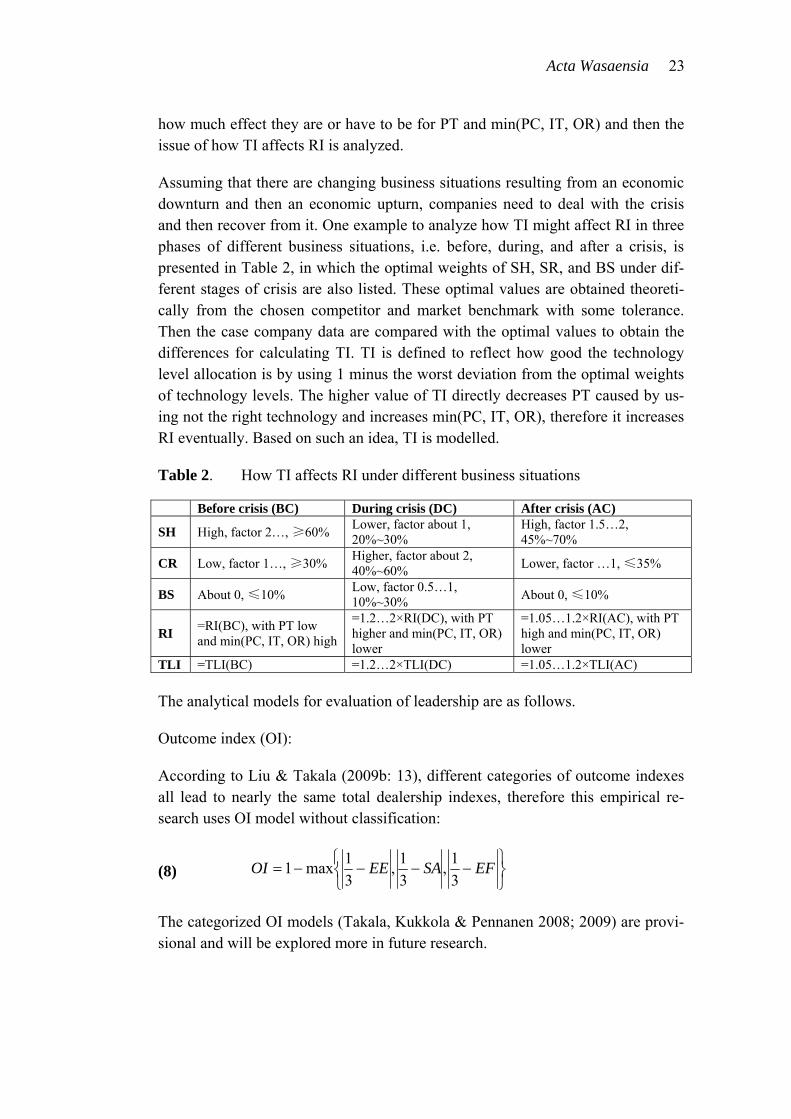
Acta Wasaensia 23
how much effect they are or have to be for PT and min(PC, IT, OR) and then the issue of how TI affects RI is analyzed.
Assuming that there are changing business situations resulting from an economic downturn and then an economic upturn, companies need to deal with the crisis and then recover from it. One example to analyze how TI might affect RI in three phases of different business situations, i.e. before, during, and after a crisis, is presented in Table 2, in which the optimal weights of SH, SR, and BS under dif-ferent stages of crisis are also listed. These optimal values are obtained theoreti-cally from the chosen competitor and market benchmark with some tolerance. Then the case company data are compared with the optimal values to obtain the differences for calculating TI. TI is defined to reflect how good the technology level allocation is by using 1 minus the worst deviation from the optimal weights of technology levels. The higher value of TI directly decreases PT caused by us-ing not the right technology and increases min(PC, IT, OR), therefore it increases RI eventually. Based on such an idea, TI is modelled.
Table 2. How TI affects RI under different business situations
Before crisis (BC) During crisis (DC) After crisis (AC)
SH High, factor 2…, ≥60% Lower, factor about 1, 20%~30%
High, factor 1.5…2, 45%~70%
CR Low, factor 1…, ≥30% Higher, factor about 2, 40%~60%
Lower, factor …1, ≤35%
BS About 0, ≤10% Low, factor 0.5…1, 10%~30% About 0, ≤10%
RI =RI(BC), with PT low and min(PC, IT, OR) high
=1.2…2×RI(DC), with PT higher and min(PC, IT, OR) lower
=1.05…1.2×RI(AC), with PT high and min(PC, IT, OR) lower
TLI =TLI(BC) =1.2…2×TLI(DC) =1.05…1.2×TLI(AC)
The analytical models for evaluation of leadership are as follows.
Outcome index (OI):
According to Liu & Takala (2009b: 13), different categories of outcome indexes all lead to nearly the same total dealership indexes, therefore this empirical re-search uses OI model without classification:
(8)
EFSAEEOI3
1,
3
1,
3
1max1
The categorized OI models (Takala, Kukkola & Pennanen 2008; 2009) are provi-sional and will be explored more in future research.
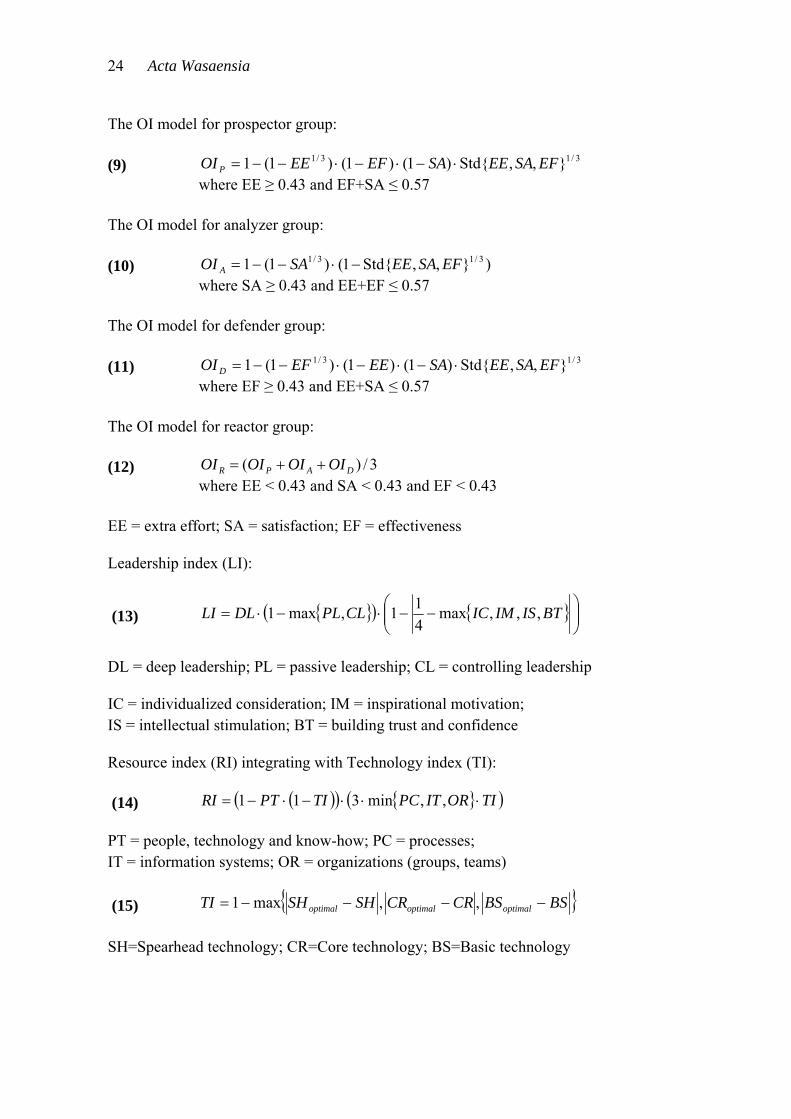
24 Acta Wasaensia
The OI model for prospector group:
(9) 3/13/1 },,Std{)1()1()1(1 EFSAEESAEFEEOI P
where EE ≥ 0.43 and EF+SA ≤ 0.57
The OI model for analyzer group:
(10) )},,Std{1()1(1 3/13/1 EFSAEESAOI A
where SA ≥ 0.43 and EE+EF ≤ 0.57
The OI model for defender group:
(11) 3/13/1 },,Std{)1()1()1(1 EFSAEESAEEEFOI D
where EF ≥ 0.43 and EE+SA ≤ 0.57
The OI model for reactor group:
(12) 3/)( DAPR OIOIOIOI
where EE < 0.43 and SA < 0.43 and EF < 0.43
EE = extra effort; SA = satisfaction; EF = effectiveness
Leadership index (LI):
(13)
BTISIMICCLPLDLLI ,,,max
4
11,max1
DL = deep leadership; PL = passive leadership; CL = controlling leadership
IC = individualized consideration; IM = inspirational motivation; IS = intellectual stimulation; BT = building trust and confidence
Resource index (RI) integrating with Technology index (TI):
(14) TIORITPCTIPTRI ,,min311
PT = people, technology and know-how; PC = processes; IT = information systems; OR = organizations (groups, teams)
(15) BSBSCRCRSHSHTI optimaloptimaloptimal ,,max1
SH=Spearhead technology; CR=Core technology; BS=Basic technology
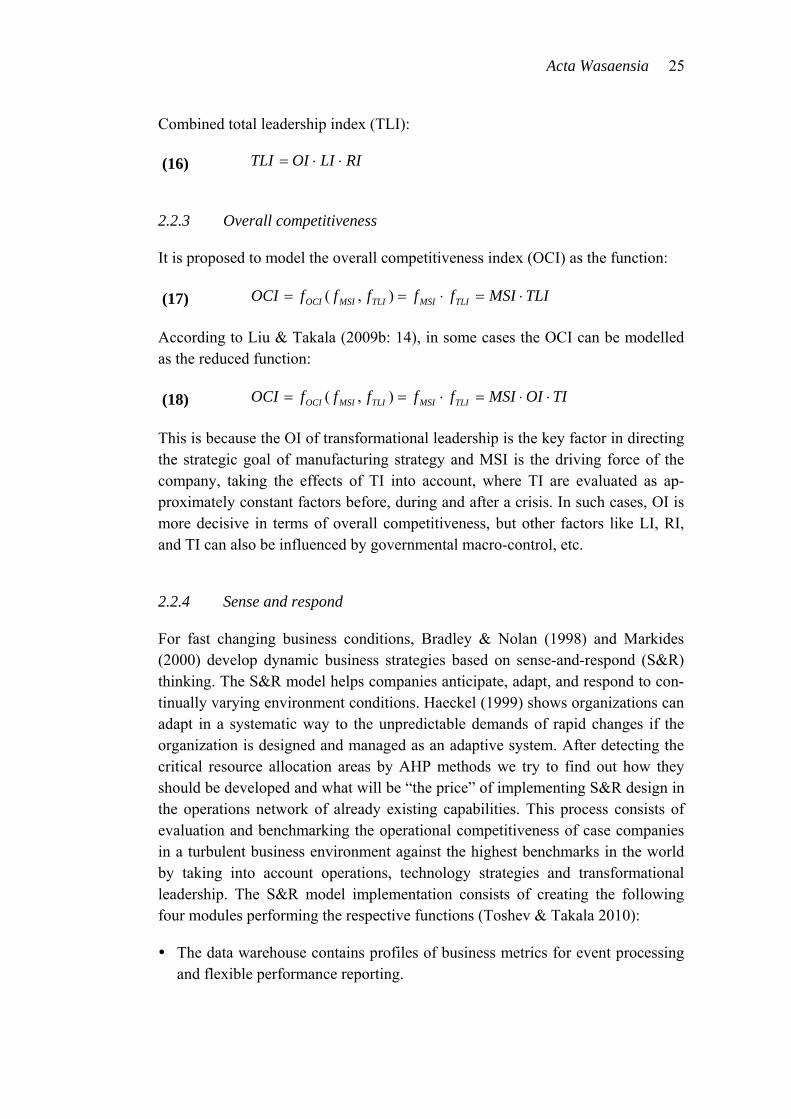
Acta Wasaensia 25
Combined total leadership index (TLI): (16) RILIOITLI
2.2.3 Overall competitiveness
It is proposed to model the overall competitiveness index (OCI) as the function:
(17) TLIMSIfffffOCI TLIMSITLIMSIOCI ),(
According to Liu & Takala (2009b: 14), in some cases the OCI can be modelled as the reduced function:
(18) TIOIMSIfffffOCI TLIMSITLIMSIOCI ),(
This is because the OI of transformational leadership is the key factor in directing the strategic goal of manufacturing strategy and MSI is the driving force of the company, taking the effects of TI into account, where TI are evaluated as ap-proximately constant factors before, during and after a crisis. In such cases, OI is more decisive in terms of overall competitiveness, but other factors like LI, RI, and TI can also be influenced by governmental macro-control, etc.
2.2.4 Sense and respond
For fast changing business conditions, Bradley & Nolan (1998) and Markides (2000) develop dynamic business strategies based on sense-and-respond (S&R) thinking. The S&R model helps companies anticipate, adapt, and respond to con-tinually varying environment conditions. Haeckel (1999) shows organizations can adapt in a systematic way to the unpredictable demands of rapid changes if the organization is designed and managed as an adaptive system. After detecting the critical resource allocation areas by AHP methods we try to find out how they should be developed and what will be “the price” of implementing S&R design in the operations network of already existing capabilities. This process consists of evaluation and benchmarking the operational competitiveness of case companies in a turbulent business environment against the highest benchmarks in the world by taking into account operations, technology strategies and transformational leadership. The S&R model implementation consists of creating the following four modules performing the respective functions (Toshev & Takala 2010):
The data warehouse contains profiles of business metrics for event processing and flexible performance reporting.
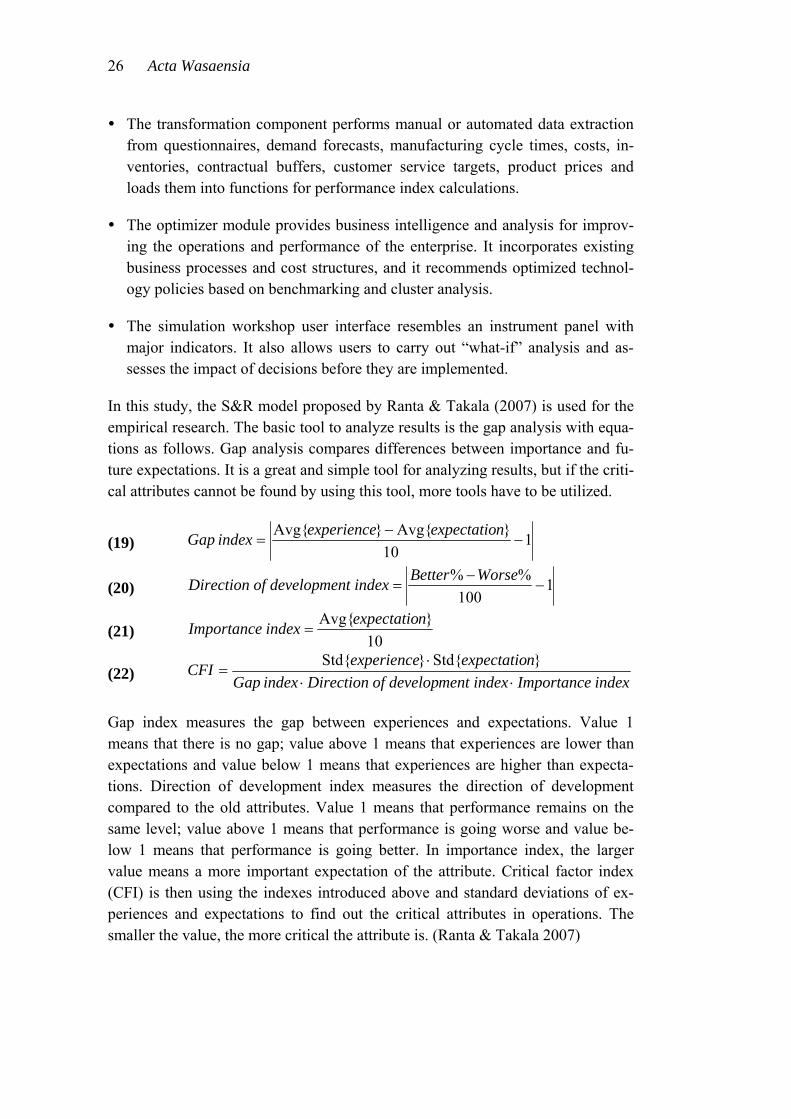
26 Acta Wasaensia
The transformation component performs manual or automated data extraction from questionnaires, demand forecasts, manufacturing cycle times, costs, in-ventories, contractual buffers, customer service targets, product prices and loads them into functions for performance index calculations.
The optimizer module provides business intelligence and analysis for improv-ing the operations and performance of the enterprise. It incorporates existing business processes and cost structures, and it recommends optimized technol-ogy policies based on benchmarking and cluster analysis.
The simulation workshop user interface resembles an instrument panel with major indicators. It also allows users to carry out “what-if” analysis and as-sesses the impact of decisions before they are implemented.
In this study, the S&R model proposed by Ranta & Takala (2007) is used for the empirical research. The basic tool to analyze results is the gap analysis with equa-tions as follows. Gap analysis compares differences between importance and fu-ture expectations. It is a great and simple tool for analyzing results, but if the criti-cal attributes cannot be found by using this tool, more tools have to be utilized.
(19) 110
}Avg{}Avg{
nexpectatioexperienceindex Gap
(20) 1100
%%
WorseBetterment indexof developDirection
(21) 10
}Avg{ nexpectatio indexImportance
(22) indexImportancement indexof developDirection index Gap
nexpectatioexperienceCFI
}Std{}Std{
Gap index measures the gap between experiences and expectations. Value 1 means that there is no gap; value above 1 means that experiences are lower than expectations and value below 1 means that experiences are higher than expecta-tions. Direction of development index measures the direction of development compared to the old attributes. Value 1 means that performance remains on the same level; value above 1 means that performance is going worse and value be-low 1 means that performance is going better. In importance index, the larger value means a more important expectation of the attribute. Critical factor index (CFI) is then using the indexes introduced above and standard deviations of ex-periences and expectations to find out the critical attributes in operations. The smaller the value, the more critical the attribute is. (Ranta & Takala 2007)
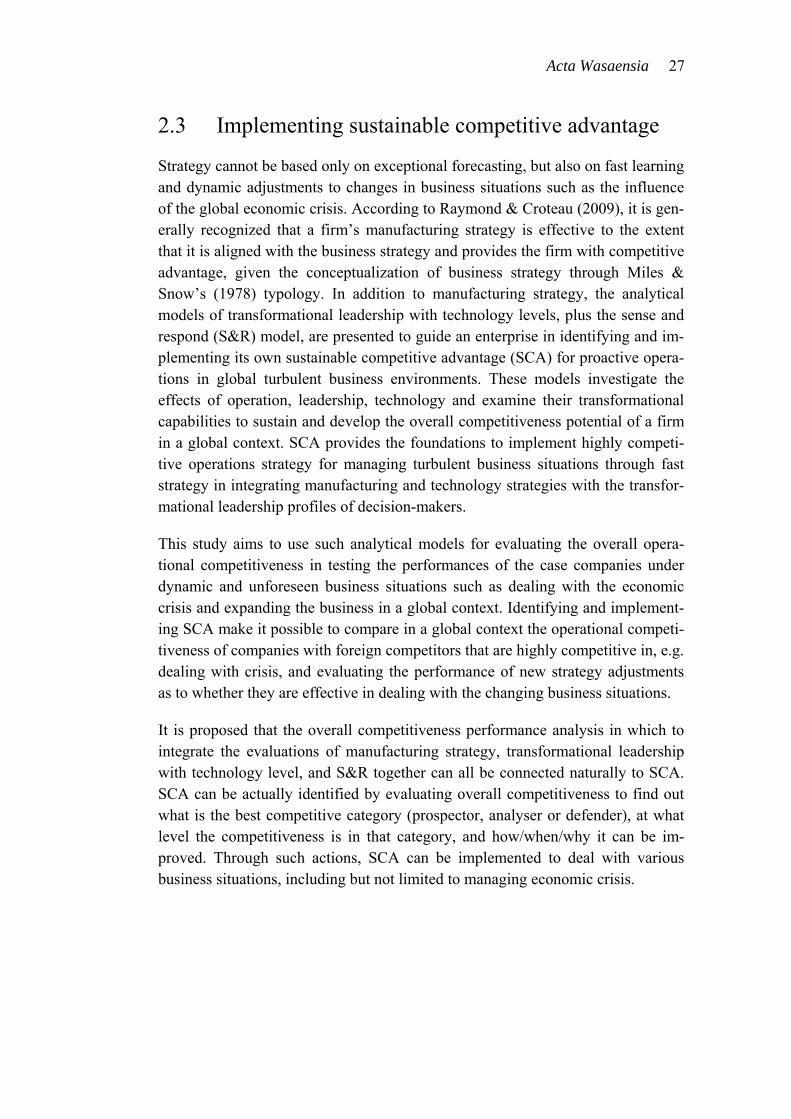
Acta Wasaensia 27
2.3 Implementing sustainable competitive advantage
Strategy cannot be based only on exceptional forecasting, but also on fast learning and dynamic adjustments to changes in business situations such as the influence of the global economic crisis. According to Raymond & Croteau (2009), it is gen-erally recognized that a firm’s manufacturing strategy is effective to the extent that it is aligned with the business strategy and provides the firm with competitive advantage, given the conceptualization of business strategy through Miles & Snow’s (1978) typology. In addition to manufacturing strategy, the analytical models of transformational leadership with technology levels, plus the sense and respond (S&R) model, are presented to guide an enterprise in identifying and im-plementing its own sustainable competitive advantage (SCA) for proactive opera-tions in global turbulent business environments. These models investigate the effects of operation, leadership, technology and examine their transformational capabilities to sustain and develop the overall competitiveness potential of a firm in a global context. SCA provides the foundations to implement highly competi-tive operations strategy for managing turbulent business situations through fast strategy in integrating manufacturing and technology strategies with the transfor-mational leadership profiles of decision-makers.
This study aims to use such analytical models for evaluating the overall opera-tional competitiveness in testing the performances of the case companies under dynamic and unforeseen business situations such as dealing with the economic crisis and expanding the business in a global context. Identifying and implement-ing SCA make it possible to compare in a global context the operational competi-tiveness of companies with foreign competitors that are highly competitive in, e.g. dealing with crisis, and evaluating the performance of new strategy adjustments as to whether they are effective in dealing with the changing business situations.
It is proposed that the overall competitiveness performance analysis in which to integrate the evaluations of manufacturing strategy, transformational leadership with technology level, and S&R together can all be connected naturally to SCA. SCA can be actually identified by evaluating overall competitiveness to find out what is the best competitive category (prospector, analyser or defender), at what level the competitiveness is in that category, and how/when/why it can be im-proved. Through such actions, SCA can be implemented to deal with various business situations, including but not limited to managing economic crisis.
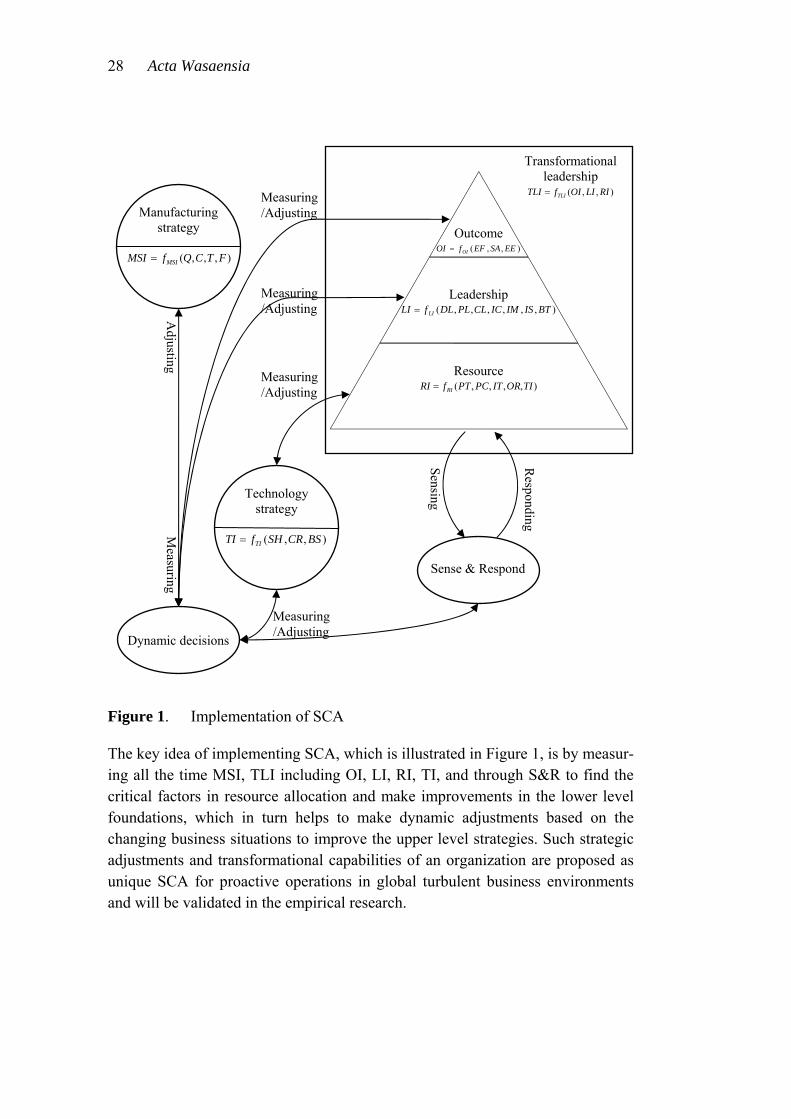
28 Acta Wasaensia
Figure 1. Implementation of SCA
The key idea of implementing SCA, which is illustrated in Figure 1, is by measur-ing all the time MSI, TLI including OI, LI, RI, TI, and through S&R to find the critical factors in resource allocation and make improvements in the lower level foundations, which in turn helps to make dynamic adjustments based on the changing business situations to improve the upper level strategies. Such strategic adjustments and transformational capabilities of an organization are proposed as unique SCA for proactive operations in global turbulent business environments and will be validated in the empirical research.
Dynamic decisions
Manufacturing strategy
),,,( FTCQfMSI MSI
Technology strategy
),,( BSCRSHfTI TI
Sense & Respond
Responding
Sensing
Measuring
Adjusting
Measuring /Adjusting
Measuring /Adjusting
Measuring /Adjusting
Measuring /Adjusting
Transformational leadership
),,( RILIOIfTLI TLI
Outcome
),,( EESAEFfOI OI
Leadership ),,,,,,( BTISIMICCLPLDLfLI LI
Resource ),,,,( TIORITPCPTfRI RI
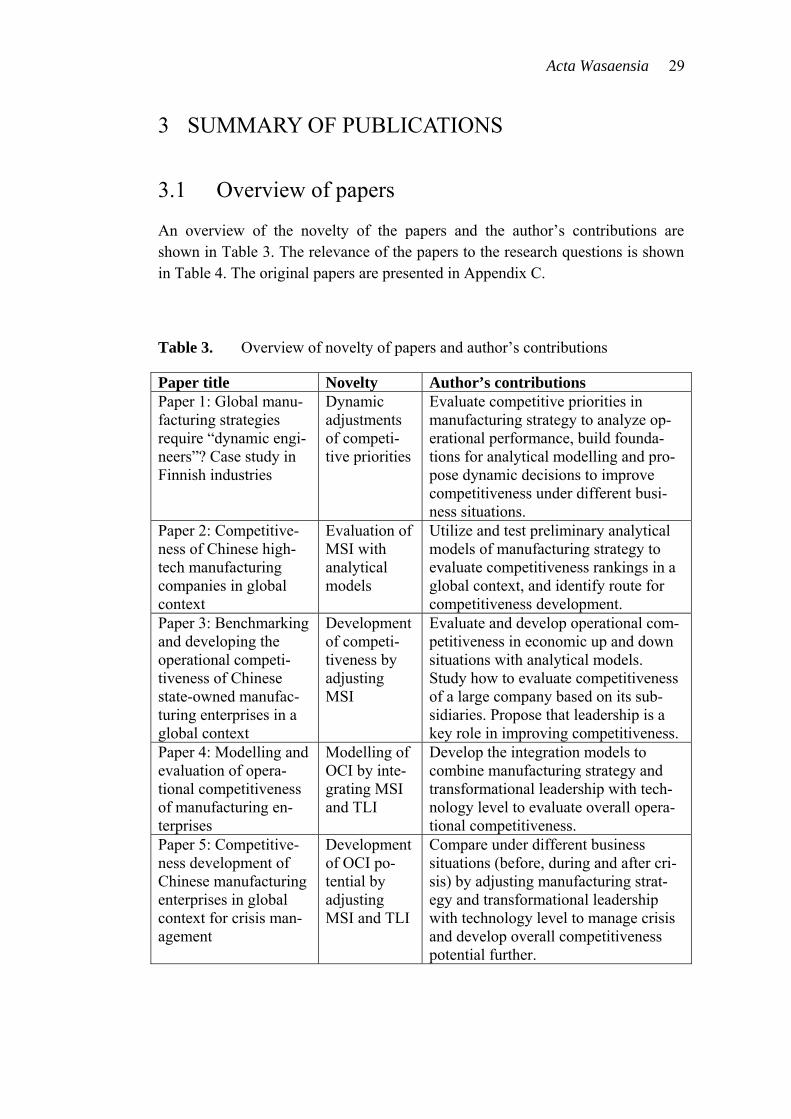
Acta Wasaensia 29
3 SUMMARY OF PUBLICATIONS
3.1 Overview of papers
An overview of the novelty of the papers and the author’s contributions are shown in Table 3. The relevance of the papers to the research questions is shown in Table 4. The original papers are presented in Appendix C.
Table 3. Overview of novelty of papers and author’s contributions
Paper title Novelty Author’s contributions Paper 1: Global manu-facturing strategies require “dynamic engi-neers”? Case study in Finnish industries
Dynamic adjustments of competi-tive priorities
Evaluate competitive priorities in manufacturing strategy to analyze op-erational performance, build founda-tions for analytical modelling and pro-pose dynamic decisions to improve competitiveness under different busi-ness situations.
Paper 2: Competitive-ness of Chinese high-tech manufacturing companies in global context
Evaluation of MSI with analytical models
Utilize and test preliminary analytical models of manufacturing strategy to evaluate competitiveness rankings in a global context, and identify route for competitiveness development.
Paper 3: Benchmarking and developing the operational competi-tiveness of Chinese state-owned manufac-turing enterprises in a global context
Development of competi-tiveness by adjusting MSI
Evaluate and develop operational com-petitiveness in economic up and down situations with analytical models. Study how to evaluate competitiveness of a large company based on its sub-sidiaries. Propose that leadership is a key role in improving competitiveness.
Paper 4: Modelling and evaluation of opera-tional competitiveness of manufacturing en-terprises
Modelling of OCI by inte-grating MSI and TLI
Develop the integration models to combine manufacturing strategy and transformational leadership with tech-nology level to evaluate overall opera-tional competitiveness.
Paper 5: Competitive-ness development of Chinese manufacturing enterprises in global context for crisis man-agement
Development of OCI po-tential by adjusting MSI and TLI
Compare under different business situations (before, during and after cri-sis) by adjusting manufacturing strat-egy and transformational leadership with technology level to manage crisis and develop overall competitiveness potential further.
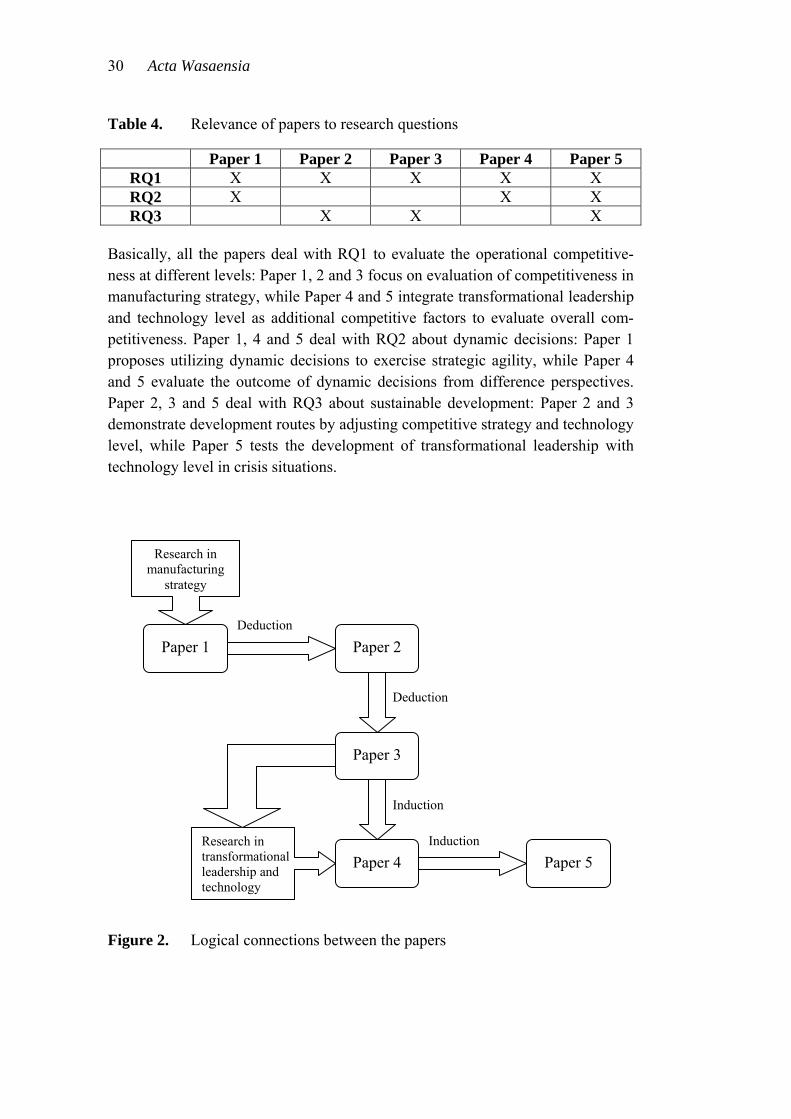
30 Acta Wasaensia
Table 4. Relevance of papers to research questions
Paper 1 Paper 2 Paper 3 Paper 4 Paper 5 RQ1 X X X X X RQ2 X X X RQ3 X X X
Basically, all the papers deal with RQ1 to evaluate the operational competitive-ness at different levels: Paper 1, 2 and 3 focus on evaluation of competitiveness in manufacturing strategy, while Paper 4 and 5 integrate transformational leadership and technology level as additional competitive factors to evaluate overall com-petitiveness. Paper 1, 4 and 5 deal with RQ2 about dynamic decisions: Paper 1 proposes utilizing dynamic decisions to exercise strategic agility, while Paper 4 and 5 evaluate the outcome of dynamic decisions from difference perspectives. Paper 2, 3 and 5 deal with RQ3 about sustainable development: Paper 2 and 3 demonstrate development routes by adjusting competitive strategy and technology level, while Paper 5 tests the development of transformational leadership with technology level in crisis situations.
Figure 2. Logical connections between the papers
Paper 1
Research in manufacturing
strategy
Paper 5 Paper 4
Paper 3
Paper 2
Deduction
Deduction
Induction
Induction Research in transformational leadership and technology
Acta Wasaensia 31
The logical connections between the papers with their origin of research are illus-trated in Figure 2. Research into multi-focused manufacturing strategy and case studies of competitiveness priorities has resulted in Paper 1 being the motivation and foundation to build analytical models to evaluate operational competitiveness performances. Through deduction, the evaluation of competitiveness in manufac-turing strategy with preliminary analytical models has resulted in Paper 2, and testing with empirical studies the development of operational competitiveness under different business situations features in Paper 3. Through induction the finding on the important roles in leadership and technology for decision-making has motivated the research in transformational leadership with technology level, which has led to the novel concept of integrating the manufacturing strategy and transformational leadership with technology level to model and evaluate overall operational competitiveness in Paper 4. Paper 5 features the empirical findings in adjusting competitive strategies and improvements in transformational leadership during crisis situations and develops a theoretical framework for managing opera-tions in global turbulent business environments.
3.2 Summary of individual papers
3.2.1 Paper 1: Global manufacturing strategies require “dynamic engineers”? Case study in Finnish industries
This paper is the foundation of research in global manufacturing strategies, which studies multi-focused manufacturing strategies under the influence of the China effect taking the dynamic, complex and situational business strategies into ac-count. It studies RQ1 by comparing the competitive priorities of manufacturing strategies in four different types of companies, with some international compari-sons and one longitudinal case study for benchmarking, in order to discover the competitive priorities of manufacturing strategies for the case companies and to show other companies the route for development. It shows in terms of RQ2 that all four types of companies should grow internationally and utilize developing countries as a means of lowering costs, but each type of company has its own special strategies to suit their markets. Companies in western countries should utilize multi-focused manufacturing strategies based on their business strategy in a holistic way, e.g. through RAL concept, and specialize through quality, e.g. by differentiating product and service technology for global highly dynamic and complex business. The development steps, from technology specialist to problem solver, are proposed. Human resources should be trained all the time to be more “dynamic engineers” in industrial engineering and management.
32 Acta Wasaensia
The motivation of the research comes from the new “China effect”, whereby tra-ditional manufacturing is moving from Europe to Asia due to the impact of low cost labour markets from Asian developing countries, and this is influencing business and manufacturing strategies within many different business areas. Con-cepts of global manufacturing strategies and up-to-date theories for the implemen-tation of business and manufacturing strategies are reviewed, which lead to the objective of this explorative study: to describe the mechanisms and create pre-liminary normative models to evaluate and analyze competitiveness in manufac-turing strategy and develop dynamic business strategies for operations in the dy-namic, situational and complex conditions which comprise the China effect. It proposes operational agility as a multidimensional matter, where success may demand several equally important production goals, as Takala (2002) claims in his previous publications about multi-focused strategies. Operational agility re-quires companies typically to carry out their own production, and it supports mostly specializing strategies that are based on quality and special features of the products or services related to it. Know-how in production technology, in all forms, is a remarkable factor to agility as well. When competing with low price, volumes and input costs are most critical, but on the production level it is hard to affect these factors because these kinds of decisions are made on a business level. Technology is understood as the know-how of human competence, a relevant part of resource-based strategy, including all types of assets and resources, or strategic networking for collaboration by using partnerships (Braun 1998; Takala 1997). Therefore, a holistic and multi-focused manufacturing strategies model based on business goals, which is the RAL model suggested by Takala (2002), is reviewed and proposed as the theoretical foundation on which to build the normative mod-els. RAL has basically been created for understanding the success factors of logis-tics, but it is relevant for all operations strategies and operations management, thus for manufacturing strategy as well. The main dimensions of RAL are R = responsiveness, the speed by which the system satisfies unanticipated require-ments; A = agility, the speed by which the system adapts to the optimal cost struc-ture; and L = leanness, which minimizes waste in all resources and activities. Flexibility, as the focused core concept, means product mix, volatility in condi-tions, changes in volumes, complexity in the technology level, number of mod-ules and modularity and life cycle flexibilities. It is worth to note that in this pa-per, five main criteria which are quality, cost, time (classified as other/logistics), flexibility and customer focus, are used in the individual case studies for company A, B, C and D, and know-how which is more resource-related is not included in the main criteria, but is used in the longitudinal benchmarking case study.
In answering RQ1 and RQ2, four different types of case companies are studied by comparing the competitive priorities of manufacturing strategies with some inter-
Acta Wasaensia 33
national comparisons and one longitudinal case study for benchmarking. As a conclusion from the case studies, the answers to RQ1 and RQ2 from this paper’s perspective would be for all types of companies to dynamically multi-focus the manufacturing strategies based on the main business strategy in a holistic way, e.g. through mirroring it with the RAL model. The case studies show a clear need for a hierarchy from business to manufacturing strategies, up to resource catego-ries such as dynamic engineers through which the strategies are implemented (Sharma, Kumar & Kumar 2006). The emphasis must naturally be different for different types of companies, as illustrated by the ideal typical companies as can be seen from Takala, Bhufhai & Phusavat (2006) concentrating on quality and especially customer satisfaction management. There is also always a need to fo-cus on specific areas, such as agility and productivity of the RAL model and on specific industries, such as the electronics industry (Helo 2004), and to emphasize the most critical approach to change management in specific dynamic business processes, such as automotive supply chains (Childerhouse et al. 2003). Global sourcing in purchasing should also be more and more effectively used for cost and productivity competitiveness. Madu et al. (1996) show the route for the de-velopment of companies from local technology specialist to international problem solver. To enable this change, companies should constantly recruit and train more dynamic engineers, all the time more also in industrial engineering and manage-ment. The framework for performance measurements for white-collar workers, created by Takala, Suwansaranyu & Phusavat (2006), can be effectively utilized in future research in developing the definition and measurements of the concept and performance of the dynamic engineer. Also concepts and models for service quality, according to Ghobadian, Speller & Jones (1994), can be utilized for ana-lyzing the performance of knowledge intensive business services, which clearly will have an important role in the global competitiveness of Finnish industry.
3.2.2 Paper 2: Competitiveness of Chinese high-tech manufacturing companies in global context
This paper covers an important topic with the clearly presented purpose in terms of RQ1, to study the operational competitiveness of Chinese high-tech manufac-turing companies from a manufacturing strategy point of view by comparing them with other similar international manufacturing companies, and in terms of RQ3, to identify the development route of manufacturing strategy to become more competitive in their markets. Preliminary analytical models for competitiveness analysis are used to analyze the operational competitiveness based on the weights of multi-criteria manufacturing strategy. Benchmarking between the case compa-nies and leading companies in the prospector, analyzer and defender groups is
34 Acta Wasaensia
applied to further evaluate their competitiveness in manufacturing strategy. The preliminary analytical models are proved to be effective in evaluating the opera-tional competitiveness of Chinese high-tech manufacturing companies under the influence of Chinese culture and macro-control.
In answering RQ1, this paper starts by reviewing literature pertaining to the topic of the study, which serves as the theoretical frame of reference up to very re-cently. The novelty of the present work is a new research perspective, in which the research is conducted, as well as taking into consideration the influence of Chinese culture, governmental macro-control and policy intervention, which serve well to differentiate the present work from prior studies and findings. In previous studies and related literature, Takala et al. (2007b) introduce unique ana-lytical models to evaluate the competitiveness of manufacturing companies worldwide. In China, the most dynamic market, Liu et al. (2008) for the first time have applied such analytical models to analyze the operational competitiveness of a private middle-size manufacturing company. This paper continues such analysis further in China, with deeper insights into the operational competitiveness of Chi-nese high-tech manufacturing companies compared in a global context to suggest how to improve their competitiveness in manufacturing strategy, and to verify the analytical models of operational competitiveness and promote one development route for Chinese manufacturing companies under the influence of Chinese cul-ture and macro-control based on the studies of Madu et al. (1996) and Takala et al. (2007a). In this paper, case studies are performed with Chinese high-tech manufacturing companies, which include a Chinese high-tech international manu-facturing company, a Chinese high-tech regional manufacturing company and a Chinese high-tech independent research and development company affiliated to state-owned manufacturing companies. This is completely novel since analytical studying of the competitiveness of typical Chinese businesses, which are domi-nated by state-owned manufacturing companies, basically does not exist in the existing literature. In answering RQ3, this paper studies the influence of Chinese culture, governmental macro-control and policy intervention for the development route of Chinese manufacturing companies. In the development phase of com-modity product, the Chinese government generally applies preferential policies and macro-control to encourage the best manufacturing companies to collaborate together by corporate mergers. To some extent, the government considers that this method can enhance the competitiveness of manufacturing companies. On the other hand, in Chinese culture the leadership of manufacturing companies in this phase are more willing to control the collaboration companies, not act as collabo-ration partners. It is proposed that future research could continue to study the in-fluence of Chinese culture and governmental macro-control on the operational competitiveness of Chinese manufacturing companies.
Acta Wasaensia 35
This paper chooses typical manufacturing companies as case studies based on the development route of global industries (Takala et al. 2007a). The case companies categorized in this paper represent typical Chinese state-owned manufacturing companies, and such types of companies generally exist in China. The concept of a global manufacturing strategies database is for the first time explained, which contains over 100 case company studies and also contains the manufacturing strategy diversity and competitiveness profiles of companies from various coun-tries all over the world or the same companies which operate globally, based on which the analytical models (Takala et al. 2007b) are developed. The RAL holis-tic model (Takala 2002) supports the external validity of the analytical models from the theory point of view. The informants who give the answers are normally experts in top management or are specifically in charge of one area, thus they really know the operations strategies and only their answers with inconsistency ratios below the limit are accepted, which ensures the internal validity. The ana-lytical models have good transferability since they are developed from case com-panies where the industrial branch varies from one to another and the company size varies from big to small, but they share one thing in common which is that they all are competing in a highly dynamic business environment.
The contribution of this paper to answering RQ1 and RQ3 are from the following aspects: the comprehensiveness of the analytical models after reviewing prior literature, and the novelty of using only four main criteria, i.e. quality, cost, time and flexibility to form a reliable instrument for analytical evaluation. The know-now is more resource-related so it serves as a lower level; on the other hand, cus-tomer focus is more strategically orientated, so it serves as a higher level com-pared to the core competences of quality, cost, time and flexibility. Therefore, only these four key factors, which more deeply affect the operational competi-tiveness level, have been taken into consideration in the analytical models. The main criteria and sub-criteria prepared in the questionnaires for interviews have been defined by the decision makers and middle management groups, who have good knowledge about the operation of the case companies, and accordingly these criteria are assumed to be the core competences of their company. Besides prov-ing the applicability of the model, it is also important to widen the discussion from the practical perspective. More speculation on developing sustainable com-petitiveness can be generated from the results, e.g. to what extent the results mir-ror the benchmarked organizations; will the developed Chinese companies be leading or on a par with the benchmarked organizations? From comparisons be-tween companies in China and companies in EU (Takala et al. 2007c), the find-ings show that know-how and customer focus are more evenly distributed in China than in the EU and such behaviour is believed to be the influence of Chi-nese governmental macro-control and policy intervention, which make companies
36 Acta Wasaensia
operating in a better way. This leads to a significant contribution in terms of what Chinese companies must do in order to be competitive in a strategically sustain-able way. Such implications will be further studied in future research.
3.2.3 Paper 3: Benchmarking and developing the operational competitiveness of Chinese state-owned manufacturing enterprises in a global context
This paper aims to study RQ1 in terms of the operational competitiveness of Chi-nese state-owned manufacturing enterprises (CSOMEs) by analyzing the case CSOME and comparing with other manufacturing companies in the global manu-facturing strategies database, and RQ3 in developing their competitiveness through innovation and learning. The main idea is to evaluate the competitiveness of CSOMEs which are representative of Chinese manufacturing industries, ana-lyze how competitive they are when competing with international companies and how they can develop their competitiveness further. Analytical models are used to analyze the operational competitiveness of the case CSOME and its subsidiaries based on the weights of multi-criteria manufacturing strategies. The operational competitiveness development of its subsidiaries is applied to predict the develop-ment potential of future operational competitiveness of the case CSOME in a global context.
The motivation to study CSOMEs comes from the fact that CSOMEs are the most representative type of companies in China and the most significant representatives of socialism with Chinese characteristics. CSOMEs produce the majority of Chi-nese GDP and they are also majority portion of the top 500 companies in China which serve as the backbone of the Chinese economy. As the major contributor to Chinese GDP, the importance of analyzing the CSOME competitiveness is sig-nificant in order to study Chinese economy which has major influence in the global market. In answering RQ1 and RQ3, this paper addresses the key learning points based on the findings for the case CSOME in company-specific terms and for Chinese industry in more general terms and to conclude how to evaluate whether the right strategies have been selected and the effectiveness of develop-ing these strategies to sustain better competitiveness when moving into the 2010s, given the emerging strength of other developing countries. It is important to em-phasize the key learning issues so that others are able to adapt to new innovations and continuous improvement.
The answers to RQ1 and RQ3 are concluded from the case study of a typical CSOME in this paper. Quality is still the most important competitive priority of the case CSOME, which results in strong operational competitiveness in the pros-
Acta Wasaensia 37
pector group, whereas flexibility is not high comparing with other factors because of complicated products, enormous organization, large staff size and dedicated production line, etc. Low flexibility value is a key characteristic of the CSOME and equipment manufacturing companies in operations strategies, and govern-ment policies and macro-control also restrict the development of flexibility. Al-though CSOMEs are typically monopoly enterprises in some manufacturing fields, the rapid development of private enterprises and foreign competitors has forced CSOMEs to improve flexibility and lower costs further. The study of de-veloping operational competitiveness under different business situations shows that the case CSOME is very stable in the prospector group, and improving the operational competitiveness in this group is an effective approach to improve its overall competitiveness. The rankings and stability of operational competitiveness of the case CSOME and its subsidiaries imply that top CSOMEs have strong op-erational competitiveness in the global context, however they still have big gaps compared to top manufacturing enterprises in the world, and it will be a long process for them to improve their operational competitiveness because of their typically huge organizational structure. The key point to develop CSOME com-petitiveness further is to learn the innovations from the top and transfer what is learned to their own competence.
This paper also discovers other important aspects for future research. Leadership of CSOMEs is found to be very important in the decision-making process, be-cause the management system of CSOMEs is very similar to that of the govern-ment. CSOMEs are typically under the direct command of the government. The capacity of leadership in CSOMEs is one of the key factors which greatly influ-ence the development of operational competitiveness. From this implication, leadership is considered to be the next major research area. As the primary driv-ing force of the Chinese economy, government policies also show significant in-fluence in developing the competitiveness of CSOMEs. The Chinese government provides strong support for CSOMEs when they encounter difficulties, especially in a time of global financial crisis. This motivates the following research into competitiveness in crisis situations.
3.2.4 Paper 4: Modelling and evaluation of operational competitiveness of manufacturing enterprises
This paper continues to explore RQ1 and RQ2 from different perspectives and serves as the main theoretical foundation of integrated analytical models for evaluation of overall operational competitiveness. It includes important new con-cepts and results that may expand and extend the related literature. It aims to con-
38 Acta Wasaensia
nect previous research in global competitiveness analysis and create holistic ana-lytical models to evaluate overall competitiveness, which is a novel concept by integrating the evaluation of manufacturing strategy and transformational leader-ship including technology level together. It proposes a key to dynamic decision-making by transforming the leadership and technology level on top of the manu-facturing strategy. The empirical studies are focused on case companies in China, especially Chinese state-owned manufacturing enterprises (CSOMEs) as a con-tinuation research of the previous papers. The influence of the “China effect” and global financial crisis are also brought together to study how they impact the op-erational competitiveness of CSOMEs on top of their manufacturing strategy and transformational leadership.
In answering RQ1 and RQ2, the study attempts to develop and assess a theoretical model that incorporates manufacturing strategy and transformational leadership as indicators of operational performance. It first generally describes the theoretical models and the expected relationships among the modelled components of strat-egy, leadership, performance, and then tests the assumptions with case studies. The concepts of overall competitiveness and competitiveness potential are for the first time invented to evaluate combined competitiveness performance with the transformational capabilities of the leadership and technology level on top of manufacturing strategy and to forecast the effects of using dynamic decisions to improve operational competitiveness. The other major contribution is the argu-mentation about the significant effect of technology level on the resource index of transformational leadership, which should be also emphasized in dynamic deci-sion-making.
The findings show that manufacturing strategy and transformational leadership with technology level all have effects on operational competitiveness and there-fore it is more comprehensive to evaluate competitiveness based on all factors, and transformational leadership has a more significant effect than manufacturing strategy on improving overall competitiveness as the key to making dynamic de-cisions to deal with turbulent business situations such as economic crisis, espe-cially the leadership index is the most decisive factor in terms of total leadership index. Manufacturing strategy index (MSI) has a significant relationship with outcome index (OI), which implies that the outcome direction of leadership has an important effect on manufacturing strategy. The OI is the key factor to direct-ing the strategic goal and MSI is the driving force of the company, therefore overall competitiveness is provisionally proposed to be evaluated based on MSI and OI.
Acta Wasaensia 39
3.2.5 Paper 5: Competitiveness development of Chinese manufacturing enterprises in global context for crisis management
This paper presents a very current issue – the evaluation of how manufacturing enterprises are able to manage the current economic crisis by adjusting their manufacturing strategy and transforming their leadership and technology level in order to improve their operational competitiveness performance. It presents the economic example that China sets for the world, particularly in dealing with the current economic crisis, and shows how it is exemplary in developing competi-tiveness for crisis management, from which aspect it connects the previous re-search in global competitiveness analysis and promotes a consistent concept of proactive operations in answering all three research questions RQ1, RQ2 and RQ3.
The motivation for this study comes from China’s leading role in dealing with the current global financial crisis. China is a major player in the world economy at the present time and will only grow in prominence in the future. Research on the Chinese economy, its companies’ competitive strategies, business leadership styles and technology, are obviously important research areas. This paper deals with all of these areas and has a clear connection to management and enterprise development. In answering RQ1, it starts from reviewing the analytical models developed in the previous studies and develops a theoretical approach of integrat-ing the core factors which influence the operational competitiveness performance, i.e. manufacturing strategy and transformational leadership with technology level, into conceptual analytical models to evaluate overall competitiveness. In answer-ing RQ2 and RQ3, it compares different business situations, namely before, dur-ing and after a crisis by adjusting manufacturing strategy and transformational leadership with technology level to conclude how to manage the crisis with dy-namic decision-making and developing overall competitiveness potential further. The empirical studies are focused on case companies in the most dynamic market – China, especially Chinese large and medium-sized manufacturing enterprises (CLMMEs), and comparing their operational competitiveness performances in a global context with European case companies from Finland, Slovakia, Spain and Iceland which have comparable size and similar industries. All the case studies in these countries are carried out using exactly the same methodologies to the case studies carried out in China, with great effort made to collect and present directly the opinions of the informants to prove the validity, reliability and finally the ob-jective traceability of the results, which are completely objective and purely fac-tually based. The overall competitiveness of over 20 case companies is studied using the proposed analytical models to conclude the experience of crisis man-
40 Acta Wasaensia
agement, which can become a model for crisis management studies of companies globally as well as foreign companies in China.
There are some interesting findings from this paper. In general, CLMMEs man-age crisis by taking both external action based on government behaviour and in-ternal action by self-adjustment. Many have believed that government behaviour has a very big or even major influence on the crisis management of enterprises in China and doubt the difficulty of comparing, or whether it is even possible to compare enterprises in such a different country with such different economical frameworks to other countries. In this paper the governmental influence on the case companies in China is also discussed extensively, but from the comparison results it can be found that enterprise actions using dynamic decisions by adjust-ing manufacturing strategy and transforming leadership are the key to and major factor in crisis management but the government actions are not. Chinese state-owned companies are no longer regulated by the government as they were dec-ades ago. The analysis results show clearly that the leadership has improved much more during the crisis than before it, which implies that state-owned companies are nowadays much more autonomous and succeed thanks to good leadership, which comes from highly experienced and selected leaders, but relies much less on subsidies from government. The case CLMME is highly competitive in a global context, and it has chosen analyzer as competitive group during the crisis, plus a comprehensive improvement of leadership, have together resulted in even stronger competitiveness during the crisis. The overall competitiveness has been well improved thanks to the active and correct adjustments of manufacturing strategy and transformational leadership, and the forecasted overall competitive-ness after the crisis shows a continuous improvement over the previous indexes before the crisis. The benchmarking results show that during crisis the case com-panies in China are able to develop overall competitiveness better and show stronger potential in overall competitiveness compared to cases in other European countries. This probably explains China’s leading role in dealing with global eco-nomic crisis from the operational point of view, and such a concept of proactive operations is considered as the ultimate goal of this whole research work.

Acta Wasaensia 41
4 EMPIRICAL RESEARCH
In this chapter, a complete example of the development of operational competi-tiveness potential of case companies in China, Finland, Slovakia, Spain and Ice-land is presented in order to illustrate the applicability of implementing SCA for proactive operations to manage in times of economic crisis.
4.1 Overview of analysis process
The collected answers from questionnaires are processed and analyzed step by step for the evaluation of operational competitiveness and development of opera-tional competitiveness potential. Figure 3 shows the complete process of the em-pirical research from data collection to conclusion, as illustrated in the flowchart.
Figure 3. Flowchart for empirical research
Conclusion
Answers from ques-tionnaires
AHP analysis of raw data
(Expert Choice)
Analytical evaluation of MSI and TLI
(Matlab)
Correlation analysis of MSI vs TLI
(Excel or Matlab)
Development analysis of OCI potential
(Matlab)
Data collection
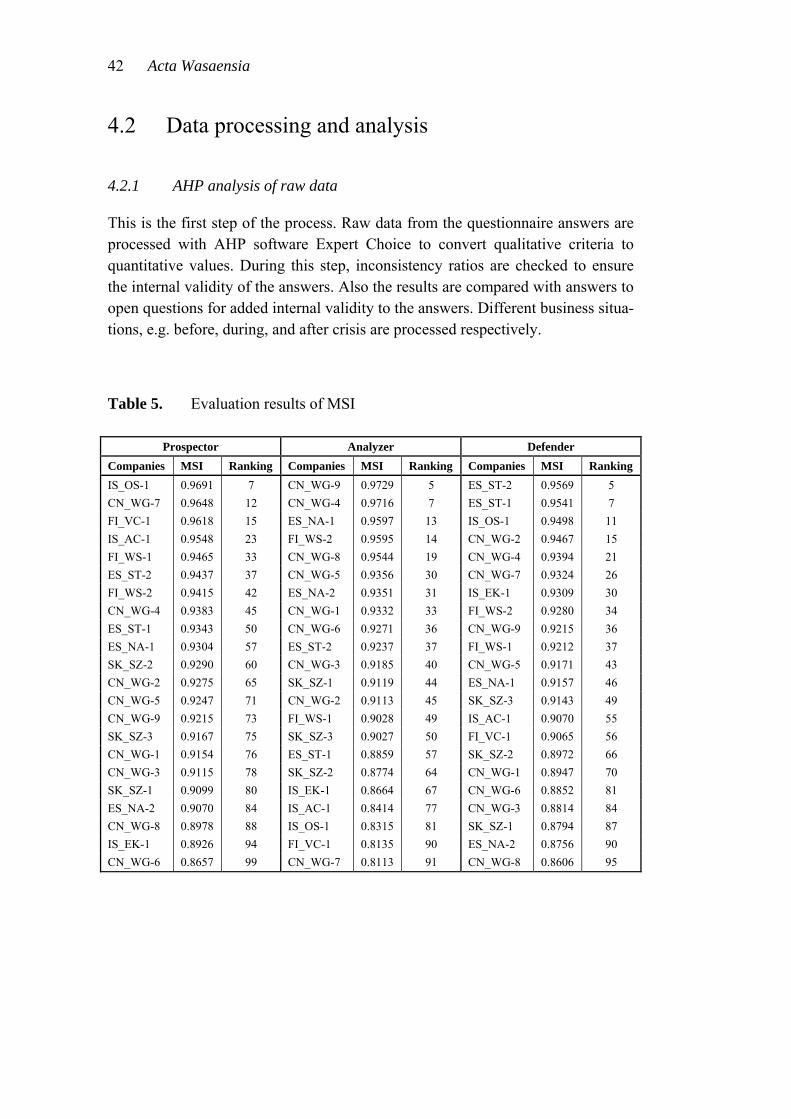
42 Acta Wasaensia
4.2 Data processing and analysis
4.2.1 AHP analysis of raw data
This is the first step of the process. Raw data from the questionnaire answers are processed with AHP software Expert Choice to convert qualitative criteria to quantitative values. During this step, inconsistency ratios are checked to ensure the internal validity of the answers. Also the results are compared with answers to open questions for added internal validity to the answers. Different business situa-tions, e.g. before, during, and after crisis are processed respectively.
Table 5. Evaluation results of MSI
Prospector Analyzer Defender
Companies MSI Ranking Companies MSI Ranking Companies MSI Ranking
IS_OS-1 0.9691 7 CN_WG-9 0.9729 5 ES_ST-2 0.9569 5
CN_WG-7 0.9648 12 CN_WG-4 0.9716 7 ES_ST-1 0.9541 7
FI_VC-1 0.9618 15 ES_NA-1 0.9597 13 IS_OS-1 0.9498 11
IS_AC-1 0.9548 23 FI_WS-2 0.9595 14 CN_WG-2 0.9467 15
FI_WS-1 0.9465 33 CN_WG-8 0.9544 19 CN_WG-4 0.9394 21
ES_ST-2 0.9437 37 CN_WG-5 0.9356 30 CN_WG-7 0.9324 26
FI_WS-2 0.9415 42 ES_NA-2 0.9351 31 IS_EK-1 0.9309 30
CN_WG-4 0.9383 45 CN_WG-1 0.9332 33 FI_WS-2 0.9280 34
ES_ST-1 0.9343 50 CN_WG-6 0.9271 36 CN_WG-9 0.9215 36
ES_NA-1 0.9304 57 ES_ST-2 0.9237 37 FI_WS-1 0.9212 37
SK_SZ-2 0.9290 60 CN_WG-3 0.9185 40 CN_WG-5 0.9171 43
CN_WG-2 0.9275 65 SK_SZ-1 0.9119 44 ES_NA-1 0.9157 46
CN_WG-5 0.9247 71 CN_WG-2 0.9113 45 SK_SZ-3 0.9143 49
CN_WG-9 0.9215 73 FI_WS-1 0.9028 49 IS_AC-1 0.9070 55
SK_SZ-3 0.9167 75 SK_SZ-3 0.9027 50 FI_VC-1 0.9065 56
CN_WG-1 0.9154 76 ES_ST-1 0.8859 57 SK_SZ-2 0.8972 66
CN_WG-3 0.9115 78 SK_SZ-2 0.8774 64 CN_WG-1 0.8947 70
SK_SZ-1 0.9099 80 IS_EK-1 0.8664 67 CN_WG-6 0.8852 81
ES_NA-2 0.9070 84 IS_AC-1 0.8414 77 CN_WG-3 0.8814 84
CN_WG-8 0.8978 88 IS_OS-1 0.8315 81 SK_SZ-1 0.8794 87
IS_EK-1 0.8926 94 FI_VC-1 0.8135 90 ES_NA-2 0.8756 90
CN_WG-6 0.8657 99 CN_WG-7 0.8113 91 CN_WG-8 0.8606 95
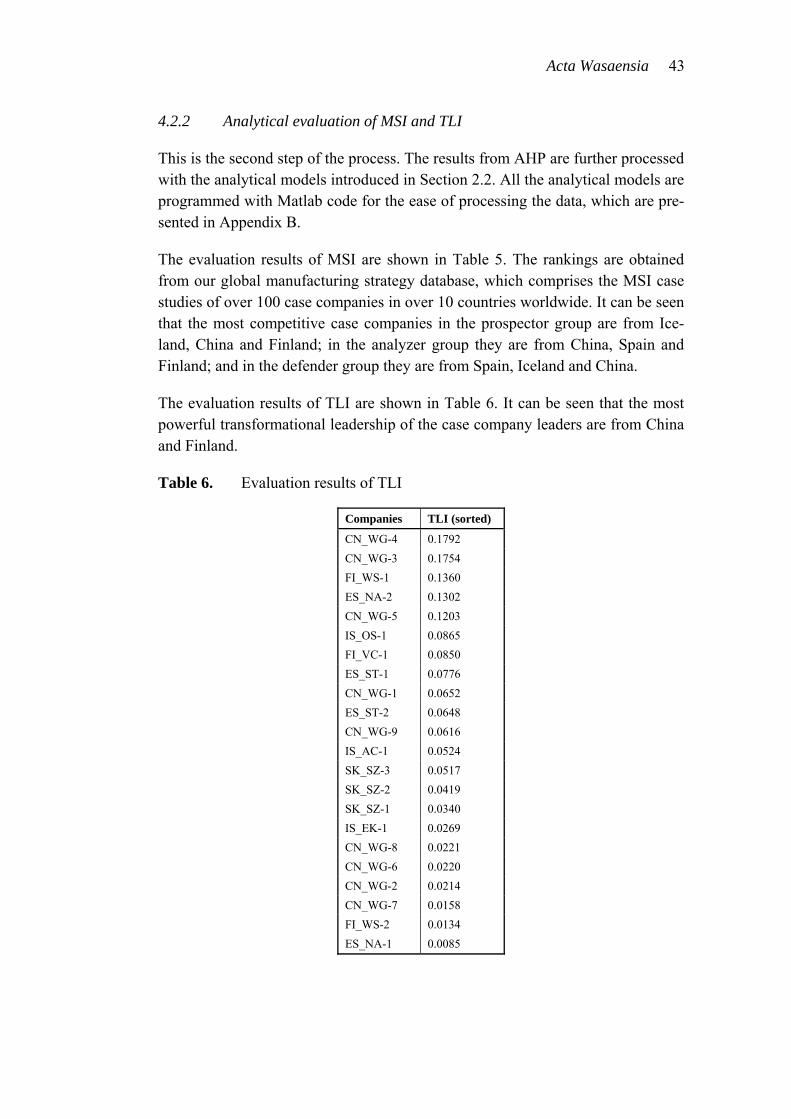
Acta Wasaensia 43
4.2.2 Analytical evaluation of MSI and TLI
This is the second step of the process. The results from AHP are further processed with the analytical models introduced in Section 2.2. All the analytical models are programmed with Matlab code for the ease of processing the data, which are pre-sented in Appendix B.
The evaluation results of MSI are shown in Table 5. The rankings are obtained from our global manufacturing strategy database, which comprises the MSI case studies of over 100 case companies in over 10 countries worldwide. It can be seen that the most competitive case companies in the prospector group are from Ice-land, China and Finland; in the analyzer group they are from China, Spain and Finland; and in the defender group they are from Spain, Iceland and China.
The evaluation results of TLI are shown in Table 6. It can be seen that the most powerful transformational leadership of the case company leaders are from China and Finland.
Table 6. Evaluation results of TLI
Companies TLI (sorted)
CN_WG-4 0.1792
CN_WG-3 0.1754
FI_WS-1 0.1360
ES_NA-2 0.1302
CN_WG-5 0.1203
IS_OS-1 0.0865
FI_VC-1 0.0850
ES_ST-1 0.0776
CN_WG-1 0.0652
ES_ST-2 0.0648
CN_WG-9 0.0616
IS_AC-1 0.0524
SK_SZ-3 0.0517
SK_SZ-2 0.0419
SK_SZ-1 0.0340
IS_EK-1 0.0269
CN_WG-8 0.0221
CN_WG-6 0.0220
CN_WG-2 0.0214
CN_WG-7 0.0158
FI_WS-2 0.0134
ES_NA-1 0.0085
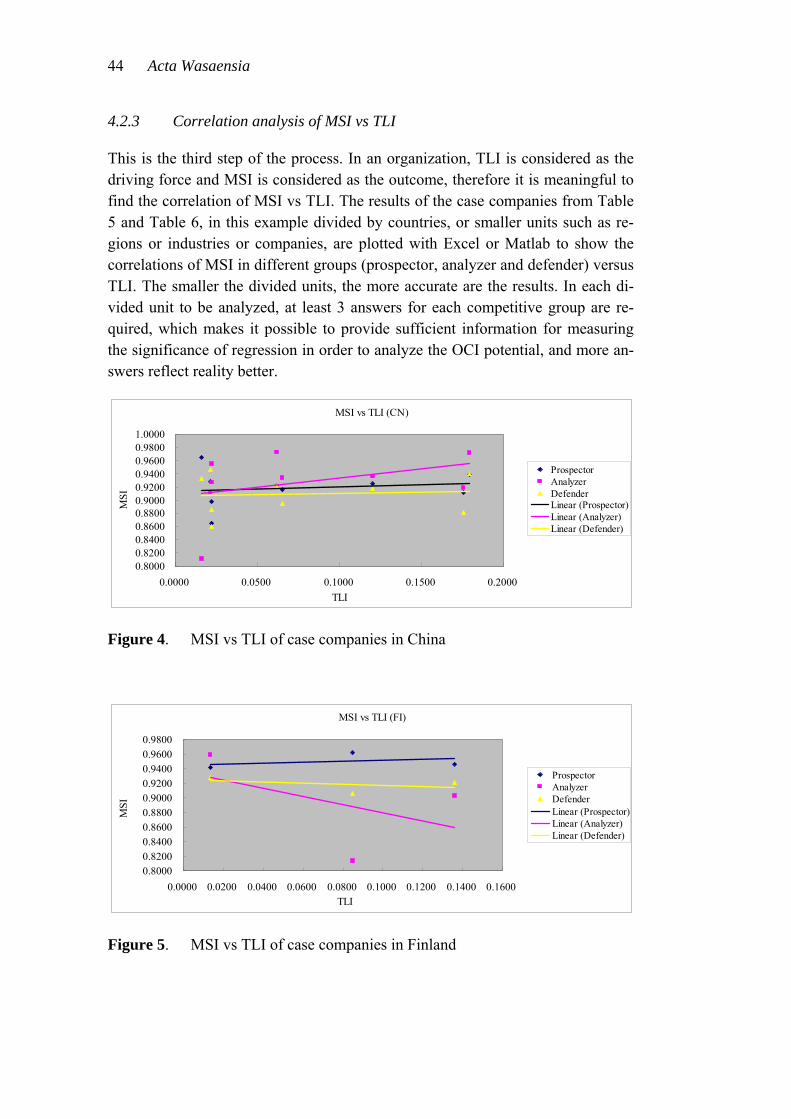
44 Acta Wasaensia
4.2.3 Correlation analysis of MSI vs TLI
This is the third step of the process. In an organization, TLI is considered as the driving force and MSI is considered as the outcome, therefore it is meaningful to find the correlation of MSI vs TLI. The results of the case companies from Table 5 and Table 6, in this example divided by countries, or smaller units such as re-gions or industries or companies, are plotted with Excel or Matlab to show the correlations of MSI in different groups (prospector, analyzer and defender) versus TLI. The smaller the divided units, the more accurate are the results. In each di-vided unit to be analyzed, at least 3 answers for each competitive group are re-quired, which makes it possible to provide sufficient information for measuring the significance of regression in order to analyze the OCI potential, and more an-swers reflect reality better.
MSI vs TLI (CN)
0.80000.82000.84000.86000.88000.90000.92000.94000.96000.98001.0000
0.0000 0.0500 0.1000 0.1500 0.2000
TLI
MS
I
ProspectorAnalyzerDefenderLinear (Prospector)Linear (Analyzer)Linear (Defender)
Figure 4. MSI vs TLI of case companies in China
MSI vs TLI (FI)
0.80000.82000.84000.86000.88000.90000.92000.94000.96000.9800
0.0000 0.0200 0.0400 0.0600 0.0800 0.1000 0.1200 0.1400 0.1600TLI
MS
I
ProspectorAnalyzerDefenderLinear (Prospector)Linear (Analyzer)Linear (Defender)
Figure 5. MSI vs TLI of case companies in Finland
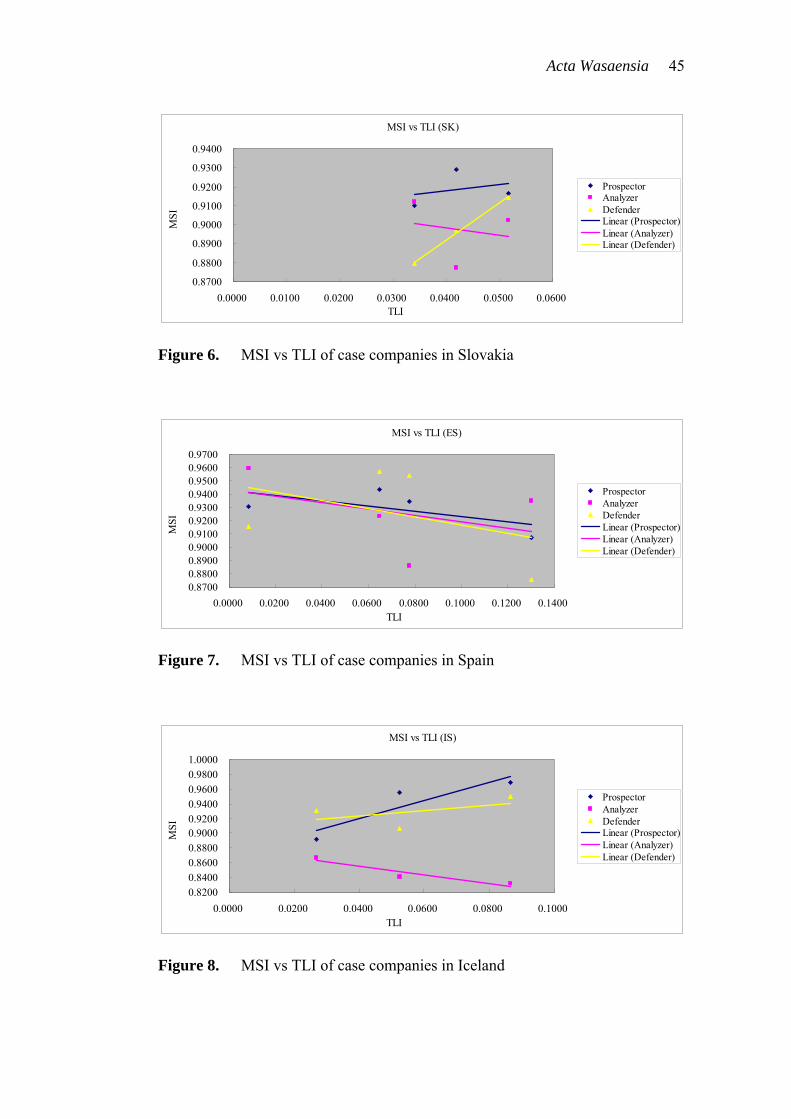
Acta Wasaensia 45
MSI vs TLI (SK)
0.8700
0.8800
0.8900
0.9000
0.9100
0.9200
0.9300
0.9400
0.0000 0.0100 0.0200 0.0300 0.0400 0.0500 0.0600TLI
MS
IProspectorAnalyzerDefenderLinear (Prospector)Linear (Analyzer)Linear (Defender)
Figure 6. MSI vs TLI of case companies in Slovakia
MSI vs TLI (ES)
0.87000.88000.89000.90000.91000.92000.93000.94000.95000.96000.9700
0.0000 0.0200 0.0400 0.0600 0.0800 0.1000 0.1200 0.1400TLI
MS
I
ProspectorAnalyzerDefenderLinear (Prospector)Linear (Analyzer)Linear (Defender)
Figure 7. MSI vs TLI of case companies in Spain
MSI vs TLI (IS)
0.82000.84000.86000.88000.90000.92000.94000.96000.98001.0000
0.0000 0.0200 0.0400 0.0600 0.0800 0.1000TLI
MS
I
ProspectorAnalyzerDefenderLinear (Prospector)Linear (Analyzer)Linear (Defender)
Figure 8. MSI vs TLI of case companies in Iceland
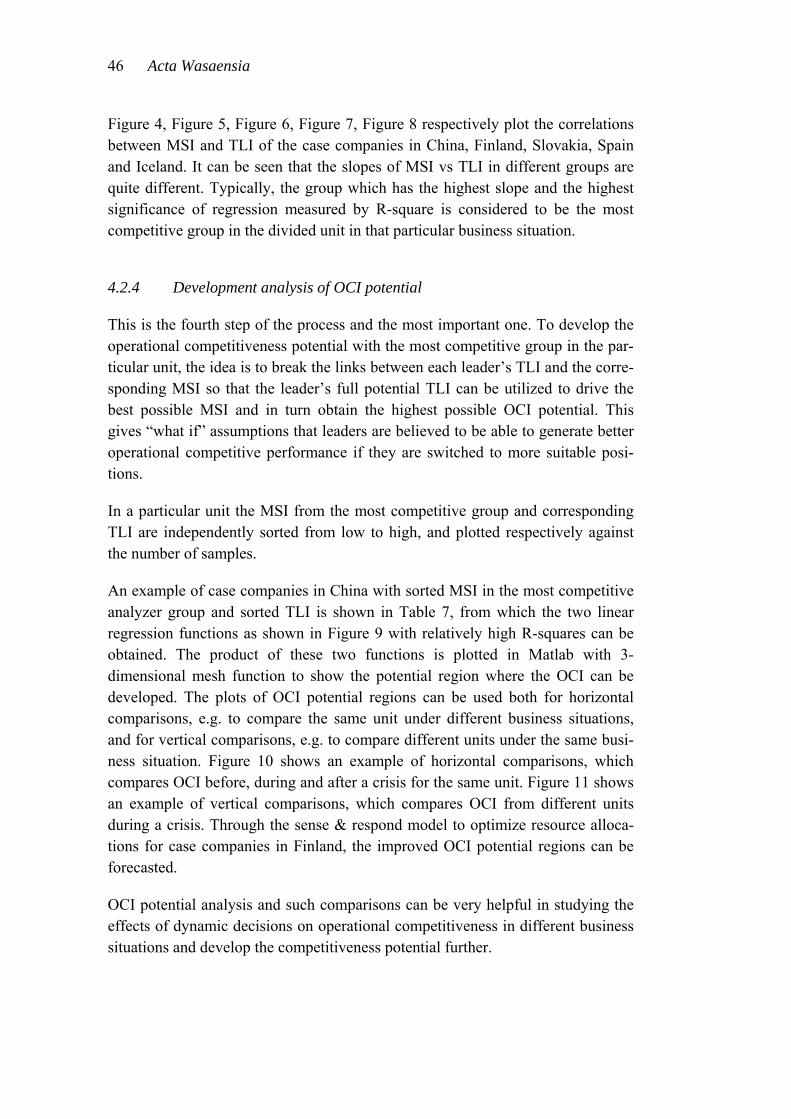
46 Acta Wasaensia
Figure 4, Figure 5, Figure 6, Figure 7, Figure 8 respectively plot the correlations between MSI and TLI of the case companies in China, Finland, Slovakia, Spain and Iceland. It can be seen that the slopes of MSI vs TLI in different groups are quite different. Typically, the group which has the highest slope and the highest significance of regression measured by R-square is considered to be the most competitive group in the divided unit in that particular business situation.
4.2.4 Development analysis of OCI potential
This is the fourth step of the process and the most important one. To develop the operational competitiveness potential with the most competitive group in the par-ticular unit, the idea is to break the links between each leader’s TLI and the corre-sponding MSI so that the leader’s full potential TLI can be utilized to drive the best possible MSI and in turn obtain the highest possible OCI potential. This gives “what if” assumptions that leaders are believed to be able to generate better operational competitive performance if they are switched to more suitable posi-tions.
In a particular unit the MSI from the most competitive group and corresponding TLI are independently sorted from low to high, and plotted respectively against the number of samples.
An example of case companies in China with sorted MSI in the most competitive analyzer group and sorted TLI is shown in Table 7, from which the two linear regression functions as shown in Figure 9 with relatively high R-squares can be obtained. The product of these two functions is plotted in Matlab with 3-dimensional mesh function to show the potential region where the OCI can be developed. The plots of OCI potential regions can be used both for horizontal comparisons, e.g. to compare the same unit under different business situations, and for vertical comparisons, e.g. to compare different units under the same busi-ness situation. Figure 10 shows an example of horizontal comparisons, which compares OCI before, during and after a crisis for the same unit. Figure 11 shows an example of vertical comparisons, which compares OCI from different units during a crisis. Through the sense & respond model to optimize resource alloca-tions for case companies in Finland, the improved OCI potential regions can be forecasted.
OCI potential analysis and such comparisons can be very helpful in studying the effects of dynamic decisions on operational competitiveness in different business situations and develop the competitiveness potential further.
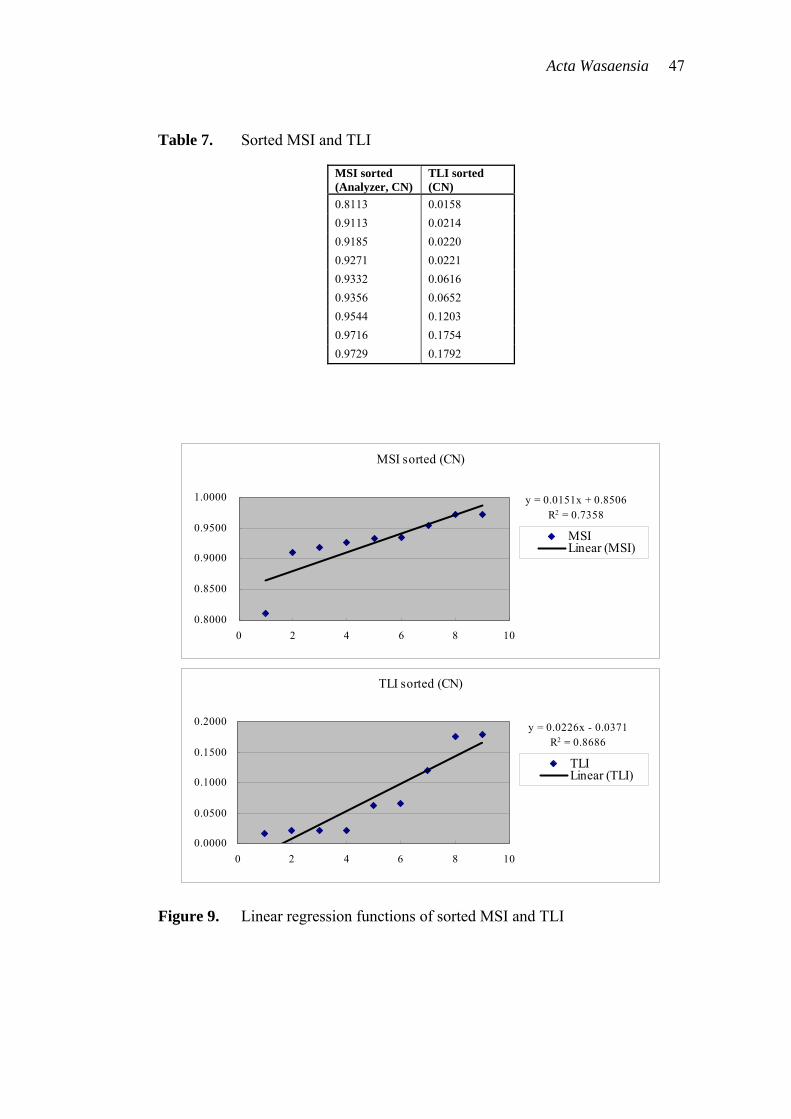
Acta Wasaensia 47
Table 7. Sorted MSI and TLI
MSI sorted (Analyzer, CN)
TLI sorted (CN)
0.8113 0.0158
0.9113 0.0214
0.9185 0.0220
0.9271 0.0221
0.9332 0.0616
0.9356 0.0652
0.9544 0.1203
0.9716 0.1754
0.9729 0.1792
MSI sorted (CN)
y = 0.0151x + 0.8506R2 = 0.7358
0.8000
0.8500
0.9000
0.9500
1.0000
0 2 4 6 8 10
MSILinear (MSI)
TLI sorted (CN)
y = 0.0226x - 0.0371R2 = 0.8686
0.0000
0.0500
0.1000
0.1500
0.2000
0 2 4 6 8 10
TLILinear (TLI)
Figure 9. Linear regression functions of sorted MSI and TLI
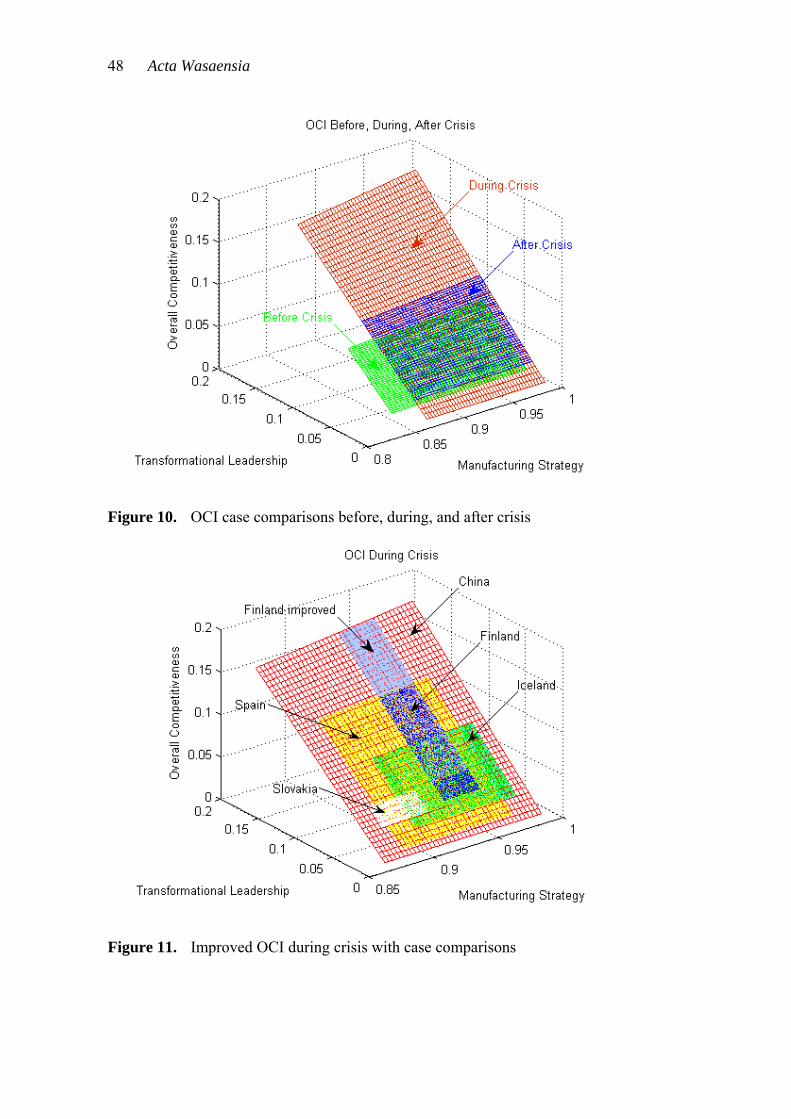
48 Acta Wasaensia
Figure 10. OCI case comparisons before, during, and after crisis
Figure 11. Improved OCI during crisis with case comparisons
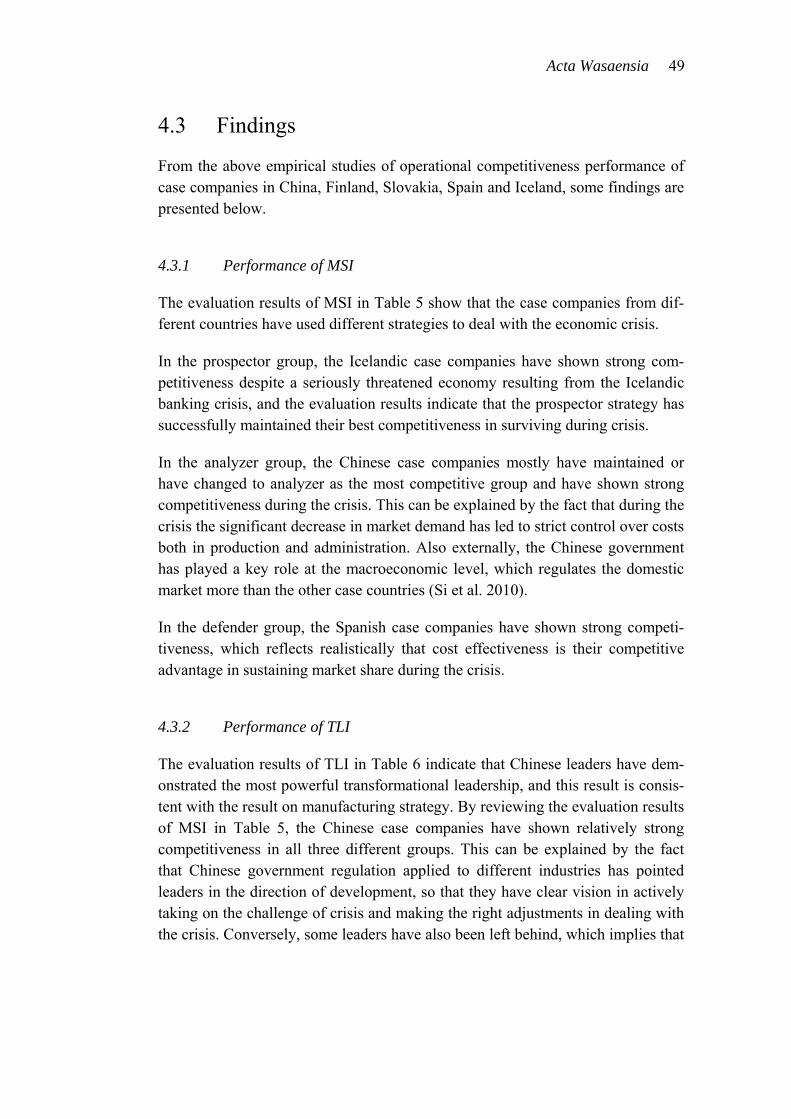
Acta Wasaensia 49
4.3 Findings
From the above empirical studies of operational competitiveness performance of case companies in China, Finland, Slovakia, Spain and Iceland, some findings are presented below.
4.3.1 Performance of MSI
The evaluation results of MSI in Table 5 show that the case companies from dif-ferent countries have used different strategies to deal with the economic crisis.
In the prospector group, the Icelandic case companies have shown strong com-petitiveness despite a seriously threatened economy resulting from the Icelandic banking crisis, and the evaluation results indicate that the prospector strategy has successfully maintained their best competitiveness in surviving during crisis.
In the analyzer group, the Chinese case companies mostly have maintained or have changed to analyzer as the most competitive group and have shown strong competitiveness during the crisis. This can be explained by the fact that during the crisis the significant decrease in market demand has led to strict control over costs both in production and administration. Also externally, the Chinese government has played a key role at the macroeconomic level, which regulates the domestic market more than the other case countries (Si et al. 2010).
In the defender group, the Spanish case companies have shown strong competi-tiveness, which reflects realistically that cost effectiveness is their competitive advantage in sustaining market share during the crisis.
4.3.2 Performance of TLI
The evaluation results of TLI in Table 6 indicate that Chinese leaders have dem-onstrated the most powerful transformational leadership, and this result is consis-tent with the result on manufacturing strategy. By reviewing the evaluation results of MSI in Table 5, the Chinese case companies have shown relatively strong competitiveness in all three different groups. This can be explained by the fact that Chinese government regulation applied to different industries has pointed leaders in the direction of development, so that they have clear vision in actively taking on the challenge of crisis and making the right adjustments in dealing with the crisis. Conversely, some leaders have also been left behind, which implies that
50 Acta Wasaensia
they are passively waiting for government solutions and trying adjustments in the wrong way because of lack of experience.
4.3.3 Performance of MSI vs TLI
From the correlation analysis it can be seen that in the different case countries, or even under different business situations, the slopes of MSI vs TLI may be positive or negative. Especially in Figure 7 the cases in Spain where MSI vs TLI in all groups have negative slopes, which implies good transformational leadership does not necessarily lead to strong competitiveness in manufacturing strategy. The only exception is the cases in China, as shown in Figure 4, where MSI vs TLI in all groups has positive slopes, which implies that during the crisis the leadership is really motivated and plays a key role in dealing with the crisis. The slope of MSI vs TLI in the analyzer group is the highest, which proves that transforma-tional leadership makes manufacturing strategy more competitive in the analyzer group during the crisis. Figure 5 and Figure 8 demonstrate how TLI affects MSI for the case companies in Finland and Iceland. The slopes of MSI vs TLI indicate that they have highest competitiveness in the prospector group. These results cor-respond with the fact that many of the Finnish firms are advanced in technology and have a good vision of future product development, and Icelandic firms have survived during the crisis by aggressively searching for new markets and profit from product innovations despite the serious impact of economic downturn on its economy. Figure 6 implies that the case companies in Slovakia have the highest competitiveness in the defender group, which can be explained in practice by Slovakian firms being very cost efficient, and during the crisis they have used a low cost strategy to obtain market share, however the results are not promising.
A general finding is that leaders in China show active adjustment during crisis, whereas leaders in other countries seem more conservative, and that limits further the competitiveness of their manufacturing and technology strategies, causing negative slopes of MSI vs TLI. It is assumed that in China leaders are adventur-ous in making more competitive decisions since they have strong support from the government and thus do not need to worry too much about taking aggressive decisions.
Another significant finding in MSI vs TLI is that typically in the analyzer group the plots are scattered, which results in very low R-square values, whereas in the prospector group and especially in the defender group the plots usually result in relatively higher R-square values. The causes of such phenomena will be dealt with in future research.
Acta Wasaensia 51
4.3.4 Performance of OCI
The 3-dimentional plots in Figure 10 and Figure 11 show the competitiveness potential of the case companies in different business situations and in different countries where the OCI can be developed. It can be seen that transformational leadership has a more significant effect than manufacturing strategy in improving overall competitiveness potential.
Through such proactive operations in developing sustainable competitive advan-tage, the forecasted OCI after crisis shows continuous improvement over the pre-vious OCI before the crisis in Figure 10 and the forecasted OCI improvement is significant compared with the previous one in Figure 11, where the research goal of this work is reached and answers to research questions are identified.
4.4 Summary
Compared to previous research results conducted all before crisis, such a com-parative study as the present one, which places a number of case studies longitu-dinally to examine the impact of economic crisis, presents a unique opportunity to find the solution of how to overcome and recover from economic crisis.
To conclude this empirical research, the case companies in China show strong potential in developing overall operational competitiveness compared to the case companies in other countries, which might explain China’s leading role in dealing with the global economic crisis from the operational point of view. This can be further seen from official statistics. According to The World Bank’s (2010) latest China Quarterly Update released in March 2010, China’s economy grew by 8.7 percent in 2009 and the growth momentum continued in the first months of 2010 in spite of the global recession. The adjustments in manufacturing strategy and transformation leadership by implementing SCA through fast strategy are proved to be effective and successful in managing the crisis and maintaining the high growth of the Chinese economy. The results and experience from this research can thus become a model for crisis management studies globally.
52 Acta Wasaensia
5 DISCUSSION AND CONCLUSIONS
5.1 Findings and contributions
This work studies the evaluation and development of overall operational competi-tiveness in a global context using analytical models, which is a novel concept in integrating the evaluation of manufacturing strategy and transformational leader-ship with technology level together, and through sense & respond proactive op-erations improving the competitiveness potential in order to manage turbulent business situations. The empirical research is focused on numerous case studies of companies in China and several European countries to compare their overall competitiveness in a global context and analyze their experience of managing the economic crisis, with the purpose of finding solutions to manage turbulent busi-ness situations. The influence of the “China effect” and global economic crisis are brought together to study how they will impact the operational competitiveness of companies on top of their previous manufacturing strategy and transformational leadership before the crisis, how they will react during the crisis to adjust their current manufacturing strategy and transformational leadership to manage the crisis, and even to predict after the crisis how they will minimize the negative impacts to sustain and develop their optimal operational competitiveness further.
Some general findings are discussed and concluded from this research work.
Increased competitiveness in the analyzer group during the crisis
During the economic crisis, the case companies have generally increased empha-sis on the cost of their manufacturing strategies. The strategies have been changed according to the measurement of new customer and market behaviour, e.g. to overcome currency depreciation, change of product line, change of supplier net-work, and increased flexibility in certain areas to gain new customers and new markets. Decreased market demand has driven them to improve their control ca-pability over cost, and this, together with the need for increased flexibility, has made the case companies even more competitive in the analyzer group. From this study, the analyzer group is considered to be the best competitive group to man-age turbulent business situations such as the global economic crisis.
Correlation of total leadership index and manufacturing strategy index
The slopes of MSI vs TLI under different business situations can be positive or negative, and the highest slope with highest R-square reveals the best competitive group in the current situation. Negative slope can be observed more typically be-
Acta Wasaensia 53
fore the crisis. This implies that leaders are not active or not suitable in their cur-rent positions, and in some cases leadership is more constrained by higher ad-ministration and government macro-control. Positive slope can be observed pos-sibly during and after crisis, but not always necessarily. During a crisis, leader-ship is motivated and the leaders react more actively not only to follow passively the macro-control but also to adjust their strategies according to changes in the market and develop relevant measures to deal with the crisis. This can also lead to substantially improved motivation and improvement of leadership reflected in a more active market after the crisis. However, the slopes of MSI vs TLI are typi-cally observed in empirical research to be increased during a crisis than before it which signifies improvements of OCI, regardless whether they are negative or positive. This gives good practical support to validating the theories generated in this research work.
Experience of managing economic crisis from case studies in China
China’s leading role in dealing with the global economic crisis has been obvious to the whole world, and therefore its experience is worth studying. Liu & Takala (2010b) summarize the impacts of economic crisis as mainly falling into two ar-eas. One is that products are overstocked because of the shrinkage of market de-mand. Another is that funding chains are broken because of the shrinkage of cur-rency and bank loan. The solutions to manage the crisis are mainly from external and internal actions. External actions from the government give support during crisis situations to help companies to overcome the crisis. The government poli-cies to deal with crisis are mainly macro-control of the market to stimulate do-mestic demand and to stabilize international demand by stabilizing export poli-cies, and also by putting efforts into increasing loans and loosening monetary policies, which also helps to stimulate the domestic market. Such actions bring increased orders and the profit level back to normal. Although external actions play a significant role, they alone will never be able to solve the crisis if compa-nies do not save themselves by taking internal actions. The internal actions from companies themselves are mainly from adjustments in manufacturing strategy by e.g. lowering the cost, regulating the production, increasing the marketing effort, together with improvements in their transformational leadership and technology strategy, to overcome the crisis situation. The evaluation, identification and im-plementation of such proactive operations to manage in global turbulent business environments are considered as the primary finding and contribution of this work.
Finally, the answers to the three research questions can be briefly summarized. Competitiveness in manufacturing operations is evaluated in terms of overall competitiveness performance by integrating the core factors, i.e. manufacturing
54 Acta Wasaensia
strategy and transformational leadership with technology level, into conceptual analytical models, and through sense & respond to optimize resource allocations to help in dynamic decisions in adjusting strategies and transforming leadership in order to improve the competitiveness potential in a sustainable manner. Imple-menting such strategic adjustments and transformational capabilities are proposed as the unique SCA for managing in global turbulent business environments.
5.2 Theoretical and practical implications
The theoretical implication of this research proposes a complete system to evalu-ate overall competitiveness in global context using analytical models, by integrat-ing manufacturing strategy and transformational leadership with technology level together and improve overall competitiveness potential using sense & respond.
The practical implication of this study makes it possible to compare in global con-text the operational competitiveness of companies with foreign competitors which are highly competitive in turbulent business environments e.g. dealing with crisis, and evaluate the performance of new strategy adjustments, whether they are ef-fective to deal with the changing business situations, and how they can improve the overall competitiveness to manage the changing business situations better. To study how enterprises are dealing with crisis shows other enterprises good indica-tions and development routes, and therefore helps them to deal with similar crisis situation. With global economic downturn, managing turbulent situations success-fully when the business is in adversity is typically more challenging than manag-ing growing up business in prosperity.
The proactive operations of such dynamic strategic adjustments and transforma-tional capabilities are proposed in this study as the key to implement the unique SCA with empirical case studies internationally, which provides both theoretical significance and also practical benefit to conclude the experience of managing proactive operations in global turbulent business environments.
5.3 Validity and reliability
The research methodology in research design has ensured the validity and reli-ability from the following aspects. The validity and reliability criteria of the case studies can be utilized for this concluding research thanks to the careful documen-tation used in the case companies. The interviewed high competence experts are representative to know well the operations of the studied case company. These
Acta Wasaensia 55
informants are trained to understand every item of the questionnaires correctly and how to make consistent answers. The data collected typically from limited and described application problems is mainly qualitative in nature and its validity and reliability can be ensured by improving the required careful documentation of the cases. The AHP based instruments e.g. forms and questionnaires have been used in our previous case studies for more than 20 years in successful analysis of case companies and their validity and reliability are proven. The inconsistency ratio has been calculated and only answers with an inconsistency ratio below the limit are accepted in order to assure the internal validity of the pairwise compari-son results. Furthermore, some redundant open questions are used in addition to the pairwise comparisons in the AHP questionnaires to add more internal validity to the answers. The RAL holistic model (Takala 2002) supports the external va-lidity of the analytical models from the theory point of view. The discussion with managers or directors supports the results and verifies the validity and reliability of the data. The generalizability is improved by multiple and longitudinal case studies lasting from half a year up to two years per case. The objectivity is in-creased by using different researchers in personal interviews of the informants and analysis of each different case company. The market-based validation for assessing the construction of this work is also carried out by undergoing weak and semi-strong market tests, by applying the proposed framework for implementing SCA in evaluation and improvement of operational competitiveness in over 30 case companies already by now and more and more cases are in progress.
In overall, this research has utilized same methods, versatile theories, separate research teams in each case, with triangulated information sources and careful documentation of the cases and finally market tests to ensure the quality and trustworthiness.
5.4 Research limitations
The analytical models for manufacturing strategy are not sufficiently calibrated in the global context. More issues need to be addressed in different regions such as different levels of quality, cost, time and flexibility, especially the technology level, as they all have an important impact on the competitiveness level of com-panies.
The analytical models for transformational leadership are only capable of evaluat-ing the leadership of the performing leader’s own task in the own position in cer-tain business situations. Good leadership does not necessarily stay good if the leader’s position or business situation is changed.
56 Acta Wasaensia
The overall competitiveness potential is limited to the operational strategy level. It does not necessarily reflect the real business potential of the studied unit in the market. Similarly, a good overall competitiveness ranking does not necessarily lead to high business performance of the studied unit in the global market.
The results of the case studies are not to be generalized outside of the case com-panies. The case studies do not represent any general cases but are just cases with characteristics, which the relevant ones include e.g. the size of the case compa-nies, the ownership of the case companies, industrial branches, etc. and all should be specified while making conclusions. Out of these characteristics the irrelevant characteristics might be detailed description of the employees e.g. gender, nation-ality, age distribution, educational background, etc., detailed description of the leadership positions, details of the balance sheet and profit and loss account as the immediate history, etc.
5.5 Future research
In future research, several ideas are proposed as follows.
It will be a continuous and challenging task to calibrate the analytical models in a global context with more intensive case studies addressing more issues, as men-tioned in the research limitations. The analytical models will go deeper to analyze the applicability and practicability of the results in turbulent business situations. They will be more intensively examined and calibrated by carrying out case stud-ies with the purpose of adapting to new business situations, e.g. crisis, and be able to suggest solutions based on the evaluation results obtained from the analytical models. The evaluations will be compared with more case studies with successful international companies to verify the validity further. The case studies will need to be longitudinally followed from one to two years to check whether the devel-opment of competitiveness potential can be achieved in practice. The related new developments or improvements may include, but will not be limited to: new measurement of customer behaviour through interviews and case studies, cus-tomer and market behaviour analysis under new business situations, strategy ad-justments according to different market needs and customer behaviour, opera-tional competitiveness performance simulation with new adjusted strategies, fore-casting of the effects of crisis and adjusted strategies, and other adjustments ex-cept strategies.
How government behaviour such as national policies and macro-control will af-fect enterprises may also be taken more into account for studies, in terms of
Acta Wasaensia 57
whether this will put companies into deeper crisis, e.g. with economic sanctions from foreign counties, etc; or will help companies recover from crisis, e.g. with local protection, government support for state-owned companies, etc. Also politi-cal reasons cannot be neglected and sometimes are decisive, since many large international orders are only based on bilateral government contracts. The ana-lytical models can therefore be further optimized according to different character-istics of market behaviour and economic situations. The real problems and chal-lenges of implementing strategies need to be also studied.
There will be further testing and proving of the finding that the highest slope and R-square of MSI vs TLI are decisive factors in suggesting the best competitive category to compete under that particular business situation, and why the sug-gested category is best will be investigated. The reactor category is considered to be another promising category to produce superior competitiveness in turbulent business situations, and will be studied further. A working hypothesis is proposed that when a company wants to achieve reactor behaviour in the organizational level, its management has to possess many leaders of the reactor type to make decisions and lead the whole company to behave as a reactor group of organiza-tion. Reactor type of leadership and reactor group of organizations will be studied further. The definition and analysis of the reactor group are worth studying on both a theoretical and practical level.
58 Acta Wasaensia
REFERENCES
Arbnor, I. & Bjerke, B. (1994). Företagsekonomisk metodlära. Lund: Studentlit-teratur.
Arbnor, I. & Bjerke, B. (1997). Methodology for Creating Business Knowledge. 2nd ed. Newbury Park: Sage.
Avella, L., Fernández, E. & Vázquez, C. J. (2001). Analysis of manufacturing strategy as an explanatory factor of competitiveness in the large Spanish indus-trial firm. International Journal of Production Economics 72: 2, 39-157.
Banuls, V. A. & Salmeron, J. L. (2008). Foresighting key areas in the Information Technology industry. Technovation 28: 3, 103-111.
Barney, J. B. (1991). Firm resources and sustained competitive advantage. Jour-nal of Management 17: 1, 99-120.
Barney, J. B., Wright, M. & Ketchen, D. J. (2001). The resource-based view of the firm: Ten years after 1991. Journal of Management 27: 6, 625-641.
Bass, B. M. (1985). Leadership and Performance beyond Expectations. New York: Free Press.
Bass, B. M. & Avolio, B. J. (1994). Improving Organizational Effectiveness through Transformational Leadership. Thousand Oaks: Sage.
Bass, B. M. (1997). Does the transactional-transformational leadership paradigm transcend organizational and national boundaries? American Psychologist 52: 2, 130-139.
Berman, S. J. & Hagan, J. (2006). How technology-driven business strategy can spur innovation and growth. Strategy & Leadership 34: 2, 28-34.
Bogan, C. E. & English, M. J. (1994). Benchmarking for Best Practices: Winning Through Innovative Adaptation. New York: McGraw-Hill.
Bradley, S. P. & Nolan, R. L. (1998). Sense & Respond: Capturing Value in the Network Era. Boston: Harvard Business School Press.
Braun, E. (1998). Technology in Context: Technology Assessment for Managers. London: Routledge.
Brenes, E. R., Mena, M. & Molina, G. E. (2008). Key success factors for strategy implementation in Latin America. Journal of Business Research 61: 6, 590-598.
Bryman, A. (2004). Social Research Methods. 2nd ed. Oxford: Oxford University Press.
Acta Wasaensia 59
Burns, J. M. (1978). Leadership. New York: Harper & Row.
Burns, J. M. (2003). Transforming Leadership. New York: Grove Press.
Canback, S. (1998). The logic of management consulting (part one). Journal of Management Consulting 10: 2, 3-11.
Canback, S. (1999). The logic of management consulting (part two). Journal of Management Consulting 10: 3, 3-12.
Carraher, S. M., Buckley, M. R. & Carraher, C. E. (2008). Research challenges in sustainable strategic management: change and sustainability. International Journal of Sustainable Strategic Management 1: 1, 2-15.
Chandler, A. D. (1962). Strategy and Structure: Chapters in the History of the Industrial Enterprise. Cambridge: MIT Press.
Childerhouse, P., Hermiz, R., Mason-Jones, R., Popp, A. & Towill, D. R. (2003). Information flow in automotive supply chains – identifying and learning to over-come barriers to change. Industrial Management & Data Systems 103: 7, 491-502.
Chong, J. K. S. (2004). Six steps to better crisis management. Journal of Business Strategy 25: 2, 43-46.
Coombs, W. T. (2010). Sustainability: a new and complex challenge for crisis managers. International Journal of Sustainable Strategic Management 2: 1, 4-16.
Creswell, J. W. (2007). Qualitative Inquiry and Research Design: Choosing Among Five Approaches. 2nd ed. Newbury: Sage.
Creswell, J. W. (2009). Research Design: Qualitative, Quantitative, and Mixed Methods Approaches. 3rd ed. Thousand Oaks: Sage.
Crittenden, V. L. & Crittenden, W. F. (2008). Building a capable organization: The eight levers of strategy implementation. Business Horizons 51: 4, 301-309.
Danermark, B. (2001). Explaining Society: An Introduction to Critical Realism in the Social Sciences. Florence: Routledge.
Day, G. S. & Wensley, R. (1988). Assessing advantage: A framework for diag-nosing competitive superiority. Journal of Marketing 52: 2, 1-20.
Doz, Y. & Kosonen, M. (2008). Fast Strategy: How strategic agility will help you stay ahead of the game. Harlow: Wharton School Publishing.
Eisenhardt, K. M. (1989). Building theories from case study research. Academy of Management Review 14: 4, 532-550.
60 Acta Wasaensia
Fahy, J. (2002). A resource-based analysis of sustainable competitive advantage in a global environment. International Business Review 11: 1, 57-77.
Ferdows, K. & De Meyer, A. (1990). Lasting improvements in manufacturing performance: In search of a new theory. Journal of Operations Management 9: 2, 168-184.
Fiol, C. M. (2001). Revisiting an identity-based view of sustainable competitive advantage. Journal of Management 27: 6, 691-699.
Galbreath, J. (2009). Addressing sustainability: a strategy development frame-work. International Journal of Sustainable Strategic Management 1: 3, 303-319.
Gerwin, D. (1993). Manufacturing flexibility: A strategic perspective. Manage-ment Science 39: 4, 395-410.
Ghobadian, A., Speller, S. & Jones, M. (1994). Service quality: concepts and models. International Journal of Quality & Reliability Management 11: 9, 43-66.
Grant, R. M. (1991). Analyzing resources and capabilities. In R. M. Grant (Ed). Contemporary Strategy Analysis: Concepts, Techniques, Applications. Malden: Blackwell. 93-122.
Guba, E. G. (1981). Criteria for assessing the trustworthiness of naturalistic in-quires. Educational Communication and Technology Journal 29: 2, 75-91.
Guba, E. G. & Lincoln, Y. S. (1994). Competing paradigms in qualitative re-search. In N. K. Denzin & Y. S. Lincoln (Eds). Handbook of Qualitative Re-search. Thousand Oaks: Sage. 105-117.
Haeckel, S. H. (1999). Adaptive Enterprise: Creating and Leading Sense-And-Respond Organizations. Boston: Harvard Business School Press.
Hall, R. (1993). A framework linking intangible resources and capabilities to sus-tainable competitive advantage. Strategic Management Journal 14: 8, 607-618.
Hamilton, J. (2009). A framework for positioning the global business. Proceed-ings of the 9th International Conference on Electronic Business – ICEB 2009. Macau.
Haro-Domínguez, C., Ortega-Egea, T. & Tamayo-Torres, I. (2010). Proactive orientation and its influence for technology acquisition. Industrial Management & Data Systems 110: 7, 953-970.
Haugen, L. K. & Davis, A. S. (2010). Bridging the thinking-doing divide: en-gaged in strategy implementation. International Journal of Learning and Intellec-tual Capital 7: 1, 40-54.
Acta Wasaensia 61
Hayes, R. H. & Wheelwright, S. C. (1984). Restoring Our Competitive Edge: Competing Through Manufacturing. New York: John Wiley & Sons.
Hayes, R. H., Wheelwright, S. C. & Clark, K. B. (1988). Dynamic Manufactur-ing: Creating the Learning Organization. New York: Free Press.
Helo, P. (2004). Managing agility and productivity in the electronics industry. Industrial Management & Data Systems 104: 7, 567-577.
Hirschheim, R., Klein, H. & Lyytinen, K. (1995). Information Systems Develop-ment and Data Modeling: Conceptual and Philosophical Foundations. Cam-bridge: Cambridge University Press.
Holweg, M. (2005). The three dimensions of responsiveness. International Jour-nal of Operations & Production Management 25: 7, 603-622.
International Organization for Standardization (2010). English country names and code elements [Web document]. Geneva: ISO [Cited on 5 May 2010]. Available at: http://www.iso.org/iso/english_country_names_and_code_elements.
Jeannet, J. P. (2007). Complexity in global business strategies: The cumulative impact of the crisis of choices. In U. Steger, W. Amann & M. Maznevski (Eds). Managing Complexity in Global Organizations. West Sussex: John Wiley & Sons. 125-144.
Johannessen, J. A. & Olsen, B. (2003). Knowledge management and sustainable competitive advantages: The impact of dynamic contextual training. International Journal of Information Management 23: 4, 277-289.
Karuna, C. (2007). Industry product market competition and managerial incen-tives. Journal of Accounting and Economics 43: 2-3, 275-297.
Kasanen, E., Lukka, K. & Siitonen, A. (1991). Constructive research approach in business science. Liiketaloudellinen Aikakauskirja 40: 3, 301-327.
Kasanen, E., Lukka, K. & Siitonen, A. (1993). The constructive approach in man-agement accounting research. Journal of Management Accounting Research 5: Fall, 243-264.
Kast, F. E. & Rosenzweig, J. E. (1972). General systems theory: Applications for organization and management. The Academy of Management Journal 15: 4, 447-465.
Kast, F. E. & Rosenzweig, J. E. (1985). Organization and Management: A Sys-tems and Contingency Approach. 4th ed. New York: McGraw-Hill.
Kim, J. S. & Arnold, P. (1996). Operationalizing manufacturing strategy: An ex-ploratory study of constructs and linkage. International Journal of Operations & Production Management 16: 12, 45-73.
62 Acta Wasaensia
Kovács, G. & Spens, K. M. (2005). Abductive reasoning in logistics research. International Journal of Physical Distribution & Logistics Management 35: 2, 132-144.
Kramer, N. & De Smit, J. (1977). Systems Thinking: Concepts and Notions. Lei-den: Martinus Nijhoff Social Science Division.
Kuhn, T. S. (1996). The Structure of Scientific Revolutions. 3rd ed. Chicago: Uni-versity of Chicago Press.
Lin, S. L. & Hsieh, A. T. (2010). International strategy implementation: Roles of subsidiaries, operational capabilities, and procedural justice. Journal of Business Research 63: 1, 52-59.
Lincoln, Y. S. & Guba, E. G. (1985). Naturalistic Inquiry. Newbury Park: Sage.
Liu, Y., Li, Y., Takala, J., Kamdee, T. & Toshev, R. (2008). Improve company’s operative competitiveness using analytical models. Proceedings of the 17th Inter-national Conference on Management of Technology – IAMOT 2008. Dubai: In-ternational Association for Management of Technology.
Liu, Y., Si, S. & Takala, J. (2009). Comparing operational competitiveness strate-gies in China and Finland. Proceedings of the 18th International Conference on Management of Technology – IAMOT 2009. Orlando: International Association for Management of Technology.
Liu, Y. & Takala, J. (2009a). Crisis management of Chinese state-owned manu-facturing enterprises in global context. Proceedings of Management International Conference – MIC 2009. Sousse.
Liu, Y. & Takala, J. (2009b). Modelling and evaluation of operational competi-tiveness of manufacturing enterprises. Quality Innovation Prosperity 13: 2, 1-19.
Liu, Y. & Takala, J. (2010a). Evaluation of global operational competitiveness for crisis management. Proceedings of the 19th International Conference on Man-agement of Technology – IAMOT 2010. Cairo: International Association for Man-agement of Technology.
Liu, Y. & Takala, J. (2010b). Competitiveness development of Chinese manufac-turing enterprises in global context for crisis management. International Journal of Management and Enterprise Development 9: 1, 87-115.
Lubit, R. (2001). The keys to sustainable competitive advantage: Tacit knowledge and knowledge management. Organizational Dynamics 29: 3, 164-178.
Madu, C. N., Aheto, J., Kuei, C. H. & Winokur, D. (1996). Adoption of strategic total quality management philosophies: Multi-criteria decision analysis model. International Journal of Quality & Reliability Management 13: 3, 57-72.
Acta Wasaensia 63
Markides, C. C. (2000). All the Right Moves: A Guide to Crafting Breakthrough Strategy. Boston: Harvard Business School Press.
Menguc, B., Auh, S. & Shih, E. (2007). Transformational leadership and market orientation: Implications for the implementation of competitive strategies and business unit performance. Journal of Business Research 60: 4, 314-321.
Miles, R. E. & Snow, C. C. (1978). Organizational Strategy, Structure, and Proc-ess. New York: McGraw-Hill.
Moore, G. (1991). Crossing the Chasm. New York: HarperCollins.
Moore, G. (1995). Inside the Tornado: Marketing Strategies from Silicon Valley’s Cutting Edge. New York: HarperCollins.
Moore, G. (2004). Inside the Tornado: Strategies for Developing, Leveraging, and Surviving Hypergrowth Markets. New York: HarperCollins.
Nissinen, V. (2001). Military Leadership: A Critical Constructivist Approach to Conceptualizing, Modelling and Measuring Military Leadership in the Finnish Defence Forces. Finnish National Defence University. Department of Leadership and Management. Dissertation.
O’Regan, N. & Ghobadian, A. (2005). Strategic planning – a comparison of high and low technology manufacturing small firms. Technovation 25: 10, 1107-1117.
O’Reilly C. A., Caldwell, D. F., Chatman, J. A., Lapiz, M. & Self, W. (2010). How leadership matters: The effects of leaders’ alignment on strategy implemen-tation. The Leadership Quarterly 21: 1, 104-113.
Peters, T. J. & Waterman, R. H. (1982). In Search of Excellence: Lessons from America’s Best-Run Companies. New York: Harper & Row.
Peters, T. J. (2010). The Little Big Things: 163 Ways to Pursue Excellence. New York: HarperCollins.
Porter, M. E. (1980). Competitive Strategy: Techniques for Analyzing Industries and Competitors. New York: Free Press.
Porter, M. E. (1985). Competitive Advantage: Creating and Sustaining Superior Performance. New York: Free Press.
Rangone, A. (1996). An analytical hierarchy process framework for comparing the overall performance of manufacturing departments. International Journal of Operations & Production Management 16: 8, 104-119.
Ranta, J. M. & Takala, J. (2007). A holistic method for finding out critical fea-tures of industry maintenance services. International Journal of Services and Standards 3: 3, 312-325.
64 Acta Wasaensia
Rapoport, A. (2000). Science, explanatory theory and environment-behavior stud-ies. In S. Wapner, et al. (Eds). Theoretical Perspectives in Environment-Behavior Research: Underlying Assumptions, Research Problems and Methodologies. New York: Kluwer Academic/Plenum Publishers. 107-140.
Raymond, L. & Croteau, A. M. (2009). Manufacturing strategy and business strategy in medium-sized enterprises: performance effects of strategic alignment. IEEE Transactions on Engineering Management 56: 2, 192-202.
Reisman, A. (1988). On alternative strategies for doing research in the manage-ment and social sciences. IEEE Transactions on Engineering Management 35: 4, 215-220.
Ren, L., Xie, G. & Krabbendam, K. (2009). Sustainable competitive advantage and marketing innovation within firms: A pragmatic approach for Chinese firms. Management Research Review 33: 1, 79-89.
Robson, C. (1993). Real World Research: A Resource for Social Scientists and Practitioner-Researchers. Oxford: Blackwell.
Saaty, T. L. (1980). The Analytic Hierarchy Process: Planning, Priority Setting, Resource Allocation. New York: McGraw-Hill.
Samiee, S. (2008). Global marketing effectiveness via alliances and electronic commerce in business-to-business markets. Industrial Marketing Management 37: 1, 3-8.
Schein, E. H. (1987). Process Consultation Vol. 2: Lessons for Managers and Consultants. Reading: Addison-Wesley.
Schein, E. H. (1988). Process Consultation Vol. 1: Its Role in Organization De-velopment. 2nd ed. Reading: Addison-Wesley.
Schein, E. H. (1992). Organizational Culture and Leadership. 2nd ed. San Fran-cisco: Jossey-Bass.
Schein, E. H. (1999). Process Consultation Revisited: Building the Helping Rela-tionship. Reading: Addison-Wesley.
Sharma, R. K., Kumar, D. & Kumar, P. (2006). Manufacturing excellence through TPM implementation: a practical analysis. Industrial Management & Data Systems 106: 2, 256-280.
Si, S., Takala, J. & Liu, Y. (2009). Competitiveness of Chinese high-tech manu-facturing companies in global context. Industrial Management & Data Systems 109: 3, 404-424.
Acta Wasaensia 65
Si, S., Liu, Y., Takala, J. & Sun, S. (2010). Benchmarking and developing the operational competitiveness of Chinese state-owned manufacturing enterprises in a global context. International Journal of Innovation and Learning 7: 2, 202-222.
Silverman, D. (2001). Interpreting Qualitative Data: Methods for Analysing Talk, Text and Interaction. 2nd ed. London: Sage.
Sinkovics, R. R., Penz, E. & Ghauri, P. N. (2008). Enhancing the trustworthiness of qualitative research in international business. Management International Re-view 48: 6, 689-714.
Sirikrai, S. B. & Tang, J. C. S. (2006). Industrial competitiveness analysis: Using the analytic hierarchy process. The Journal of High Technology Management Re-search 17: 1, 71-83.
Skinner, W. (1974). The focused factory. Harvard Business Review 52: 3, 113-121.
Slater, S. F., Olson, E. M. & Hult, G. T. M. (2010). Worried about strategy im-plementation? Don’t overlook marketing’s role. Business Horizons 53: 5, 469-479.
Spina, G., Bartezzaghi, E., Bert, A., Cagliano, R., Draaijer, D. & Boer, H. (1996). Strategically flexible production: the multi-focused manufacturing paradigm. In-ternational Journal of Operations & Production Management 16: 11, 20-41.
Srinivasan, R., Rangaswamy, A. & Lilien, G. L. (2005). Turning adversity into advantage: Does proactive marketing during a recession pay off? International Journal of Research in Marketing 22: 2, 109-125.
Stake, R. E. (1988). Case study methods in educational research: Seeking sweet water. In R. M. Jaeger (Ed). Complementary Methods for Research in Education. Washington DC: American Educational Research Association. 253-278.
Stake, R. E. (1995). The Art of Case Research. Thousand Oaks: Sage.
Suikki, R., Tromstedt, R. & Haapasalo, H. (2006). Project management compe-tence development framework in turbulent business environment. Technovation 26: 5-6, 723-738.
Sun, S. (2004). Assessing joint maintenance shops in the Taiwanese Army using data envelopment analysis. Journal of Operations Management 22: 3, 233-245.
Sykes, W. (1990). Validity and reliability in qualitative market research: a review of the literature. Journal of the Market Research Society 32: 3, 289-328.
Sykes, W. (1991). Taking stock: issues from the literature on validity and reliabil-ity in qualitative research. Journal of the Market Research Society 33: 1, 3-12.
66 Acta Wasaensia
Takala, J. (1997). Developing new competitive strategies for high performance organizations from empirical case studies on relationship between technology management and total quality management. Proceedings of International Confer-ence on Productivity and Quality Research – ICPQR 1997. Houston.
Takala, J. (2002). Analyzing and synthesizing multi-focused manufacturing strategies by analytical hierarchy process. International Journal of Manufacturing Technology and Management 4: 5, 345-355.
Takala, J., Bhufhai, A. & Phusavat, K. (2006). Proposed verification method for the content suitability of the customer satisfaction survey. Industrial Management & Data Systems 106: 6, 841-854.
Takala, J., Suwansaranyu, U. & Phusavat, K. (2006). A proposed white-collar workforce performance measurement framework. Industrial Management & Data Systems 106: 5, 644-662.
Takala, J., Leskinen, J., Sivusuo, H., Hirvelä, J. & Kekäle, T. (2006). The sand cone model: illustrating multi-focused strategies. Management Decision 44: 3, 335-345.
Takala, J., Hirvelä, J., Liu, Y. & Malindzak, D. (2007a). Global manufacturing strategies require “dynamic engineers”?: Case study in Finnish industries. Indus-trial Management & Data Systems 107: 3, 326-344.
Takala, J., Kamdee, T., Hirvelä, J. & Kyllonen, S. (2007b). Analytic calculation of global operative competitiveness. Proceedings of the 16th International Con-ference on Management of Technology – IAMOT 2007. Orlando: International Association for Management of Technology.
Takala, J., Kamdee, T., Toshev, R., Bojnec, S. & Zgodavova, K. (2007c). Analys-ing competitiveness of manufacturing and service operations – global benchmark-ing of cases from Slovakia and Slovenia. Proceedings of Management Interna-tional Conference – MIC 2007. Portoroz.
Takala, J., Kukkola, A. & Pennanen, J. (2008). Prospector, analyzer and defender models in directions of outcome in transformational leadership. Proceedings of the 17th International Conference of the Israel Society for Quality. Jerusalem: ISAS.
Takala, J., Pennanen, J., Hiippala, P., Maunuksela, A. & Kilpiö, O. (2008). Deci-sion maker’s outcome as a function of transformational leadership. Proceedings of the 17th International Conference on Management of Technology – IAMOT 2008. Dubai: International Association for Management of Technology.
Takala, J., Kukkola, A. & Pennanen, J. (2009). Reactor model in directions of outcome in transformational leadership. Proceedings of the 18th International
Acta Wasaensia 67
Conference on Management of Technology – IAMOT 2009. Orlando: Interna-tional Association for Management of Technology.
Taneja, S., Pryor, M. G. & Zhang L. (2010). Crisis management: a strategic and tactical leadership imperative for organisational sustainability. International Journal of Sustainable Strategic Management 2: 1, 60-73.
Tang, J. (2006). Competition and innovation behaviour. Research Policy 35: 1, 68-82.
Taylor, S. S., Fisher, D. & Dufresne, R. L. (2002). The aesthetics of management storytelling: a key to organizational learning. Management Learning 33: 3, 313-330.
The World Bank (2010). China Quarterly Update – March 2010 [Web docu-ment]. Beijing: World Bank Office [Cited on 11 May 2010]. Available at: http://siteresources.worldbank.org/CHINAEXTN/Resources/318949-1268688634523/CQU_march2010.pdf.
Tjosvold, D., Johnson, D. W., Johnson, R. T. & Sun, H. (2006). Competitive mo-tives and strategies: Understanding constructive competition. Group Dynamics 10: 2, 87-99.
Toor, S. R. & Ofori, G. (2010). Positive psychological capital as a source of sus-tainable competitive advantage for organizations. Journal of Construction Engi-neering and Management 136: 3, 341-352.
Toshev, R. & Takala, J. (2010). Simulating uncertainty in decision support system for sustainable implementation of renewable energy. Proceedings of the 19th In-ternational Conference on Management of Technology – IAMOT 2010. Cairo: International Association for Management of Technology.
Tracey, M., Vonderembse, M. A. & Lim, J. S. (1999). Manufacturing technology and strategy formulation: keys to enhancing competitiveness and improving per-formance. Journal of Operations Management 17: 4, 411-428.
Tsai, K. H., Chou, C. & Kuo, J. H. (2008). The curvilinear relationships between responsive and proactive market orientations and new product performance: A contingent link. Industrial Marketing Management 37: 8, 884-894.
Tuominen, T., Rinta-Knuuttila, A., Takala, J. & Kekäle, T. (2003). Technology survey: logistics and automation branch of materials handling industry. Proceed-ings of the 2nd International Conference on Logistics & Transport – LOADO 2003. High Tatras.
Wand, Y. & Weber, R. (1993). On the ontological expressiveness of information systems analysis and design grammars. Information Systems Journal 3: 4, 217-237.
68 Acta Wasaensia
Wernerfelt, B. (1984). A resource-based view of the firm. Strategy Management Journal 5: 2, 170-180.
Wheelwright, S. C. (1978). Reflecting corporate strategy in manufacturing deci-sions. Business Horizons 21: 1, 57-66.
Wilson, E. J. & Vlosky, R. P. (1997). Partnering relationship activities: Building theory from case study research. Journal of Business Research 39: 1, 59-70.
Yin, R. K. (1994). Case Study Research: Design and Methods. 2nd ed. Newbury Park: Sage.
Young, R. (2008). Interview with Mikko Kosonen and Yves Doz. Strategic Di-rection 24: 7, 30-32.
Zahedi, F. (1989). Quantitative evaluation of micro versus larger database prod-ucts. Computers & Operations Research 16: 6, 513-532.
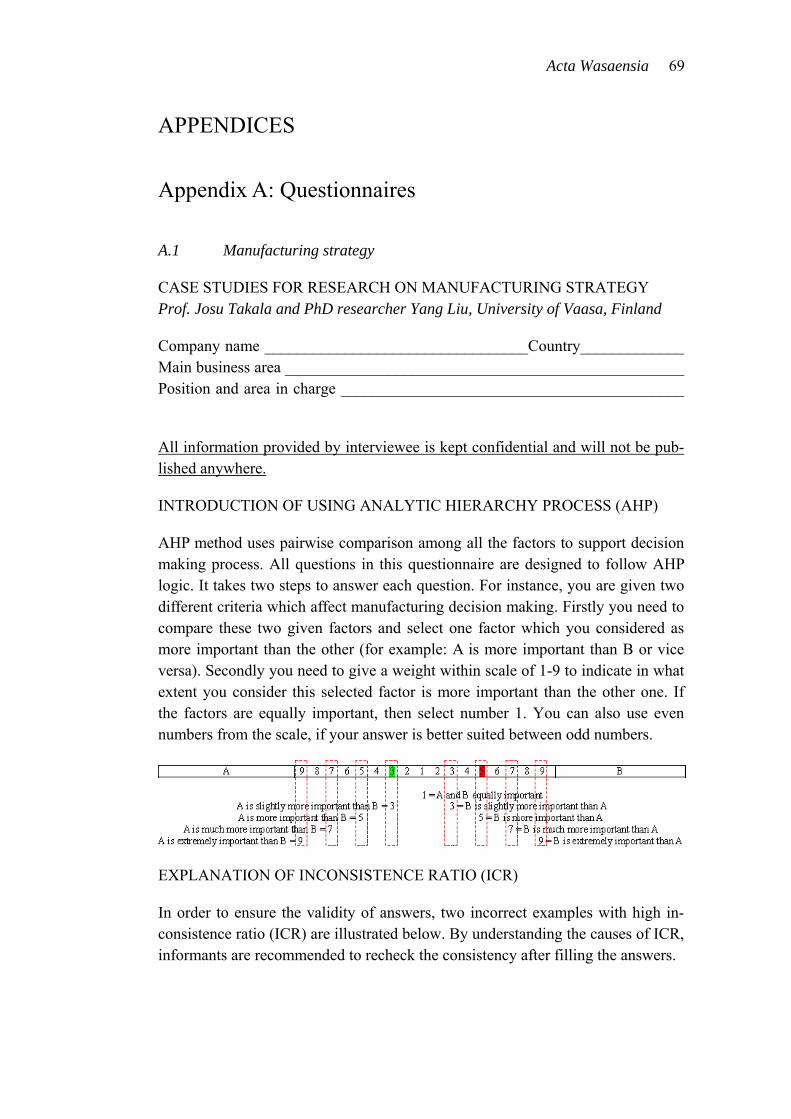
Acta Wasaensia 69
APPENDICES
Appendix A: Questionnaires
A.1 Manufacturing strategy
CASE STUDIES FOR RESEARCH ON MANUFACTURING STRATEGY Prof. Josu Takala and PhD researcher Yang Liu, University of Vaasa, Finland
Company name _________________________________Country_____________ Main business area __________________________________________________ Position and area in charge ___________________________________________
All information provided by interviewee is kept confidential and will not be pub-lished anywhere.
INTRODUCTION OF USING ANALYTIC HIERARCHY PROCESS (AHP)
AHP method uses pairwise comparison among all the factors to support decision making process. All questions in this questionnaire are designed to follow AHP logic. It takes two steps to answer each question. For instance, you are given two different criteria which affect manufacturing decision making. Firstly you need to compare these two given factors and select one factor which you considered as more important than the other (for example: A is more important than B or vice versa). Secondly you need to give a weight within scale of 1-9 to indicate in what extent you consider this selected factor is more important than the other one. If the factors are equally important, then select number 1. You can also use even numbers from the scale, if your answer is better suited between odd numbers.
EXPLANATION OF INCONSISTENCE RATIO (ICR)
In order to ensure the validity of answers, two incorrect examples with high in-consistence ratio (ICR) are illustrated below. By understanding the causes of ICR, informants are recommended to recheck the consistency after filling the answers.
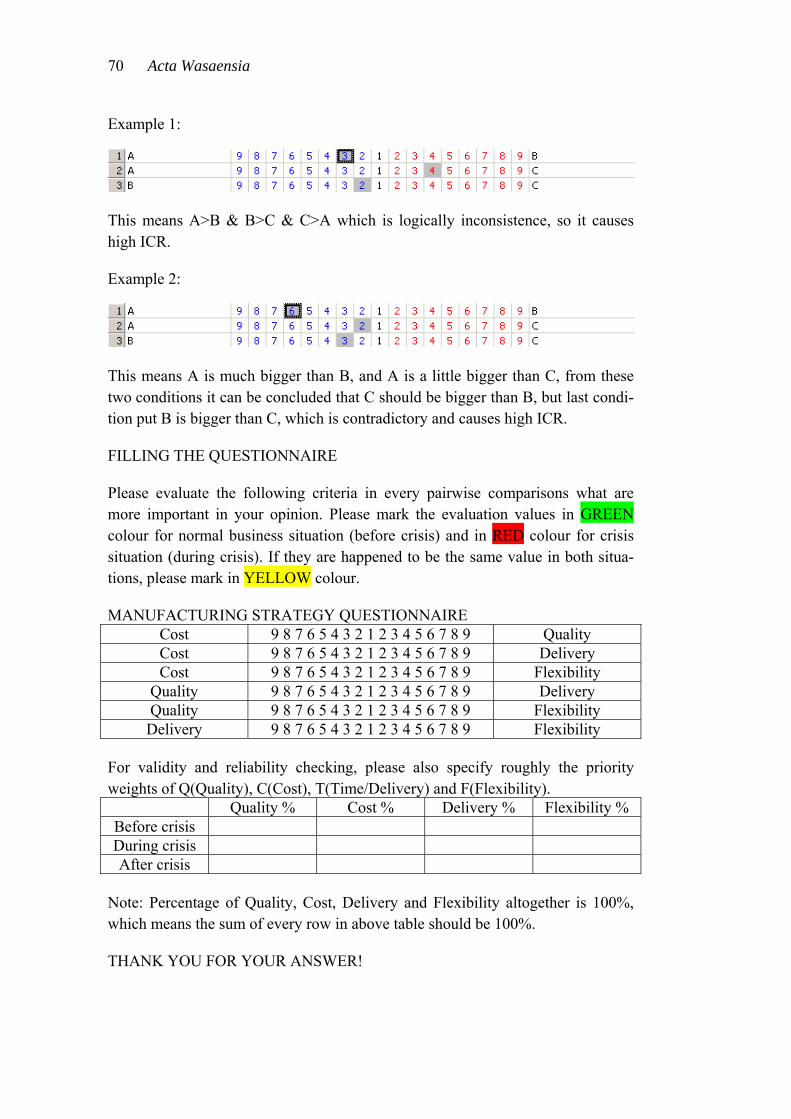
70 Acta Wasaensia
Example 1:
This means A>B & B>C & C>A which is logically inconsistence, so it causes high ICR.
Example 2:
This means A is much bigger than B, and A is a little bigger than C, from these two conditions it can be concluded that C should be bigger than B, but last condi-tion put B is bigger than C, which is contradictory and causes high ICR.
FILLING THE QUESTIONNAIRE
Please evaluate the following criteria in every pairwise comparisons what are more important in your opinion. Please mark the evaluation values in GREEN colour for normal business situation (before crisis) and in RED colour for crisis situation (during crisis). If they are happened to be the same value in both situa-tions, please mark in YELLOW colour.
MANUFACTURING STRATEGY QUESTIONNAIRE Cost 9 8 7 6 5 4 3 2 1 2 3 4 5 6 7 8 9 Quality Cost 9 8 7 6 5 4 3 2 1 2 3 4 5 6 7 8 9 Delivery Cost 9 8 7 6 5 4 3 2 1 2 3 4 5 6 7 8 9 Flexibility
Quality 9 8 7 6 5 4 3 2 1 2 3 4 5 6 7 8 9 Delivery Quality 9 8 7 6 5 4 3 2 1 2 3 4 5 6 7 8 9 Flexibility Delivery 9 8 7 6 5 4 3 2 1 2 3 4 5 6 7 8 9 Flexibility
For validity and reliability checking, please also specify roughly the priority weights of Q(Quality), C(Cost), T(Time/Delivery) and F(Flexibility).
Quality % Cost % Delivery % Flexibility % Before crisis During crisis After crisis
Note: Percentage of Quality, Cost, Delivery and Flexibility altogether is 100%, which means the sum of every row in above table should be 100%.
THANK YOU FOR YOUR ANSWER!
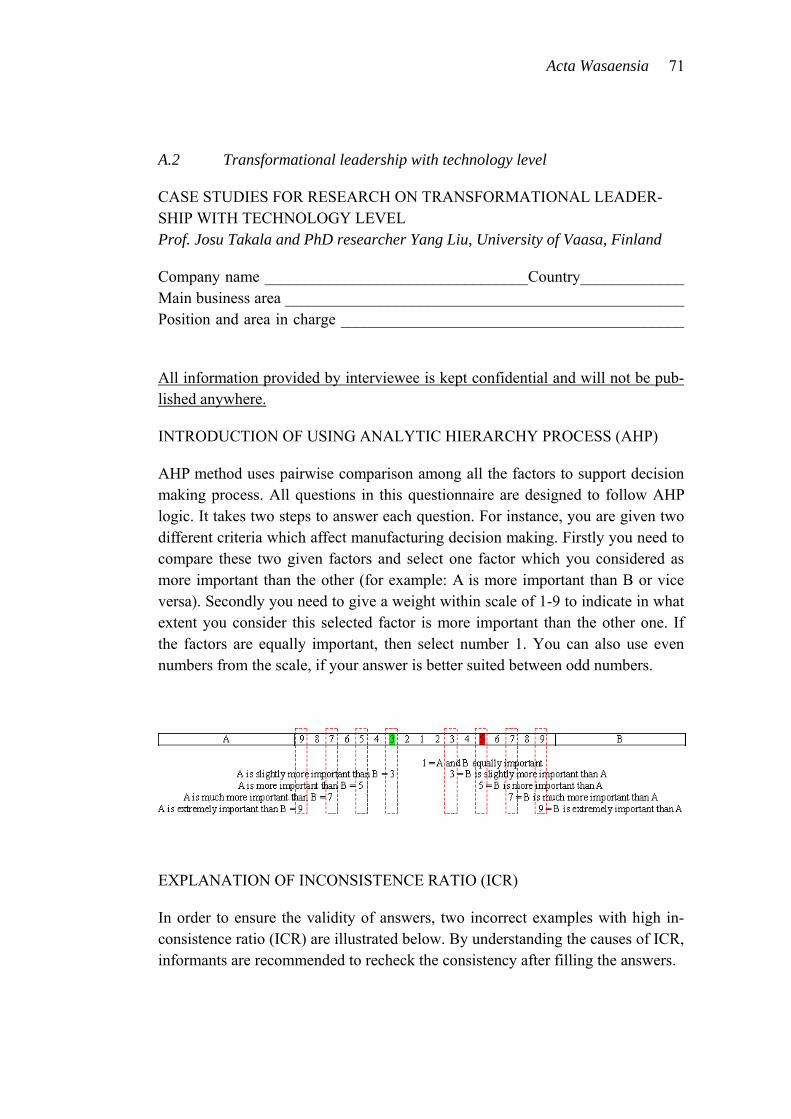
Acta Wasaensia 71
A.2 Transformational leadership with technology level
CASE STUDIES FOR RESEARCH ON TRANSFORMATIONAL LEADER-SHIP WITH TECHNOLOGY LEVEL Prof. Josu Takala and PhD researcher Yang Liu, University of Vaasa, Finland
Company name _________________________________Country_____________ Main business area __________________________________________________ Position and area in charge ___________________________________________
All information provided by interviewee is kept confidential and will not be pub-lished anywhere.
INTRODUCTION OF USING ANALYTIC HIERARCHY PROCESS (AHP)
AHP method uses pairwise comparison among all the factors to support decision making process. All questions in this questionnaire are designed to follow AHP logic. It takes two steps to answer each question. For instance, you are given two different criteria which affect manufacturing decision making. Firstly you need to compare these two given factors and select one factor which you considered as more important than the other (for example: A is more important than B or vice versa). Secondly you need to give a weight within scale of 1-9 to indicate in what extent you consider this selected factor is more important than the other one. If the factors are equally important, then select number 1. You can also use even numbers from the scale, if your answer is better suited between odd numbers.
EXPLANATION OF INCONSISTENCE RATIO (ICR)
In order to ensure the validity of answers, two incorrect examples with high in-consistence ratio (ICR) are illustrated below. By understanding the causes of ICR, informants are recommended to recheck the consistency after filling the answers.
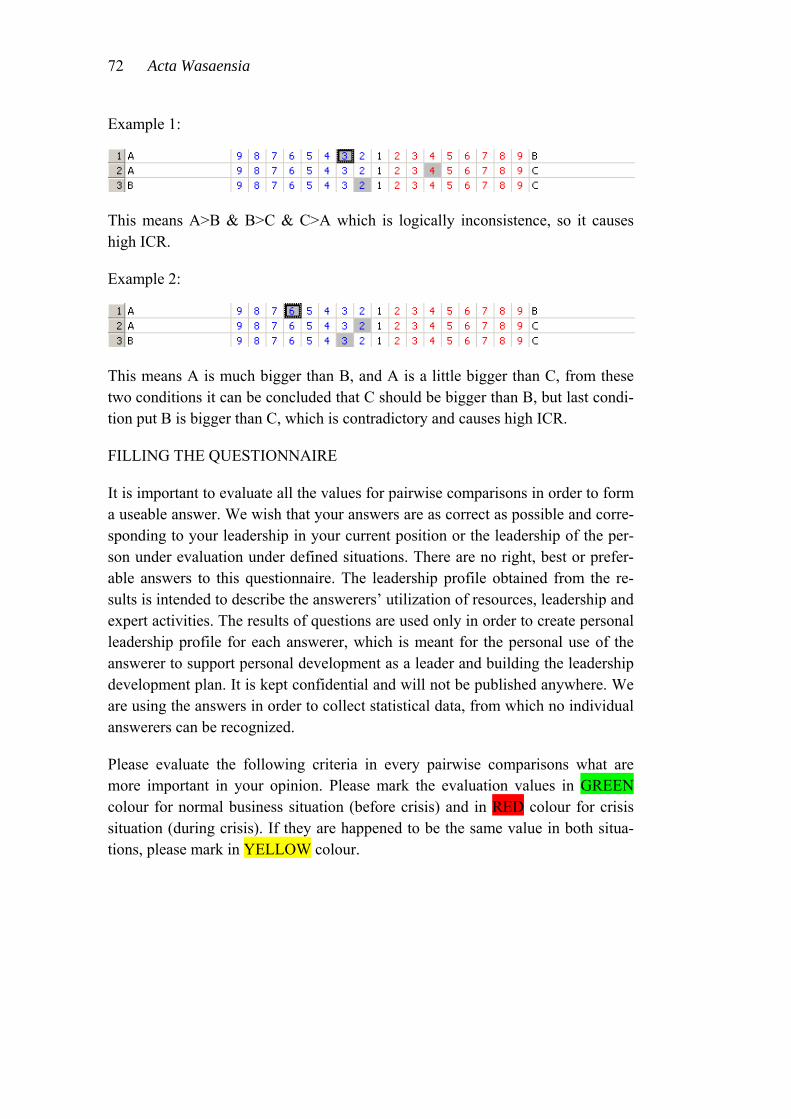
72 Acta Wasaensia
Example 1:
This means A>B & B>C & C>A which is logically inconsistence, so it causes high ICR.
Example 2:
This means A is much bigger than B, and A is a little bigger than C, from these two conditions it can be concluded that C should be bigger than B, but last condi-tion put B is bigger than C, which is contradictory and causes high ICR.
FILLING THE QUESTIONNAIRE
It is important to evaluate all the values for pairwise comparisons in order to form a useable answer. We wish that your answers are as correct as possible and corre-sponding to your leadership in your current position or the leadership of the per-son under evaluation under defined situations. There are no right, best or prefer-able answers to this questionnaire. The leadership profile obtained from the re-sults is intended to describe the answerers’ utilization of resources, leadership and expert activities. The results of questions are used only in order to create personal leadership profile for each answerer, which is meant for the personal use of the answerer to support personal development as a leader and building the leadership development plan. It is kept confidential and will not be published anywhere. We are using the answers in order to collect statistical data, from which no individual answerers can be recognized.
Please evaluate the following criteria in every pairwise comparisons what are more important in your opinion. Please mark the evaluation values in GREEN colour for normal business situation (before crisis) and in RED colour for crisis situation (during crisis). If they are happened to be the same value in both situa-tions, please mark in YELLOW colour.

Acta Wasaensia 73
TRANSFORMATIONAL LEADERSHIP QUESTIONNAIRE
Utilizes individual con-siderations
9 8 7 6 5 4 3 2 1 2 3 4 5 6 7 8 9 Supports and encourages
Utilizes individual con-siderations
9 8 7 6 5 4 3 2 1 2 3 4 5 6 7 8 9 Emphasize creativity and learning
Utilizes individual con-siderations
9 8 7 6 5 4 3 2 1 2 3 4 5 6 7 8 9 Acts as an example
Supports and encourages 9 8 7 6 5 4 3 2 1 2 3 4 5 6 7 8 9 Emphasize creativity and learning
Supports and encourages 9 8 7 6 5 4 3 2 1 2 3 4 5 6 7 8 9 Acts as an example Emphasize creativity and learning
9 8 7 6 5 4 3 2 1 2 3 4 5 6 7 8 9 Acts as an example
Utilizes genuine interest of other people
9 8 7 6 5 4 3 2 1 2 3 4 5 6 7 8 9 Motivates and rewards
Utilizes genuine interest of other people
9 8 7 6 5 4 3 2 1 2 3 4 5 6 7 8 9 Encourages and chal-lenges to develop
Utilizes genuine interest of other people
9 8 7 6 5 4 3 2 1 2 3 4 5 6 7 8 9 Utilize the mutual trust
Motivates and rewards 9 8 7 6 5 4 3 2 1 2 3 4 5 6 7 8 9 Encourages and chal-lenges to develop
Motivates and rewards 9 8 7 6 5 4 3 2 1 2 3 4 5 6 7 8 9 Utilizes the mutual trust Encourages and chal-lenges to develop
9 8 7 6 5 4 3 2 1 2 3 4 5 6 7 8 9 Utilizes the mutual trust
Operational business processes and work flows
9 8 7 6 5 4 3 2 1 2 3 4 5 6 7 8 9 Utilize the know-how
Operational business processes and work flows
9 8 7 6 5 4 3 2 1 2 3 4 5 6 7 8 9 Utilizes the information systems
Operational business processes and work flows
9 8 7 6 5 4 3 2 1 2 3 4 5 6 7 8 9 Utilizes different orga-nizing practices such teams, matrixes, projects etc.
Utilizes the know-how 9 8 7 6 5 4 3 2 1 2 3 4 5 6 7 8 9 Utilizes the information systems
Utilizes the know-how 9 8 7 6 5 4 3 2 1 2 3 4 5 6 7 8 9 Utilizes different orga-nizing practices like teams, matrixes, projects etc.
Utilizes the information systems
9 8 7 6 5 4 3 2 1 2 3 4 5 6 7 8 9 Utilizes different orga-nizing practices like teams, matrixes, projects etc.
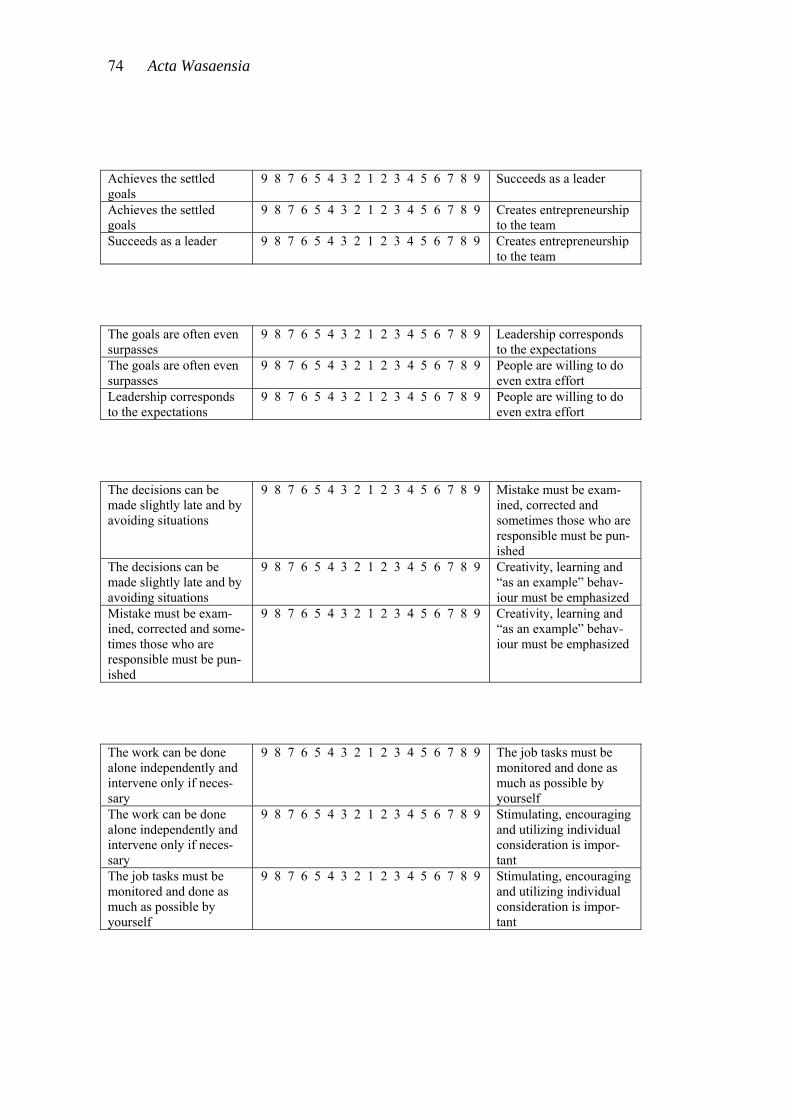
74 Acta Wasaensia
Achieves the settled goals
9 8 7 6 5 4 3 2 1 2 3 4 5 6 7 8 9 Succeeds as a leader
Achieves the settled goals
9 8 7 6 5 4 3 2 1 2 3 4 5 6 7 8 9 Creates entrepreneurship to the team
Succeeds as a leader 9 8 7 6 5 4 3 2 1 2 3 4 5 6 7 8 9 Creates entrepreneurship to the team
The goals are often even surpasses
9 8 7 6 5 4 3 2 1 2 3 4 5 6 7 8 9 Leadership corresponds to the expectations
The goals are often even surpasses
9 8 7 6 5 4 3 2 1 2 3 4 5 6 7 8 9 People are willing to do even extra effort
Leadership corresponds to the expectations
9 8 7 6 5 4 3 2 1 2 3 4 5 6 7 8 9 People are willing to do even extra effort
The decisions can be made slightly late and by avoiding situations
9 8 7 6 5 4 3 2 1 2 3 4 5 6 7 8 9 Mistake must be exam-ined, corrected and sometimes those who are responsible must be pun-ished
The decisions can be made slightly late and by avoiding situations
9 8 7 6 5 4 3 2 1 2 3 4 5 6 7 8 9 Creativity, learning and “as an example” behav-iour must be emphasized
Mistake must be exam-ined, corrected and some-times those who are responsible must be pun-ished
9 8 7 6 5 4 3 2 1 2 3 4 5 6 7 8 9 Creativity, learning and “as an example” behav-iour must be emphasized
The work can be done alone independently and intervene only if neces-sary
9 8 7 6 5 4 3 2 1 2 3 4 5 6 7 8 9 The job tasks must be monitored and done as much as possible by yourself
The work can be done alone independently and intervene only if neces-sary
9 8 7 6 5 4 3 2 1 2 3 4 5 6 7 8 9 Stimulating, encouraging and utilizing individual consideration is impor-tant
The job tasks must be monitored and done as much as possible by yourself
9 8 7 6 5 4 3 2 1 2 3 4 5 6 7 8 9 Stimulating, encouraging and utilizing individual consideration is impor-tant
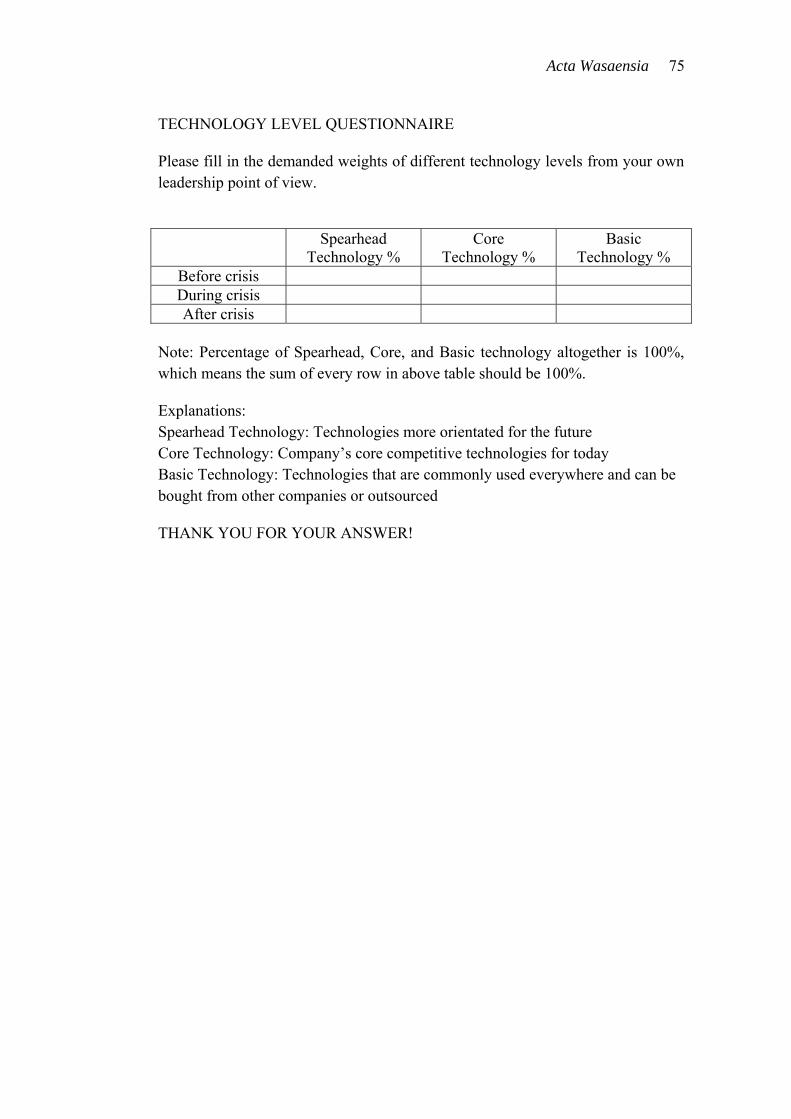
Acta Wasaensia 75
TECHNOLOGY LEVEL QUESTIONNAIRE
Please fill in the demanded weights of different technology levels from your own leadership point of view.
Spearhead
Technology % Core
Technology % Basic
Technology % Before crisis During crisis After crisis
Note: Percentage of Spearhead, Core, and Basic technology altogether is 100%, which means the sum of every row in above table should be 100%.
Explanations: Spearhead Technology: Technologies more orientated for the future Core Technology: Company’s core competitive technologies for today Basic Technology: Technologies that are commonly used everywhere and can be bought from other companies or outsourced
THANK YOU FOR YOUR ANSWER!
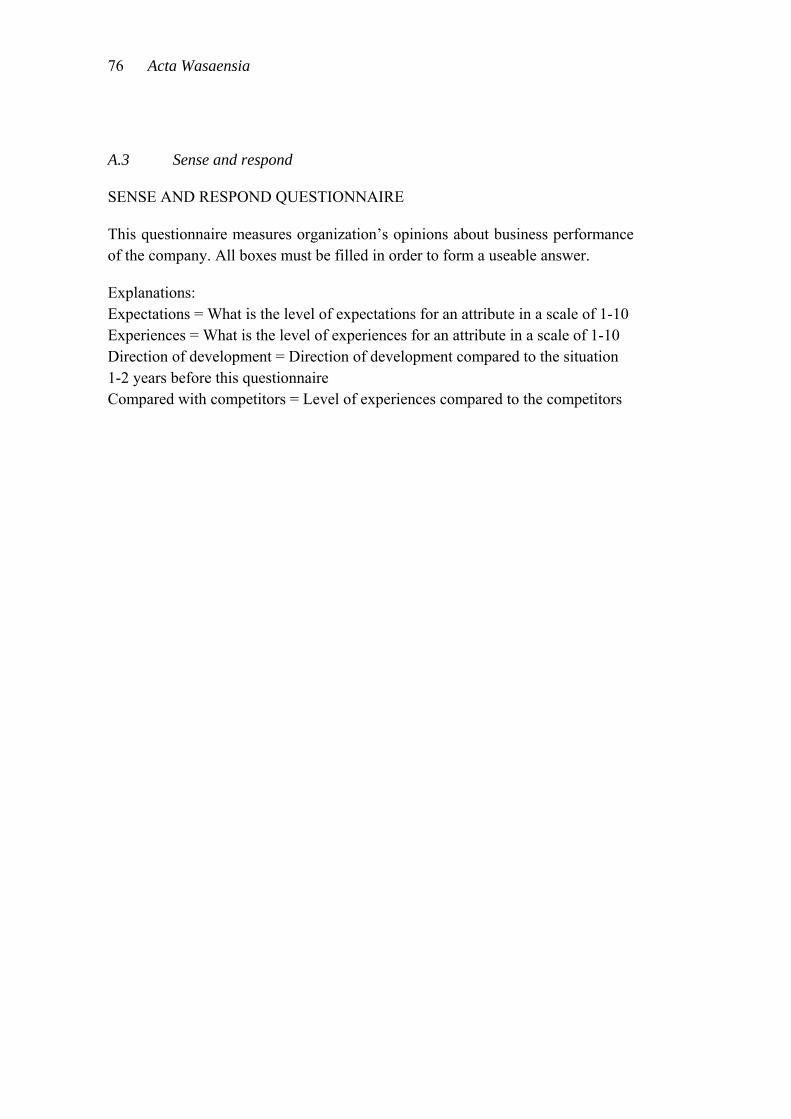
76 Acta Wasaensia
A.3 Sense and respond
SENSE AND RESPOND QUESTIONNAIRE
This questionnaire measures organization’s opinions about business performance of the company. All boxes must be filled in order to form a useable answer.
Explanations: Expectations = What is the level of expectations for an attribute in a scale of 1-10 Experiences = What is the level of experiences for an attribute in a scale of 1-10 Direction of development = Direction of development compared to the situation 1-2 years before this questionnaire Compared with competitors = Level of experiences compared to the competitors
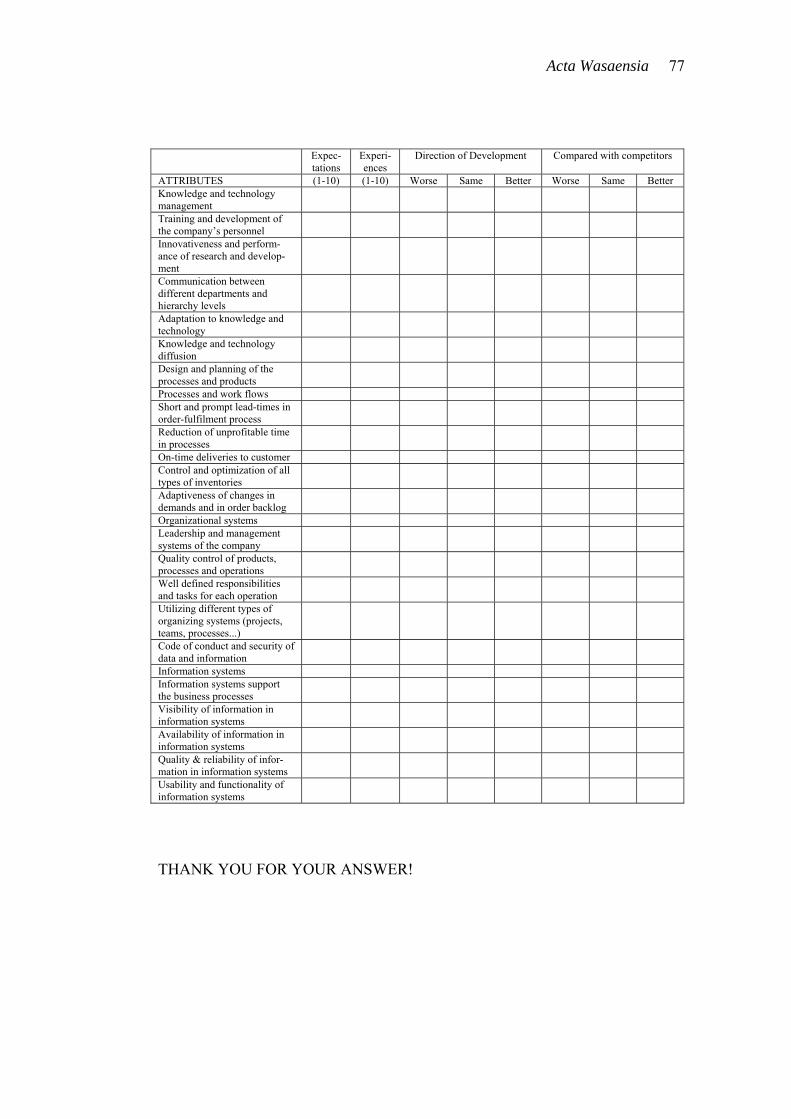
Acta Wasaensia 77
Expec-
tations Experi-ences
Direction of Development Compared with competitors
ATTRIBUTES (1-10) (1-10) Worse Same Better Worse Same Better Knowledge and technology management
Training and development of the company’s personnel
Innovativeness and perform-ance of research and develop-ment
Communication between different departments and hierarchy levels
Adaptation to knowledge and technology
Knowledge and technology diffusion
Design and planning of the processes and products
Processes and work flows Short and prompt lead-times in order-fulfilment process
Reduction of unprofitable time in processes
On-time deliveries to customer Control and optimization of all types of inventories
Adaptiveness of changes in demands and in order backlog
Organizational systems Leadership and management systems of the company
Quality control of products, processes and operations
Well defined responsibilities and tasks for each operation
Utilizing different types of organizing systems (projects, teams, processes...)
Code of conduct and security of data and information
Information systems Information systems support the business processes
Visibility of information in information systems
Availability of information in information systems
Quality & reliability of infor-mation in information systems
Usability and functionality of information systems
THANK YOU FOR YOUR ANSWER!
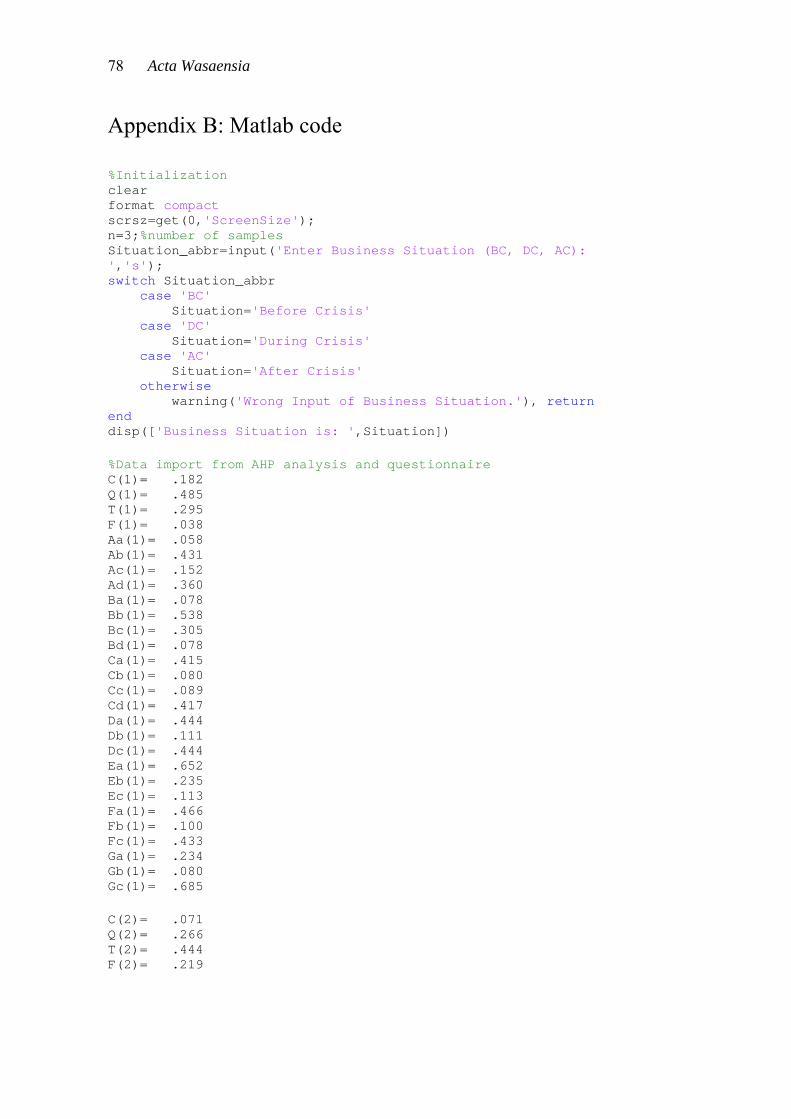
78 Acta Wasaensia
Appendix B: Matlab code %Initialization clear format compact scrsz=get(0,'ScreenSize'); n=3;%number of samples Situation_abbr=input('Enter Business Situation (BC, DC, AC): ','s'); switch Situation_abbr case 'BC' Situation='Before Crisis' case 'DC' Situation='During Crisis' case 'AC' Situation='After Crisis' otherwise warning('Wrong Input of Business Situation.'), return end disp(['Business Situation is: ',Situation]) %Data import from AHP analysis and questionnaire C(1)= .182 Q(1)= .485 T(1)= .295 F(1)= .038 Aa(1)= .058 Ab(1)= .431 Ac(1)= .152 Ad(1)= .360 Ba(1)= .078 Bb(1)= .538 Bc(1)= .305 Bd(1)= .078 Ca(1)= .415 Cb(1)= .080 Cc(1)= .089 Cd(1)= .417 Da(1)= .444 Db(1)= .111 Dc(1)= .444 Ea(1)= .652 Eb(1)= .235 Ec(1)= .113 Fa(1)= .466 Fb(1)= .100 Fc(1)= .433 Ga(1)= .234 Gb(1)= .080 Gc(1)= .685 C(2)= .071 Q(2)= .266 T(2)= .444 F(2)= .219
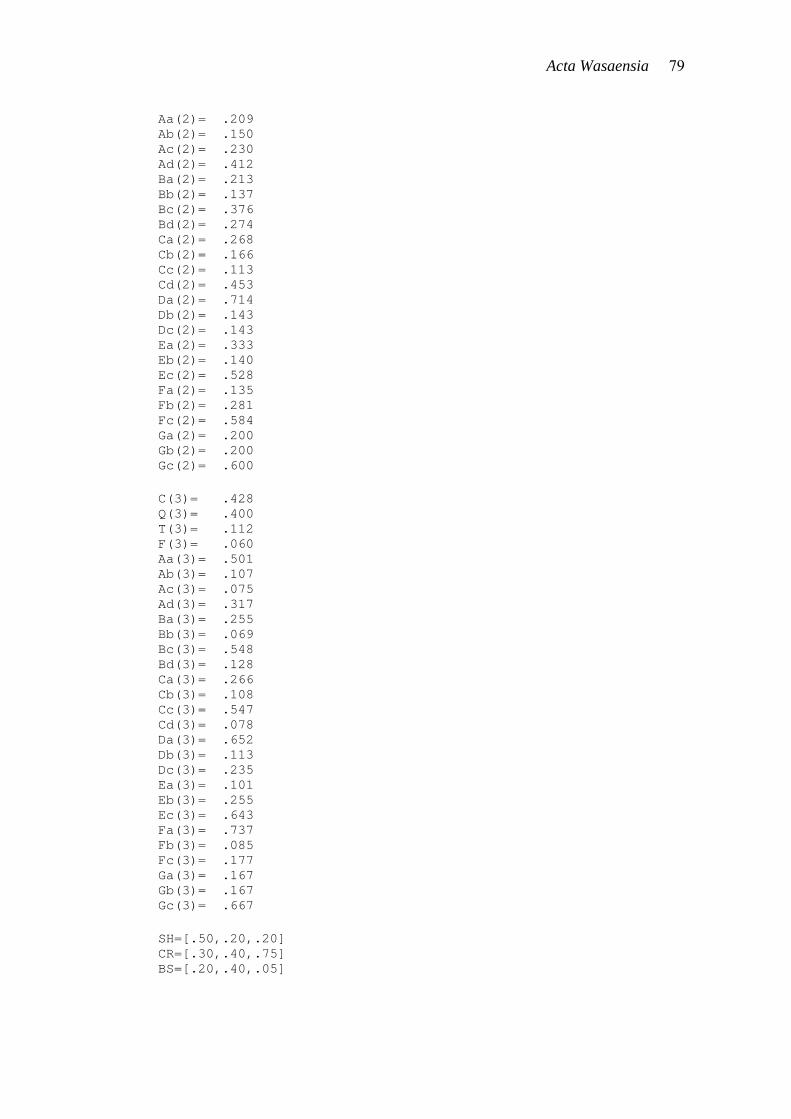
Acta Wasaensia 79
Aa(2)= .209 Ab(2)= .150 Ac(2)= .230 Ad(2)= .412 Ba(2)= .213 Bb(2)= .137 Bc(2)= .376 Bd(2)= .274 Ca(2)= .268 Cb(2)= .166 Cc(2)= .113 Cd(2)= .453 Da(2)= .714 Db(2)= .143 Dc(2)= .143 Ea(2)= .333 Eb(2)= .140 Ec(2)= .528 Fa(2)= .135 Fb(2)= .281 Fc(2)= .584 Ga(2)= .200 Gb(2)= .200 Gc(2)= .600 C(3)= .428 Q(3)= .400 T(3)= .112 F(3)= .060 Aa(3)= .501 Ab(3)= .107 Ac(3)= .075 Ad(3)= .317 Ba(3)= .255 Bb(3)= .069 Bc(3)= .548 Bd(3)= .128 Ca(3)= .266 Cb(3)= .108 Cc(3)= .547 Cd(3)= .078 Da(3)= .652 Db(3)= .113 Dc(3)= .235 Ea(3)= .101 Eb(3)= .255 Ec(3)= .643 Fa(3)= .737 Fb(3)= .085 Fc(3)= .177 Ga(3)= .167 Gb(3)= .167 Gc(3)= .667 SH=[.50,.20,.20] CR=[.30,.40,.75] BS=[.20,.40,.05]
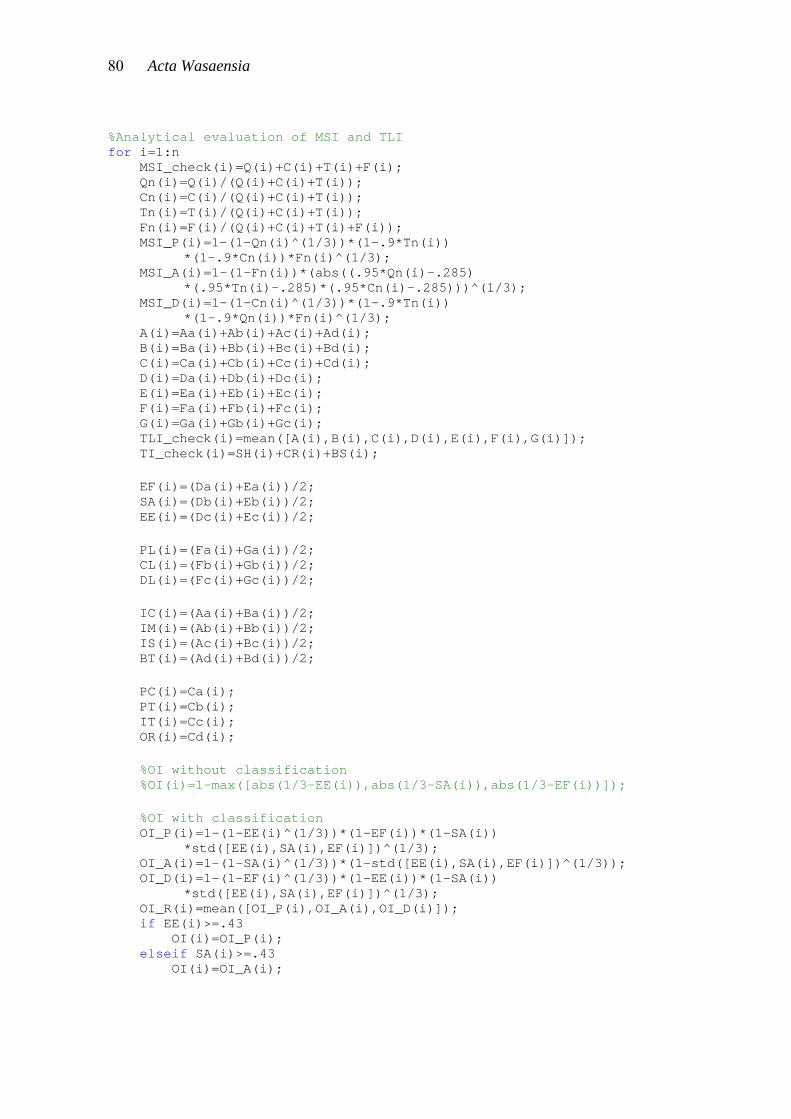
80 Acta Wasaensia
%Analytical evaluation of MSI and TLI for i=1:n MSI_check(i)=Q(i)+C(i)+T(i)+F(i); Qn(i)=Q(i)/(Q(i)+C(i)+T(i)); Cn(i)=C(i)/(Q(i)+C(i)+T(i)); Tn(i)=T(i)/(Q(i)+C(i)+T(i)); Fn(i)=F(i)/(Q(i)+C(i)+T(i)+F(i)); MSI_P(i)=1-(1-Qn(i)^(1/3))*(1-.9*Tn(i)) *(1-.9*Cn(i))*Fn(i)^(1/3); MSI_A(i)=1-(1-Fn(i))*(abs((.95*Qn(i)-.285) *(.95*Tn(i)-.285)*(.95*Cn(i)-.285)))^(1/3); MSI_D(i)=1-(1-Cn(i)^(1/3))*(1-.9*Tn(i)) *(1-.9*Qn(i))*Fn(i)^(1/3); A(i)=Aa(i)+Ab(i)+Ac(i)+Ad(i); B(i)=Ba(i)+Bb(i)+Bc(i)+Bd(i); C(i)=Ca(i)+Cb(i)+Cc(i)+Cd(i); D(i)=Da(i)+Db(i)+Dc(i); E(i)=Ea(i)+Eb(i)+Ec(i); F(i)=Fa(i)+Fb(i)+Fc(i); G(i)=Ga(i)+Gb(i)+Gc(i); TLI_check(i)=mean([A(i),B(i),C(i),D(i),E(i),F(i),G(i)]); TI_check(i)=SH(i)+CR(i)+BS(i); EF(i)=(Da(i)+Ea(i))/2; SA(i)=(Db(i)+Eb(i))/2; EE(i)=(Dc(i)+Ec(i))/2; PL(i)=(Fa(i)+Ga(i))/2; CL(i)=(Fb(i)+Gb(i))/2; DL(i)=(Fc(i)+Gc(i))/2; IC(i)=(Aa(i)+Ba(i))/2; IM(i)=(Ab(i)+Bb(i))/2; IS(i)=(Ac(i)+Bc(i))/2; BT(i)=(Ad(i)+Bd(i))/2; PC(i)=Ca(i); PT(i)=Cb(i); IT(i)=Cc(i); OR(i)=Cd(i); %OI without classification %OI(i)=1-max([abs(1/3-EE(i)),abs(1/3-SA(i)),abs(1/3-EF(i))]); %OI with classification OI_P(i)=1-(1-EE(i)^(1/3))*(1-EF(i))*(1-SA(i)) *std([EE(i),SA(i),EF(i)])^(1/3); OI_A(i)=1-(1-SA(i)^(1/3))*(1-std([EE(i),SA(i),EF(i)])^(1/3)); OI_D(i)=1-(1-EF(i)^(1/3))*(1-EE(i))*(1-SA(i)) *std([EE(i),SA(i),EF(i)])^(1/3); OI_R(i)=mean([OI_P(i),OI_A(i),OI_D(i)]); if EE(i)>=.43 OI(i)=OI_P(i); elseif SA(i)>=.43 OI(i)=OI_A(i);
Acta Wasaensia 81
elseif EF(i)>=.43 OI(i)=OI_D(i); else OI(i)=OI_R(i); end LI(i)=DL(i)*(1-max([PL(i),CL(i)])) *(1-abs(1/4-max([IC(i),IM(i),IS(i),BT(i)]))); switch Situation_abbr case 'BC' %TI Before Crisis begins if SH(i)>=.60 SHd(i)=0; else SHd(i)=abs(.60-SH(i)); end if CR(i)>=.30 CRd(i)=0; else CRd(i)=abs(.30-CR(i)); end if BS(i)<=.10 BSd(i)=0; else BSd(i)=abs(.10-BS(i)); end TI(i)=1-max([SHd(i),CRd(i),BSd(i)]); %TI Before Crisis ends case 'DC' %TI During Crisis begins if SH(i)>=.20 && SH(i)<=.30 SHd(i)=0; else SHd(i)=min([abs(.20-SH(i)),abs(.30-SH(i))]); end if CR(i)>=.40 && CR(i)<=.60 CRd(i)=0; else CRd(i)=min([abs(.40-CR(i)),abs(.60-CR(i))]); end if BS(i)>=.10 && BS(i)<=.30 BSd(i)=0; else BSd(i)=min([abs(.10-BS(i)),abs(.30-BS(i))]); end TI(i)=1-max([SHd(i),CRd(i),BSd(i)]); %TI During Crisis ends case 'AC' %TI After Crisis begins if SH(i)>=.45 & SH(i)<=.70 SHd(i)=0; else SHd(i)=min([abs(.45-SH(i)),abs(.70-SH(i))]); end if CR(i)<=.35 CRd(i)=0;

82 Acta Wasaensia
else CRd(i)=abs(.35-CR(i)); end if BS(i)<=.10 BSd(i)=0; else BSd(i)=abs(.10-BS(i)); end TI(i)=1-max([SHd(i),CRd(i),BSd(i)]); %TI After Crisis ends end RI(i)=(1-PT(i)*(1-TI(i)))*(3*min([PC(i),IT(i),OR(i)]))*TI(i); TLI(i)=OI(i)*LI(i)*RI(i); end MSI_check TLI_check TI_check if (abs(mean(MSI_check)-1)>0.001)||(abs(mean(TLI_check)-1)>0.0005) ||(abs(mean(TI_check)-1)>0) warning('Wrong input data!!!'), return end MSI_P MSI_A MSI_D EE SA EF PL CL DL IC IM IS BT PC PT IT OR OI_P OI_A OI_D OI_R OI LI TI RI TLI %Correlation analysis of MSI vs TLI fit_P=polyfit(TLI,MSI_P,1) val_P=polyval(fit_P,TLI); R2_P=rsquare(MSI_P,val_P) fit_A=polyfit(TLI,MSI_A,1) val_A=polyval(fit_A,TLI);
Acta Wasaensia 83
R2_A=rsquare(MSI_A,val_A) fit_D=polyfit(TLI,MSI_D,1) val_D=polyval(fit_D,TLI); R2_D=rsquare(MSI_D,val_D) figure('Position',[1 scrsz(4)/2 600 300]) plot(TLI,MSI_P,'db',TLI,MSI_A,'sm',TLI,MSI_D,'^y',TLI,val_P,'b', TLI,val_A,'m',TLI,val_D,'y') xlabel('TLI');ylabel('MSI');title(['MSI vs TLI ',Situation]) legend('P','A','D','P fit','A fit','D fit','Location','EO') gtext(['\leftarrow Y_P=',num2str(fit_P(1),'%10.4f'),'*X+', num2str(fit_P(2),'%10.4f, R^2='),num2str(R2_P,'%10.4f')]) gtext(['\leftarrow Y_A=',num2str(fit_A(1),'%10.4f'),'*X+', num2str(fit_A(2),'%10.4f, R^2='),num2str(R2_A,'%10.4f')]) gtext(['\leftarrow Y_D=',num2str(fit_D(1),'%10.4f'),'*X+', num2str(fit_D(2),'%10.4f, R^2='),num2str(R2_D,'%10.4f')]) %Development analysis of OCI potential Group_abbr=input('Enter Best Competitive Group (P, A, D): ','s'); switch Group_abbr case 'P' Group='Prospector' MSI_sorted=sort(MSI_P) case 'A' Group='Analyzer' MSI_sorted=sort(MSI_A) case 'D' Group='Defender' MSI_sorted=sort(MSI_D) otherwise warning('Wrong Input of Competitive Group.'), return end disp(['Best Competitive Group is: ',Group]) fit_MSI_sorted=polyfit(1:n,MSI_sorted,1) val_MSI_sorted=polyval(fit_MSI_sorted,1:n); R2_MSI_sorted=rsquare(MSI_sorted,val_MSI_sorted) TLI_sorted=sort(TLI) fit_TLI_sorted=polyfit(1:n,TLI_sorted,1) val_TLI_sorted=polyval(fit_TLI_sorted,1:n); R2_TLI_sorted=rsquare(TLI_sorted,val_TLI_sorted) figure('Position',[1 100 scrsz(3) 300]); subplot(1,2,1); plot(1:n,MSI_sorted,'b.',1:n,val_MSI_sorted,'b') xlabel('n'); ylabel('MSI'); title(['MSI sorted for best competitive group: ',Group]); legend('MSI sorted','MSI fit','Location','EO') gtext(['\leftarrow Y=',num2str(fit_MSI_sorted(1),'%10.4f'),'*X+', num2str(fit_MSI_sorted(2),'%10.4f, R^2='), num2str(R2_MSI_sorted,'%10.4f')]) subplot(1,2,2); plot(1:n,TLI_sorted,'g.',1:n,val_TLI_sorted,'g') xlabel('n'); ylabel('TLI'); title('TLI sorted');
84 Acta Wasaensia
legend('TLI sorted','TLI fit','Location','EO') gtext(['\leftarrow Y=',num2str(fit_TLI_sorted(1),'%10.4f'),'*X+', num2str(fit_TLI_sorted(2),'%10.4f, R^2='), num2str(R2_TLI_sorted,'%10.4f')]) x=1:.01*n:n; for i=1:length(x); MSI(i)=polyval(fit_MSI_sorted,x(i)); TLI(i)=polyval(fit_TLI_sorted,x(i)); end MSI TLI [x,y]=meshgrid(MSI,TLI); OCI=x.*y; figure('Position',[scrsz(3)/2 scrsz(4)/2 500 400]); mesh(MSI,TLI,OCI) xlabel('Manufacturing Strategy'); ylabel('Transformational Leadership'); zlabel('Overall Competitiveness'); title(['OCI potential ',Situation]);
Published with MATLAB® 7.5
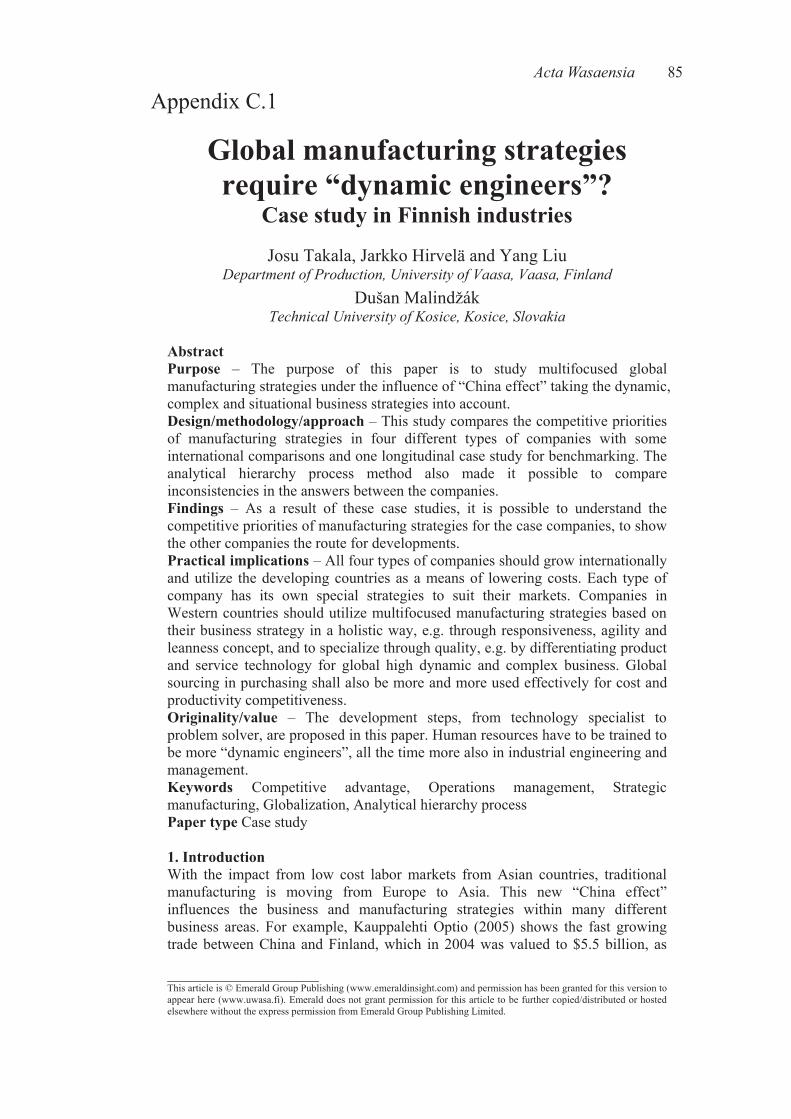
ActaWasaensia 85
Appendix C.1
____________________This article is © Emerald Group Publishing (www.emeraldinsight.com) and permission has been granted for this version to appear here (www.uwasa.fi). Emerald does not grant permission for this article to be further copied/distributed or hosted elsewhere without the express permission from Emerald Group Publishing Limited.
Global manufacturing strategies require “dynamic engineers”?
Case study in Finnish industries
Josu Takala, Jarkko Hirvelä and Yang Liu DepartmentofProduction,UniversityofVaasa,Vaasa,Finland
Dušan Malindžák TechnicalUniversityofKosice,Kosice,Slovakia
AbstractPurpose – The purpose of this paper is to study multifocused global manufacturing strategies under the influence of “China effect” taking the dynamic, complex and situational business strategies into account. Design/methodology/approach – This study compares the competitive priorities of manufacturing strategies in four different types of companies with some international comparisons and one longitudinal case study for benchmarking. The analytical hierarchy process method also made it possible to compare inconsistencies in the answers between the companies. Findings – As a result of these case studies, it is possible to understand the competitive priorities of manufacturing strategies for the case companies, to show the other companies the route for developments. Practical implications – All four types of companies should grow internationally and utilize the developing countries as a means of lowering costs. Each type of company has its own special strategies to suit their markets. Companies in Western countries should utilize multifocused manufacturing strategies based on their business strategy in a holistic way, e.g. through responsiveness, agility and leanness concept, and to specialize through quality, e.g. by differentiating product and service technology for global high dynamic and complex business. Global sourcing in purchasing shall also be more and more used effectively for cost and productivity competitiveness. Originality/value – The development steps, from technology specialist to problem solver, are proposed in this paper. Human resources have to be trained to be more “dynamic engineers”, all the time more also in industrial engineering and management. Keywords Competitive advantage, Operations management, Strategic manufacturing, Globalization, Analytical hierarchy process Paper type Case study
1. Introduction With the impact from low cost labor markets from Asian countries, traditional manufacturing is moving from Europe to Asia. This new “China effect” influences the business and manufacturing strategies within many different business areas. For example, Kauppalehti Optio (2005) shows the fast growing trade between China and Finland, which in 2004 was valued to $5.5 billion, as
86 ActaWasaensia
____________________This article is © Emerald Group Publishing (www.emeraldinsight.com) and permission has been granted for this version to appear here (www.uwasa.fi). Emerald does not grant permission for this article to be further copied/distributed or hosted elsewhere without the express permission from Emerald Group Publishing Limited.
compared to 0.5 billion in 1980s. The Finnish institutions and corporations have about 200 posts in China. The China effect shows bigger impact and influence to Western enterprises than ever before. Likewise, the China effect as it is currently understood as a macro phenomenon of impact from low cost countries, does not consist of only business with China but also with all other corresponding industrial business relationships e.g. to Russia, the new EU countries (Slovakia, Poland, Baltic Countries etc), Brazil, and to other Asian countries like India.
Concepts for global manufacturing strategies The main concepts, as used in this paper, are the following:
Outsourcing: A part of the functions and/or resources of an organization are transferred to be taken care of by a service provider outside the organization. Insourcing: Opposite to outsourcing.
Global sourcing: An organization is purchasing services from just the right place at just the right prize (not necessarily only from countries having lower labor costs). Off-shoring: To transfer functions and/or resources from a country having higher labor costs to a far away country with lower labor costs (e.g. transferring manufacturing from Finland to China, or transferring them just to the opposite direction, e.g. transferring R&D from China to Finland). Near-shoring: To transfer functions and/or resources from a country having higher labor costs to a close-to country with lower labor costs (e.g. transferring manufacturing from Finland to Estonia, or transferring them just to the opposite direction, e.g. transferring R&D from Estonia to Finland).
The objective of this explorative study is to describe the mechanisms and to createpreliminarynormativemodels by answering three research questions: RQ1. What kind of competitive business and manufacturing strategies do different, high- performing Western companies utilize to design their operations in dynamic, situational and complex conditions of the China effect? RQ2. How are these strategic plans analyzed and implemented in the case companies? The research task is to find out the differences between manufacturing strategies and/or technology levels, and collaboration levels etc the China effect influence. RQ3. What kind of assets and resources would a technologically intensive country need to create and utilize these strategies? And what kind of requirements does this place for the human resources (engineers)?
To make our analysis more valuable and useful, we must take into account how the “China effect” will influence the manufacturing strategies. Manufacturing strategies have been changing from focused, in 1970s, to multi-focused (Takala, 2002).
2. Up-to-date theories for the implementation of business and manufacturing strategies According to Porter (1985), the only competitive global business strategies would be based on differentiation by unique specialization by quality or product or
ActaWasaensia 87
____________________This article is © Emerald Group Publishing (www.emeraldinsight.com) and permission has been granted for this version to appear here (www.uwasa.fi). Emerald does not grant permission for this article to be further copied/distributed or hosted elsewhere without the express permission from Emerald Group Publishing Limited.
service technology or cost leadership. These, evidently, are also the strategic competitive weapons against the China effect. Barney et al. (2001) suggest sustainable competitive advantage as a resource-based strategy, which evidently is a very powerful business strategy today. Takala (1997) states that most high performance organizations have had systematic and long-term development activities for more than 10 previous years to improve their competitiveness. For quickly changing business conditions, Bradley and Nolan (1998) and Markides (2000) developed dynamic business strategies basing them on the sense-and-respond thinking. Heikkilä (2004) shows that market forces are the most important motives in foreign production investments. Big developing countries like China, India, Russia and Brazil are continuously making stronger connections to global markets, causing growth in their production statistics. The case study in Finland, Germany, Sweden, Japan and the USA – trying to find out what is the strategical role of production in globally operating companies, by comparing what business strategies lead to certain production strategies – shows that there are no remarkable differences in business or production goals between these countries. Up to 25 percent of the surveyed companies consider their own production to be critical for them, whereas 10 percent state that it is not important. Operational agility is a multidimensional matter, in which the success may demand several equally important production goals, as Takala (2002) claims in his previous publications about multi-focused strategies. Operational agility requires typically the companies to conduct their own production, and supports mostly specializing strategies that are based on quality and special features of the product or services related to it. Know-how in production technology, in all forms, is a remarkable factor to agility as well. When competing with low price, volumes and input costs are most critical, but on the production level it is hard to affect these factors because this kind of decisions are made on business level. Technology is understood as know-how (human competence), a relevant part of resource based strategy, including all types of assets and resources, or strategic networking (collaborations by using partnerships (Braun, 1998; Takala, 1997)). Madu et al. (1996) introduced the concept of strategic groups for different technology and collaboration levels. The idea has been modified by the authors by adding the typical development route of global industries to be later considered when studying the influences of China effect (Figure 1). The main idea is that in global markets, when a company starts export activities, it has to move cautiously from being a technology specialist to selling commodity products, from that further to a collaboration partner, and finally to problem solver especially in technologically intensive countries such as Finland or Sweden. It is not typically possible to move from a technology specialist position directly to a problem solver role, even though that would be desirable. The Indian Express (2005) published an article about a study criticizing the arguments that the US would have lost its technological edge, an argument of anti-offshoring lobbies: Thedebateoveroutsourcinghasmoved fromAmericanCity Halls to engineering colleges in India. A new report released by DukeUniversity (...) hasargued instead, that thequalityof engineers comingoutofIndia–andChina–isnotreallycomparablewiththosegraduatingfromtheUS
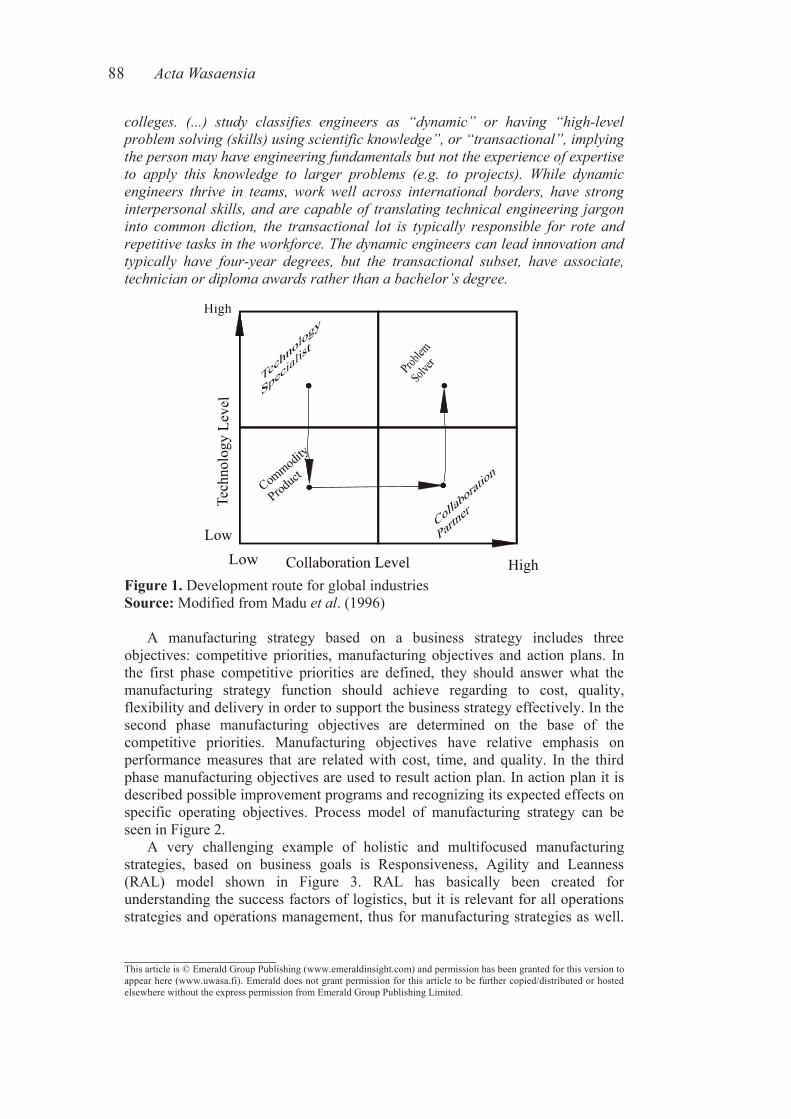
88 ActaWasaensia
____________________This article is © Emerald Group Publishing (www.emeraldinsight.com) and permission has been granted for this version to appear here (www.uwasa.fi). Emerald does not grant permission for this article to be further copied/distributed or hosted elsewhere without the express permission from Emerald Group Publishing Limited.
colleges. (...) study classifies engineers as “dynamic” or having “high-levelproblemsolving(skills)usingscientificknowledge”,or“transactional”,implyingthepersonmayhaveengineeringfundamentalsbutnottheexperienceofexpertiseto apply this knowledge to larger problems (e.g. to projects). While dynamicengineers thrive in teams, work well across international borders, have stronginterpersonalskills,andarecapableof translatingtechnicalengineeringjargoninto common diction, the transactional lot is typically responsible for rote andrepetitivetasksintheworkforce.Thedynamicengineerscanleadinnovationandtypically have four-year degrees, but the transactional subset, have associate,technicianordiplomaawardsratherthanabachelor’sdegree.
Low
High
Commodit
y
Product
High
Figure 1. Development route for global industries Source: Modified from Madu etal. (1996)
A manufacturing strategy based on a business strategy includes three objectives: competitive priorities, manufacturing objectives and action plans. In the first phase competitive priorities are defined, they should answer what the manufacturing strategy function should achieve regarding to cost, quality, flexibility and delivery in order to support the business strategy effectively. In the second phase manufacturing objectives are determined on the base of the competitive priorities. Manufacturing objectives have relative emphasis on performance measures that are related with cost, time, and quality. In the third phase manufacturing objectives are used to result action plan. In action plan it is described possible improvement programs and recognizing its expected effects on specific operating objectives. Process model of manufacturing strategy can be seen in Figure 2. A very challenging example of holistic and multifocused manufacturing strategies, based on business goals is Responsiveness, Agility and Leanness (RAL) model shown in Figure 3. RAL has basically been created for understanding the success factors of logistics, but it is relevant for all operations strategies and operations management, thus for manufacturing strategies as well.
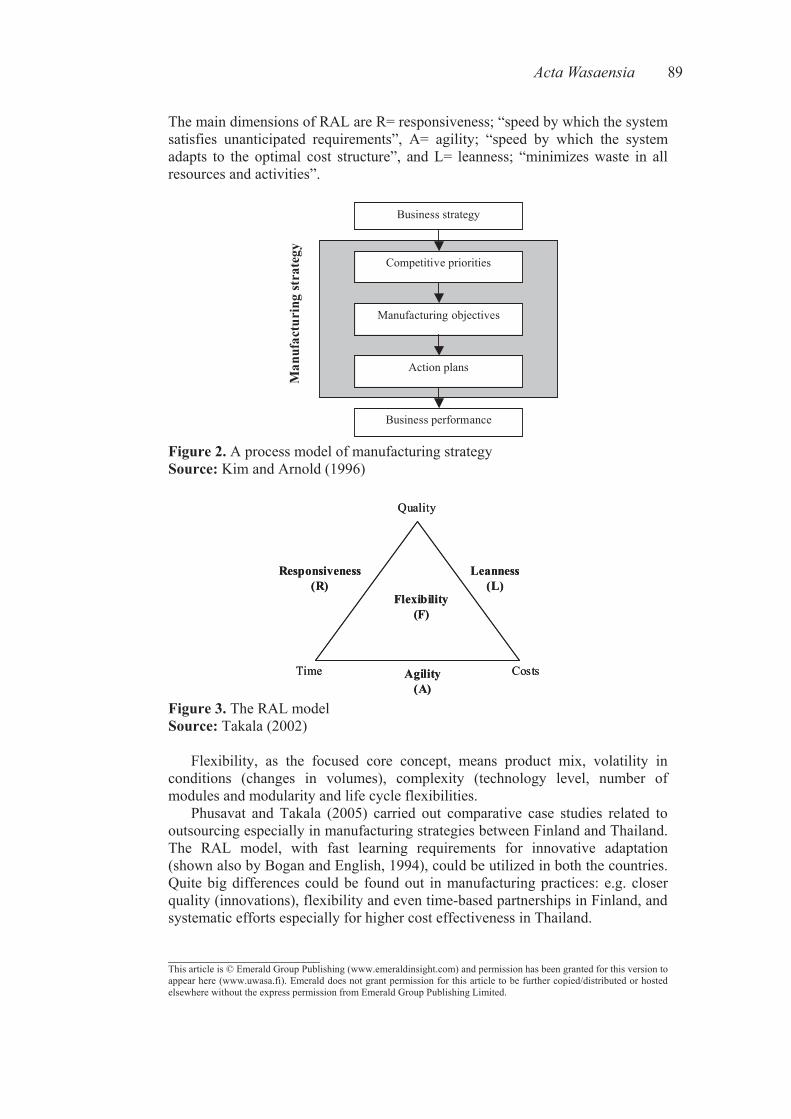
ActaWasaensia 89
____________________This article is © Emerald Group Publishing (www.emeraldinsight.com) and permission has been granted for this version to appear here (www.uwasa.fi). Emerald does not grant permission for this article to be further copied/distributed or hosted elsewhere without the express permission from Emerald Group Publishing Limited.
The main dimensions of RAL are R= responsiveness; “speed by which the system satisfies unanticipated requirements”, A= agility; “speed by which the system adapts to the optimal cost structure”, and L= leanness; “minimizes waste in all resources and activities”.
Business strategy
Business performance
Competitive priorities
Manufacturing objectives
Action plans
Man
ufac
turi
ng st
rate
gy
Figure 2. A process model of manufacturing strategy Source: Kim and Arnold (1996)
Time
Flexibility(F)
Leanness(L)
Responsiveness(R)
Agility(A)
Costs
Quality
Time
Flexibility(F)
Leanness(L)
Responsiveness(R)
Agility(A)
Costs
Quality
Figure 3. The RAL model Source: Takala (2002)
Flexibility, as the focused core concept, means product mix, volatility in conditions (changes in volumes), complexity (technology level, number of modules and modularity and life cycle flexibilities. Phusavat and Takala (2005) carried out comparative case studies related to outsourcing especially in manufacturing strategies between Finland and Thailand. The RAL model, with fast learning requirements for innovative adaptation (shown also by Bogan and English, 1994), could be utilized in both the countries. Quite big differences could be found out in manufacturing practices: e.g. closer quality (innovations), flexibility and even time-based partnerships in Finland, and systematic efforts especially for higher cost effectiveness in Thailand.
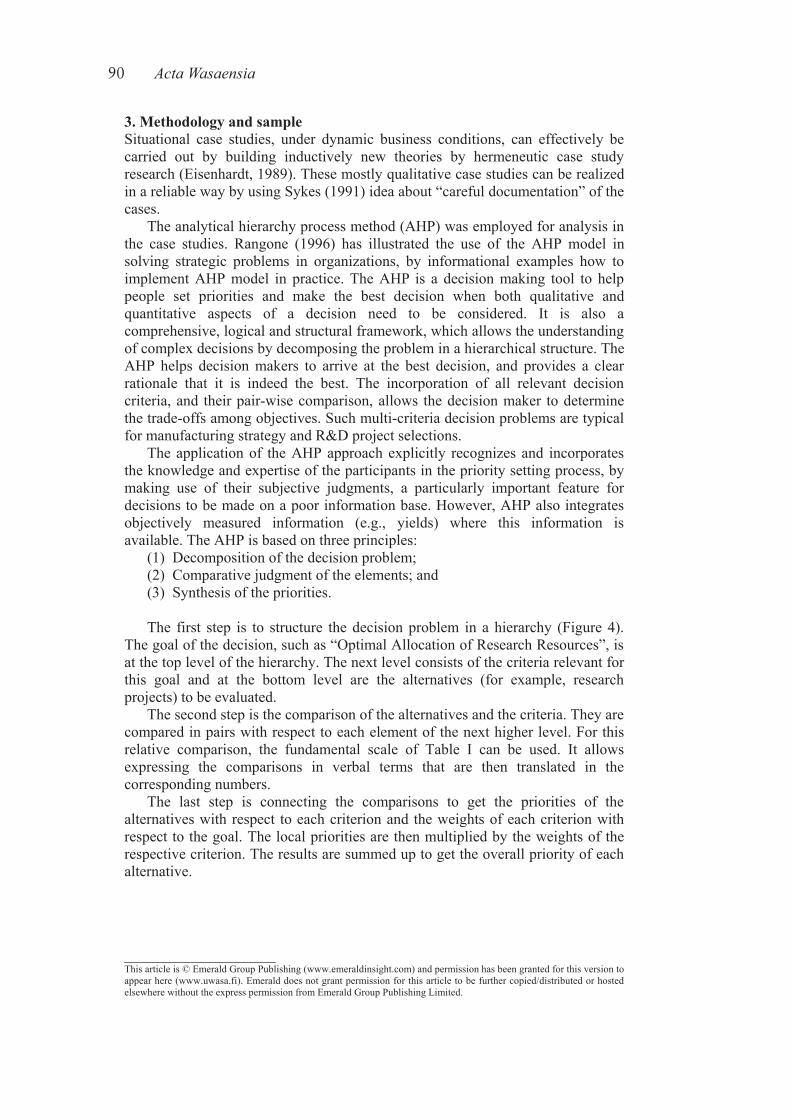
90 ActaWasaensia
____________________This article is © Emerald Group Publishing (www.emeraldinsight.com) and permission has been granted for this version to appear here (www.uwasa.fi). Emerald does not grant permission for this article to be further copied/distributed or hosted elsewhere without the express permission from Emerald Group Publishing Limited.
3. Methodology and sampleSituational case studies, under dynamic business conditions, can effectively be carried out by building inductively new theories by hermeneutic case study research (Eisenhardt, 1989). These mostly qualitative case studies can be realized in a reliable way by using Sykes (1991) idea about “careful documentation” of the cases. The analytical hierarchy process method (AHP) was employed for analysis in the case studies. Rangone (1996) has illustrated the use of the AHP model in solving strategic problems in organizations, by informational examples how to implement AHP model in practice. The AHP is a decision making tool to help people set priorities and make the best decision when both qualitative and quantitative aspects of a decision need to be considered. It is also a comprehensive, logical and structural framework, which allows the understanding of complex decisions by decomposing the problem in a hierarchical structure. The AHP helps decision makers to arrive at the best decision, and provides a clear rationale that it is indeed the best. The incorporation of all relevant decision criteria, and their pair-wise comparison, allows the decision maker to determine the trade-offs among objectives. Such multi-criteria decision problems are typical for manufacturing strategy and R&D project selections. The application of the AHP approach explicitly recognizes and incorporates the knowledge and expertise of the participants in the priority setting process, by making use of their subjective judgments, a particularly important feature for decisions to be made on a poor information base. However, AHP also integrates objectively measured information (e.g., yields) where this information is available. The AHP is based on three principles: (1) Decomposition of the decision problem; (2) Comparative judgment of the elements; and (3) Synthesis of the priorities.
The first step is to structure the decision problem in a hierarchy (Figure 4). The goal of the decision, such as “Optimal Allocation of Research Resources”, is at the top level of the hierarchy. The next level consists of the criteria relevant for this goal and at the bottom level are the alternatives (for example, research projects) to be evaluated. The second step is the comparison of the alternatives and the criteria. They are compared in pairs with respect to each element of the next higher level. For this relative comparison, the fundamental scale of Table I can be used. It allows expressing the comparisons in verbal terms that are then translated in the corresponding numbers. The last step is connecting the comparisons to get the priorities of the alternatives with respect to each criterion and the weights of each criterion with respect to the goal. The local priorities are then multiplied by the weights of the respective criterion. The results are summed up to get the overall priority of each alternative.
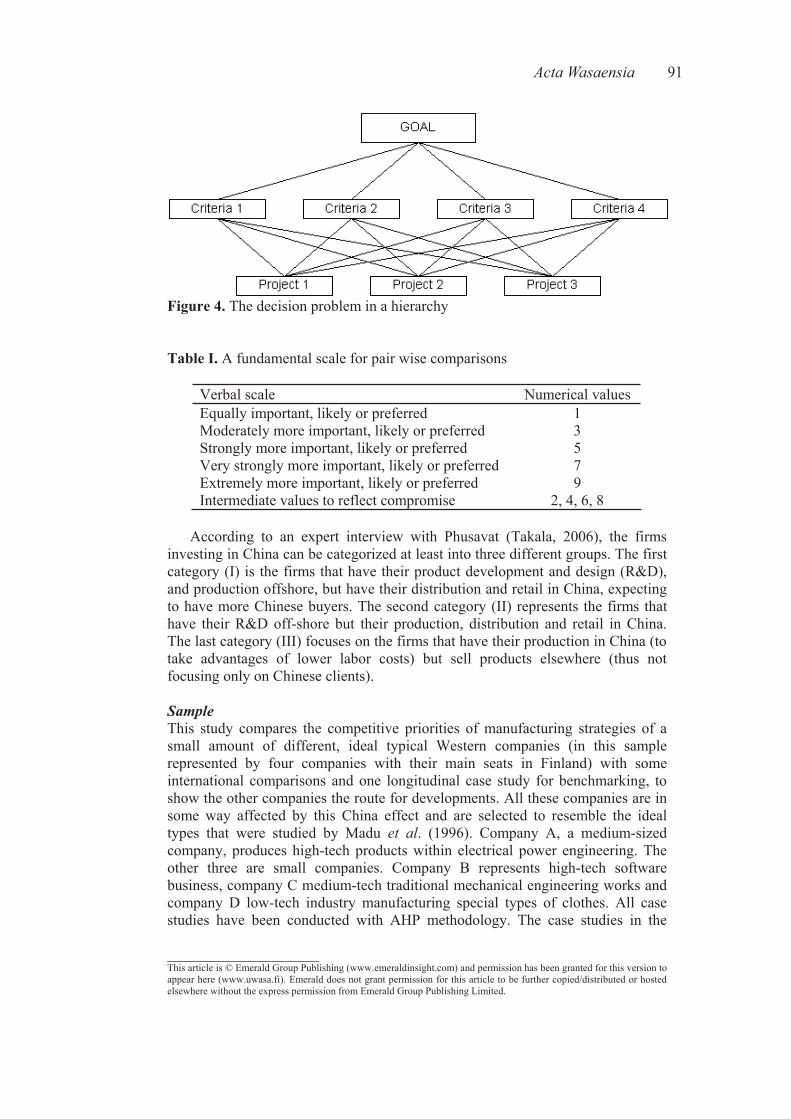
ActaWasaensia 91
____________________This article is © Emerald Group Publishing (www.emeraldinsight.com) and permission has been granted for this version to appear here (www.uwasa.fi). Emerald does not grant permission for this article to be further copied/distributed or hosted elsewhere without the express permission from Emerald Group Publishing Limited.
Figure 4. The decision problem in a hierarchy
Table I. A fundamental scale for pair wise comparisons
Verbal scale Numerical values Equally important, likely or preferred 1 Moderately more important, likely or preferred 3 Strongly more important, likely or preferred 5 Very strongly more important, likely or preferred 7 Extremely more important, likely or preferred 9 Intermediate values to reflect compromise 2, 4, 6, 8
According to an expert interview with Phusavat (Takala, 2006), the firms investing in China can be categorized at least into three different groups. The first category (I) is the firms that have their product development and design (R&D), and production offshore, but have their distribution and retail in China, expecting to have more Chinese buyers. The second category (II) represents the firms that have their R&D off-shore but their production, distribution and retail in China. The last category (III) focuses on the firms that have their production in China (to take advantages of lower labor costs) but sell products elsewhere (thus not focusing only on Chinese clients).
SampleThis study compares the competitive priorities of manufacturing strategies of a small amount of different, ideal typical Western companies (in this sample represented by four companies with their main seats in Finland) with some international comparisons and one longitudinal case study for benchmarking, to show the other companies the route for developments. All these companies are in some way affected by this China effect and are selected to resemble the ideal types that were studied by Madu et al. (1996). Company A, a medium-sized company, produces high-tech products within electrical power engineering. The other three are small companies. Company B represents high-tech software business, company C medium-tech traditional mechanical engineering works and company D low-tech industry manufacturing special types of clothes. All case studies have been conducted with AHP methodology. The case studies in the
92 ActaWasaensia
____________________This article is © Emerald Group Publishing (www.emeraldinsight.com) and permission has been granted for this version to appear here (www.uwasa.fi). Emerald does not grant permission for this article to be further copied/distributed or hosted elsewhere without the express permission from Emerald Group Publishing Limited.
companies have been carried out by the students of course Corporate Strategy Planning / manufacturing strategies at University of Vaasa by using RBL principle (see acknowledgment). The main criteria and sub criteria prepared in the questionnaires for interviews have been defined by the students who have good knowledge about the operation of the case companies, i.e. some of them are working or have been working there in the management group. The interviewees are the decision makers in the case companies, and the number of them is depended the size of case company. From same case company the inconsistent results are left out. The case companies and studies are clarified in more details in Sections 4-7.
4. High-tech medium business strategies (company A) under influence of China effect The business of company A is based on a quite high technology and modular specification for gaining flexibility e.g. in global deliveries of main component supplies of wind power plants in dynamic business conditions. The main business areas are power and automation technologies and it is a leader in these areas. The case company manufactures low voltage motors in six countries, in some since about 100 years ago: Finland, Sweden, Spain, Italy, India and China. In the year 2003 the revenues in the case unit were €132 million, amount of employees was 615 and there were manufactured 37,870 pieces of motors. The main focus of the company is to be a fast and reliable provider for the products and services according to customer’s needs. It is important to reach both competitiveness in the networked world and the results defined by the shareholders. One main factor in this work is skilled personnel. The company also follows the principles of sustainable development. For the case factory, there are several other important considerations in addition to above basic principles of strategies. These are e.g. flexibility according to customer needs, delivery promptness, quality of the products, etc. (Figure 5). According to the analysis of data from the questionnaires answered by this company’s management, we find that the production manager emphasizes customer focus more than the representatives from other functions. The engineering manager thinks that quality is most important, but the marketing manager seems to focus much less on quality than the others. The marketing manager thinks that customer focus is the most important which is logical from his point of view. The production manager emphasizes that still more. Through the data analysis, for this high-tech and mature company, product quality and customer focus are the most important factors in manufacturing strategies. To increase the market shares, the company has founded one of its affiliates in Beijing in 1979 and began to enter the Chinese market. In China, it has been able to maintain its high product quality available in other countries. At the same time, it has set a technology center in China to consolidate its local market share. As the CEO stated, the sales in the China market ranked third in the world only behind the USA and Germany, and he believes that during the next five years the Chinese market will become the biggest market in the world. Just because of the huge market in China, to enter Chinese market and maintain a share there is no doubt central for the company’s strategy. To increase the Chinese market shares,
ActaWasaensia 93
____________________This article is © Emerald Group Publishing (www.emeraldinsight.com) and permission has been granted for this version to appear here (www.uwasa.fi). Emerald does not grant permission for this article to be further copied/distributed or hosted elsewhere without the express permission from Emerald Group Publishing Limited.
its branch company in China, a joint venture, has made the following plans for the next years: firstly, to maintain the growth rate of 20 percent per year at least before 2008, and secondly, to increase the investments. From now to 2008, it will add another US $100 million in new product lines and new factories in China. Furthermore, it plans to buy the raw materials in local market instead of from European market as before which way will reduce cost greatly. It also plans to establish the research centre in Beijing, aiming at enhancing its innovation ability and meet the local customers’ needs optimally. Finally, the unit plans to cultivate local human resources, leading to an increase in the quality of product and service and at the same time reduce the cost. From the above analysis, we conclude that the big market in China attracted this multinational enterprise and for better adoption to the Chinese market it has changed some strategies such as the adopting of new materials resources and local providers, moving from only final assembly in China to the new style of maximizing the utilization of local providers and subcontractors, using not only low cost local labor but also low cost local material, adopting the Chinese enterprise standards to meet the international standards, etc. But as a company famous with its high product quality, it stresses its quality in China as well. This is solved by studying the Chinese quality management system and applying the same standards in quality control. The answers to RQ1 and RQ2 would, therefore, evidently be to dynamically multifocus and specialize by quality and customer focus in a global high dynamic and complex business. Global sourcing in purchasing is also used effectively for cost and productivity competitiveness. RQ3 about human resources, is answered as having and training every day more dynamic engineers, especially in industrial engineering and management.
5. High-tech small business strategies (company B) under influence of China effect Company B is as a subcontracting supplier comparable to category III as investor in China. This business is based on high technology and modularity, e.g. in subcontracting deliveries in dynamic and complex business conditions with more and more globally active clients. Company B which represents high-tech software subcontracting business was founded 1999. It has 8 main big, international customers, and it only employs 31 highly skilled experts. It acts as a partner of internationally operating industrial companies, which means that this company knows the technology and develops itself quickly. It has the ability to provide independent information technology services and carry out entire product development and delivery design projects. Its design services consist of software subcontracting, electronics and software design, SMS/MMS-service platform and electrical gateways. This company is mainly focusing on industrial software technology and software subcontracting and makes customer specific software, electronic design and software projects. The company values are operational excellence, product leadership and customer intimacy. Superb operations and execution often provides a reasonable quality at a very low price. The focus is on efficiency, streamlining operations, supply chain management, no-frills and volume counts.
94 ActaWasaensia
____________________This article is © Emerald Group Publishing (www.emeraldinsight.com) and permission has been granted for this version to appear here (www.uwasa.fi). Emerald does not grant permission for this article to be further copied/distributed or hosted elsewhere without the express permission from Emerald Group Publishing Limited.
The product leadership is very strong in innovation and brand marketing, operating in dynamic markets. The focus here is on development, innovation, design, time-to-market, and high margins in a short time frame. Customer intimacy means that B has to excel in customer attention and customer service and tailor their products and services to individual or almost individual customers. Focus in this area is on customer relationship management, to be able to deliver products and services on time and above customer expectations, offering lifetime value concepts, reliability, and being close to the customer. In these values, customer intimacy plays the most important role in its strategies with weight of 67.2 percent, followed by operational excellence that weighs 25.7 percent. The last is product leadership, with a weight of only 7 percent. According to the investigation and questionnaire provided to the management in the company and through analysis based on the AHP, we can find the most important strategy in this company is quality, with a weight of 45.6 percent followed by customer focus 21.1 percent and cost 15.3 percent (Figure 5). From this analysis, we find that customer focus and quality is the perceived most important criteria for success. The two criteria are consistent with the characters of small and high-tech companies. We also know that the small companies mostly provide their products and services to local customers. If this assumption is correct, the China effects may not affect this type of companies significantly. This might be also because software industry in China is not so developed and many software companies only meet the local market needs for special software that is designed for special requirement of customers. In this way, Chinese software hardly occupies European markets. Considering the cheap labor in China, small and high-tech companies may subcontract some orders to Chinese software companies to benefit through a reduced cost. Nowadays, outsourcing has been an important trend in the world software industry. According to the forecast of IDC, software outsourcing over the world has increased at the speed of 29.2 percent per year. However, in the process of outsourcing, small and high-tech companies will meet several problems and should adjust their old strategies. Firstly, big cultural differences will be barriers between these companies and Chinese software companies. Thus, this type of companies should hire the Chinese engineers who have studied or worked in the European countries for a long time to serve as a connection “bridge”. Secondly, the size of Chinese software companies are normally not as big as Indian software companies, thus the Chinese companies hardly would complete huge projects. This requires the Finnish high-tech companies to subcontract the project to several companies, but in this way, the education cost, management difficulties and outsourcing risks also increase. An effective method is to find an intermediate agency in China to assist in managing the outsourcing projects and educating Chinese software companies. The answers to the research questions therefore would evidently be to dynamically multifocus and specialize by quality and customer focus for high dynamic and complex business with globally active clients, and train for more dynamic engineers, as for company A.
ActaWasaensia 95
____________________This article is © Emerald Group Publishing (www.emeraldinsight.com) and permission has been granted for this version to appear here (www.uwasa.fi). Emerald does not grant permission for this article to be further copied/distributed or hosted elsewhere without the express permission from Emerald Group Publishing Limited.
6. Medium/low-tech small business strategies (company C) under influence of China effect The third company in our study is a medium/low-tech, local “collaboration partner” company C. Company C is as a subcontracting supplier comparable to category III as investor in China, and it is not currently specialized in its business. This business has quite low technology and the products are of low modularity. Company C, a small business, is a metal company formed in 1940s. Its turnover is about €7.1 million and it employs just little bit over 60 persons. The strategy of this company is to follow the development in their manufacturing sector and to further develop the production and machining methods in their own production as well as in subcontracting. Through the AHP analysis, according to the mean values of the main criteria, the most important criteria in the company’s manufacturing strategy is time management. The next most important aspects are costs and flexibility. The least important of the criteria according to the respondents is quality. The production strategy of C seems to be that of ordinary, old-fashioned manufacturing company that concentrates on timing and costs. On the other hand, the company’s strategy is changing towards more quality driven and flexible. For such a company with medium or low technology base, good service will be the most important factor, influencing the company’s business hugely. Thus it is very important to be on time. With timely and reliable deliveries it is possible to gain new customers and keep the existing customers satisfied, whereas low reliability of deliveries and delivery times may result to customer loss (Figure 5). Now, how will this type of manufacturing strategies change under the China effect? Firstly, this type of company with medium or low technology base should keep the strategy of being on time no matter when and where they are located. Being on time is the guideline in the actual business environment of this type of company. When lots of Chinese firms enter Western markets, the incumbents should maintain their loyal customers by keeping their timeliness that should be easier from nearby locations. Secondly, Chinese firms are known for their low cost. This is why most people think Chinese firms are competitive. Usually, reducing the cost stems from both inner and outer aspects. From an inner aspect, the incumbent Western companies should improve their productivity and reduce the redundant personnel, which methods are already broadly adopted companies such as C, so we should concentrate more on the outer aspect. The outer aspect concerns the network of suppliers and customers. In order to be able to procure low cost materials, the only way is to start up branches in developing countries. In this way, the companies not only can get the low cost materials but also reduce part of the manufacturing cost. In the same time, this step can help these companies to establish the market shares in developing countries. This step thus also helps these companies become international. The answers to RQ1 and RQ2 would, therefore, for companies similar to C, be to multifocus and “specialize” by costs, flexibility and quality. Every day increasingly global sourcing is used for cost and productivity competitiveness.
96 ActaWasaensia
____________________This article is © Emerald Group Publishing (www.emeraldinsight.com) and permission has been granted for this version to appear here (www.uwasa.fi). Emerald does not grant permission for this article to be further copied/distributed or hosted elsewhere without the express permission from Emerald Group Publishing Limited.
7. Low-tech small business strategies (company D) under influence of China effect Finally, the fourth case company D is a small, medium/low-tech yet unspecialized “global collaboration partner”, trying to change to be “problem solver” company. D is a category III investor in China. This business utilizes increasingly high (but at this moment yet not so high) technology. Company D was established in 1937. Their factory is located and almost their whole production is made in a small Northern-European country. They produce work clothes for smaller and bigger clients, developed for changing environments and a multitude of jobs. Their main strategy is to serve clients with flexible expertise, high quality materials and above all comfortable and good work clothes. Some decades ago they employed almost 200 workers. Nowadays they only have approximately 20 workers. Based on the data analysis and questionnaire provided to the company’s management, we draw the conclusion that low costs are the most important factor in the business of this company. On the other hand, quality gets the lowest values of importance. The other fields are rather equal. Flexibility is however perceived to be a little bit more important than customer focus and know-how. To emphasize the low cost level, this company is attempting to follow the trend of their branch, that is, most of the textile industry enterprises have transferred their production to the cheaper labor countries, for example to Russia, Estonia and China (Figure 5). Especially concerning low-tech branches such as textile industry, we have to talk about China effect. Chinese textile occupies a big share (over 90 percent) of world textile market. This is firstly due to the advanced technology. Chinese textile products represent a level of quality warmly welcomed by the customers. Secondly, and maybe much more important, Chinese textile companies excel in cheap raw materials and labor. Many textile companies set branches in China in order to reduce the cost, and more companies, even many world-known luxury brands, just sign contracts with Chinese local factories to manufacture clothes or textiles. At the same time, there are many large, medium or small textile factories in China, so many textiles are exported to the USA or the European markets. As a result, Chinese products occupy big market shares also in Western markets, so the European companies have to close because they cannot afford the cost. The only sustainable solution is to transfer to China in order to survive. For a freely available, low technology business such as textiles, the best way to survive in the market is to reduce the cost. Thus, the decision of company D is to transfer their production to the cheap labor countries as for example to Russia, Estonia and China. At the same time, due to many competitors in the markets, being flexible to customer needs while maintaining low price will be beneficial, especially to small companies. The propositions for answers to the RQ1 and RQ2 would, for a small low-tech company, therefore, be to “situationally” multifocus and specialize more and more by costs, flexibility and quality. Global sourcing should be used effectively for cost and productivity competitiveness. Thus, also here RQ3 about human resources is answered by recruiting more dynamic engineers, especially in industrial engineering and management.
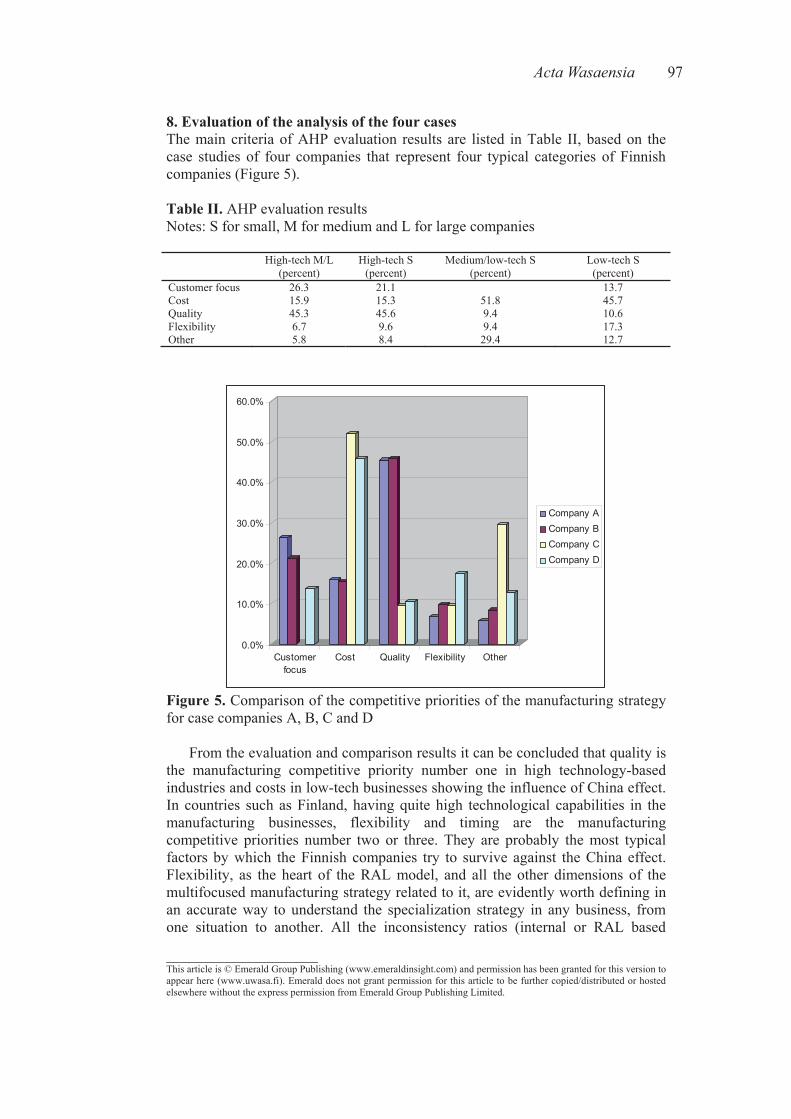
ActaWasaensia 97
____________________This article is © Emerald Group Publishing (www.emeraldinsight.com) and permission has been granted for this version to appear here (www.uwasa.fi). Emerald does not grant permission for this article to be further copied/distributed or hosted elsewhere without the express permission from Emerald Group Publishing Limited.
8. Evaluation of the analysis of the four cases The main criteria of AHP evaluation results are listed in Table II, based on the case studies of four companies that represent four typical categories of Finnish companies (Figure 5).
Table II. AHP evaluation results Notes: S for small, M for medium and L for large companies
High-tech M/L (percent)
High-tech S (percent)
Medium/low-tech S (percent)
Low-tech S (percent)
Customer focus 26.3 21.1 13.7 Cost 15.9 15.3 51.8 45.7 Quality 45.3 45.6 9.4 10.6 Flexibility 6.7 9.6 9.4 17.3 Other 5.8 8.4 29.4 12.7
0.0%
10.0%
20.0%
30.0%
40.0%
50.0%
60.0%
Customerfocus
Cost Quality Flexibility Other
Company ACompany BCompany CCompany D
Figure 5. Comparison of the competitive priorities of the manufacturing strategy for case companies A, B, C and D
From the evaluation and comparison results it can be concluded that quality is the manufacturing competitive priority number one in high technology-based industries and costs in low-tech businesses showing the influence of China effect. In countries such as Finland, having quite high technological capabilities in the manufacturing businesses, flexibility and timing are the manufacturing competitive priorities number two or three. They are probably the most typical factors by which the Finnish companies try to survive against the China effect. Flexibility, as the heart of the RAL model, and all the other dimensions of the multifocused manufacturing strategy related to it, are evidently worth defining in an accurate way to understand the specialization strategy in any business, from one situation to another. All the inconsistency ratios (internal or RAL based
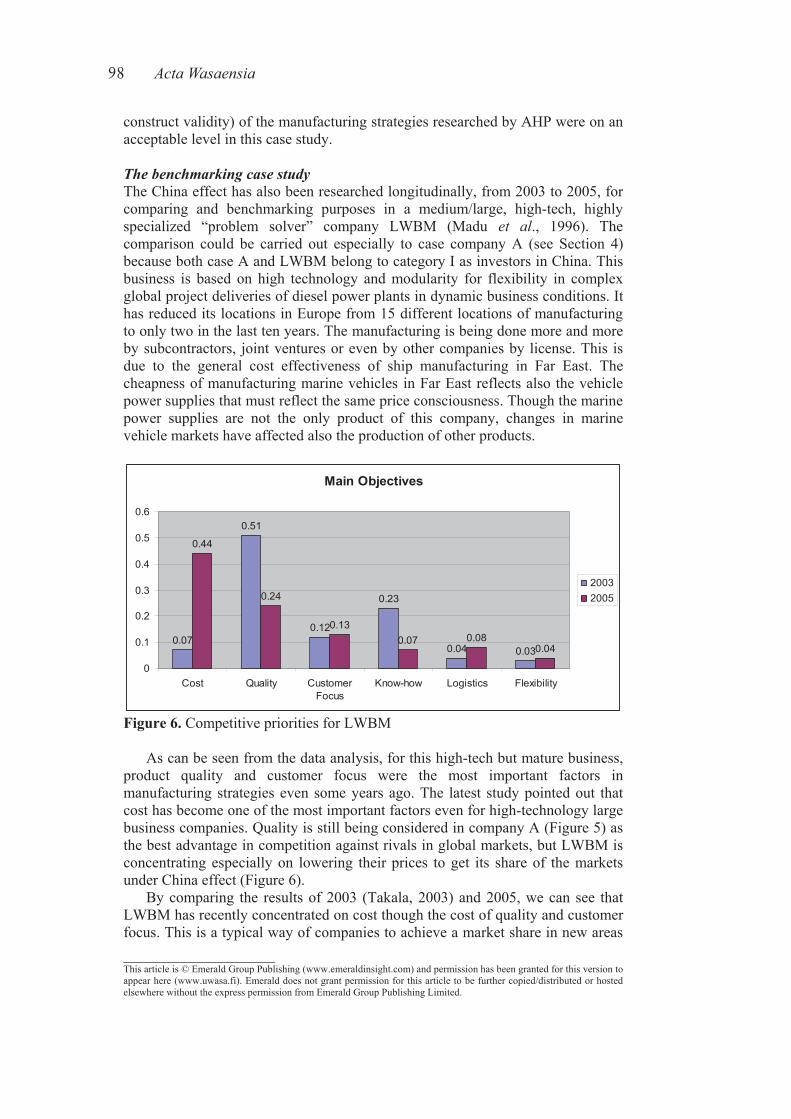
98 ActaWasaensia
____________________This article is © Emerald Group Publishing (www.emeraldinsight.com) and permission has been granted for this version to appear here (www.uwasa.fi). Emerald does not grant permission for this article to be further copied/distributed or hosted elsewhere without the express permission from Emerald Group Publishing Limited.
construct validity) of the manufacturing strategies researched by AHP were on an acceptable level in this case study.
The benchmarking case study The China effect has also been researched longitudinally, from 2003 to 2005, for comparing and benchmarking purposes in a medium/large, high-tech, highly specialized “problem solver” company LWBM (Madu et al., 1996). The comparison could be carried out especially to case company A (see Section 4) because both case A and LWBM belong to category I as investors in China. This business is based on high technology and modularity for flexibility in complex global project deliveries of diesel power plants in dynamic business conditions. It has reduced its locations in Europe from 15 different locations of manufacturing to only two in the last ten years. The manufacturing is being done more and more by subcontractors, joint ventures or even by other companies by license. This is due to the general cost effectiveness of ship manufacturing in Far East. The cheapness of manufacturing marine vehicles in Far East reflects also the vehicle power supplies that must reflect the same price consciousness. Though the marine power supplies are not the only product of this company, changes in marine vehicle markets have affected also the production of other products.
Main Objectives
0.07
0.51
0.12
0.23
0.04 0.03
0.44
0.24
0.130.07 0.08
0.04
0
0.1
0.2
0.3
0.4
0.5
0.6
Cost Quality CustomerFocus
Know-how Logistics Flexibility
20032005
Figure 6. Competitive priorities for LWBM
As can be seen from the data analysis, for this high-tech but mature business, product quality and customer focus were the most important factors in manufacturing strategies even some years ago. The latest study pointed out that cost has become one of the most important factors even for high-technology large business companies. Quality is still being considered in company A (Figure 5) as the best advantage in competition against rivals in global markets, but LWBM is concentrating especially on lowering their prices to get its share of the markets under China effect (Figure 6). By comparing the results of 2003 (Takala, 2003) and 2005, we can see that LWBM has recently concentrated on cost though the cost of quality and customer focus. This is a typical way of companies to achieve a market share in new areas
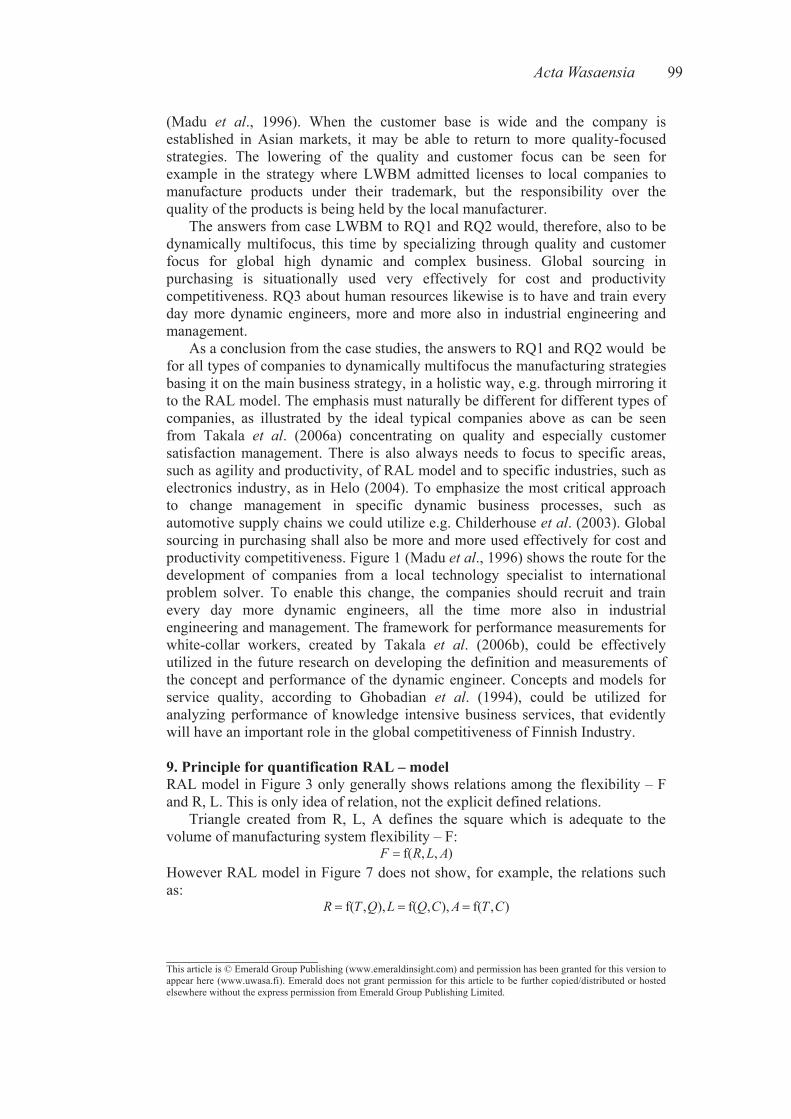
ActaWasaensia 99
____________________This article is © Emerald Group Publishing (www.emeraldinsight.com) and permission has been granted for this version to appear here (www.uwasa.fi). Emerald does not grant permission for this article to be further copied/distributed or hosted elsewhere without the express permission from Emerald Group Publishing Limited.
(Madu et al., 1996). When the customer base is wide and the company is established in Asian markets, it may be able to return to more quality-focused strategies. The lowering of the quality and customer focus can be seen for example in the strategy where LWBM admitted licenses to local companies to manufacture products under their trademark, but the responsibility over the quality of the products is being held by the local manufacturer. The answers from case LWBM to RQ1 and RQ2 would, therefore, also to be dynamically multifocus, this time by specializing through quality and customer focus for global high dynamic and complex business. Global sourcing in purchasing is situationally used very effectively for cost and productivity competitiveness. RQ3 about human resources likewise is to have and train every day more dynamic engineers, more and more also in industrial engineering and management. As a conclusion from the case studies, the answers to RQ1 and RQ2 would be for all types of companies to dynamically multifocus the manufacturing strategies basing it on the main business strategy, in a holistic way, e.g. through mirroring it to the RAL model. The emphasis must naturally be different for different types of companies, as illustrated by the ideal typical companies above as can be seen from Takala et al. (2006a) concentrating on quality and especially customer satisfaction management. There is also always needs to focus to specific areas, such as agility and productivity, of RAL model and to specific industries, such as electronics industry, as in Helo (2004). To emphasize the most critical approach to change management in specific dynamic business processes, such as automotive supply chains we could utilize e.g. Childerhouse etal. (2003). Global sourcing in purchasing shall also be more and more used effectively for cost and productivity competitiveness. Figure 1 (Madu etal., 1996) shows the route for the development of companies from a local technology specialist to international problem solver. To enable this change, the companies should recruit and train every day more dynamic engineers, all the time more also in industrial engineering and management. The framework for performance measurements for white-collar workers, created by Takala et al. (2006b), could be effectively utilized in the future research on developing the definition and measurements of the concept and performance of the dynamic engineer. Concepts and models for service quality, according to Ghobadian et al. (1994), could be utilized for analyzing performance of knowledge intensive business services, that evidently will have an important role in the global competitiveness of Finnish Industry.
9. Principle for quantification RAL – modelRAL model in Figure 3 only generally shows relations among the flexibility – F and R, L. This is only idea of relation, not the explicit defined relations.
Triangle created from R, L, A defines the square which is adequate to the volume of manufacturing system flexibility – F:
),,f( ALRFHowever RAL model in Figure 7 does not show, for example, the relations such as:
),f(),,f(),,f( CTACQLQTR
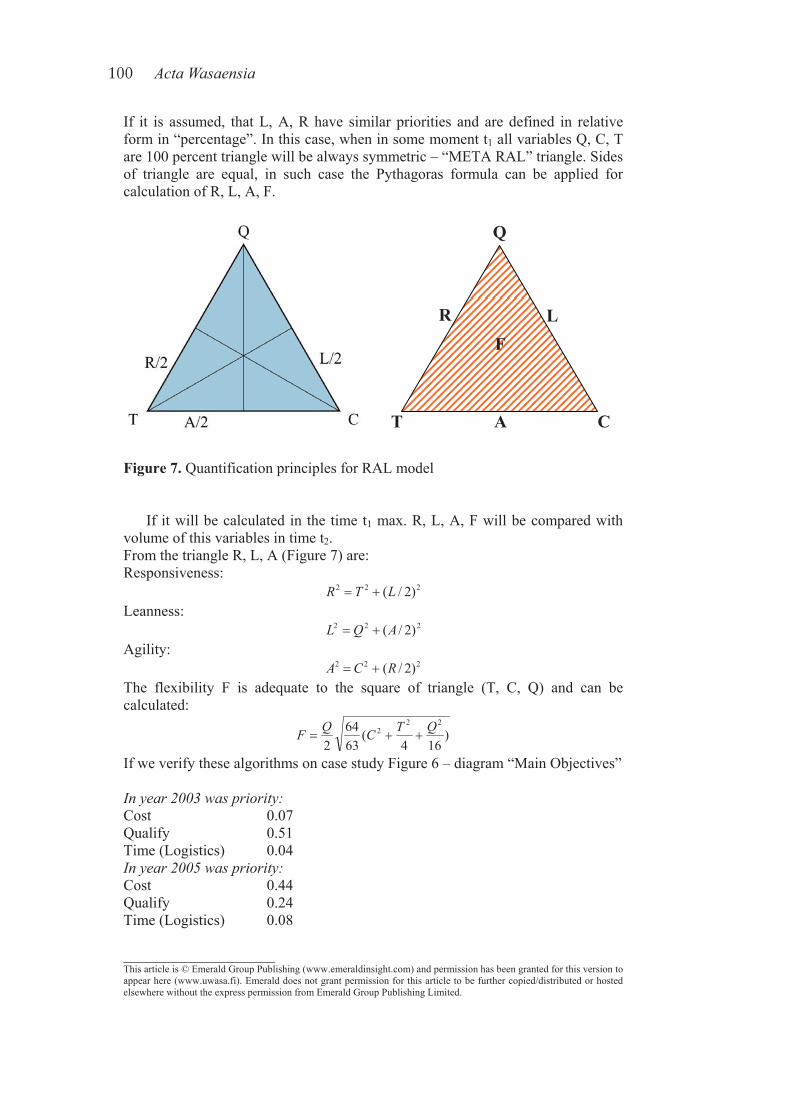
100 ActaWasaensia
____________________This article is © Emerald Group Publishing (www.emeraldinsight.com) and permission has been granted for this version to appear here (www.uwasa.fi). Emerald does not grant permission for this article to be further copied/distributed or hosted elsewhere without the express permission from Emerald Group Publishing Limited.
If it is assumed, that L, A, R have similar priorities and are defined in relative form in “percentage”. In this case, when in some moment t1 all variables Q, C, T are 100 percent triangle will be always symmetric – “META RAL” triangle. Sides of triangle are equal, in such case the Pythagoras formula can be applied for calculation of R, L, A, F.
Figure 7. Quantification principles for RAL model
If it will be calculated in the time t1 max. R, L, A, F will be compared with volume of this variables in time t2.From the triangle R, L, A (Figure 7) are: Responsiveness:
222 )2/(LTRLeanness:
222 )2/(AQLAgility:
222 )2/(RCAThe flexibility F is adequate to the square of triangle (T, C, Q) and can be calculated:
)164
(6364
2
222 QTCQF
If we verify these algorithms on case study Figure 6 – diagram “Main Objectives”
Inyear2003waspriority:Cost 0.07 Qualify 0.51 Time (Logistics) 0.04 Inyear2005waspriority:Cost 0.44 Qualify 0.24 Time (Logistics) 0.08
Q
R
T
L
A C
F
ActaWasaensia 101
____________________This article is © Emerald Group Publishing (www.emeraldinsight.com) and permission has been granted for this version to appear here (www.uwasa.fi). Emerald does not grant permission for this article to be further copied/distributed or hosted elsewhere without the express permission from Emerald Group Publishing Limited.
From this are calculate Flexibility for year 2003 and 2005
05.0)1624.0
408.044.0(02.1
224.0)2005(
,04.0)1651.0
404.007.0(02.1
251.0)
164(
6364
2)2003(
222
222
222
F
QTCQF
The calculated results are very near results in this case study, F(2003) = 0.03 and F(2005) = 0.04.
10. China effect, opportunity or threat? According to Sähkö & Tele (2005), during the last months China, India, Russia, as well as some other fast developing countries and the USA have kept up the growth of world economy. China attracts more foreign investments than the USA, while global corporations are not so interested in small Western countries as a place of investments. For example, the statistics in high-tech business area of 2004 shows that foreign investment to Finland was €5.5 billion in compare to the €21 billion that Finland has invested to other countries. In Europe, the new EU members Poland, Russia, Germany, Hungary and Czech are the most popular countries to invest in. Opening of the markets, growth possibilities in productivity, flexible labor market lures companies particularly to Central and Eastern Europe. The Finnish high-tech corporations have more than 160,000 employees all over the world and only 10 percent of those are in central and Eastern Europe like Estonia, Poland, Hungary and Czech. Finnish companies, especially high-tech companies see these countries as options to go. However they admit that these central and eastern European countries, every country has its own individual advantages and competitiveness, but China has their total advantages in all, so it is probably the best option to invest. Recent statistics also shows that the Finnish high-tech export has a growth 10 percent in turnover, which has gained an increase in Europe and the Middle East but a decrease in the Far East in consequence of China-effect. The situation should be quite similar in most Western-European countries, even if it is naturally exaggerated in small countries with very limited home markets, such as the Nordic countries are. From the discussion of this paper, under the influence of China effect, Western companies should all adjust their operational strategy, more or less. If the strategies are adjusted properly, many companies will see China effect as a great and valuable opportunity they can dramatically benefit from, but on the other hand if these strategic changes are not understood it can lead to disasters for the companies. During the adjustment process, the companies should notice several issues that may affect their decisions. According to Kauppalehti Optio (2005), the biggest problem in trade relationship with China is language. The second biggest problem, cultural collision, will eventually block business development. This requires the management of Western companies to think and treat things locally in a Chinese way. The third issue, trade customs and procedures, are different from the ones the Western companies are used to, which will complicate the practical operations. Finally, political issues will influence the whole economic environment; thus the foreign companies should be flexible. A good sign is that
102 ActaWasaensia
____________________This article is © Emerald Group Publishing (www.emeraldinsight.com) and permission has been granted for this version to appear here (www.uwasa.fi). Emerald does not grant permission for this article to be further copied/distributed or hosted elsewhere without the express permission from Emerald Group Publishing Limited.
the political atmosphere in China and most other countries discussed under the “China effect” is getting more stable and corruption is decreasing. Comparing studies of Heikkilä (2004) with our case study we found out some differences and similarities. Both pieces of research indicate several multifocused and even equally important competitive priorities, but our case study shows a clear need of a hierarchy from business to manufacturing strategies, and up to resource categories (such as dynamic engineers) through which the strategies are implemented (Takala, 2002; Sharma etal., 2006). Heikkilä’s more internationally oriented study also found out that there are more differences in business and manufacturing strategies between companies and factories than between countries. Both the studies found out, related to Nordic countries, especially to Finland, that there are many companies that are specialized with differentiation strategies. This suggests that many companies from Nordic countries may have difficulties to operate in business environments that are hard to anticipate.
11. Conclusion Many companies should nowadays grow internationally and utilize the developing countries as the means of lowering cost. However, each type of company should have its own special strategy to suit to these markets, utilizing dynamic multifocused manufacturing strategies basing on business strategy, in a holistic way, e.g. by RAL model. Global sourcing in purchasing shall also be more and more used effectively for cost and productivity competitiveness. This means that Porter’s (1985) both options for global differentiation should be utilized simultaneously in a balanced way, the emphasis depending of the size, tradition and situation of the business. The development steps from technology specialist to problem solver are also natural for all companies. This requires that human resources have to be trained to be more “dynamic engineers”, all the time more also in industrial engineering and management. The “dynamic engineer” will really be the decision maker for the future world-class industries.
Acknowledgement The authors want to express their special thanks to associate professor, director Kongkiti Phusavat, from Kasetsart University, International Graduate School in Industrial Engineering, Bangkok, Thailand, for his valuable comments on the research for categorizing the companies investing in China, and to Tauno Kekäle, professor in industrial management especially in new product development at University of Vaasa, for his very valuable comments to the structure and language of the text, and also to the students of course Corporate Strategy Planning/ manufacturing strategies at University of Vaasa for carrying out the studies in the case companies.
References Barney, J.B., Wright, M. and Ketchen, D.J. Jr (2001), “The resource-based view
of the firm: ten years after 1991”, JournalofManagement, Vol. 27, pp. 625-41.
Bogan, C.E. and English, M.J. (1994), BenchmarkingforBestPractices,WinningthroughInnovativeAdaptation, McGraw-Hill, New York, NY.

ActaWasaensia 103
____________________This article is © Emerald Group Publishing (www.emeraldinsight.com) and permission has been granted for this version to appear here (www.uwasa.fi). Emerald does not grant permission for this article to be further copied/distributed or hosted elsewhere without the express permission from Emerald Group Publishing Limited.
Bradley, S.P. and Nolan, R.L. (1998), Sense&RespondCapturingValue in theNetworkEra, Harvard Business School Press, Boston, MA.
Braun, E. (1998), TechnologyinContext.TechnologyAssessmentforManagers,TheManagementofTechnologyandInnovation, Routledge, London.
Childerhouse, P., Hermiz, R., Mason-Jones, R., Popp, A. and Towill, D. (2003), “Information flow in automotive supply chains – identifying and learning to overcome barriers to change”, IndustrialManagement&DataSystems, Vol. 103 No. 7, pp. 491-502.
Eisenhardt, K.M. (1989), “Building theories from case study research”, AcademyofManagementReview, Vol. 14 No. 4, pp. 532-50.
Ghobadian, A., Speller, S. and Jones, M. (1994), “Service quality: concepts and models”, International Journal of Quality & Reliability Management, Vol. 11 No. 9, pp. 43-66.
Heikkilä, J. (2004), “Tuotantostrategia – Millä edellytyksillä tuotanto on yrityksen kilpailuedun lähde?”, available at:
www.glocoproject.net/sivut/heikkila_2004_10_27.pdf Helo, P. (2004), “Managing agility and productivity in the electronics industry”,
IndustrialManagement&DataSystems, Vol. 104 No. 7, pp. 567-77.(The) Indian Express (2005), “US has lost its technological edge – argument of
anti-offshoring lobbies: US versus them: outsourcing on knife-edge again”, TheIndianExpress, December 14, p. 11.
Kauppalehti Optio (2005), “Kiina-ilmio” (“China effect”), Kauppalehti Optio,November 24 (in Finnish), pp. 58-63.
Kim, J.S. and Arnold, P. (1996), “Operationalizing manufacturing strategy – an exploratory study of constructs and linkage”, International Journal ofOperation&ProductManagement, Vol. 16 No. 12, pp. 45-73.
Madu, C.N., Aheto, J., Kuei, C. and Winokur, D. (1996), “Adoption of strategic total quality management philosophies: multi-criteria decision analysis model”, InternationalJournalofQuality&ReliabilityManagement, Vol. 13 No. 3, pp. 57-72.
Markides, C.C. (2000), All theRightMoves:AGuide toCraftingBreakthroughStrategy, Harvard Business School Press, Boston, MA.
Phusavat, K. and Takala, J. (2005), “Managing and sustaining outsourcing activities: case discussion and presentation of lessons learned in Thailand and Finland”, Journal Przeglad Mechaniczny and XIth National and IIth International Conference, Metrologia in Production Engineering, 15-17 September, Lublin.
Porter, M.E. (1985), Competitive Advantage, Creating and Sustaining SuperiorPerformance, MacMillan Inc./The Free Press, New York, NY.
Rangone, A. (1996), “An analytical hierarchy process framework for comparing the overall performance of manufacturing departments”, InternationalJournalofOperations&ProductionManagement, Vol. 16 No. 8, pp. 104-19.
Sähkö&Tele (2005), “Teknologian tilanne ja näkymät”, Sähkö&Tele, Vol. 7, pp. 6-8 (in Finnish).
104 ActaWasaensia
____________________This article is © Emerald Group Publishing (www.emeraldinsight.com) and permission has been granted for this version to appear here (www.uwasa.fi). Emerald does not grant permission for this article to be further copied/distributed or hosted elsewhere without the express permission from Emerald Group Publishing Limited.
Sharma, R.K., Kumar, D. and Kumar, P. (2006), “Manufacturing excellence through TPM implementation: a practical analysis”, IndustrialManagement&DataSystems, Vol. 106 No. 2, pp. 256-80.
Sykes, W. (1991), “Taking stock: issues from the literature on validity and reliability in qualitative research”, Journalof theMarketResearchSociety,Vol. 33 No. 1, pp. 3-12.
Takala, J. (1997), “Developing new competitive strategies for high performance organizations from empirical case studies on relationship between technology management and total quality management”, Proceedings ofICPQR’1997, Houston, pp. 573-84.
Takala, J. (2002), “Analyzing and synthesizing multi-focused manufacturing strategies by analytical hierarchy process”, International Journal ofManufacturingTechnologyandManagement, Vol. 4 No. 5, pp. 345-50.
Takala, J. (2003), “Competitive priorities of manufacturing strategy – case Wärtsilä Vaasa”, (unpublished).
Takala, J. (2006), Expert interview with Associate Professor, Director Kongkiti Phusavat, from Kasetsart University, International Graduate School in Industrial Engineering, Bangkok, Thailand; conducted by Prof. Takala.
Takala, J., Bhufhai, A. and Phusavat, K. (2006a), “Proposed verification method for the content suitability of the customer satisfaction survey”, IndustrialManagement&DataSystems, Vol. 106 No. 6, pp. 841-54.
Takala, J., Suwansaranyu, U. and Phusavat, K. (2006b), “A proposed white-collar workforce performance measurement framework”, IndustrialManagement&DataSystems, Vol. 106 No. 5, pp. 644-62.
Corresponding authorJosu Takala can be contacted at: [email protected]
ActaWasaensia 105
Appendix C.2
____________________This article is © Emerald Group Publishing (www.emeraldinsight.com) and permission has been granted for this version to appear here (www.uwasa.fi). Emerald does not grant permission for this article to be further copied/distributed or hosted elsewhere without the express permission from Emerald Group Publishing Limited.
Competitiveness of Chinese high-tech manufacturing
companies in global context Shubin Si
DepartmentofIndustrialEngineering,NorthwesternPolytechnicalUniversity,Xi’an,People’sRepublicofChina
Josu Takala and Yang Liu DepartmentofProduction,UniversityofVaasa,Vaasa,Finland
AbstractPurpose – The purpose of this paper is to study the operational competitiveness and identify the development route of Chinese high-tech manufacturing companies by comparing with other similar international manufacturing companies of global manufacturing strategies database.Design/methodology/approach – The preliminary analytical models for competitiveness analysis are used to analyze the operational competitiveness strategies in three different types of Chinese high-tech manufacturing companies based on the weights of the multi-criteria manufacturing strategies, which are calculated using analytic hierarchy process method. Benchmarking between case companies and leading companies of prospector, analyzer and defender groups is applied to evaluate the manufacturing strategies further. Findings – As a result of the case studies, it is possible to understand operational competitiveness manufacturing strategies for the case companies, to show one development route for Chinese high-tech manufacturing companies to be competitive in their markets. Practical implications – Chinese high-tech manufacturing companies have their own operational strategies in different development phase. The different weights of important factors such as quality, cost, time and flexibility make the case companies to have some advantages in prospector, analyzer and defender. The preliminary analytical models are effective for Chinese high-tech manufacturing companies to calculate their operational competitiveness under the influence of Chinese culture and macro-control. Originality/value – Benchmarking of operational competitiveness is presented to evaluate the manufacturing strategies in this paper. One development route of Chinese high-tech manufacturing companies, which is under the influence of Chinese culture and macro-control, is promoted. Keywords Competitive strategy, Strategic manufacturing, Manufacturing systems, Benchmarking, Analytical hierarchy process, China Paper type Case study
1. Introduction With the development of Chinese industries and their products, the effect of Chinese manufacturing competitiveness is more important than before in the
106 ActaWasaensia
____________________This article is © Emerald Group Publishing (www.emeraldinsight.com) and permission has been granted for this version to appear here (www.uwasa.fi). Emerald does not grant permission for this article to be further copied/distributed or hosted elsewhere without the express permission from Emerald Group Publishing Limited.
global markets. China has become a strong manufacturing country and has influenced the business and manufacturing strategies in many different business areas. The operation management level of China has been improved to approach European level. To study operational competitiveness of Chinese manufacturing companies is an effective path to understand their manufacturing capacity and “China effect”. Future competitiveness of manufacturing operations under the dynamic and complex situations relies on forward-thinking strategies. Companies should typically utilize multi-focus manufacturing strategies in a holistic way based on their business plan and goal. Competitive priorities belong to the first phase of manufacturing strategies, which act as the bridge between business strategy and the manufacturing objectives (Kim and Arnold, 1996). Competitive priorities are the crucial decisive variables for operations managers and operations researchers to manage the global manufacturing operations. It indicates a strategy emphasized on developing certain manufacturing capabilities that many improve a plant’s market position. Competitive priorities can answer three questions: the first is that which type and ranking of business the companies should belong to by analyzing and evaluating competitive priorities; the second is what should be developed in the company according to comparison; the third is whether the business strategies can be supported and whether the manufacturing objective can be achieved. The theoretical frame of reference of this study starts from resource based view of a case study for a firm, especially human resource based strategy of an organization (Wernerfelt, 1984). This framework goes on to justification of multi-focused manufacturing strategies (Takala, 2002). The important achievements have been studied to support and improve the framework mentioned above. Miles and Snow (1978) have defined four company’s groups which include prospector, analyzer, defender and reactor. Based on this literature, Takala et al. (2007a) promoted the analytical models to calculate the competitiveness rankings in each group according to the company’s multi-criteria weights of Q(quality), C(cost), T(time) and F(flexibility). The analytical models were developed to gain insight into the influence and sensitivities of various parameters and processes on the alteration of strategies by Takala et al. (2007b). Liu et al. (2008) has used analytical models to analyze operative competitiveness of one Chinese case company, which manufactures CNC machines. Madu etal. (1996) presented the concept of strategic groups for different technology and collaboration level in technologically intensive countries, which include technology specialist, commodity product, collaboration partner and problem solver. The idea has been modified by the authors by adding the typical development route of global industries to be later considered when studying the influences of China effect. The main idea is that in global markets, when a company starts export activities, it has to move cautiously from being a technology specialist to selling commodity products, from that further to a collaboration partner, and finally to problem solver especially in technologically intensive countries such as Finland or Sweden. In pervious studies and related literatures above, Takala et al. (2007a) introduced the unique analytical models to evaluate the competitiveness of manufacturing companies world-wide. In China, the most dynamic market, Liu etal. (2008) have first time applied such analytical models to analyze operational
ActaWasaensia 107
____________________This article is © Emerald Group Publishing (www.emeraldinsight.com) and permission has been granted for this version to appear here (www.uwasa.fi). Emerald does not grant permission for this article to be further copied/distributed or hosted elsewhere without the express permission from Emerald Group Publishing Limited.
competitiveness of a private middle-size manufacturing company in China. This paper continues such analysis further in China with more deep insights of operational competitiveness of Chinese high-tech manufacturing companies compared in a global context to suggest how to improve the operational strategies in order to be more competitive, and to verify the analytical models of operational competitiveness and promote one development route of Chinese manufacturing companies under the influence of Chinese culture and macro-control further based on the study of Madu etal. (1996). In this paper, case studies of Chinese high-tech manufacturing companies, which include Chinese high-tech international manufacturing company (CHIMC), Chinese high-tech regional manufacturing company (CHRMC) and Chinese high-tech independent research and development companies (CHIRDC) belong to state-owned manufacturing companies. The structure of this paper is as follows. Section 2 introduces some methodologies and assumptions. Section 3 analyzes the operational competitiveness of Chinese high-tech manufacturing companies. Section 4 studies one development route of Chinese high-tech manufacturing companies. Section 5 discusses managerial implication and future research. Section 6 draws some conclusions.
1.1ConceptsofChinesehigh-techmanufacturingcompaniesThe high-tech companies studied in this paper, which is important component of Chinese leading industries, mainly produce computing, optical, mechanical and electronic integrated equipments. We choose three typical high-tech companies below as case studies based on the typical development route of global industries. These case companies categorized in this paper represent typical Chinese state-owned manufacturing companies, and such types of companies generally exist in China. The main concepts are as follows:
CHIMC. CHIMC can control global supply chain of one or two types of high-tech products. Customers of CHIMC are global. CHRMC. The products of CHRMC mainly serve for Chinese customers. Sometimes, a few products can be exported to foreign countries. CHIRDC. One important mission of CHIRDC is to research or develop new products for some manufacturing companies. Another task is to manufacture a few types of products for customers, future aim of which earns more profits from market.
1.2ConceptsofGMSSdatabaseGlobal manufacturing strategies (GMSS) database, which consists of operational competitiveness’ data of 100 case studies of ten counties, is created to study manufacturing strategies.
2. Research methodology 2.1AnalytichierarchyprocessmethodAnalytic hierarchy process (AHP) method (Saaty, 1980) is a multi-attribute decision instrument that allows considering quantitative, qualitative measures and
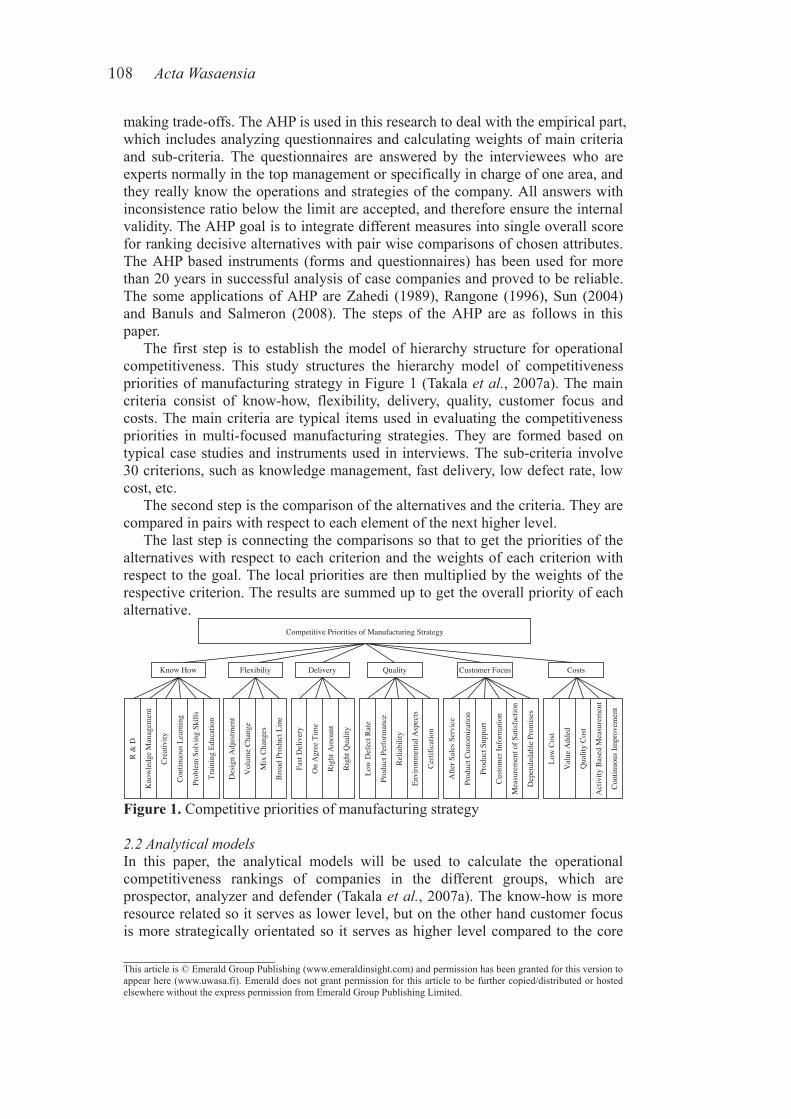
108 ActaWasaensia
____________________This article is © Emerald Group Publishing (www.emeraldinsight.com) and permission has been granted for this version to appear here (www.uwasa.fi). Emerald does not grant permission for this article to be further copied/distributed or hosted elsewhere without the express permission from Emerald Group Publishing Limited.
making trade-offs. The AHP is used in this research to deal with the empirical part, which includes analyzing questionnaires and calculating weights of main criteria and sub-criteria. The questionnaires are answered by the interviewees who are experts normally in the top management or specifically in charge of one area, and they really know the operations and strategies of the company. All answers with inconsistence ratio below the limit are accepted, and therefore ensure the internal validity. The AHP goal is to integrate different measures into single overall score for ranking decisive alternatives with pair wise comparisons of chosen attributes. The AHP based instruments (forms and questionnaires) has been used for more than 20 years in successful analysis of case companies and proved to be reliable. The some applications of AHP are Zahedi (1989), Rangone (1996), Sun (2004) and Banuls and Salmeron (2008). The steps of the AHP are as follows in this paper. The first step is to establish the model of hierarchy structure for operational competitiveness. This study structures the hierarchy model of competitiveness priorities of manufacturing strategy in Figure 1 (Takala etal., 2007a). The main criteria consist of know-how, flexibility, delivery, quality, customer focus and costs. The main criteria are typical items used in evaluating the competitiveness priorities in multi-focused manufacturing strategies. They are formed based on typical case studies and instruments used in interviews. The sub-criteria involve 30 criterions, such as knowledge management, fast delivery, low defect rate, low cost, etc. The second step is the comparison of the alternatives and the criteria. They are compared in pairs with respect to each element of the next higher level. The last step is connecting the comparisons so that to get the priorities of the alternatives with respect to each criterion and the weights of each criterion with respect to the goal. The local priorities are then multiplied by the weights of the respective criterion. The results are summed up to get the overall priority of each alternative.
Figure 1. Competitive priorities of manufacturing strategy
2.2AnalyticalmodelsIn this paper, the analytical models will be used to calculate the operational competitiveness rankings of companies in the different groups, which are prospector, analyzer and defender (Takala etal., 2007a). The know-how is more resource related so it serves as lower level, but on the other hand customer focus is more strategically orientated so it serves as higher level compared to the core
Competitive Priorities of Manufacturing Strategy
Know How
Cre
ativ
ity
Con
tinuo
us L
earn
ing
Prob
lem
Sol
ving
Ski
lls
Trai
ning
Edu
catio
n
Des
ign
Adj
ustm
ent
Vol
ume
Cha
nge
Mix
Cha
nges
Bro
ad P
rodu
ct L
ine
Fast
Del
iver
y
On
Agr
ee T
ime
Rig
ht A
mou
nt
Rig
ht Q
ualit
y
Low
Def
ect R
ate
Prod
uct P
erfo
rman
ce
Rel
iabi
lity
Envi
ronm
enta
l Asp
ects
Cer
tific
atio
n
Afte
r Sal
es S
ervi
ce
Prod
uct C
usto
miz
atio
n
Prod
uct S
uppo
rt
Cus
tom
er In
form
atio
n
Mea
sure
men
t of S
atis
fact
ion
Dep
ende
dabl
e Pr
omis
es
Low
Cos
t
Val
ue A
dded
Qua
lity
Cos
t
Act
ivity
Bas
ed M
easu
rem
ent
Con
tinuo
us Im
prov
emen
t
Kno
wle
dge
Man
agem
ent
R &
D
Flexibiliy Delivery Quality Customer Focus Costs
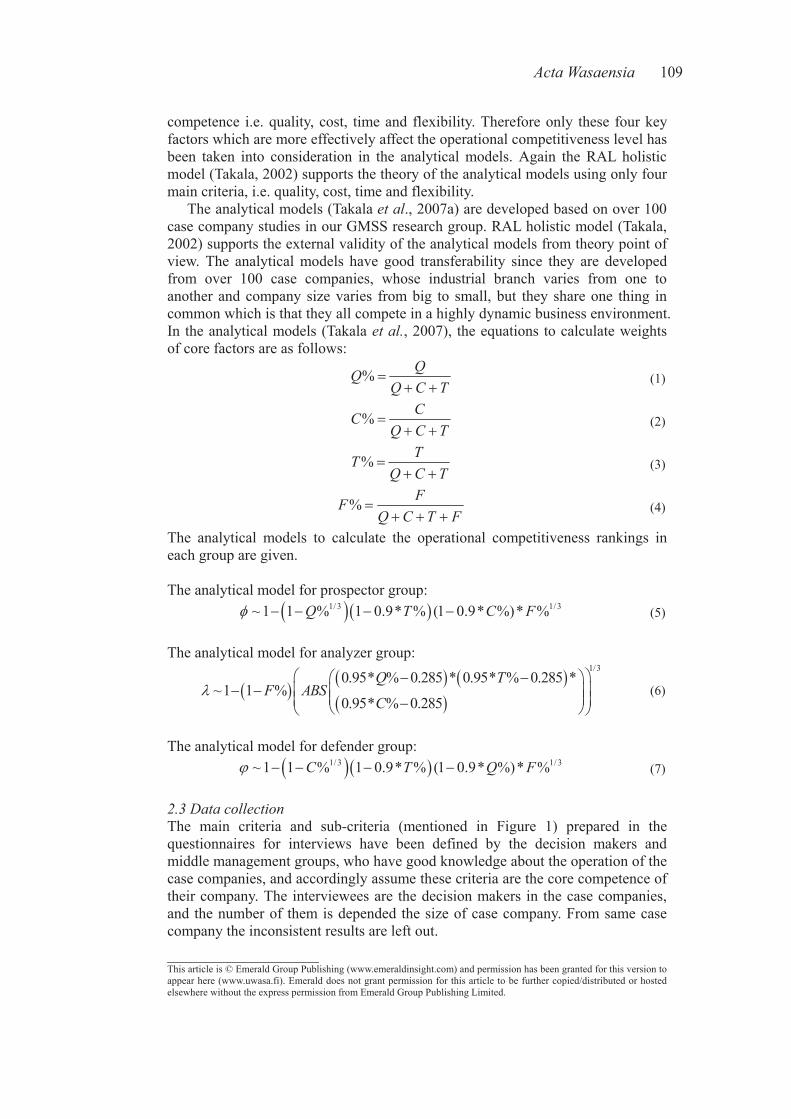
ActaWasaensia 109
____________________This article is © Emerald Group Publishing (www.emeraldinsight.com) and permission has been granted for this version to appear here (www.uwasa.fi). Emerald does not grant permission for this article to be further copied/distributed or hosted elsewhere without the express permission from Emerald Group Publishing Limited.
competence i.e. quality, cost, time and flexibility. Therefore only these four key factors which are more effectively affect the operational competitiveness level has been taken into consideration in the analytical models. Again the RAL holistic model (Takala, 2002) supports the theory of the analytical models using only four main criteria, i.e. quality, cost, time and flexibility. The analytical models (Takala etal., 2007a) are developed based on over 100 case company studies in our GMSS research group. RAL holistic model (Takala, 2002) supports the external validity of the analytical models from theory point of view. The analytical models have good transferability since they are developed from over 100 case companies, whose industrial branch varies from one to another and company size varies from big to small, but they share one thing in common which is that they all compete in a highly dynamic business environment. In the analytical models (Takala etal., 2007), the equations to calculate weights of core factors are as follows:
TCQQQ% (1)
TCQCC% (2)
TCQTT % (3)
FTCQFF% (4)
The analytical models to calculate the operational competitiveness rankings in each group are given.
The analytical model for prospector group: 1/3 1/3~ 1 1 % 1 0.9* % (1 0.9* %)* %Q T C F (5)
The analytical model for analyzer group: 1/3
0.95* % 0.285 * 0.95* % 0.285 *~1 1 %
0.95* % 0.285
Q TF ABS
C(6)
The analytical model for defender group: 1/3 1/3~ 1 1 % 1 0.9* % (1 0.9* %)* %C T Q F (7)
2.3DatacollectionThe main criteria and sub-criteria (mentioned in Figure 1) prepared in the questionnaires for interviews have been defined by the decision makers and middle management groups, who have good knowledge about the operation of the case companies, and accordingly assume these criteria are the core competence of their company. The interviewees are the decision makers in the case companies, and the number of them is depended the size of case company. From same case company the inconsistent results are left out.
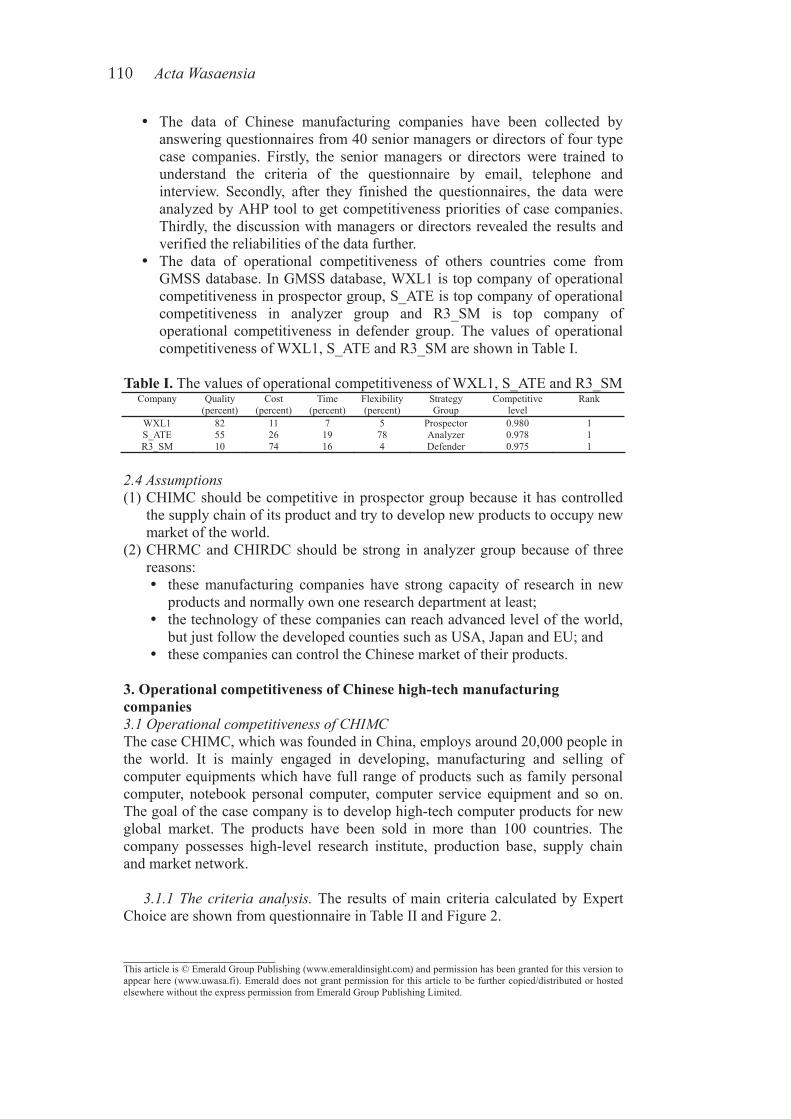
110 ActaWasaensia
____________________This article is © Emerald Group Publishing (www.emeraldinsight.com) and permission has been granted for this version to appear here (www.uwasa.fi). Emerald does not grant permission for this article to be further copied/distributed or hosted elsewhere without the express permission from Emerald Group Publishing Limited.
The data of Chinese manufacturing companies have been collected by answering questionnaires from 40 senior managers or directors of four type case companies. Firstly, the senior managers or directors were trained to understand the criteria of the questionnaire by email, telephone and interview. Secondly, after they finished the questionnaires, the data were analyzed by AHP tool to get competitiveness priorities of case companies. Thirdly, the discussion with managers or directors revealed the results and verified the reliabilities of the data further. The data of operational competitiveness of others countries come from GMSS database. In GMSS database, WXL1 is top company of operational competitiveness in prospector group, S_ATE is top company of operational competitiveness in analyzer group and R3_SM is top company of operational competitiveness in defender group. The values of operational competitiveness of WXL1, S_ATE and R3_SM are shown in Table I.
Table I. The values of operational competitiveness of WXL1, S_ATE and R3_SM Company Quality
(percent)Cost
(percent)Time
(percent)Flexibility(percent)
Strategy Group
Competitive level
Rank
WXL1 82 11 7 5 Prospector 0.980 1 S_ATE 55 26 19 78 Analyzer 0.978 1 R3_SM 10 74 16 4 Defender 0.975 1
2.4Assumptions(1) CHIMC should be competitive in prospector group because it has controlled
the supply chain of its product and try to develop new products to occupy new market of the world.
(2) CHRMC and CHIRDC should be strong in analyzer group because of three reasons:
these manufacturing companies have strong capacity of research in new products and normally own one research department at least; the technology of these companies can reach advanced level of the world, but just follow the developed counties such as USA, Japan and EU; and these companies can control the Chinese market of their products.
3. Operational competitiveness of Chinese high-tech manufacturing companies3.1OperationalcompetitivenessofCHIMCThe case CHIMC, which was founded in China, employs around 20,000 people in the world. It is mainly engaged in developing, manufacturing and selling of computer equipments which have full range of products such as family personal computer, notebook personal computer, computer service equipment and so on. The goal of the case company is to develop high-tech computer products for new global market. The products have been sold in more than 100 countries. The company possesses high-level research institute, production base, supply chain and market network.
3.1.1The criteriaanalysis.The results of main criteria calculated by Expert Choice are shown from questionnaire in Table II and Figure 2.
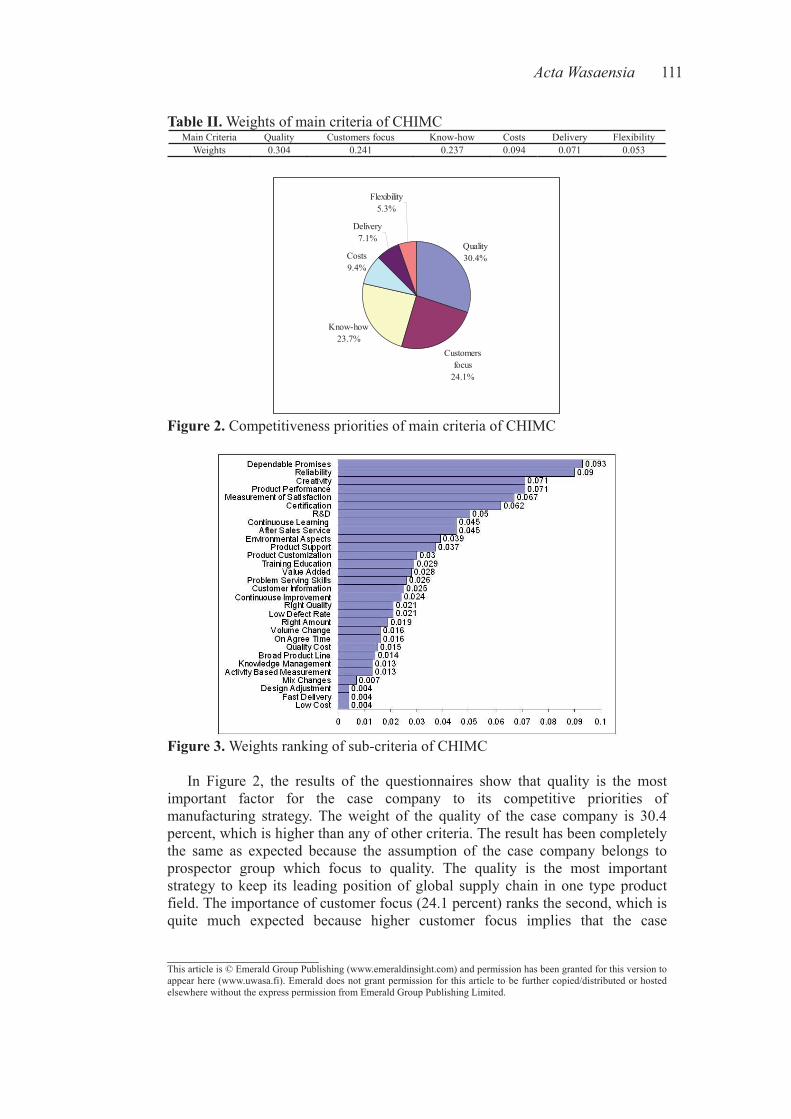
ActaWasaensia 111
____________________This article is © Emerald Group Publishing (www.emeraldinsight.com) and permission has been granted for this version to appear here (www.uwasa.fi). Emerald does not grant permission for this article to be further copied/distributed or hosted elsewhere without the express permission from Emerald Group Publishing Limited.
Table II. Weights of main criteria of CHIMC Main Criteria Quality Customers focus Know-how Costs Delivery Flexibility
Weights 0.304 0.241 0.237 0.094 0.071 0.053
Quality30.4%
Customers focus
24.1%
Know-how23.7%
Costs9.4%
Delivery7.1%
Flexibility5.3%
Figure 2. Competitiveness priorities of main criteria of CHIMC
Figure 3. Weights ranking of sub-criteria of CHIMC
In Figure 2, the results of the questionnaires show that quality is the most important factor for the case company to its competitive priorities of manufacturing strategy. The weight of the quality of the case company is 30.4 percent, which is higher than any of other criteria. The result has been completely the same as expected because the assumption of the case company belongs to prospector group which focus to quality. The quality is the most important strategy to keep its leading position of global supply chain in one type product field. The importance of customer focus (24.1 percent) ranks the second, which is quite much expected because higher customer focus implies that the case
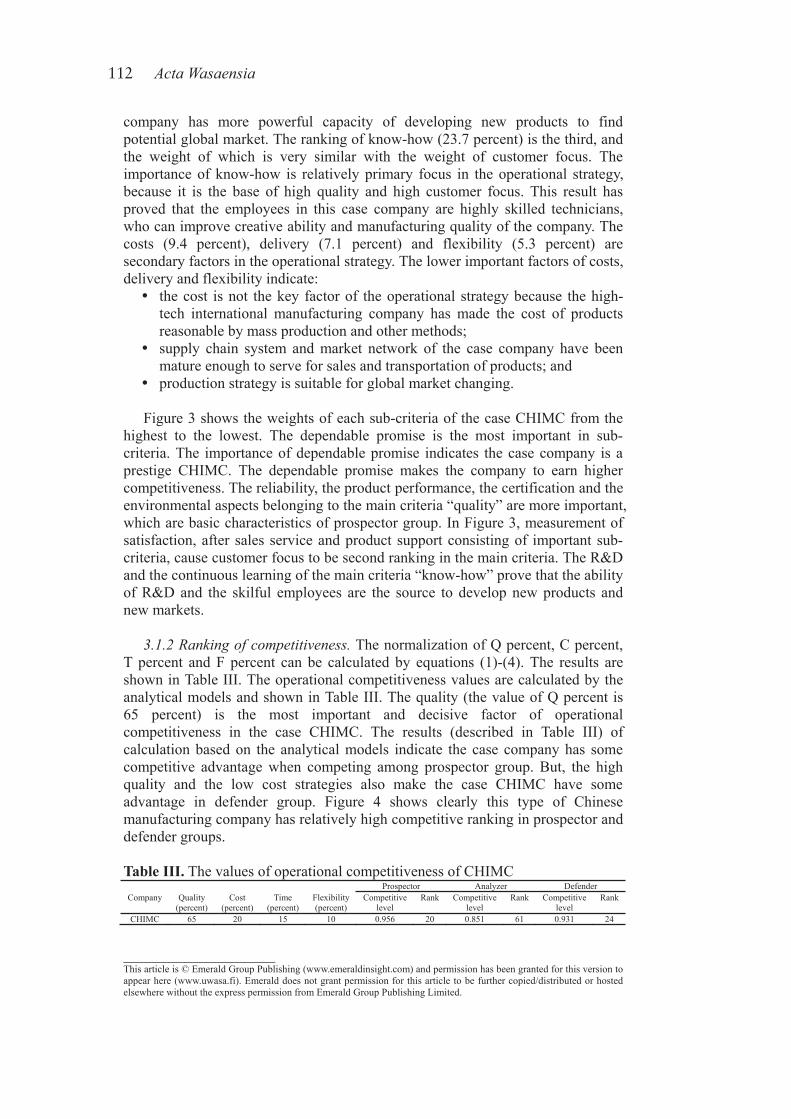
112 ActaWasaensia
____________________This article is © Emerald Group Publishing (www.emeraldinsight.com) and permission has been granted for this version to appear here (www.uwasa.fi). Emerald does not grant permission for this article to be further copied/distributed or hosted elsewhere without the express permission from Emerald Group Publishing Limited.
company has more powerful capacity of developing new products to find potential global market. The ranking of know-how (23.7 percent) is the third, and the weight of which is very similar with the weight of customer focus. The importance of know-how is relatively primary focus in the operational strategy, because it is the base of high quality and high customer focus. This result has proved that the employees in this case company are highly skilled technicians, who can improve creative ability and manufacturing quality of the company. The costs (9.4 percent), delivery (7.1 percent) and flexibility (5.3 percent) are secondary factors in the operational strategy. The lower important factors of costs, delivery and flexibility indicate:
the cost is not the key factor of the operational strategy because the high-tech international manufacturing company has made the cost of products reasonable by mass production and other methods; supply chain system and market network of the case company have been mature enough to serve for sales and transportation of products; and production strategy is suitable for global market changing.
Figure 3 shows the weights of each sub-criteria of the case CHIMC from the highest to the lowest. The dependable promise is the most important in sub-criteria. The importance of dependable promise indicates the case company is a prestige CHIMC. The dependable promise makes the company to earn higher competitiveness. The reliability, the product performance, the certification and the environmental aspects belonging to the main criteria “quality” are more important, which are basic characteristics of prospector group. In Figure 3, measurement of satisfaction, after sales service and product support consisting of important sub-criteria, cause customer focus to be second ranking in the main criteria. The R&D and the continuous learning of the main criteria “know-how” prove that the ability of R&D and the skilful employees are the source to develop new products and new markets.
3.1.2Rankingofcompetitiveness.The normalization of Q percent, C percent, T percent and F percent can be calculated by equations (1)-(4). The results are shown in Table III. The operational competitiveness values are calculated by the analytical models and shown in Table III. The quality (the value of Q percent is 65 percent) is the most important and decisive factor of operational competitiveness in the case CHIMC. The results (described in Table III) of calculation based on the analytical models indicate the case company has some competitive advantage when competing among prospector group. But, the high quality and the low cost strategies also make the case CHIMC have some advantage in defender group. Figure 4 shows clearly this type of Chinese manufacturing company has relatively high competitive ranking in prospector and defender groups.
Table III. The values of operational competitiveness of CHIMC Prospector Analyzer Defender
Company Quality (percent)
Cost(percent)
Time (percent)
Flexibility (percent)
Competitivelevel
Rank Competitivelevel
Rank Competitive level
Rank
CHIMC 65 20 15 10 0.956 20 0.851 61 0.931 24

ActaWasaensia 113
____________________This article is © Emerald Group Publishing (www.emeraldinsight.com) and permission has been granted for this version to appear here (www.uwasa.fi). Emerald does not grant permission for this article to be further copied/distributed or hosted elsewhere without the express permission from Emerald Group Publishing Limited.
Figure 4. Operational competitiveness rankings of CHIMC in prospector and defender groups (Case studies from GMSS database)
3.1.3 Benchmarking of competitiveness. WXL1 is the top company of prospector group and R3_SM is the top company of defender group. From Figure 5, it can be found that the importance of T (time) and F (flexibility) are very similar among these companies. The most influential factor in prospector’s strategy is quality. The benchmarking difference of quality between CHIMC and WXL1 is just 17 percent which proves that CHIMC has somehow advantage in this group. The most important factor in defender strategy is cost. The benchmarking difference of cost between CHIMC and R3_SM is 54 percent, which shows that CHIMC has not much advantage in defender group. The results above imply CHIMC is more competitive in prospector group.
Figure 5. Benchmarking of the operational competitiveness among WXL1, R3_SM and CHIMC
3.1.4 Discussion of CHIMC operational strategy. Some characteristics for CHIMC can be found from analysis results of operational strategy as follows:
CHIMC has strong ability to develop new products and continually search for new markets, because the quality focus of operational strategy is higher. The number of patents has become more and more. CHIMC owns some top high-tech research institutes and has capability to compete with other foreign companies in prospector group.
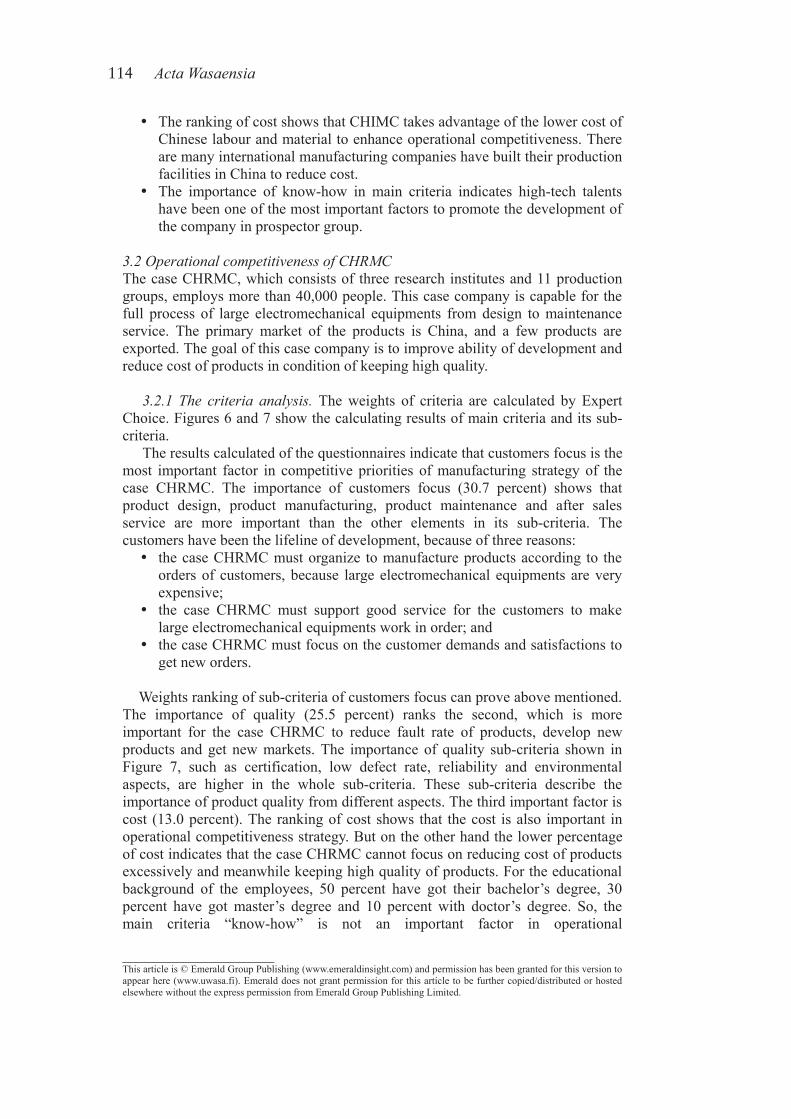
114 ActaWasaensia
____________________This article is © Emerald Group Publishing (www.emeraldinsight.com) and permission has been granted for this version to appear here (www.uwasa.fi). Emerald does not grant permission for this article to be further copied/distributed or hosted elsewhere without the express permission from Emerald Group Publishing Limited.
The ranking of cost shows that CHIMC takes advantage of the lower cost of Chinese labour and material to enhance operational competitiveness. There are many international manufacturing companies have built their production facilities in China to reduce cost. The importance of know-how in main criteria indicates high-tech talents have been one of the most important factors to promote the development of the company in prospector group.
3.2OperationalcompetitivenessofCHRMCThe case CHRMC, which consists of three research institutes and 11 production groups, employs more than 40,000 people. This case company is capable for the full process of large electromechanical equipments from design to maintenance service. The primary market of the products is China, and a few products are exported. The goal of this case company is to improve ability of development and reduce cost of products in condition of keeping high quality.
3.2.1 The criteria analysis. The weights of criteria are calculated by Expert Choice. Figures 6 and 7 show the calculating results of main criteria and its sub-criteria. The results calculated of the questionnaires indicate that customers focus is the most important factor in competitive priorities of manufacturing strategy of the case CHRMC. The importance of customers focus (30.7 percent) shows that product design, product manufacturing, product maintenance and after sales service are more important than the other elements in its sub-criteria. The customers have been the lifeline of development, because of three reasons:
the case CHRMC must organize to manufacture products according to the orders of customers, because large electromechanical equipments are very expensive;the case CHRMC must support good service for the customers to make large electromechanical equipments work in order; and the case CHRMC must focus on the customer demands and satisfactions to get new orders.
Weights ranking of sub-criteria of customers focus can prove above mentioned. The importance of quality (25.5 percent) ranks the second, which is more important for the case CHRMC to reduce fault rate of products, develop new products and get new markets. The importance of quality sub-criteria shown in Figure 7, such as certification, low defect rate, reliability and environmental aspects, are higher in the whole sub-criteria. These sub-criteria describe the importance of product quality from different aspects. The third important factor is cost (13.0 percent). The ranking of cost shows that the cost is also important in operational competitiveness strategy. But on the other hand the lower percentage of cost indicates that the case CHRMC cannot focus on reducing cost of products excessively and meanwhile keeping high quality of products. For the educational background of the employees, 50 percent have got their bachelor’s degree, 30 percent have got master’s degree and 10 percent with doctor’s degree. So, the main criteria “know-how” is not an important factor in operational
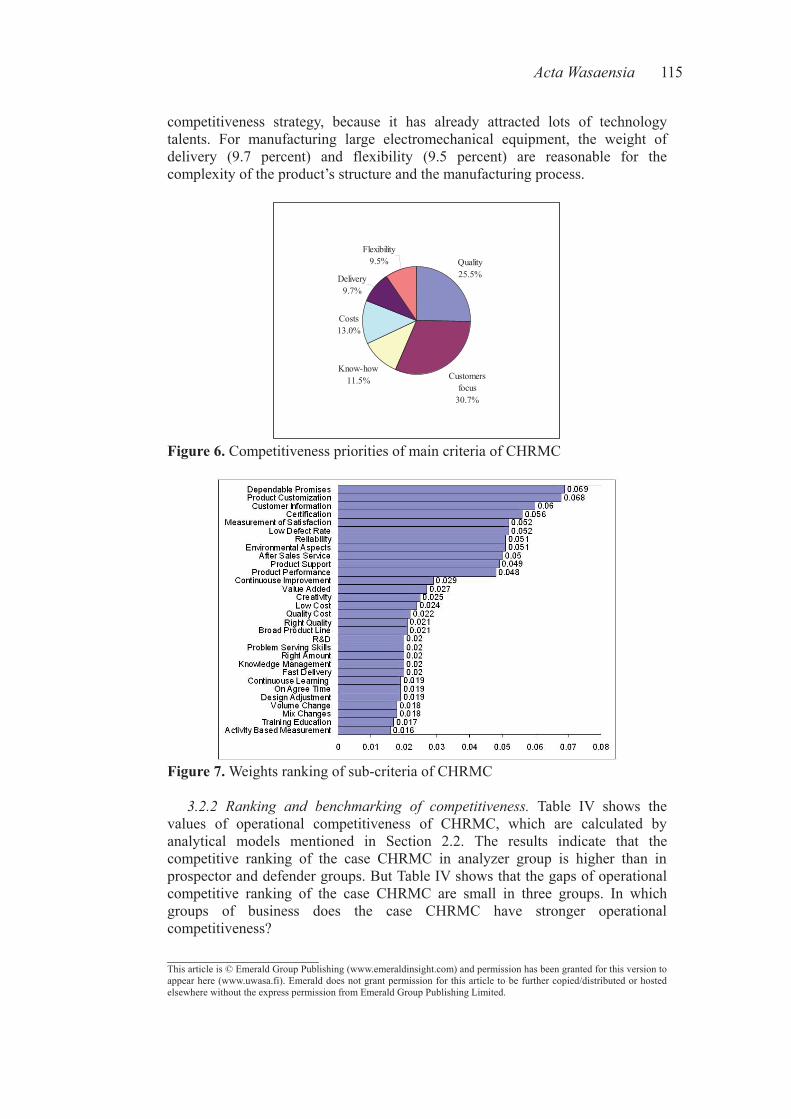
ActaWasaensia 115
____________________This article is © Emerald Group Publishing (www.emeraldinsight.com) and permission has been granted for this version to appear here (www.uwasa.fi). Emerald does not grant permission for this article to be further copied/distributed or hosted elsewhere without the express permission from Emerald Group Publishing Limited.
competitiveness strategy, because it has already attracted lots of technology talents. For manufacturing large electromechanical equipment, the weight of delivery (9.7 percent) and flexibility (9.5 percent) are reasonable for the complexity of the product’s structure and the manufacturing process.
Quality25.5%
Customers focus
30.7%
Know-how11.5%
Costs13.0%
Delivery9.7%
Flexibility9.5%
Figure 6. Competitiveness priorities of main criteria of CHRMC
Figure 7. Weights ranking of sub-criteria of CHRMC
3.2.2 Ranking and benchmarking of competitiveness. Table IV shows the values of operational competitiveness of CHRMC, which are calculated by analytical models mentioned in Section 2.2. The results indicate that the competitive ranking of the case CHRMC in analyzer group is higher than in prospector and defender groups. But Table IV shows that the gaps of operational competitive ranking of the case CHRMC are small in three groups. In which groups of business does the case CHRMC have stronger operational competitiveness?
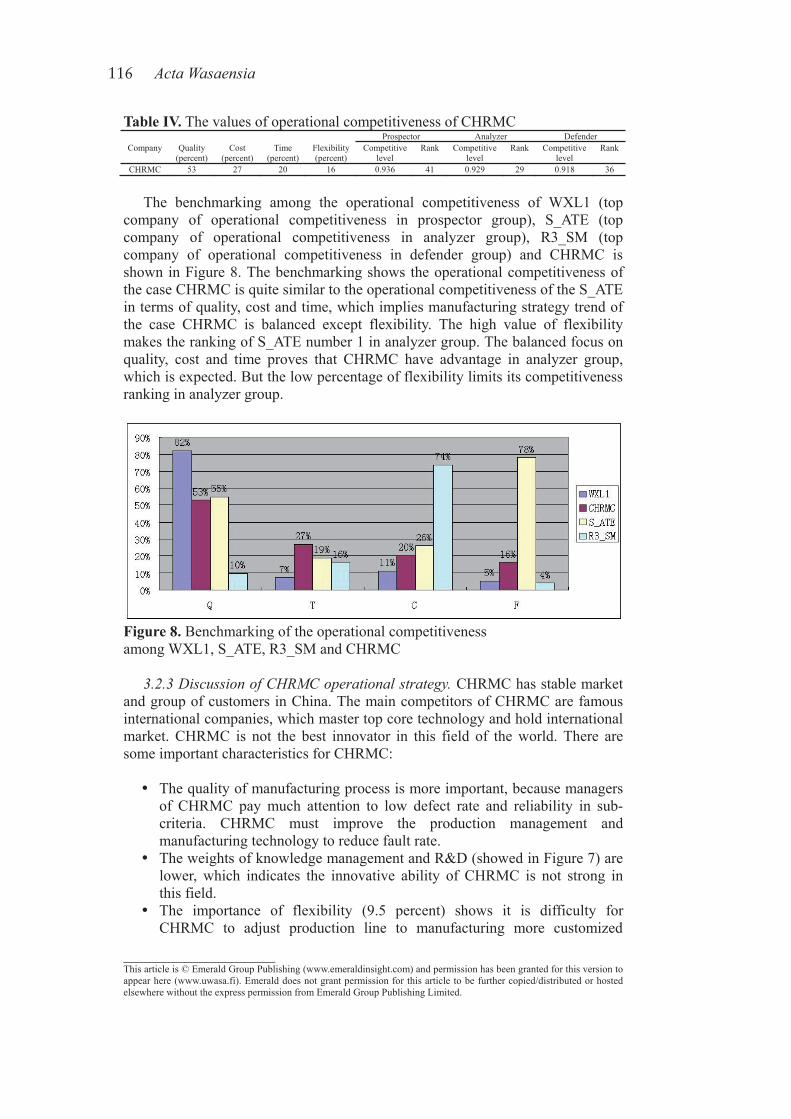
116 ActaWasaensia
____________________This article is © Emerald Group Publishing (www.emeraldinsight.com) and permission has been granted for this version to appear here (www.uwasa.fi). Emerald does not grant permission for this article to be further copied/distributed or hosted elsewhere without the express permission from Emerald Group Publishing Limited.
Table IV. The values of operational competitiveness of CHRMC Prospector Analyzer Defender
Company Quality (percent)
Cost(percent)
Time (percent)
Flexibility (percent)
Competitivelevel
Rank Competitivelevel
Rank Competitive level
Rank
CHRMC 53 27 20 16 0.936 41 0.929 29 0.918 36
The benchmarking among the operational competitiveness of WXL1 (top company of operational competitiveness in prospector group), S_ATE (top company of operational competitiveness in analyzer group), R3_SM (top company of operational competitiveness in defender group) and CHRMC is shown in Figure 8. The benchmarking shows the operational competitiveness of the case CHRMC is quite similar to the operational competitiveness of the S_ATE in terms of quality, cost and time, which implies manufacturing strategy trend of the case CHRMC is balanced except flexibility. The high value of flexibility makes the ranking of S_ATE number 1 in analyzer group. The balanced focus on quality, cost and time proves that CHRMC have advantage in analyzer group, which is expected. But the low percentage of flexibility limits its competitiveness ranking in analyzer group.
Figure 8. Benchmarking of the operational competitiveness among WXL1, S_ATE, R3_SM and CHRMC
3.2.3DiscussionofCHRMCoperationalstrategy.CHRMC has stable market and group of customers in China. The main competitors of CHRMC are famous international companies, which master top core technology and hold international market. CHRMC is not the best innovator in this field of the world. There are some important characteristics for CHRMC:
The quality of manufacturing process is more important, because managers of CHRMC pay much attention to low defect rate and reliability in sub-criteria. CHRMC must improve the production management and manufacturing technology to reduce fault rate. The weights of knowledge management and R&D (showed in Figure 7) are lower, which indicates the innovative ability of CHRMC is not strong in this field. The importance of flexibility (9.5 percent) shows it is difficulty for CHRMC to adjust production line to manufacturing more customized
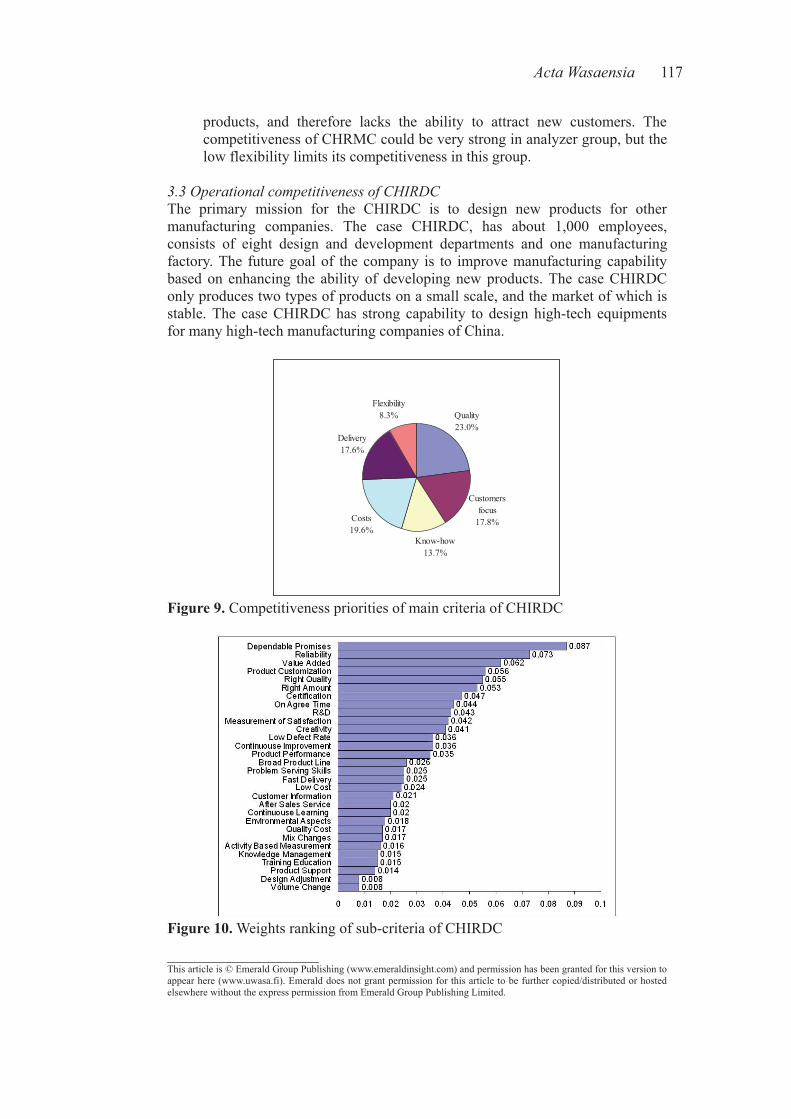
ActaWasaensia 117
____________________This article is © Emerald Group Publishing (www.emeraldinsight.com) and permission has been granted for this version to appear here (www.uwasa.fi). Emerald does not grant permission for this article to be further copied/distributed or hosted elsewhere without the express permission from Emerald Group Publishing Limited.
products, and therefore lacks the ability to attract new customers. The competitiveness of CHRMC could be very strong in analyzer group, but the low flexibility limits its competitiveness in this group.
3.3OperationalcompetitivenessofCHIRDCThe primary mission for the CHIRDC is to design new products for other manufacturing companies. The case CHIRDC, has about 1,000 employees, consists of eight design and development departments and one manufacturing factory. The future goal of the company is to improve manufacturing capability based on enhancing the ability of developing new products. The case CHIRDC only produces two types of products on a small scale, and the market of which is stable. The case CHIRDC has strong capability to design high-tech equipments for many high-tech manufacturing companies of China.
Quality23.0%
Customers focus
17.8%
Know-how13.7%
Costs19.6%
Delivery17.6%
Flexibility8.3%
Figure 9. Competitiveness priorities of main criteria of CHIRDC
Figure 10. Weights ranking of sub-criteria of CHIRDC
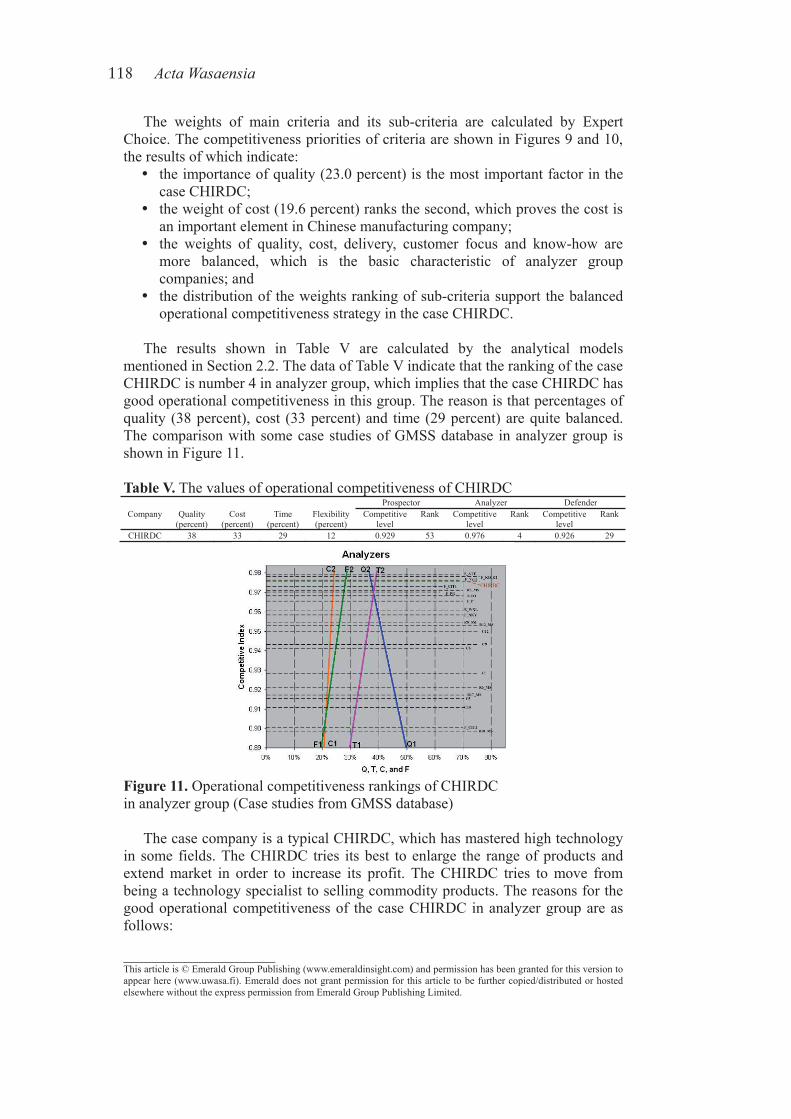
118 ActaWasaensia
____________________This article is © Emerald Group Publishing (www.emeraldinsight.com) and permission has been granted for this version to appear here (www.uwasa.fi). Emerald does not grant permission for this article to be further copied/distributed or hosted elsewhere without the express permission from Emerald Group Publishing Limited.
The weights of main criteria and its sub-criteria are calculated by Expert Choice. The competitiveness priorities of criteria are shown in Figures 9 and 10, the results of which indicate:
the importance of quality (23.0 percent) is the most important factor in the case CHIRDC;the weight of cost (19.6 percent) ranks the second, which proves the cost is an important element in Chinese manufacturing company; the weights of quality, cost, delivery, customer focus and know-how are more balanced, which is the basic characteristic of analyzer group companies; and the distribution of the weights ranking of sub-criteria support the balanced operational competitiveness strategy in the case CHIRDC.
The results shown in Table V are calculated by the analytical models mentioned in Section 2.2. The data of Table V indicate that the ranking of the case CHIRDC is number 4 in analyzer group, which implies that the case CHIRDC has good operational competitiveness in this group. The reason is that percentages of quality (38 percent), cost (33 percent) and time (29 percent) are quite balanced. The comparison with some case studies of GMSS database in analyzer group is shown in Figure 11.
Table V. The values of operational competitiveness of CHIRDC Prospector Analyzer Defender
Company Quality (percent)
Cost(percent)
Time (percent)
Flexibility (percent)
Competitivelevel
Rank Competitivelevel
Rank Competitive level
Rank
CHIRDC 38 33 29 12 0.929 53 0.976 4 0.926 29
Figure 11. Operational competitiveness rankings of CHIRDC in analyzer group (Case studies from GMSS database)
The case company is a typical CHIRDC, which has mastered high technology in some fields. The CHIRDC tries its best to enlarge the range of products and extend market in order to increase its profit. The CHIRDC tries to move from being a technology specialist to selling commodity products. The reasons for the good operational competitiveness of the case CHIRDC in analyzer group are as follows:
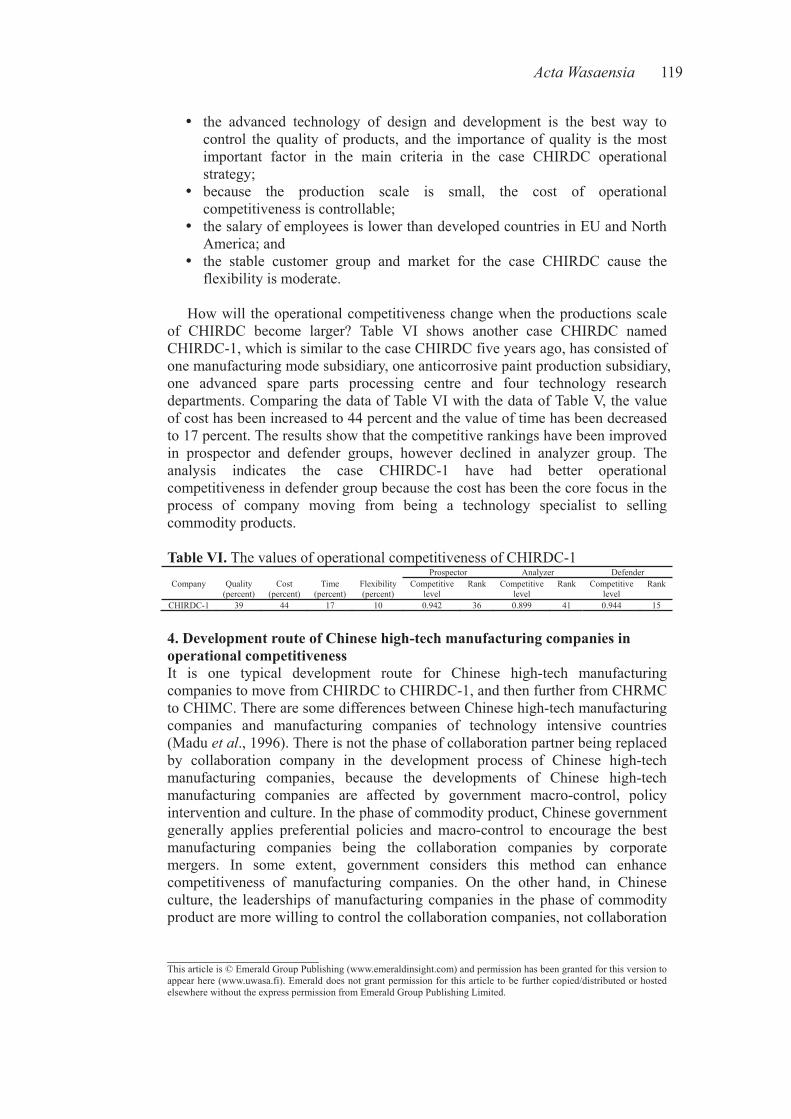
ActaWasaensia 119
____________________This article is © Emerald Group Publishing (www.emeraldinsight.com) and permission has been granted for this version to appear here (www.uwasa.fi). Emerald does not grant permission for this article to be further copied/distributed or hosted elsewhere without the express permission from Emerald Group Publishing Limited.
the advanced technology of design and development is the best way to control the quality of products, and the importance of quality is the most important factor in the main criteria in the case CHIRDC operational strategy;because the production scale is small, the cost of operational competitiveness is controllable; the salary of employees is lower than developed countries in EU and North America; and the stable customer group and market for the case CHIRDC cause the flexibility is moderate.
How will the operational competitiveness change when the productions scale of CHIRDC become larger? Table VI shows another case CHIRDC named CHIRDC-1, which is similar to the case CHIRDC five years ago, has consisted of one manufacturing mode subsidiary, one anticorrosive paint production subsidiary, one advanced spare parts processing centre and four technology research departments. Comparing the data of Table VI with the data of Table V, the value of cost has been increased to 44 percent and the value of time has been decreased to 17 percent. The results show that the competitive rankings have been improved in prospector and defender groups, however declined in analyzer group. The analysis indicates the case CHIRDC-1 have had better operational competitiveness in defender group because the cost has been the core focus in the process of company moving from being a technology specialist to selling commodity products.
Table VI. The values of operational competitiveness of CHIRDC-1 Prospector Analyzer Defender
Company Quality (percent)
Cost(percent)
Time (percent)
Flexibility (percent)
Competitivelevel
Rank Competitivelevel
Rank Competitive level
Rank
CHIRDC-1 39 44 17 10 0.942 36 0.899 41 0.944 15
4. Development route of Chinese high-tech manufacturing companies in operational competitiveness It is one typical development route for Chinese high-tech manufacturing companies to move from CHIRDC to CHIRDC-1, and then further from CHRMC to CHIMC. There are some differences between Chinese high-tech manufacturing companies and manufacturing companies of technology intensive countries (Madu etal., 1996). There is not the phase of collaboration partner being replaced by collaboration company in the development process of Chinese high-tech manufacturing companies, because the developments of Chinese high-tech manufacturing companies are affected by government macro-control, policy intervention and culture. In the phase of commodity product, Chinese government generally applies preferential policies and macro-control to encourage the best manufacturing companies being the collaboration companies by corporate mergers. In some extent, government considers this method can enhance competitiveness of manufacturing companies. On the other hand, in Chinese culture, the leaderships of manufacturing companies in the phase of commodity product are more willing to control the collaboration companies, not collaboration
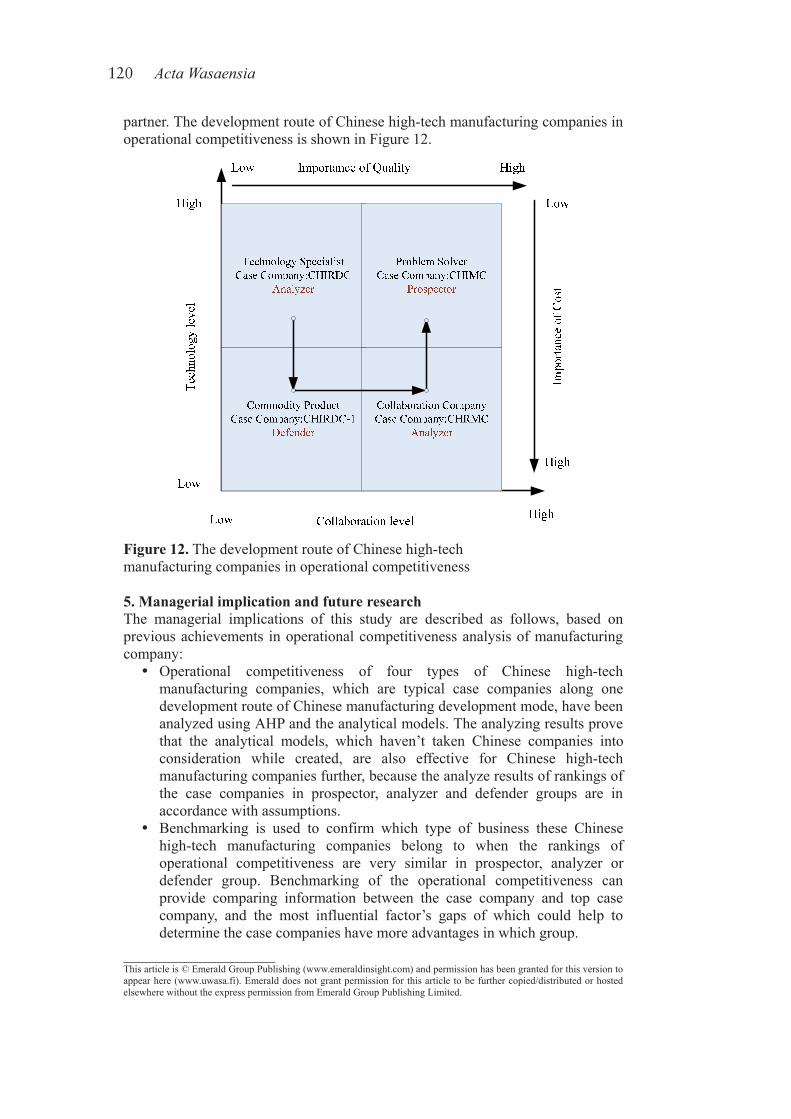
120 ActaWasaensia
____________________This article is © Emerald Group Publishing (www.emeraldinsight.com) and permission has been granted for this version to appear here (www.uwasa.fi). Emerald does not grant permission for this article to be further copied/distributed or hosted elsewhere without the express permission from Emerald Group Publishing Limited.
partner. The development route of Chinese high-tech manufacturing companies in operational competitiveness is shown in Figure 12.
Figure 12. The development route of Chinese high-tech manufacturing companies in operational competitiveness
5. Managerial implication and future research The managerial implications of this study are described as follows, based on previous achievements in operational competitiveness analysis of manufacturing company:
Operational competitiveness of four types of Chinese high-tech manufacturing companies, which are typical case companies along one development route of Chinese manufacturing development mode, have been analyzed using AHP and the analytical models. The analyzing results prove that the analytical models, which haven’t taken Chinese companies into consideration while created, are also effective for Chinese high-tech manufacturing companies further, because the analyze results of rankings of the case companies in prospector, analyzer and defender groups are in accordance with assumptions. Benchmarking is used to confirm which type of business these Chinese high-tech manufacturing companies belong to when the rankings of operational competitiveness are very similar in prospector, analyzer or defender group. Benchmarking of the operational competitiveness can provide comparing information between the case company and top case company, and the most influential factor’s gaps of which could help to determine the case companies have more advantages in which group.
ActaWasaensia 121
____________________This article is © Emerald Group Publishing (www.emeraldinsight.com) and permission has been granted for this version to appear here (www.uwasa.fi). Emerald does not grant permission for this article to be further copied/distributed or hosted elsewhere without the express permission from Emerald Group Publishing Limited.
Through studying four case companies, the theories of Madu etal. (1996) are extended to Chinese business. It is the first attempt to give operational competitiveness strategies for strategic groups for different technology and collaboration levels along one development route of Chinese manufacturing companies. Under the influence of Chinese culture and macro-control, commodity product companies are developed to collaboration companies instead of collaboration partners.
Future research of this paper could be extended into two directions: (1) from comparisons between companies in China and companies in EU
(Takala etal., 2007c), an implication shows that know-how and customer focus are more evenly distributed in China than in EU and such behaviour is believed to be the influence of Chinese government macro-control and policy intervention which makes companies operating in a better way. Such implication will be studied and proved further, and also the question what the Chinese companies must do in order to be strategically competitive will be studied in future research.
(2) The general rules of operational competitiveness can be studied based on typical development routes of technology intensive and labour intensive countries.
6. Conclusion From Chinese case studies presented and analyzed in this paper, it can be seen that the preliminary analytical modes are effective to calculate company’s operational competitiveness in different competitor groups further. The analyzing results show that the benchmarking of operational competitiveness is a good method to verify the company’s business strategy.
Acknowledgement The authors gratefully acknowledge the financial support for this research from the China National “863” High-tech Program (Grant No. 2007AA40701) and the Hover Star project from Northwestern Polytechnical University, China.
References Banuls, V.A. and Salmeron, J.L. (2008), “Foresighting key areas in the
information technology industry”, Technovation, Vol. 28 No. 3, pp. 103-11. Kim, J.S. and Arnold, P. (1996), “Operationalizing manufacturing strategy – an
exploratory study of constructs and linkage”, International Journal ofOperations&ProductionManagement, Vol. 16 No. 12, pp. 45-73.
Liu, Y., Li, Y., Takala, J., Kamdee, T. and Toshev, R. (2008), “Improve company’s operative competitiveness using analytical models”, ProceedingsofIAMOT1569082846,IAMOT2008–17thInternationalConferenceonManagementofTechnology; CreatingandManagingaKnowledgeEconomy, International Association for Management of Technology, Dubai, UAE.
Madu, C.N., Aheto, J., Kuei, C. and Winokur, D. (1996), “Adoption of strategic total quality management philosophies: multi-criteria decision analysis model”, InternationalJournalofQuality&ReliabilityManagement, Vol. 13 No. 3, pp. 57-72.
122 ActaWasaensia
____________________This article is © Emerald Group Publishing (www.emeraldinsight.com) and permission has been granted for this version to appear here (www.uwasa.fi). Emerald does not grant permission for this article to be further copied/distributed or hosted elsewhere without the express permission from Emerald Group Publishing Limited.
Miles, R.E. and Snow, C.C. (1978), Organizational Strategy, Structure, andProcess, McGraw-Hill, New York, NY.
Rangone, A. (1996), “An analytic hierarchy process framework for comparing the overall performance of manufacturing departments”, International JournalofOperations&ProductionManagement, Vol. 16 No. 8, pp. 104-19.
Saaty, T.L. (1980), TheAnalyticHierarchyProcess, McGraw-Hill, New York, NY. Sun, S. (2004), “Assessing joint maintenance shops in the Taiwanese Army using
data envelopment analysis”, JournalofOperationsManagement, Vol. 22 No. 3, pp. 233-45.
Takala, J. (2002), “Analysis and synthesising multifocused manufacturing strategies by analytical hierarchy process”, International Journal ofManufacturingTechnologyandManagement, Vol. 4 No. 5, pp. 345-50.
Takala, J., Kamdee, T., Hirvelä, J. and Kyllonen, S. (2007a), “Analytic calculation of global operative competitiveness”, Proceedings of IAMOT 1569041789,IAMOT 2007 – 16th International Conference on Management ofTechnology; Management of Technology for the Service Economy,International Association for Management of Technology, Miami Beach, USA.
Takala, J., Kamdee, T., Hirvelä, J. and Kyllonen, S. (2007b), “Analytic calculation of global operative competitiveness – case study in Finnish industries”, Proceedings of ISPIM 2007, ID 43, XVIII International Society forProfessional Innovation Management; Innovation for Growth: TheChallengesforEast&West, Warsaw, Poland, 12 pages.
Takala, J., Kamdee, T., Toshev, R., Bojnec, S. and Zgodavova, K. (2007c), “Analysing competitiveness of manufacturing and service operations – global benchmarking of cases from Slovakia and Slovenia”, ProceedingsofMIC 2007 – 8th Management International Conference; Managing GlobalTransitions: Globalisation, Localisation, Regionalisation, Portoroz, 23-25 November.
Wernerfelt, B. (1984), “A resource-based view of the firm”, StrategyManagementJournal, Vol. 5 No. 2, pp. 170-80.
Zahedi, F. (1989), “Quantitative evaluation of micro versus larger database products”, Computers&OperationsResearch, Vol. 16 No. 6, pp. 513-32.
Corresponding author Josu Takala can be contacted at: [email protected]
ActaWasaensia 123
____________________Re-printed with permission of Inderscience Enterprises Ltd.
Appendix C.3
202 Int. J. Innovation and Learning, Vol. 7, No. 2, 2010
Copyright © 2010 Inderscience Enterprises Ltd.
Benchmarking and developing the operational competitiveness of Chinese state-owned manufacturing enterprises in a global context
Shubin Si Department of Industrial Engineering School of Mechatronics Northwestern Polytechnical University 710072 Xi’an, China E-mail: [email protected]
Yang Liu and Josu Takala* Department of Production University of Vaasa P.O. Box 700, 65101 Vaasa, Finland E-mail: [email protected] E-mail: [email protected] *Corresponding author
Shudong Sun Department of Industrial Engineering School of Mechatronics Northwestern Polytechnical University 710072 Xi’an, China E-mail: [email protected]
Abstract: The purpose of this paper is to study the operational competitiveness of Chinese State-Owned Manufacturing Enterprises (CSOMEs) by analysing the case CSOME and comparing it with other global manufacturing companies in a Global Manufacturing Strategies (GMSS) database for developing innovation and learning. Analytical models are used to analyse the operational competitiveness of the case CSOME and its subsidiaries based on the weights of the multicriteria manufacturing strategies. The operational competitiveness development of its subsidiaries are applied to predict the future operational competitiveness of the case CSOME in a global context. The results show that quality is the most important competitive priority of the case CSOME and the case CSOME have some advantages when competing in a prospector group. The ranking and stability of the operational competitiveness of the case CSOME imply that: (1) the top CSOMEs have a strong operational competitiveness in the global context; however, they have some gaps compared to the top manufacturing enterprises in the world and (2) it will take a long time for the top CSOMEs to improve their operational competitiveness because of a huge organisational structure.
124 ActaWasaensia
Benchmarking and developing the operational competitiveness 203
Keywords: operational competitiveness; developing innovation and learning; global manufacturing strategies; GMSS; analytical models; Chinese state-owned manufacturing enterprise; CSOME; analytic hierarchy process; AHP.
Reference to this paper should be made as follows: Si, S., Liu, Y., Takala, J. and Sun, S. (2010) ‘Benchmarking and developing the operational competitiveness of Chinese state-owned manufacturing enterprises in a global context’, Int. J. Innovation and Learning, Vol. 7, No. 2, pp.202–222.
Biographical notes: Shubin Si is an Associate Professor of Industrial Engineering at the School of Mechatronics and the Vice Director of the Institute of Systems Integration and Engineering Management of Northwestern Polytechnical University, China. He received his PhD and Master’s from the same university. His research interests are technology management in operational competitiveness strategies, logistics systems, inventory theories and manufacturing execution systems.
Yang Liu is a part-time Researcher at the Department of Production and a part-time Lecturer at the Department of Computer Science of the University of Vaasa, Finland, and a PhD candidate in Industrial Management and Telecommunication Engineering. He also works as a full-time Senior Lecturer at the Department of Information Technology of the Vaasa University of Applied Sciences, Finland. His research interests include the evaluation and optimisation of global manufacturing strategies and competitiveness priorities, performance analysis and enhancement of short-range wireless communications.
Josu Takala is a Professor of Industrial Management and the Vice Dean of the Faculty of Technology of the University of Vaasa, Finland, and was a Research Professor at the same university during academic year 2006–2007 on comparative research about global manufacturing strategies. He received his MSc (EIEng) from the Tampere University of Technology in 1980, DrTech (EIEng) from the same university in 1988, and business studies from the University of Vaasa. His interest is mainly technology management in the competitive strategies of private and public organisations in manufacturing networks by utilising the generic fields of quality management, (technology) strategy, new product development, production management, logistics and environmental management.
Shudong Sun is a Full Professor at the Department of Industrial Engineering, School of Mechatronics, Northwestern Polytechnical University, China. He received his PhD and Master’s from the Nanjing University of Aeronautics and Astronautics, China. His research interests include production intelligent optimisation and simulation, production management and competitiveness priorities.
1 Introduction
With the development of Chinese industries and their products, the effect of Chinese manufacturing competitiveness is more important than before in the global market. China has become a strong manufacturing country and has influenced the business and
ActaWasaensia 125
Benchmarking and developing the operational competitiveness 203
Keywords: operational competitiveness; developing innovation and learning; global manufacturing strategies; GMSS; analytical models; Chinese state-owned manufacturing enterprise; CSOME; analytic hierarchy process; AHP.
Reference to this paper should be made as follows: Si, S., Liu, Y., Takala, J. and Sun, S. (2010) ‘Benchmarking and developing the operational competitiveness of Chinese state-owned manufacturing enterprises in a global context’, Int. J. Innovation and Learning, Vol. 7, No. 2, pp.202–222.
Biographical notes: Shubin Si is an Associate Professor of Industrial Engineering at the School of Mechatronics and the Vice Director of the Institute of Systems Integration and Engineering Management of Northwestern Polytechnical University, China. He received his PhD and Master’s from the same university. His research interests are technology management in operational competitiveness strategies, logistics systems, inventory theories and manufacturing execution systems.
Yang Liu is a part-time Researcher at the Department of Production and a part-time Lecturer at the Department of Computer Science of the University of Vaasa, Finland, and a PhD candidate in Industrial Management and Telecommunication Engineering. He also works as a full-time Senior Lecturer at the Department of Information Technology of the Vaasa University of Applied Sciences, Finland. His research interests include the evaluation and optimisation of global manufacturing strategies and competitiveness priorities, performance analysis and enhancement of short-range wireless communications.
Josu Takala is a Professor of Industrial Management and the Vice Dean of the Faculty of Technology of the University of Vaasa, Finland, and was a Research Professor at the same university during academic year 2006–2007 on comparative research about global manufacturing strategies. He received his MSc (EIEng) from the Tampere University of Technology in 1980, DrTech (EIEng) from the same university in 1988, and business studies from the University of Vaasa. His interest is mainly technology management in the competitive strategies of private and public organisations in manufacturing networks by utilising the generic fields of quality management, (technology) strategy, new product development, production management, logistics and environmental management.
Shudong Sun is a Full Professor at the Department of Industrial Engineering, School of Mechatronics, Northwestern Polytechnical University, China. He received his PhD and Master’s from the Nanjing University of Aeronautics and Astronautics, China. His research interests include production intelligent optimisation and simulation, production management and competitiveness priorities.
1 Introduction
With the development of Chinese industries and their products, the effect of Chinese manufacturing competitiveness is more important than before in the global market. China has become a strong manufacturing country and has influenced the business and
204 S. Si, Y. Liu, J. Takala and S. Sun
manufacturing strategies of many different areas. Chinese State-Owned Manufacturing Enterprises (CSOMEs) are the most representative type of company in China and the most significant representative of socialism with Chinese characteristics. CSOMEs produce the majority of the Chinese Gross Domestic Product (GDP) (e.g., over 75% in 2007) and they also form the majority of the top 500 companies in China. Although the case study is done for one CSOME, the results are representative since most CSOMEs share very similar characteristics.
Since the 1990s, the Chinese government has been allocating special funds to improve the operational performance of CSOMEs. The funds are used to purchase advanced manufacturing equipment, attract and train talented employees and improve product design quality, the management level and system reformation. These improvements have not only constructed a good technology base of the operational competitiveness of CSOMEs, but also improved their operational competitiveness rapidly. However, the operational competitiveness of CSOMEs is developing slowly and has become restricted because CSOMEs’ business strategies are often influenced by national policies and macro control, which have interfered with making development strategies in the global market. With more and more foreign enterprises establishing their operations in China, CSOMEs face much tougher competition than ever before. Many CSOMEs already show weaker competitiveness compared to their foreign competitors from developed countries in rankings, e.g., bidding in national projects, market share and performance statistics. The gap in competitiveness between CSOMEs and their foreign competitors obviously exists. According to Takala et al. (2007b), the operational competitiveness of a company can be optimised by adjusting its manufacturing strategies. CSOMEs must adjust their strategies to enhance their competitiveness in both the national and global market. The benchmarking of the competitiveness of CSOMEs in this study can effectively discover the existing gap compared to the top competitive market leaders in the world and, therefore, further develop the competitiveness of CSOMEs.
The future competitiveness of manufacturing operations under dynamic and complex business situations relies on forward-thinking strategies. Companies should typically utilise multifocused manufacturing strategies in a holistic way based on their business plans and goals. Competitive priorities belong to the first phase of manufacturing strategies, which acts as the bridge between the business strategy and the manufacturing objectives (Kim and Arnold, 1996). Competitive priorities are the crucial decisive variables for managers and decision makers to manage global manufacturing operations. It indicates a strategy emphasising the development of certain manufacturing capabilities that may improve a plant’s market position. Competitive priorities can answer three questions:
1 Which category of business do the companies belong to, how competitive are they and which category would give them the best competitiveness ranking through the analysis of the competitive priorities of their manufacturing strategies?
2 What should be developed in the company according to comparisons in the global context?
3 Can business strategies be supported and can the manufacturing objective be achieved?
126 ActaWasaensia
Benchmarking and developing the operational competitiveness 205
In this study, the theoretical framework of reference starts from the resource-based view of a case firm, especially the human resource-based strategy of an organisation (Wernerfelt, 1984). This framework goes on to justify multifocused manufacturing strategies (Takala, 2002). The important achievements have been studied to support and improve the framework mentioned above. Madu et al. (1996) presented the concept of strategic groups for different technologies and collaboration levels. This theory was improved by Takala et al. (2007a) to describe the typical development route of global industries. This paper has given the typical development route, which is from being a technology specialist to selling commodity products; with increases in the collaboration level, it goes further from that to a collaboration partner and finally, to a problem solver in technology-intensive countries. Miles and Snow (1978) defined four company groups: prospector, analyser, defender and reactor. According to Miles and Snow (1978), contrary to the other three strategies (prospector, analyser and defender), the reactor strategy does not lead to a consistent and stable organisation. Hence, when an organisation is in this situation, it is advised to change to one of the other three strategies. Based on the literature, Takala et al. (2007b) promoted analytical models to calculate the competitiveness rankings in each group according to a company’s multicriteria weights for Q(Quality), C(Cost), T(Time) and F(Flexibility). The analytical models were developed to gain insight into the influences and sensitivities of various parameters and processes on the alteration of strategies by Takala et al. (2007c). Liu et al. (2008) used analytical models to analyse the operative competitiveness of one Chinese case company that manufactures Computer Numerical Controlled (CNC) machines. Phusavat and Kanchana (2008) examined and described the competitive priorities of service providers in Thailand based on surveys that consisted of six criteria. The results of the analysis gave some good suggestions regarding operational competitiveness to the Federation of Thai Industries.
In previous studies and concerning the related literature, Takala et al. (2007b) introduced unique analytical models to evaluate the competitiveness of manufacturing companies worldwide. In China, the most dynamic market, Liu et al. (2008) applied such analytical models to analyse the operational competitiveness of a private mid-sized manufacturing company in China. This paper continues such an analysis with deeper insights into the operational competitiveness of CSOMEs in a global context to suggest how to improve operational strategies to be more competitive.
The structure of this paper is as follows: Section 2 introduces some methodologies. Section 3 analyses the operational competitiveness of the case CSOME and its subsidiaries. Section 4 studies the future operational competitiveness of the CSOME. Section 5 discusses some of the operational competitiveness characteristics of CSOMEs. Section 6 draws some conclusions.
1.1 Concepts of Chinese state-owned manufacturing enterprises
CSOMEs are state holding and manufacturing companies that form an important part of national industry. Chinese large and medium-sized state-owned manufacturing enterprises, which comprise 70% of the top 500 Chinese companies, are the pillars of the national economy. However, the percentage of Chinese large and medium-sized state-owned manufacturing enterprises occupies only 3% of the global top 500 companies. It indicates that CSOMEs are improving, but their competitiveness is not at the top in the global context.
ActaWasaensia 127
206 S. Si, Y. Liu, J. Takala and S. Sun
1.2 Concepts of GMSS database
The Global Manufacturing Strategies (GMSS) database, which consists of the operational competitiveness data of 100 case studies, was created to study manufacturing strategies. ‘Global’ means that the GMSS studies have been done by constantly comparing, benchmarking and learning from 100 industrial cases, including traditional and service products located in more than 10 countries in all continents. From the GMSS studies, we offer a method that has been validated and verified with such extensive empirical studies and benchmarking information to any company in the world. GMSS is mainly a database containing manufacturing strategies’ diversities and the competitiveness profiles of companies from different countries or the companies that operate globally. All the case companies in this database share some things in common, one of which is that they are high-performance companies.
2 Research methodologies
2.1 Analytic hierarchy process method
The Analytic Hierarchy Process (AHP) method (Saaty, 1980) is a multi-attribute decision instrument that allows considering quantitative and qualitative measures and making tradeoffs. The AHP is used in this research to deal with the empirical part, which includes analysing questionnaires and calculating the weights of the main criteria and subcriteria. The questionnaires are answered by the interviewees, who are normally experts in the top management or specifically in charge of one area and they really know the operations and strategies of the company. All the answers with an inconsistency ratio below the limit are accepted and, therefore, ensure internal validity. The AHP’s goal is to integrate different measures into a single overall score for ranking decisive alternatives with the pair-wise comparisons of chosen attributes. The AHP-based instruments (forms and questionnaires) has been used for more than 20 years in the successful analysis of case companies and have been proven to be reliable. Some applications of AHP were shown in Zahedi (1989), Rangone (1996) and Sun (2004). The procedures to use the AHP are detailed below.
The first step is to establish the model of hierarchy structure for operational competitiveness. This study structures the hierarchy model of competitiveness priorities of the manufacturing strategy in Figure 1 (Takala et al., 2007a). The main criteria consist of know-how, flexibility, delivery, quality, customer focus and costs. The main criteria are typical items used in evaluating the competitiveness priorities in multifocused manufacturing strategies. They are formed based on typical case studies and the instruments used in interviews. The subcriteria involve 30 items such as knowledge management, fast delivery, low defect rate, low cost, etc.
The second step is the comparison of the alternatives and the criteria. They are compared in pairs with respect to each element of the next higher level.
The last step is connecting the comparisons to get the priorities of the alternatives with respect to each criterion and the weights of each criterion with respect to the goal. The local priorities are then multiplied by the weights of the respective criteria. The results are summed up to get the overall priority of each alternative.
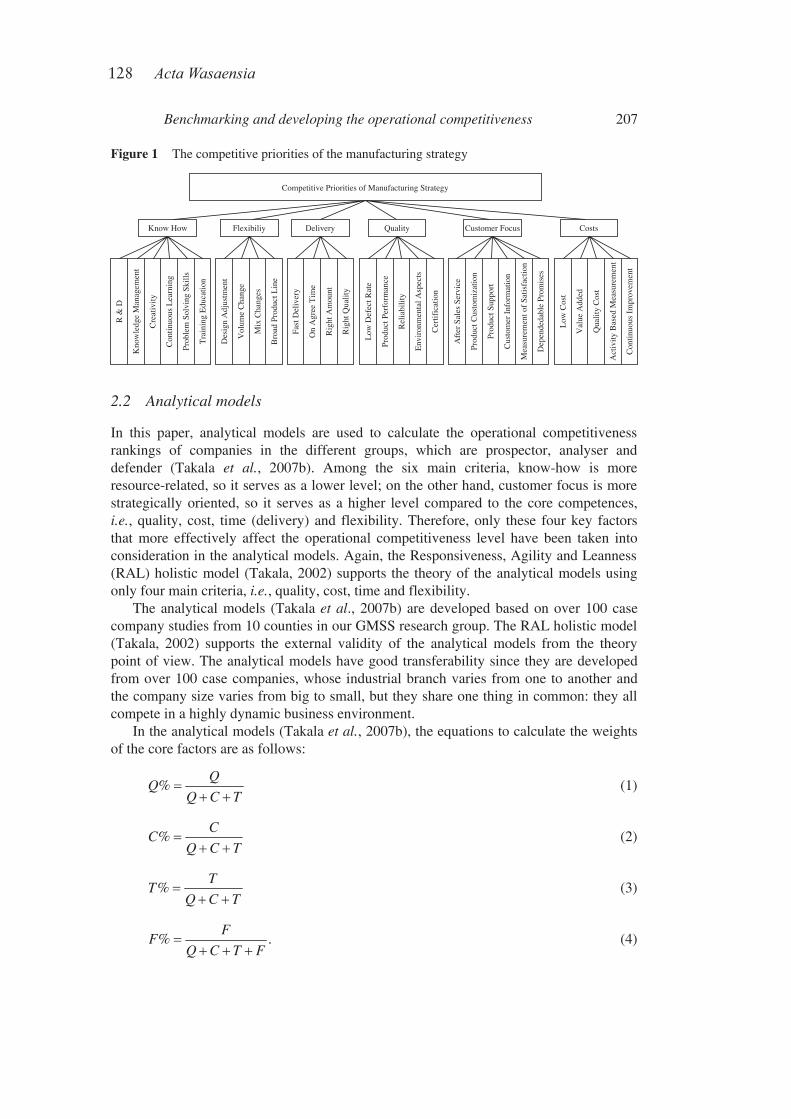
128 ActaWasaensia
Benchmarking and developing the operational competitiveness 207
Figure 1 The competitive priorities of the manufacturing strategy
2.2 Analytical models
In this paper, analytical models are used to calculate the operational competitiveness rankings of companies in the different groups, which are prospector, analyser and defender (Takala et al., 2007b). Among the six main criteria, know-how is more resource-related, so it serves as a lower level; on the other hand, customer focus is more strategically oriented, so it serves as a higher level compared to the core competences, i.e., quality, cost, time (delivery) and flexibility. Therefore, only these four key factors that more effectively affect the operational competitiveness level have been taken into consideration in the analytical models. Again, the Responsiveness, Agility and Leanness (RAL) holistic model (Takala, 2002) supports the theory of the analytical models using only four main criteria, i.e., quality, cost, time and flexibility.
The analytical models (Takala et al., 2007b) are developed based on over 100 case company studies from 10 counties in our GMSS research group. The RAL holistic model (Takala, 2002) supports the external validity of the analytical models from the theory point of view. The analytical models have good transferability since they are developed from over 100 case companies, whose industrial branch varies from one to another and the company size varies from big to small, but they share one thing in common: they all compete in a highly dynamic business environment.
In the analytical models (Takala et al., 2007b), the equations to calculate the weights of the core factors are as follows:
%Q
QQ C T
(1)
%C
CQ C T
(2)
%T
TQ C T
(3)
% .F
FQ C T F
(4)
Competitive Priorities of Manufacturing Strategy
Know How
Cre
ativ
ity
Con
tinuo
us L
earn
ing
Prob
lem
Sol
ving
Ski
lls
Trai
ning
Edu
catio
n
Des
ign
Adj
ustm
ent
Vol
ume
Cha
nge
Mix
Cha
nges
Bro
ad P
rodu
ct L
ine
Fast
Del
iver
y
On
Agr
ee T
ime
Rig
ht A
mou
nt
Rig
ht Q
ualit
y
Low
Def
ect R
ate
Prod
uct P
erfo
rman
ce
Rel
iabi
lity
Envi
ronm
enta
l Asp
ects
Cer
tific
atio
n
Afte
r Sal
es S
ervi
ce
Prod
uct C
usto
miz
atio
n
Prod
uct S
uppo
rt
Cus
tom
er In
form
atio
n
Mea
sure
men
t of S
atis
fact
ion
Dep
ende
dabl
e Pr
omis
es
Low
Cos
t
Val
ue A
dded
Qua
lity
Cos
t
Act
ivity
Bas
ed M
easu
rem
ent
Con
tinuo
us Im
prov
emen
t
Kno
wle
dge
Man
agem
ent
R &
D
Flexibiliy Delivery Quality Customer Focus Costs
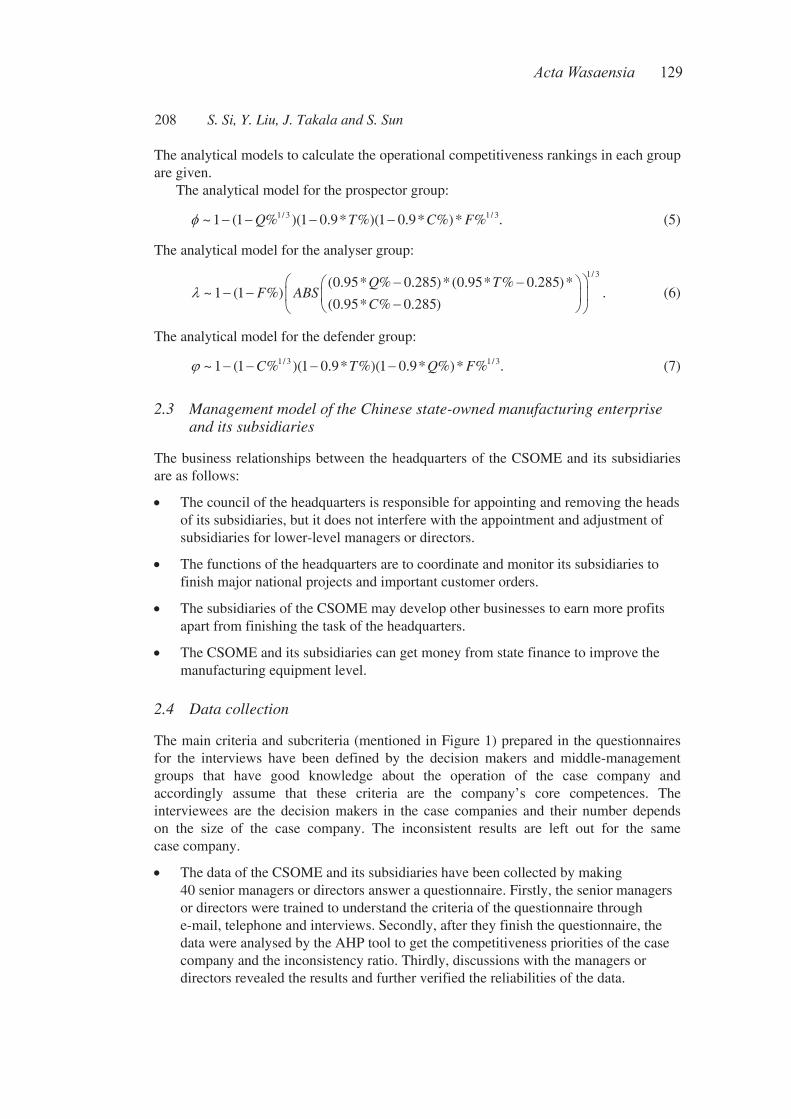
ActaWasaensia 129
208 S. Si, Y. Liu, J. Takala and S. Sun
The analytical models to calculate the operational competitiveness rankings in each group are given.
The analytical model for the prospector group:
1/ 3 1/ 3~ 1 (1 % )(1 0.9* %)(1 0.9* %)* % .Q T C F (5)
The analytical model for the analyser group:
1/ 3(0.95* % 0.285)*(0.95* % 0.285)*
~ 1 (1 %) .(0.95* % 0.285)
Q TF ABS
C (6)
The analytical model for the defender group:
1/ 3 1 / 3~ 1 (1 % )(1 0.9* %)(1 0.9* %)* % .C T Q F (7)
2.3 Management model of the Chinese state-owned manufacturing enterprise and its subsidiaries
The business relationships between the headquarters of the CSOME and its subsidiaries are as follows:
The council of the headquarters is responsible for appointing and removing the heads of its subsidiaries, but it does not interfere with the appointment and adjustment of subsidiaries for lower-level managers or directors.
The functions of the headquarters are to coordinate and monitor its subsidiaries to finish major national projects and important customer orders.
The subsidiaries of the CSOME may develop other businesses to earn more profits apart from finishing the task of the headquarters.
The CSOME and its subsidiaries can get money from state finance to improve the manufacturing equipment level.
2.4 Data collection
The main criteria and subcriteria (mentioned in Figure 1) prepared in the questionnaires for the interviews have been defined by the decision makers and middle-management groups that have good knowledge about the operation of the case company and accordingly assume that these criteria are the company’s core competences. The interviewees are the decision makers in the case companies and their number depends on the size of the case company. The inconsistent results are left out for the same case company.
The data of the CSOME and its subsidiaries have been collected by making 40 senior managers or directors answer a questionnaire. Firstly, the senior managers or directors were trained to understand the criteria of the questionnaire through e-mail, telephone and interviews. Secondly, after they finish the questionnaire, the data were analysed by the AHP tool to get the competitiveness priorities of the case company and the inconsistency ratio. Thirdly, discussions with the managers or directors revealed the results and further verified the reliabilities of the data.
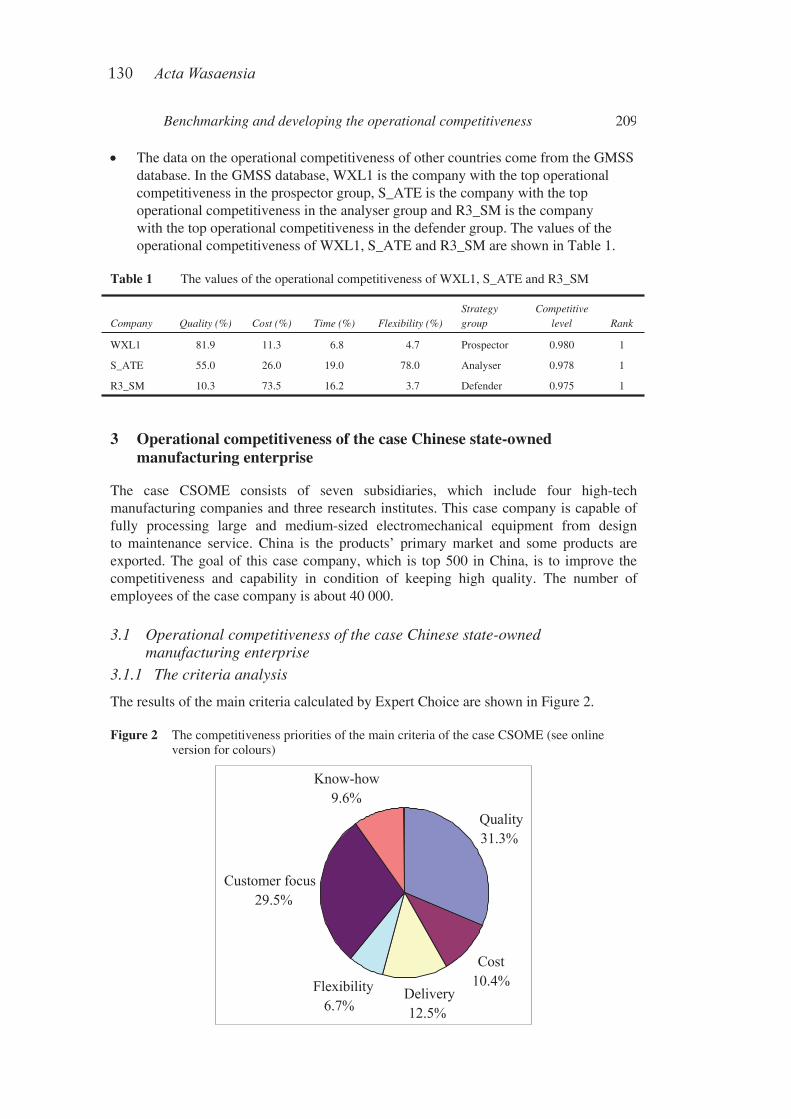
130 ActaWasaensia
Benchmarking and developing the operational competitiveness 209
The data on the operational competitiveness of other countries come from the GMSS database. In the GMSS database, WXL1 is the company with the top operational competitiveness in the prospector group, S_ATE is the company with the top operational competitiveness in the analyser group and R3_SM is the company with the top operational competitiveness in the defender group. The values of the operational competitiveness of WXL1, S_ATE and R3_SM are shown in Table 1.
Table 1 The values of the operational competitiveness of WXL1, S_ATE and R3_SM
Company Quality (%) Cost (%) Time (%) Flexibility (%) Strategy group
Competitive level Rank
WXL1 81.9 11.3 6.8 4.7 Prospector 0.980 1
S_ATE 55.0 26.0 19.0 78.0 Analyser 0.978 1
R3_SM 10.3 73.5 16.2 3.7 Defender 0.975 1
3 Operational competitiveness of the case Chinese state-owned manufacturing enterprise
The case CSOME consists of seven subsidiaries, which include four high-tech manufacturing companies and three research institutes. This case company is capable of fully processing large and medium-sized electromechanical equipment from design to maintenance service. China is the products’ primary market and some products are exported. The goal of this case company, which is top 500 in China, is to improve the competitiveness and capability in condition of keeping high quality. The number of employees of the case company is about 40 000.
3.1 Operational competitiveness of the case Chinese state-owned manufacturing enterprise
3.1.1 The criteria analysis
The results of the main criteria calculated by Expert Choice are shown in Figure 2.
Figure 2 The competitiveness priorities of the main criteria of the case CSOME (see online version for colours)
Quality31.3%
Cost10.4%
Delivery12.5%
Flexibility6.7%
Customer focus29.5%
Know-how9.6%
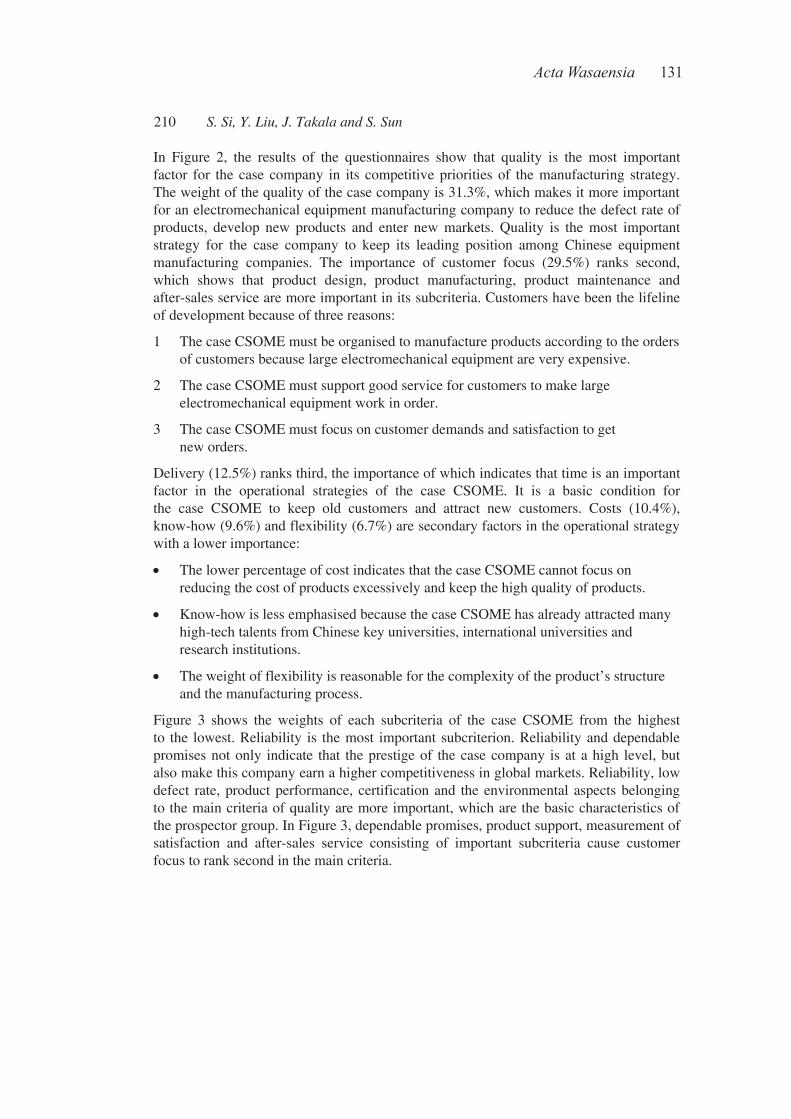
ActaWasaensia 131
210 S. Si, Y. Liu, J. Takala and S. Sun
In Figure 2, the results of the questionnaires show that quality is the most important factor for the case company in its competitive priorities of the manufacturing strategy. The weight of the quality of the case company is 31.3%, which makes it more important for an electromechanical equipment manufacturing company to reduce the defect rate of products, develop new products and enter new markets. Quality is the most important strategy for the case company to keep its leading position among Chinese equipment manufacturing companies. The importance of customer focus (29.5%) ranks second, which shows that product design, product manufacturing, product maintenance and after-sales service are more important in its subcriteria. Customers have been the lifeline of development because of three reasons:
1 The case CSOME must be organised to manufacture products according to the orders of customers because large electromechanical equipment are very expensive.
2 The case CSOME must support good service for customers to make large electromechanical equipment work in order.
3 The case CSOME must focus on customer demands and satisfaction to get new orders.
Delivery (12.5%) ranks third, the importance of which indicates that time is an important factor in the operational strategies of the case CSOME. It is a basic condition for the case CSOME to keep old customers and attract new customers. Costs (10.4%), know-how (9.6%) and flexibility (6.7%) are secondary factors in the operational strategy with a lower importance:
The lower percentage of cost indicates that the case CSOME cannot focus on reducing the cost of products excessively and keep the high quality of products.
Know-how is less emphasised because the case CSOME has already attracted many high-tech talents from Chinese key universities, international universities and research institutions.
The weight of flexibility is reasonable for the complexity of the product’s structure and the manufacturing process.
Figure 3 shows the weights of each subcriteria of the case CSOME from the highest to the lowest. Reliability is the most important subcriterion. Reliability and dependable promises not only indicate that the prestige of the case company is at a high level, but also make this company earn a higher competitiveness in global markets. Reliability, low defect rate, product performance, certification and the environmental aspects belonging to the main criteria of quality are more important, which are the basic characteristics of the prospector group. In Figure 3, dependable promises, product support, measurement of satisfaction and after-sales service consisting of important subcriteria cause customer focus to rank second in the main criteria.
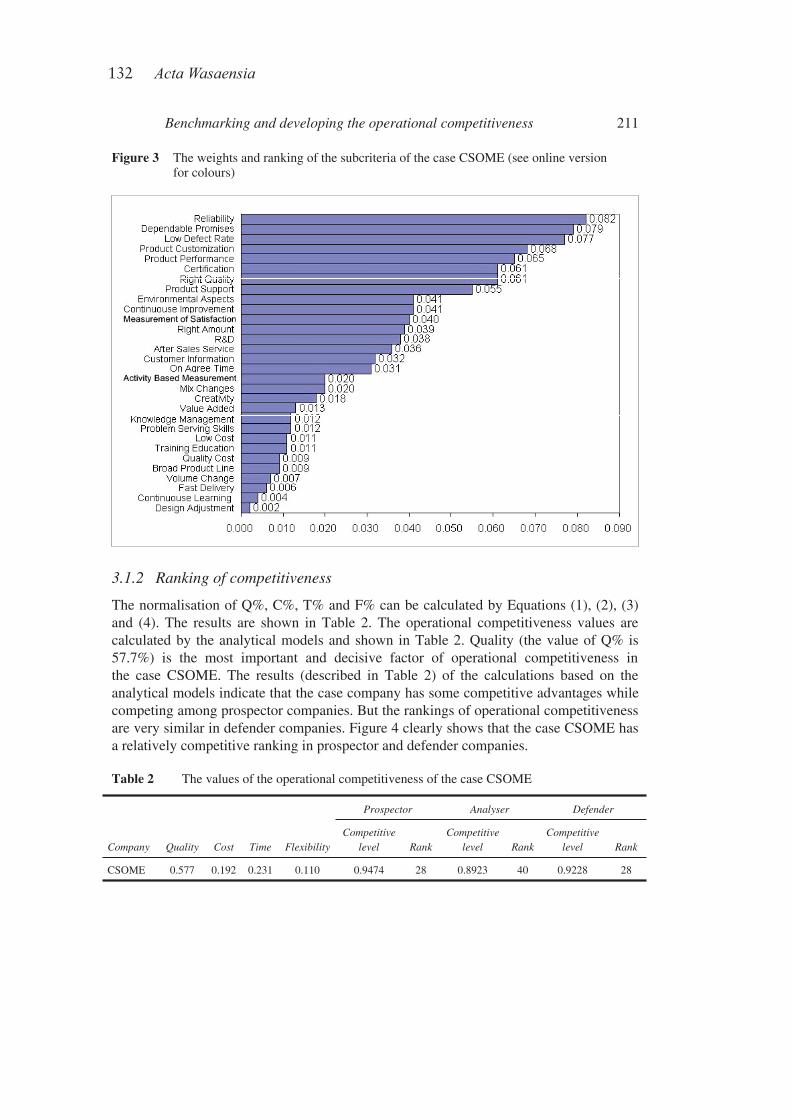
132 ActaWasaensia
Benchmarking and developing the operational competitiveness 211
Figure 3 The weights and ranking of the subcriteria of the case CSOME (see online version for colours)
3.1.2 Ranking of competitiveness
The normalisation of Q%, C%, T% and F% can be calculated by Equations (1), (2), (3) and (4). The results are shown in Table 2. The operational competitiveness values are calculated by the analytical models and shown in Table 2. Quality (the value of Q% is 57.7%) is the most important and decisive factor of operational competitiveness in the case CSOME. The results (described in Table 2) of the calculations based on the analytical models indicate that the case company has some competitive advantages while competing among prospector companies. But the rankings of operational competitiveness are very similar in defender companies. Figure 4 clearly shows that the case CSOME has a relatively competitive ranking in prospector and defender companies.
Table 2 The values of the operational competitiveness of the case CSOME
Prospector Analyser Defender
Company Quality Cost Time Flexibility Competitive
level Rank Competitive
level Rank Competitive
level Rank
CSOME 0.577 0.192 0.231 0.110 0.9474 28 0.8923 40 0.9228 28
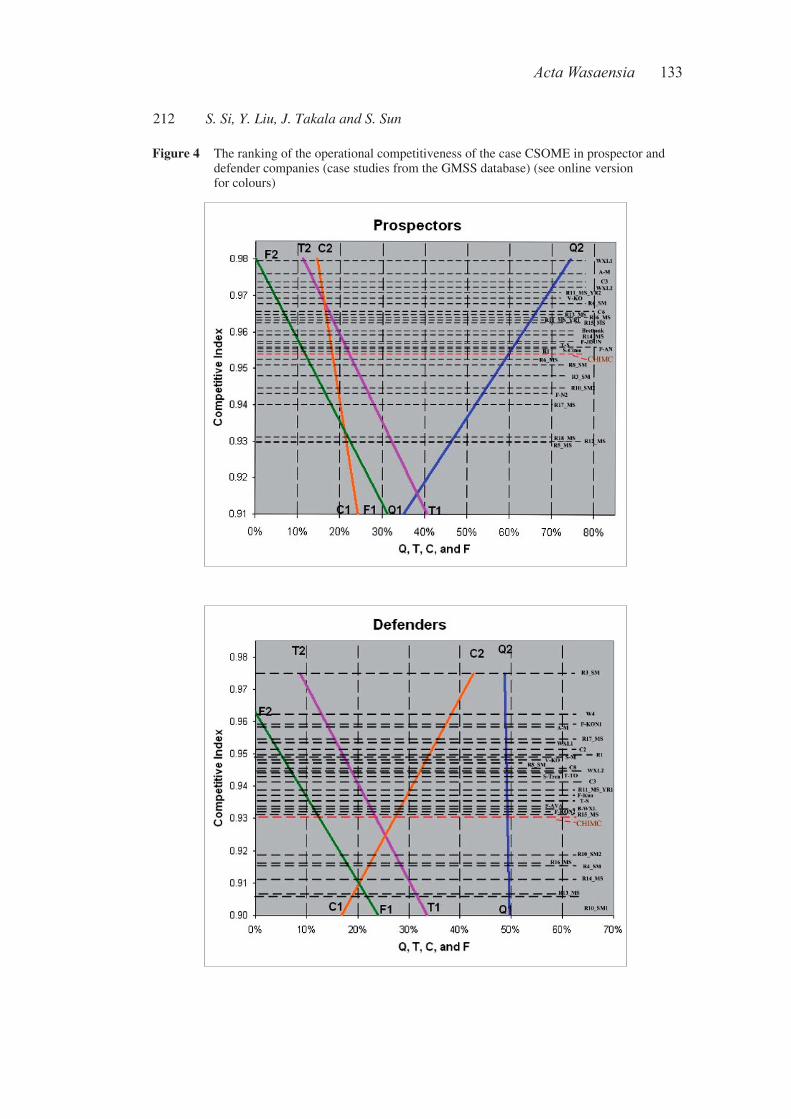
ActaWasaensia 133
212 S. Si, Y. Liu, J. Takala and S. Sun
Figure 4 The ranking of the operational competitiveness of the case CSOME in prospector and defender companies (case studies from the GMSS database) (see online version for colours)
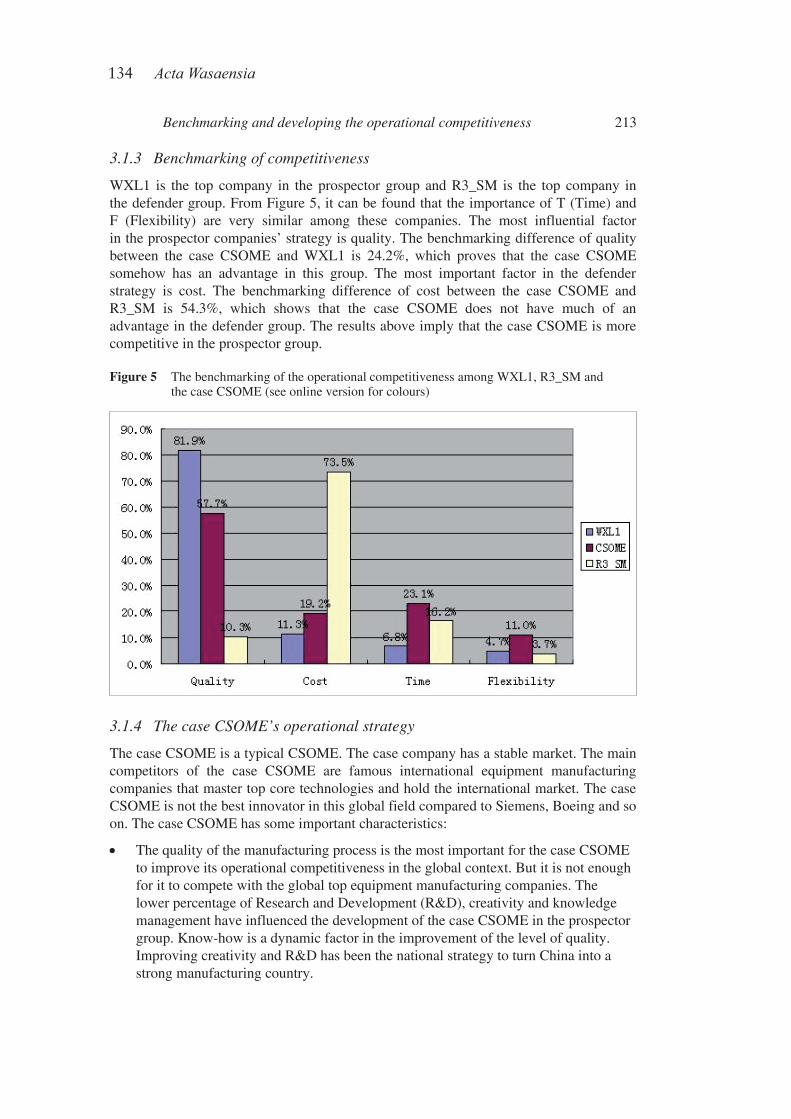
134 ActaWasaensia
Benchmarking and developing the operational competitiveness 213
3.1.3 Benchmarking of competitiveness
WXL1 is the top company in the prospector group and R3_SM is the top company in the defender group. From Figure 5, it can be found that the importance of T (Time) and F (Flexibility) are very similar among these companies. The most influential factor in the prospector companies’ strategy is quality. The benchmarking difference of quality between the case CSOME and WXL1 is 24.2%, which proves that the case CSOME somehow has an advantage in this group. The most important factor in the defender strategy is cost. The benchmarking difference of cost between the case CSOME and R3_SM is 54.3%, which shows that the case CSOME does not have much of an advantage in the defender group. The results above imply that the case CSOME is more competitive in the prospector group.
Figure 5 The benchmarking of the operational competitiveness among WXL1, R3_SM and the case CSOME (see online version for colours)
3.1.4 The case CSOME’s operational strategy
The case CSOME is a typical CSOME. The case company has a stable market. The main competitors of the case CSOME are famous international equipment manufacturing companies that master top core technologies and hold the international market. The case CSOME is not the best innovator in this global field compared to Siemens, Boeing and so on. The case CSOME has some important characteristics:
The quality of the manufacturing process is the most important for the case CSOME to improve its operational competitiveness in the global context. But it is not enough for it to compete with the global top equipment manufacturing companies. The lower percentage of Research and Development (R&D), creativity and knowledge management have influenced the development of the case CSOME in the prospector group. Know-how is a dynamic factor in the improvement of the level of quality. Improving creativity and R&D has been the national strategy to turn China into a strong manufacturing country.
ActaWasaensia 135
214 S. Si, Y. Liu, J. Takala and S. Sun
The value of flexibility is very low in operational strategies. Complicated large and medium-sized electromechanical equipment are the main critical factor affecting the flexibility of the case CSOME. Many famous equipment companies have adopted many effective methods to improve their flexibility, such as outsourcing, the agile manufacturing mode and so on. Boeing successfully applied outsourcing; the spare parts and components of Boeing products have been outsourced to different manufacturing companies, which enhanced its flexibility level and reduced its manufacturing cost.
A large number of employees will increase the burden of the enterprise, which include pensions, medical insurance costs and so on.
3.1.5 Operational competitiveness of the subsidiaries of the case CSOME
The subsidiaries of the case CSOME can be categorised into three types, which include CSOME-1, CSOME-2 and CSOME-3, according to the weights of the research and manufacturing activities. The same typical subsidiaries have a similar operational competitiveness:
1 CSOME-1 consists of 10 research departments and 21 manufacturing factories. There are about 6000 employees. The main business includes designing and manufacturing spare parts and assembling equipment. The technology of CSOME-1 leads the international level. The goals of this company are to improve its equipment design and manufacturing technology and enter new markets.
2 CSOME-2 is a bigger manufacturing company than CSOME-1. It consists of 5 research departments and 40 manufacturing factories. The number of employees go beyond 10 000. Its design and manufacturing technology is at an advanced global level. The aim of the case company is to improve its equipment manufacturing quality and reliability. The case CSOME has three companies which are very similar to CSOME-2 and manufacture different equipment.
3 CSOME-3 is one of the typical research institutes in the case CSOME. The primary mission is to research professional technologies for equipment manufacturing and design subsidiaries. The business strategy is to extend the manufacturing ability to directly earn profits from the market. This typical research institute generally holds one or two factories to manufacture measuring equipment, special spare parts and so on. Employees of this typical research institute are about 1200. There are three subsidiaries which are very similar to CSOME-3.
Table 3 shows the values of the competitiveness priorities of the case subsidiaries, which are calculated by the AHP method according to the questionnaire. The results of the questionnaire show that quality is the most important factor for CSOME-1 and CSOME-3. The weight of the quality of CSOME-1 and CSOME-3 are 35.4% and 49.1%, which are higher than those for the other criteria. These results imply that these typical case companies have some advantages in the prospector group. In Table 3, the values of the competitiveness priorities of CSOME-2 indicate that the weights of the main criteria are much evenly distributed, which imply that this case company belongs to the analyser group.
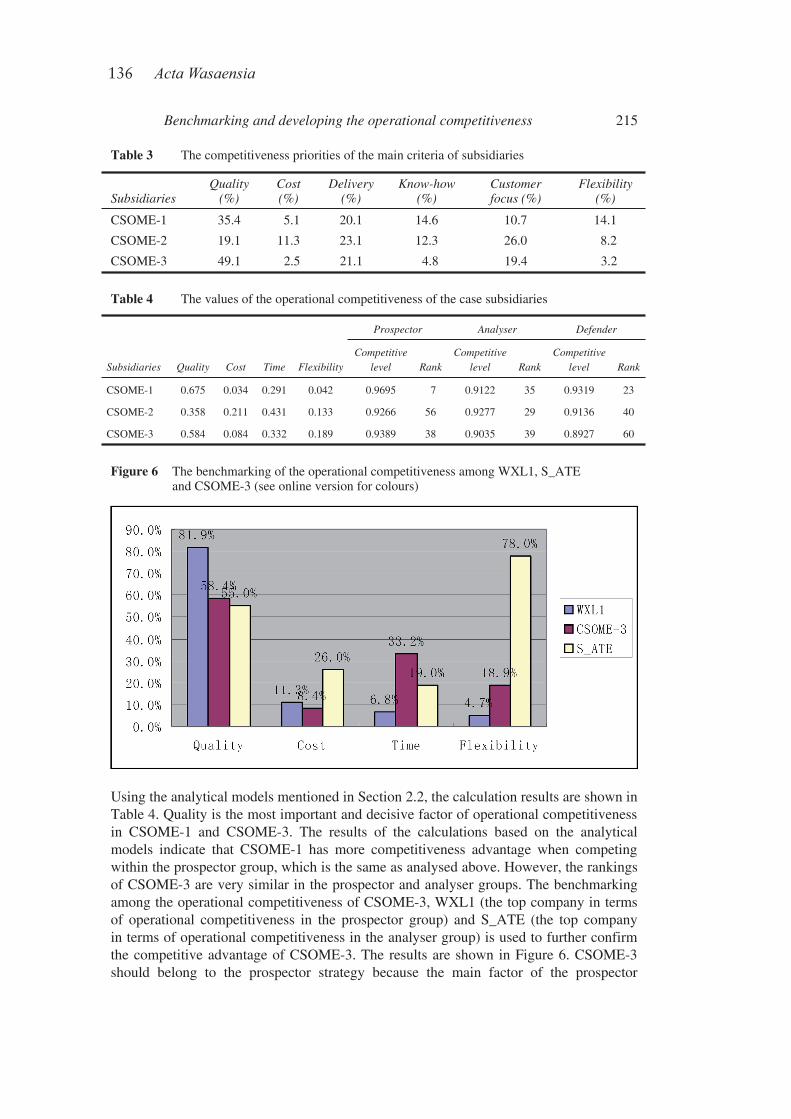
136 ActaWasaensia
Benchmarking and developing the operational competitiveness 215
Table 3 The competitiveness priorities of the main criteria of subsidiaries
SubsidiariesQuality
(%)Cost(%)
Delivery (%)
Know-how(%)
Customerfocus (%)
Flexibility (%)
CSOME-1 35.4 5.1 20.1 14.6 10.7 14.1
CSOME-2 19.1 11.3 23.1 12.3 26.0 8.2
CSOME-3 49.1 2.5 21.1 4.8 19.4 3.2
Table 4 The values of the operational competitiveness of the case subsidiaries
Prospector Analyser Defender
Subsidiaries Quality Cost Time Flexibility Competitive
level Rank Competitive
level Rank Competitive
level Rank
CSOME-1 0.675 0.034 0.291 0.042 0.9695 7 0.9122 35 0.9319 23
CSOME-2 0.358 0.211 0.431 0.133 0.9266 56 0.9277 29 0.9136 40
CSOME-3 0.584 0.084 0.332 0.189 0.9389 38 0.9035 39 0.8927 60
Figure 6 The benchmarking of the operational competitiveness among WXL1, S_ATE and CSOME-3 (see online version for colours)
Using the analytical models mentioned in Section 2.2, the calculation results are shown in Table 4. Quality is the most important and decisive factor of operational competitiveness in CSOME-1 and CSOME-3. The results of the calculations based on the analytical models indicate that CSOME-1 has more competitiveness advantage when competing within the prospector group, which is the same as analysed above. However, the rankings of CSOME-3 are very similar in the prospector and analyser groups. The benchmarking among the operational competitiveness of CSOME-3, WXL1 (the top company in terms of operational competitiveness in the prospector group) and S_ATE (the top company in terms of operational competitiveness in the analyser group) is used to further confirm the competitive advantage of CSOME-3. The results are shown in Figure 6. CSOME-3 should belong to the prospector strategy because the main factor of the prospector
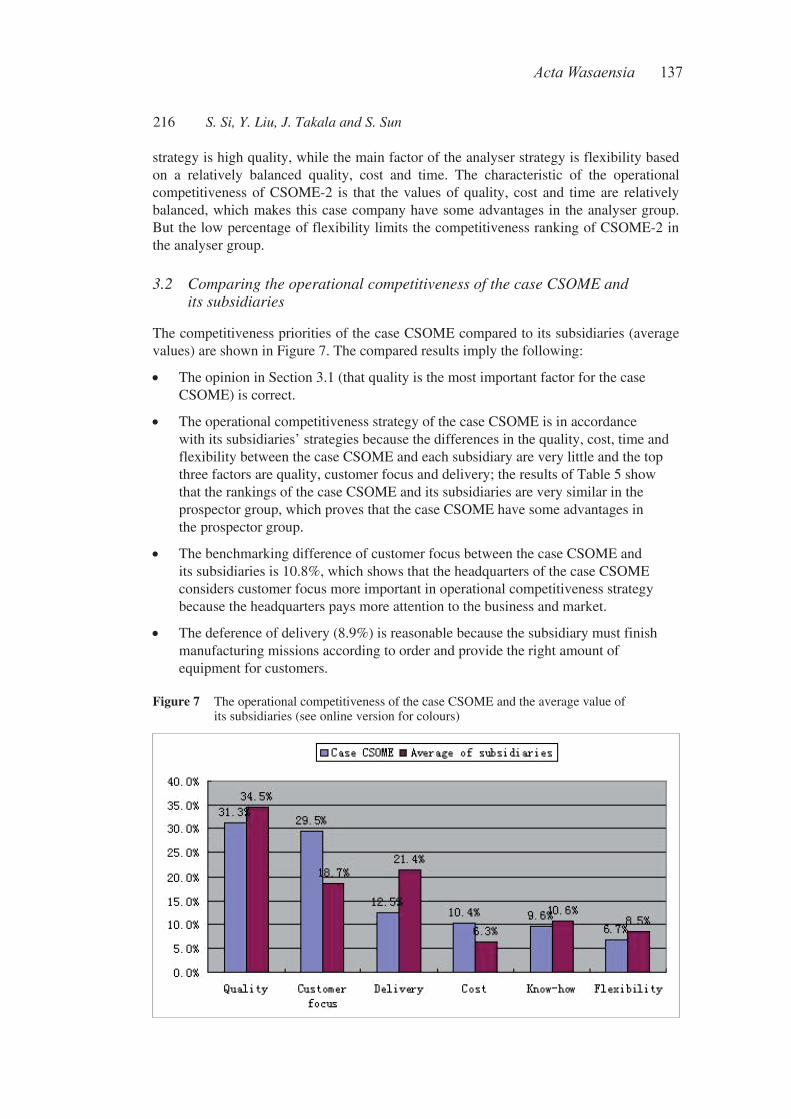
ActaWasaensia 137
216 S. Si, Y. Liu, J. Takala and S. Sun
strategy is high quality, while the main factor of the analyser strategy is flexibility based on a relatively balanced quality, cost and time. The characteristic of the operational competitiveness of CSOME-2 is that the values of quality, cost and time are relatively balanced, which makes this case company have some advantages in the analyser group. But the low percentage of flexibility limits the competitiveness ranking of CSOME-2 in the analyser group.
3.2 Comparing the operational competitiveness of the case CSOME andits subsidiaries
The competitiveness priorities of the case CSOME compared to its subsidiaries (average values) are shown in Figure 7. The compared results imply the following:
The opinion in Section 3.1 (that quality is the most important factor for the case CSOME) is correct.
The operational competitiveness strategy of the case CSOME is in accordance with its subsidiaries’ strategies because the differences in the quality, cost, time and flexibility between the case CSOME and each subsidiary are very little and the top three factors are quality, customer focus and delivery; the results of Table 5 show that the rankings of the case CSOME and its subsidiaries are very similar in the prospector group, which proves that the case CSOME have some advantages in the prospector group.
The benchmarking difference of customer focus between the case CSOME and its subsidiaries is 10.8%, which shows that the headquarters of the case CSOME considers customer focus more important in operational competitiveness strategy because the headquarters pays more attention to the business and market.
The deference of delivery (8.9%) is reasonable because the subsidiary must finish manufacturing missions according to order and provide the right amount of equipment for customers.
Figure 7 The operational competitiveness of the case CSOME and the average value of its subsidiaries (see online version for colours)
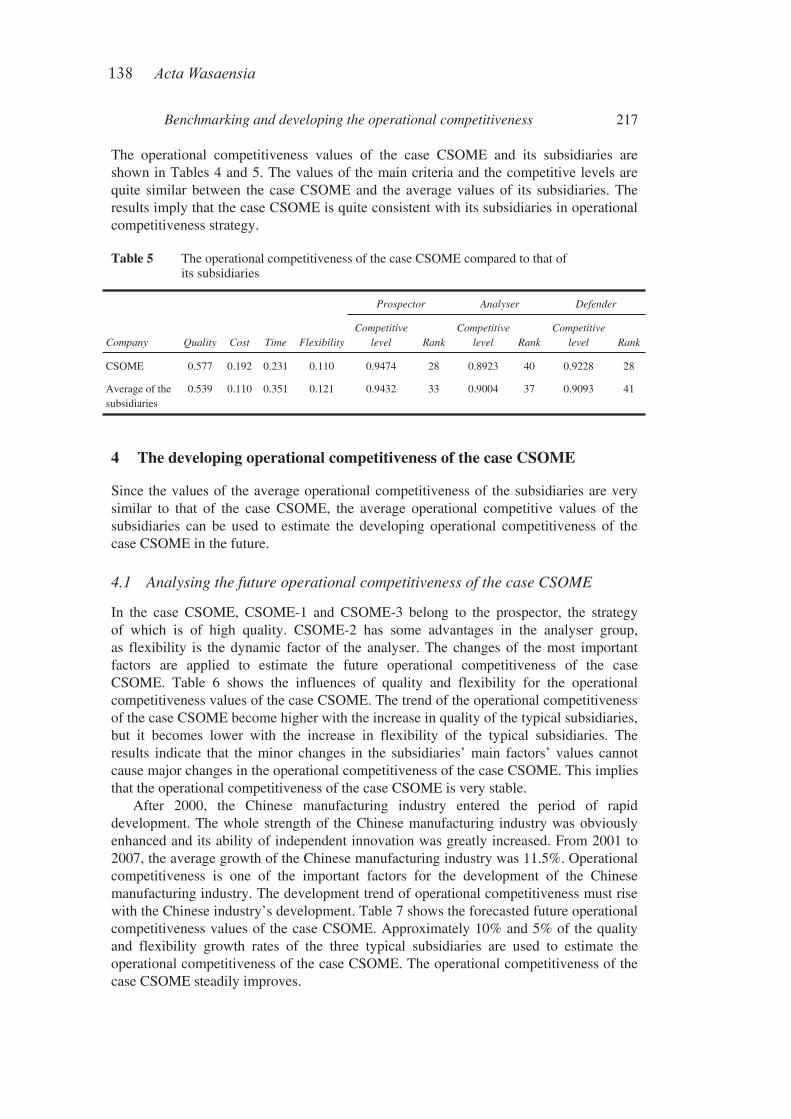
138 ActaWasaensia
Benchmarking and developing the operational competitiveness 217
The operational competitiveness values of the case CSOME and its subsidiaries are shown in Tables 4 and 5. The values of the main criteria and the competitive levels are quite similar between the case CSOME and the average values of its subsidiaries. The results imply that the case CSOME is quite consistent with its subsidiaries in operational competitiveness strategy.
Table 5 The operational competitiveness of the case CSOME compared to that of its subsidiaries
Prospector Analyser Defender
Company Quality Cost Time Flexibility Competitive
level Rank Competitive
level Rank Competitive
level Rank
CSOME 0.577 0.192 0.231 0.110 0.9474 28 0.8923 40 0.9228 28
Average of the subsidiaries
0.539 0.110 0.351 0.121 0.9432 33 0.9004 37 0.9093 41
4 The developing operational competitiveness of the case CSOME
Since the values of the average operational competitiveness of the subsidiaries are very similar to that of the case CSOME, the average operational competitive values of the subsidiaries can be used to estimate the developing operational competitiveness of the case CSOME in the future.
4.1 Analysing the future operational competitiveness of the case CSOME
In the case CSOME, CSOME-1 and CSOME-3 belong to the prospector, the strategy of which is of high quality. CSOME-2 has some advantages in the analyser group, as flexibility is the dynamic factor of the analyser. The changes of the most important factors are applied to estimate the future operational competitiveness of the case CSOME. Table 6 shows the influences of quality and flexibility for the operational competitiveness values of the case CSOME. The trend of the operational competitiveness of the case CSOME become higher with the increase in quality of the typical subsidiaries, but it becomes lower with the increase in flexibility of the typical subsidiaries. The results indicate that the minor changes in the subsidiaries’ main factors’ values cannot cause major changes in the operational competitiveness of the case CSOME. This implies that the operational competitiveness of the case CSOME is very stable.
After 2000, the Chinese manufacturing industry entered the period of rapid development. The whole strength of the Chinese manufacturing industry was obviously enhanced and its ability of independent innovation was greatly increased. From 2001 to 2007, the average growth of the Chinese manufacturing industry was 11.5%. Operational competitiveness is one of the important factors for the development of the Chinese manufacturing industry. The development trend of operational competitiveness must rise with the Chinese industry’s development. Table 7 shows the forecasted future operational competitiveness values of the case CSOME. Approximately 10% and 5% of the quality and flexibility growth rates of the three typical subsidiaries are used to estimate the operational competitiveness of the case CSOME. The operational competitiveness of the case CSOME steadily improves.
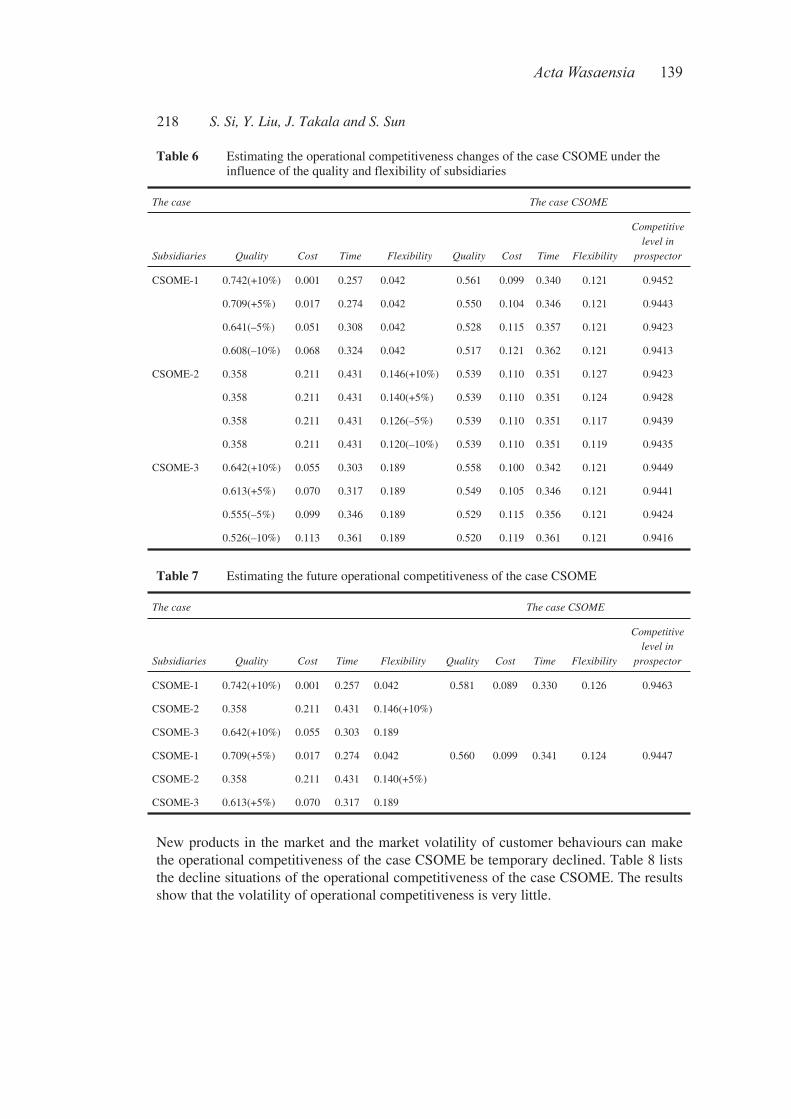
ActaWasaensia 139
218 S. Si, Y. Liu, J. Takala and S. Sun
Table 6 Estimating the operational competitiveness changes of the case CSOME under the influence of the quality and flexibility of subsidiaries
The case The case CSOME
Subsidiaries Quality Cost Time Flexibility Quality Cost Time Flexibility
Competitive level in
prospector
0.742(+10%) 0.001 0.257 0.042 0.561 0.099 0.340 0.121 0.9452
0.709(+5%) 0.017 0.274 0.042 0.550 0.104 0.346 0.121 0.9443
0.641(–5%) 0.051 0.308 0.042 0.528 0.115 0.357 0.121 0.9423
CSOME-1
0.608(–10%) 0.068 0.324 0.042 0.517 0.121 0.362 0.121 0.9413
0.358 0.211 0.431 0.146(+10%) 0.539 0.110 0.351 0.127 0.9423
0.358 0.211 0.431 0.140(+5%) 0.539 0.110 0.351 0.124 0.9428
0.358 0.211 0.431 0.126(–5%) 0.539 0.110 0.351 0.117 0.9439
CSOME-2
0.358 0.211 0.431 0.120(–10%) 0.539 0.110 0.351 0.119 0.9435
0.642(+10%) 0.055 0.303 0.189 0.558 0.100 0.342 0.121 0.9449
0.613(+5%) 0.070 0.317 0.189 0.549 0.105 0.346 0.121 0.9441
0.555(–5%) 0.099 0.346 0.189 0.529 0.115 0.356 0.121 0.9424
CSOME-3
0.526(–10%) 0.113 0.361 0.189 0.520 0.119 0.361 0.121 0.9416
Table 7 Estimating the future operational competitiveness of the case CSOME
The case The case CSOME
Subsidiaries Quality Cost Time Flexibility Quality Cost Time Flexibility
Competitive level in
prospector
CSOME-1 0.742(+10%) 0.001 0.257 0.042
CSOME-2 0.358 0.211 0.431 0.146(+10%)
CSOME-3 0.642(+10%) 0.055 0.303 0.189
0.581 0.089 0.330 0.126 0.9463
CSOME-1 0.709(+5%) 0.017 0.274 0.042
CSOME-2 0.358 0.211 0.431 0.140(+5%)
CSOME-3 0.613(+5%) 0.070 0.317 0.189
0.560 0.099 0.341 0.124 0.9447
New products in the market and the market volatility of customer behaviours can make the operational competitiveness of the case CSOME be temporary declined. Table 8 lists the decline situations of the operational competitiveness of the case CSOME. The results show that the volatility of operational competitiveness is very little.
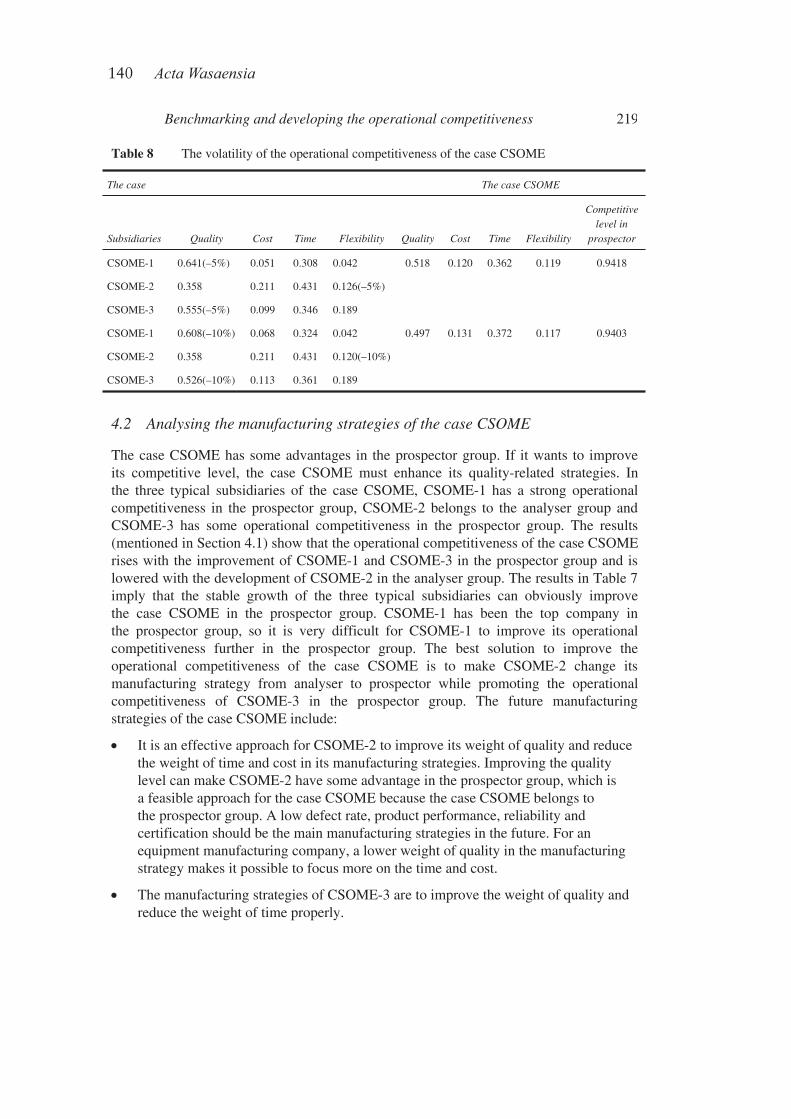
140 ActaWasaensia
Benchmarking and developing the operational competitiveness 219
Table 8 The volatility of the operational competitiveness of the case CSOME
The case The case CSOME
Subsidiaries Quality Cost Time Flexibility Quality Cost Time Flexibility
Competitive level in
prospector
CSOME-1 0.641(–5%) 0.051 0.308 0.042
CSOME-2 0.358 0.211 0.431 0.126(–5%)
CSOME-3 0.555(–5%) 0.099 0.346 0.189
0.518 0.120 0.362 0.119 0.9418
CSOME-1 0.608(–10%) 0.068 0.324 0.042
CSOME-2 0.358 0.211 0.431 0.120(–10%)
CSOME-3 0.526(–10%) 0.113 0.361 0.189
0.497 0.131 0.372 0.117 0.9403
4.2 Analysing the manufacturing strategies of the case CSOME
The case CSOME has some advantages in the prospector group. If it wants to improve its competitive level, the case CSOME must enhance its quality-related strategies. In the three typical subsidiaries of the case CSOME, CSOME-1 has a strong operational competitiveness in the prospector group, CSOME-2 belongs to the analyser group and CSOME-3 has some operational competitiveness in the prospector group. The results (mentioned in Section 4.1) show that the operational competitiveness of the case CSOME rises with the improvement of CSOME-1 and CSOME-3 in the prospector group and is lowered with the development of CSOME-2 in the analyser group. The results in Table 7 imply that the stable growth of the three typical subsidiaries can obviously improve the case CSOME in the prospector group. CSOME-1 has been the top company in the prospector group, so it is very difficult for CSOME-1 to improve its operational competitiveness further in the prospector group. The best solution to improve the operational competitiveness of the case CSOME is to make CSOME-2 change its manufacturing strategy from analyser to prospector while promoting the operational competitiveness of CSOME-3 in the prospector group. The future manufacturing strategies of the case CSOME include:
It is an effective approach for CSOME-2 to improve its weight of quality and reduce the weight of time and cost in its manufacturing strategies. Improving the quality level can make CSOME-2 have some advantage in the prospector group, which is a feasible approach for the case CSOME because the case CSOME belongs to the prospector group. A low defect rate, product performance, reliability and certification should be the main manufacturing strategies in the future. For an equipment manufacturing company, a lower weight of quality in the manufacturing strategy makes it possible to focus more on the time and cost.
The manufacturing strategies of CSOME-3 are to improve the weight of quality and reduce the weight of time properly.
ActaWasaensia 141
220 S. Si, Y. Liu, J. Takala and S. Sun
5 Discussions
CSOMEs include large and medium-sized manufacturing companies in aviation, aerospace, ship building, automobile, steel, oil industries, etc. Many general characteristics of the operational competitiveness of CSOMEs have been reflected by studying the case CSOME.
Flexibility is not high compared to the other factors in the operational strategies of CSOMEs because of complicated products, enormous organisations, large staff sizes and the dedicated production line, etc. The famous global equipment manufacturing companies share such characteristics. A Finnish engine manufacturing company that focuses on marine power technologies and products and employs 17 000 professionals at 160 locations in 70 countries around the world has only 4.4% flexibility (based on data from the GMSS database). The low flexibility value is a key characteristic of the operational strategies of CSOMEs and especially the equipment manufacturing companies. Government policies and macro control also somehow restrict the development of flexibility.
The leadership of CSOMEs is very important in the decision-making process because the management system of CSOMEs is very similar to that of the government. It is not unusual that a leader of a CSOME becomes a minister of the government. The mayor of Beijing was also previously a general manager of a CSOME. CSOMEs are typically under the direct command of the government. The capacity of leadership in CSOMEs is one of the key factors that greatly influence the development of operational competitiveness. Good leadership can make CSOMEs the top market leaders, while bad leadership can lead CSOMEs to bankruptcy.
CSOMEs are the locomotive and primary driving force of the Chinese economy. The Chinese government provides strong support to CSOMEs when they meet difficulties like financial crises. Although CSOMEs are monopoly enterprises in some manufacturing fields, the development of private enterprises and foreign competitors makes CSOMEs improve their flexibility and further lowers costs.
This paper shows that the operational competitiveness of the case CSOME is very stable, which indicates that customer market behaviours do not have big fluctuations. It is a continuous process for CSOMEs to improve their operational competitiveness levels.
6 Conclusions
From the case CSOME studied in this paper (which is a typical Chinese state-owned enterprise), some conclusions can be drawn:
Quality is the most important competitive priority of the case CSOME and the case CSOME has a strong operational competitiveness in the prospector group.
The developing operational competitiveness research shows that the case CSOME is very stable in the prospector group and improving the operational competitiveness of CSOME-2 in the prospector group is an effective approach to improve its overall competitiveness.
142 ActaWasaensia
Benchmarking and developing the operational competitiveness 221
The rankings and stability of the operational competitiveness of the case CSOME and its subsidiaries imply that:
the top CSOMEs have a strong operational competitiveness in the global context; however, they have a big gap compared to the top manufacturing enterprises in the world
it will be a long process for the top CSOMEs to improve their operational competitiveness because of a huge organisational structure.
Acknowledgements
The authors gratefully acknowledge the financial support for this research from the China National ‘863’ High-Tech Programme (Grant No.2007AA40701) and the Hover Star project from Northwestern Polytechnical University, China.
References Kim, J.S. and Arnold, P. (1996) ‘Operationalizing manufacturing strategy-an exploratory study
of constructs and linkage’, International Journal of Operation & Product Management, Vol. 16, No. 12, pp.45–73.
Liu, Y., Li, Y., Takala, J., Kamdee, T. and Toshev, R. (2008) ‘Improve company’s operative competitiveness using analytical models’, Proc, IAMOT 1569082846, International Conference on Management of Technology; Creating and Managing a Knowledge Economy,IAMOT 2008-17th , Dubai, United Arab Emirates, International Association for Managementof Technology.
Madu, C.N., Aheto, J., Kuei, C. and Winokur, D. (1996) ‘Adoption of strategic total quality management philosophies: multi-criteria decision analysis model’, International Journal of Quality & Reliability Management, Vol. 13, No. 3, pp.57–72.
Miles, R.E. and Snow, C.C. (1978) Organizational Strategy, Structure, and Process, New York: McGraw Hill.
Phusavat, K. and Kanchana, R. (2008) ‘Competitive priorities for service providers: perspectives from Thailand’, Industrial Management & Data Systems, Vol. 108, No. 1, pp.5–21.
Rangone, A. (1996) ‘An analytic hierarchy process framework for comparing the overall performance of manufacturing departments’, International Journal of Operations & Production Management, Vol. 16, No. 8, pp.104–119.
Saaty, T.L. (1980) The Analytic Hierarchy Process, New York: McGraw Hill.
Sun, S. (2004) ‘Assessing joint maintenance shops in the Taiwanese Army using data envelopment analysis’, Journal of Operations Management, Vol. 22, No. 3, pp.233–245.
Takala, J. (2002) ‘Analysis and synthesising multifocused manufacturing strategies by analytical hierarchy process’, Int. J. Manufacturing Technology and Management, Vol. 4, No. 5, pp.345–350.
Takala, J., Hirvelä, J., Liu, Y. and Malindzak, D. (2007a)‘Global manufacturing strategies require “dynamic engineers”? Case study in Finnish industries’, Industrial Management & Data Systems, Vol. 107, No. 3, pp.326–344.
Takala, J., Kamdee, T., Hirvelä, J. and Kyllonen, S. (2007b) ‘Analytic calculation of global operative competitiveness’, Proc, IAMOT 1569041789, International Conference on Management of Technology; Management of Technology for the Service Economy, IAMOT 2007–16th, Florida, USA, International Association for Management of Technology.

ActaWasaensia 143
222 S. Si, Y. Liu, J. Takala and S. Sun
Takala, J., Kamdee, T., Hirvelä, J. and Kyllonen, S. (2007c) ‘Analytic calculation of global operative competitiveness – case study in Finnish Industries’, Proc, ISPIM 2007-XVIII, ID 43, 12 pages. International Society for Professional Innovation Management; Innovation for Growth: The Challenges for East & West, Warsaw, Poland.
Wernerfelt, B. (1984) ‘A resource-based view of the firm’, Strategy Management Journal, Vol. 5, No. 2, pp.170–180.
Zahedi, F. (1989) ‘Quantitative evaluation of micro versus larger database products’, Computersand Operations Research, Vol. 16, No. 6, pp.513–532.

144 ActaWasaensia
ActaWasaensia 145
____________________Re-printed with permission of Quality Innovation Prosperity.
Appendix C.4
KVALITA INOVÁCIA PROSPERITA / QUALITY INNOVATION PROSPERITY XIII/2 – 2009
ISSN 1335-1745
i
ABSTRACTS
MODELLING AND EVALUATION OF OPERATIONALCOMPETITIVENESS OF MANUFACTURING
ENTERPRISES
YANG LIU, JOSU TAKALA
Keywords: manufacturing strategy, transformational leadership, overallcompetitiveness, decision-making, analytical models up to six keywords shouldbe included which encapsulate the principal subject covered by the article.
Abstract: This paper is aiming to connect previous research in globalcompetitiveness analysis. Research is based on doing numerous case studies andcreating analytical models to evaluate the overall competitiveness, which is anovel concept by integrating the evaluation of manufacturing strategy andtransformational leadership including technology level together. The empiricalstudies are focused to case companies in China especially Chinese State-OwnedManufacturing Enterprise (CSOME). The main emphasises of this research aremanufacturing strategy and transformational leadership for CSOME. We havebrought the influence of “China effect” to study how it will impact theoperational competitiveness of CSOME on top of their manufacturing strategyand transformational leadership.
Authors:
Yang Liu, Department of Production, University of Vaasa, PL 700, 65101 Vaasa,Finland, [email protected]
Prof. Josu Takala, Department of Production, University of Vaasa, PL 700,65101 Vaasa, Finland, [email protected]
146 ActaWasaensia
KVALITA INOVÁCIA PROSPERITA / QUALITY INNOVATION PROSPERITY XIII/2 – 2009
ISSN 1335-1745
1
MODELLING AND EVALUATION OF OPERATIONALCOMPETITIVENESS OF MANUFACTURING
ENTERPRISES
YANG LIU, JOSU TAKALA
1 INTRODUCTIONWith the fast growing economics, China will become the second largesteconomic entity in the world by 2010 according to Chinese economist’s forecast.The Chinese manufacturing industries are more competitive than ever before inthe global market. China is now a strong manufacturing country and Chineseeconomics has influenced the global market in many different areas. Everythingseems to have been changed with the global economic downturn in which Chinaprevails with its ongoing growth and huge market.
Chinese state-owned manufacturing enterprise (CSOME) is the mostrepresentative type of companies in China and most significant representative ofSocialism with Chinese characteristics. CSOME produce majority of ChineseGDP (e.g. over 75% in 2007) and they are also majority portion of top 500companies in China. As a fact the CSOME is the backbone and primary drivingforce of the growing Chinese economics even despite of the global economicdownturn. Although the case studies are done for several subsidiaries of differentindustries which all belong to one large CSOME group, the results are commonlyrepresentative for majority since mostly they share very similar characteristics.
In this study we mainly focus on the integration of manufacturing strategy andtransformational leadership for Chinese State-Owned Manufacturing Enterprises(CSOME), based on empirical studies in China. “China effect” has influencedbusiness and manufacturing strategies globally in many different business areas(Takala et al., 2007a). We have brought the influence of “China effect” to studyhow it will impact the operational competitiveness of CSOME on top of theirmanufacturing strategy and transformational leadership. We promote a novelconcept of overall competitiveness to evaluate performance of companies inglobal context by integrating the evaluation of manufacturing strategy andtransformational leadership including technology level altogether using analyticalmodels created in this paper.
The theoretical reference framework of this study starts from resource-basedview of a firm for case study (Wernerfelt, 1984). Takala et al. (2002) havepresented justification of multi-focused manufacturing strategies. Miles andSnow (1978) have defined four company groups which include prospector,
ActaWasaensia 147
KVALITA INOVÁCIA PROSPERITA / QUALITY INNOVATION PROSPERITY XIII/2 – 2009
ISSN 1335-1745
2
analyzer, defender and reactor. According to Miles and Snow (1978), on thecontrary to the three groups which are prospector, analyzer and defender, reactordoes not lead to a consistent and stable organisation and therefore it is advised tochange over to one of the other three groups. Based on this theory, Takala et al.(2007b) have introduced unique analytical model to evaluate globalcompetitiveness rankings for manufacturing strategies in prospector, analyzerand defender groups according to the company’s multi-criteria priority weightsof Q(Quality), C(Cost), T(Time) and F(Flexibility). Such analytical models areused to gain insight into the influences and sensitivities of various parametersand processes on the alteration of manufacturing strategies by Takala et al.(2007c). In China, the most dynamic market, Liu et al. (2008) has first timeapplied such analytical models to analyze and improve operationalcompetitiveness of one private middle-size Chinese manufacturing company byadjusting competitive priorities in manufacturing strategy. Liu, Si and Takala(2009) has compared the operational competitiveness strategies in China andother countries in a global context by utilizing same analytical models, in orderto analyze different characteristics of manufacturing strategies in differentmarkets and suggest how the companies can improve their operationalcompetitiveness. But the adjustment of manufacturing strategy alone is not justenough to improve the overall competitiveness to develop the business. This isone important factor and there is another important and necessary factor toimprove the overall competitiveness no matter in adversity or in prosperity,which can be even more decisive and that is leadership (Bass, 1985). Bass andAvolio (1994) provided evidence on the benefits and effectiveness oftransformational leadership on leadership and training of leaders.Transformational leaders help their subordinates to learn and develop asindividuals, by encouraging and motivating them with versatile repertoire ofbehavioural and decision making capability (Bass and Avolio, 1994; Bass, 1997).Takala et al. (2008a) introduced another unique analytical model to evaluate thelevel of outcome direction, leadership behaviour and resource allocation oftransformational leadership. In this paper transformational leadership is furtherextended by adding technology level as part of resource allocation. The final ideain this paper is to create a new analytical model to integrate manufacturingstrategy and transformational leadership including technology level together formore comprehensive evaluation of overall competitiveness to develop thebusiness operations further. The study continues further in China with deeperinsight analysis of overall competitiveness of CSOME and suggests how toimprove the overall competitiveness. The related case study includesbenchmarking and development of overall competitiveness of CSOME caseCN_WG group in global context which emphasize more on the adjustment of itsmanufacturing strategy and transformational leadership to improve overallcompetitiveness in regional and global market.
148 ActaWasaensia
KVALITA INOVÁCIA PROSPERITA / QUALITY INNOVATION PROSPERITY XIII/2 – 2009
ISSN 1335-1745
3
The structure of this paper is as follow. Section 2 introduces researchmethodologies. Section 3 models the integration of manufacturing strategy andtransformational leadership including technology level to evaluate overallcompetitiveness with case study. Section 4 discusses briefly the analysis resultsand proposes the future research areas. Section 5 draws the conclusion.
2 RESEARCH METHODOLOGIES
2.1 Analytic Hierarchy Process (AHP) methodAnalytic Hierarchy Process (AHP) method (Saaty, 1980) is a multi-attributedecision instrument that allows considering quantitative, qualitative measuresand making trade-offs. The AHP is used in this study to deal with the empiricalpart, which includes analyzing questionnaires and calculating weights of maincriteria and sub-criteria. AHP is aimed at integrating different measures intosingle overall score for ranking decision alternatives with pair wise comparisonof chosen attributes (Rangone, 1996). This utilizes pair wise comparison byinterviewing the experts within the whole organization. The AHP basedinstruments (forms and questionnaires) have been used in our case studies formore than 20 years in successful analysis of case companies and proved to bereliable. Further more, some open questions are used in additional to the pairwise comparisons in the AHP questionnaires to add internal validity to theanswers. The inconsistency ratio (icr) has been calculated to assure the reliabilityof pair wise comparison results. Only matrixes with inconsistency value of 0.10or less, and 0.30 or less in smaller groups with competent informants, can beused for reliable decision-making. Otherwise the answers are considered asinvalid and will not be used in the case study.
The procedures of utilizing the AHP are as follows in this paper. The first step isto establish the model of hierarchy structure for the goal. In this study, thehierarchy models are constructed for the evaluation of manufacturing strategy byTakala et al. (2002) and transformational leadership by Takala et al. (2005),which serves as theoretical framework of this study. The second step is thecomparison of the alternatives and the criteria. They are pair wise compared withrespect to each element of the next higher level. The last step is connecting thecomparisons so that to get the priorities of the alternatives with respect to eachcriteria and the weights of each criteria with respect to the goal. The localpriorities are then multiplied by the weights of the respective criterion. Theresults are summed up to get the overall priority of each alternative.
2.2 Data collection and analysisThe data of CSOME case CN_WG group has been collected by answeringquestionnaires from senior managers or directors of 15 different subsidiaries. Theinterviewees are normally decision makers and middle management groups in the
ActaWasaensia 149
KVALITA INOVÁCIA PROSPERITA / QUALITY INNOVATION PROSPERITY XIII/2 – 2009
ISSN 1335-1745
4
case companies, who have good knowledge about the operations of the casecompanies, and the number of informants is depended on the size of casecompany. From same case company the inconsistent results are left out. Firstly,the senior managers or directors were trained to understand every criteria of thequestionnaire by email, telephone or interview. Secondly, after they finished thequestionnaires, the answers were analyzed by AHP software. Thirdly, thediscussion with managers or directors revealed the results and verified thereliabilities of the data further.
For studying the manufacturing strategy, competitiveness priorities are listed inthe AHP questionnaires as main criteria consisting of quality, cost, delivery, andflexibility. The main criteria are typical items used in evaluating thecompetitiveness priorities in multi-focused manufacturing strategies (Takala etal., 2002). They are formed based on typical case studies and instruments used ininterviews. The sub-criteria involve 19 criterions, such as low defect rate, lowcost, fast delivery, broad product line, etc. The weights are statistically measuredfor further analysis with analytical model (Takala et al., 2007b).
For studying the transformational leadership, leadership profiles are empiricallymeasured with the theoretical frame of reference by AHP questionnaires (Takalaet al., 2005). Statistical tests are made to find out the logic in the leadershipprofiles to increase the accuracy in the profiles, and in parallel by inductionanalytical model is built and tested statistically to measure leadership skills byleadership indexes from resource utilizations to leadership behaviours and finallyto outcome directions and outcomes. Analytical model is further used to measurethe effectiveness of leadership actions within different areas of outcomes and tryto find out the correlation between these outcomes and leadership indexes in aforecasting way (Takala et al., 2008b).
2.3 Research assumptions(1) CSOME can have strong competitiveness of manufacturing strategy inprospectors under normal business situation and may change to analyzer or evendefender under different business situation e.g. economic crisis.
(2) Strong competitive CSOME in manufacturing strategy do not necessarilyhave strong outcome index, leadership index, resource index in transformationalleadership since government behaviour (national policies, macro control)normally plays a key role rather than leadership in the operations of CSOME.
(3) Overall competitiveness will be decided by both the level of manufacturingstrategy and transformational leadership. For successful cases there should bepositive relationship between manufacturing strategy index and total leadershipindex.
150 ActaWasaensia
KVALITA INOVÁCIA PROSPERITA / QUALITY INNOVATION PROSPERITY XIII/2 – 2009
ISSN 1335-1745
5
2.4 Case study and case companyThe research is based on doing numerous case studies for CSOME to analyzewith existing analytical models and to create new analytical models for furtherevaluation, therefore the selection of case company must be mostlyrepresentative, well performed and highly experienced in its operations. Among10 major backbone industries of Chinese economics, iron and steel industry isranked as No. 1. Case CN_WG group is the first giant iron and steelmanufacturing enterprise established after the founding of the People’s Republicof China and one of the backbone enterprises under the leadership of the centralgovernment and the state council. Case CN_WG group is ranked top 3 CSOMEin iron and steel industry in China. It has a production scale of more than 30million tons, with over 120 thousand employees and 123.7 billon RMB revenuein 2008. Its operational concept is taking quality-profitability development routeto produce high quality and high value-added products, since quality factors andkey principles of quality management are important for financial decision-making (Zgodavová, 2004). Its strategic goal is to enter top 500 enterprises in theworld, and become a world first-class enterprise with powerful self-innovationcapability and market competitiveness by the year of 2010.
3 EVALUATION AND INTEGRATION OF MANUFACTURINGSTRATEGY AND TRANSFORMATIONAL LEADERSHIP
In this study, we propose to evaluate overall competitiveness based on two corefactors, i.e. manufacturing strategy and transformational leadership. Existinganalytical models are examined and new analytical models are proposed tointegrate the two core factors as a holistic model to evaluate overallcompetitiveness. Another factor, which is technology level, is proposed to beconsidered as part of resources of leadership.
3.1 Analytical models for manufacturing strategyThe analytical models for manufacturing strategy are used to calculate theoperational competitiveness indexes of companies in the different groups, whichare prospector, analyzer and defender. According to Takala (2002), theresponsiveness, agility and leanness (RAL) holistic model supports the theory ofthe analytical models using four main criteria, i.e. quality, cost, time andflexibility. The analytical models are developed from our research group basedon over 100 case company studies in over 10 countries worldwide, whoseindustrial branch varies from one to another and company size varies from big tosmall but they share one thing in common which is that they all compete in ahighly dynamic business environment and therefore such analytical model hasgood transferability.

ActaWasaensia 151
KVALITA INOVÁCIA PROSPERITA / QUALITY INNOVATION PROSPERITY XIII/2 – 2009
ISSN 1335-1745
6
The Manufacturing Strategy Index (MSI) is modelled as function . In theanalytical models (Takala et al., 2007), the equations to calculate weights of corefactors are as follows.
% (1); % (2); % (3);
% (4);
Q C TQ C TQ C T Q C T Q C T
FFQ C T F
The analytical models to calculate the operational competitiveness rankings ineach group are given.The analytical model for prospector group:
1/3 1/3~ 1 1 % 1 0.9* % (1 0.9* %)* %Q T C F (5)
The analytical model for analyzer group:
1/30.95* % 0.285 * 0.95* % 0.285 *
~1 1 %0.95* % 0.285
Q TF ABS
C
(6)
The analytical model for defender group:
1/3 1/3~ 1 1 % 1 0.9* % (1 0.9* %)* %C T Q F (7)
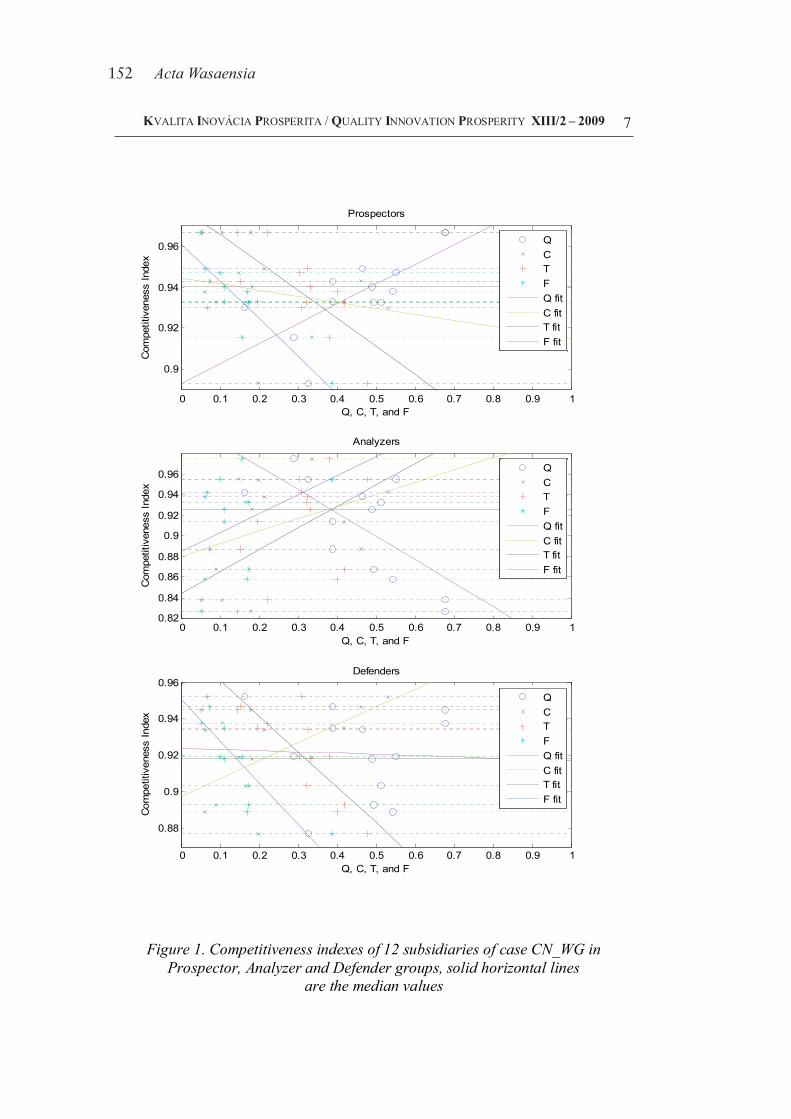
152 ActaWasaensia
KVALITA INOVÁCIA PROSPERITA / QUALITY INNOVATION PROSPERITY XIII/2 – 2009
ISSN 1335-1745
7
0 0.1 0.2 0.3 0.4 0.5 0.6 0.7 0.8 0.9 1
0.9
0.92
0.94
0.96
Q, C, T, and F
Com
petit
iven
ess
Inde
x
Prospectors
QCTFQ fitC fitT fitF fit
0 0.1 0.2 0.3 0.4 0.5 0.6 0.7 0.8 0.9 10.82
0.84
0.86
0.88
0.9
0.92
0.94
0.96
Q, C, T, and F
Com
petit
iven
ess
Inde
x
Analyzers
QCTFQ fitC fitT fitF fit
0 0.1 0.2 0.3 0.4 0.5 0.6 0.7 0.8 0.9 1
0.88
0.9
0.92
0.94
0.96
Q, C, T, and F
Com
petit
iven
ess
Inde
x
Defenders
QCTFQ fitC fitT fitF fit
Figure 1. Competitiveness indexes of 12 subsidiaries of case CN_WG inProspector, Analyzer and Defender groups, solid horizontal lines
are the median values
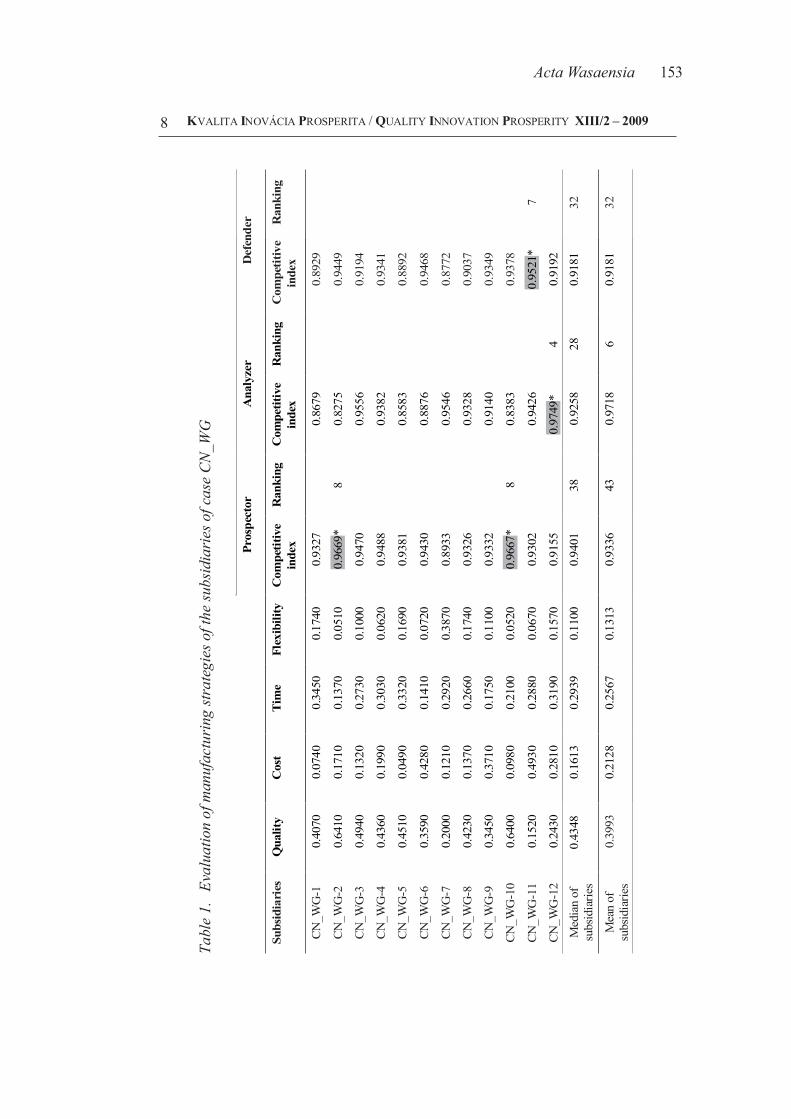
ActaWasaensia 153
KVALITA INOVÁCIA PROSPERITA / QUALITY INNOVATION PROSPERITY XIII/2 – 2009
ISSN 1335-1745
8
Ran
king
7 32
32
Def
ende
r
Com
petit
ive
ind
ex
0
.892
9
0
.944
9
0
.919
4
0
.934
1
0
.889
2
0
.946
8
0
.877
2
0
.903
7
0
.934
9
0
.937
8
0
.952
1*
0
.919
2
0
.918
1
0
.918
1
Ran
king
4 28
6
Ana
lyze
r
Com
petit
ive
inde
x
0
.867
9
0
.827
5
0
.955
6
0
.938
2
0
.858
3
0
.887
6
0
.954
6
0
.932
8
0
.914
0
0
.838
3
0
.942
6
0.97
49*
0
.925
8
0
.971
8
Ran
king
8 8 38
43
Pros
pect
or
Com
petit
ive
inde
x
0
.932
7
0
.966
9*
0
.947
0
0
.948
8
0
.938
1
0
.943
0
0
.893
3
0
.932
6
0
.933
2
0
.966
7*
0
.930
2
0
.915
5
0
.940
1
0
.933
6
Flex
ibili
ty
0
.174
0
0
.051
0
0
.100
0
0
.062
0
0
.169
0
0
.072
0
0
.387
0
0
.174
0
0
.110
0
0
.052
0
0
.067
0
0
.157
0
0
.110
0
0
.131
3
Tim
e
0
.345
0
0
.137
0
0
.273
0
0
.303
0
0
.332
0
0
.141
0
0
.292
0
0
.266
0
0
.175
0
0
.210
0
0
.288
0
0
.319
0
0
.293
9
0
.256
7
Cos
t
0
.074
0
0
.171
0
0
.132
0
0
.199
0
0
.049
0
0
.428
0
0
.121
0
0
.137
0
0
.371
0
0
.098
0
0
.493
0
0
.281
0
0
.161
3
0
.212
8
Qua
lity
0
.407
0
0
.641
0
0
.494
0
0
.436
0
0
.451
0
0
.359
0
0
.200
0
0
.423
0
0
.345
0
0
.640
0
0
.152
0
0
.243
0
0.43
48
0
.399
3
Tabl
e 1.
Eva
luat
ion
of m
anuf
actu
ring
strat
egie
s of t
he su
bsid
iarie
s of c
ase
CN_W
G
Subs
idia
ries
CN
_WG
-1
CN
_WG
-2
CN
_WG
-3
CN
_WG
-4
CN
_WG
-5
CN
_WG
-6
CN
_WG
-7
CN
_WG
-8
CN
_WG
-9
CN
_WG
-10
CN
_WG
-11
CN
_WG
-12
Med
ian
of
subs
idia
ries
Mea
n of
su
bsid
iarie
s
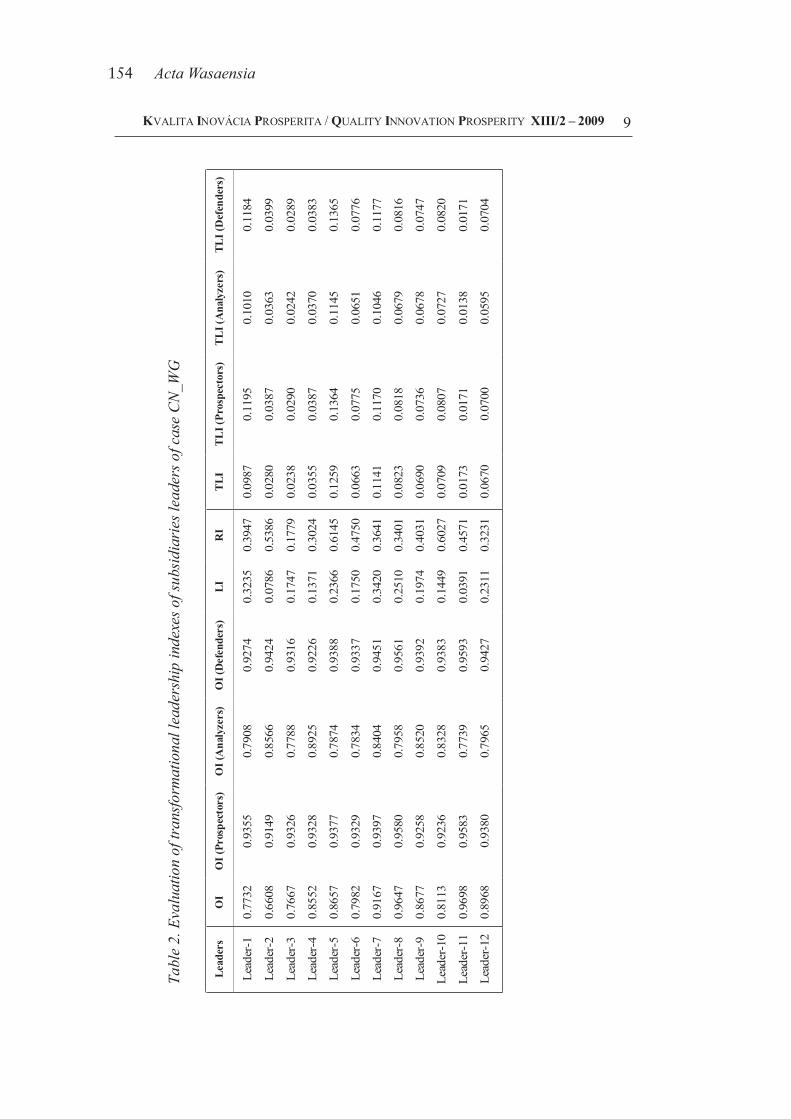
154 ActaWasaensia
KVALITA INOVÁCIA PROSPERITA / QUALITY INNOVATION PROSPERITY XIII/2 – 2009
ISSN 1335-1745
9
TLI (
Def
ende
rs)
0.11
84
0.03
99
0.02
89
0.03
83
0.13
65
0.07
76
0.11
77
0.08
16
0.07
47
0.08
20
0.01
71
0.07
04
TL
I (A
naly
zers
)
0.10
10
0.03
63
0.02
42
0.03
70
0.11
45
0.06
51
0.10
46
0.06
79
0.06
78
0.07
27
0.01
38
0.05
95
TL
I (Pr
ospe
ctor
s)
0.11
95
0.03
87
0.02
90
0.03
87
0.13
64
0.07
75
0.11
70
0.08
18
0.07
36
0.08
07
0.01
71
0.07
00
TLI
0.09
87
0.02
80
0.02
38
0.03
55
0.12
59
0.06
63
0.11
41
0.08
23
0.06
90
0.07
09
0.01
73
0.06
70
RI
0.39
47
0.53
86
0.17
79
0.30
24
0.61
45
0.47
50
0.36
41
0.34
01
0.40
31
0.60
27
0.45
71
0.32
31
LI
0.32
35
0.07
86
0.17
47
0.13
71
0.23
66
0.17
50
0.34
20
0.25
10
0.19
74
0.14
49
0.03
91
0.23
11
OI (
Def
ende
rs)
0.92
74
0.94
24
0.93
16
0.92
26
0.93
88
0.93
37
0.94
51
0.95
61
0.93
92
0.93
83
0.95
93
0.94
27
OI (
Ana
lyze
rs)
0.79
08
0.85
66
0.77
88
0.89
25
0.78
74
0.78
34
0.84
04
0.79
58
0.85
20
0.83
28
0.77
39
0.79
65
OI (
Pros
pect
ors)
0.93
55
0.91
49
0.93
26
0.93
28
0.93
77
0.93
29
0.93
97
0.95
80
0.92
58
0.92
36
0.95
83
0.93
80
OI
0.77
32
0.66
08
0.76
67
0.85
52
0.86
57
0.79
82
0.91
67
0.96
47
0.86
77
0.81
13
0.96
98
0.89
68
Tabl
e 2.
Eva
luat
ion
of tr
ansfo
rmat
iona
l lea
ders
hip
inde
xes o
f sub
sidia
ries l
eade
rs o
f cas
e CN
_WG
Lead
ers
Lead
er-1
Lead
er-2
Lead
er-3
Lead
er-4
Lead
er-5
Lead
er-6
Lead
er-7
Lead
er-8
Lead
er-9
Lead
er-1
0
Lead
er-1
1
Lead
er-1
2
ActaWasaensia 155
KVALITA INOVÁCIA PROSPERITA / QUALITY INNOVATION PROSPERITY XIII/2 – 2009
ISSN 1335-1745
10
Table 1 shows the evaluation results of manufacturing strategies of 12subsidiaries of case CN_WG. According to Liu et al. (2008) and Si et al. (2010),normalized median values and mean values can be reliably used to evaluatecombined competitiveness ranking of an organization’s manufacturing strategybased on individual values from its different departments or subsidiaries. Basedon such theory, the competitiveness of case CN_WG is tested by calculating withmedian and mean values in Table 1. The top competitive subsidiaries, also themedians and the means of subsidiaries of case CN_WG in prospector, analyzerand defender groups are ranked in our global manufacturing strategies (GMSS)database. From the rankings it can be seen that case CN_WG is most competitivein analyzer group with mean value ranked 6th. The top competitive subsidiariesare marked with asterisks in Table 1. Case CN_WG-12 is most competitiveamong all subsidiaries, which has highest ranking 4th in analyzer group. The topcompetitive subsidiary in prospector group, case CN_WG-2 and CN_WG-10,both have nearly equivalent strong competitiveness which ranked 8th. The topcompetitive subsidiary in defender group, case CN_WG-11, has also strongcompetitiveness which ranked 7th. It can be seen that case CN_WG group hashighly competitive subsidiaries in prospector, analyzer and defender groups,which indicates that it is a highly competitive group corporation and in overall ithas strong competitiveness especially in analyzer group. This has provedresearch assumption (1).
3.2 Analytical models for transformational leadershipTakala et al. (2008a) have developed analytical models for the evaluations ofleadership indexes and its outcomes of different parts of leadership. Thesemodels are outcome direction index (OI) by balancing the directions, leadershipbehaviour index (LI) by measuring deep leadership, and by measuring maximumof passive and/or controlling leadership and by measuring in different ways theutilization of the cornerstones of deep leadership, and resource allocation index(RI) by balancing utilization of human resources. Originally theTransformational Leadership Index (TLI) is modelled as function ),,( RILIOIfTLI .However, in this paper we propose that technology level index (TI) to beconsidered into transformational leadership as a special part of resources ofleadership. Therefore the new proposal is to model Total Leadership Index (TLI)as function ),,,( TIRILIOIfTLI .
The theoretical frame of the analytical models is based on theory ofTransformational Leadership (Bass 1997). A holistic but very simple model of ahuman being from resource allocations to behaviour and finally to outcomedirections and outcomes has been built basing on psychic, social, functional,organizational and structural factors and put together according to the sand conemodel (Takala et al., 2005) and participation objectives in leadership of anorganization.
156 ActaWasaensia
KVALITA INOVÁCIA PROSPERITA / QUALITY INNOVATION PROSPERITY XIII/2 – 2009
ISSN 1335-1745
11
Sand cone model from operations management literature presents a model ofcumulative layers of manufacturing performance dimensions (Takala et al.,2006). The model implies an idea that companies need to develop theirperformance in certain stages, in order to achieve higher levels of competitiveperformance. The prescriptive order of mutually supportive and enabling successfactors is to proceed from quality, to delivery performance, then flexibility andfinally to cost effectiveness. Financial results cannot be achieved if non-financialaspects of performance are improved first. In this manner, the often-competitivedimensions of performance need to be viewed as a whole, to think aboutperformance and capabilities on a longer-term basis. The conceptual model withsand cone has similar basic ideas as the model of deep leadership (Nissinen2001) in which the potential in professional skills and resources is transformed tooutcomes of activities with the help and support of leadership process andbehaviour.The analytical models for evaluation of leadership are as follow.Outcome Index: ),,( EESAEFfOI OI
Leadership Index: ),,,,,,( BTISIMICCLPLDLfLI LI
Resource Index: ),,,,( TIORITPCPTfRI RI
Technology Index: ),,( BSCRSHfTI TI
Outcome index (OI):
Without classification:
EESAEF31,
31,
31max1 (8)
Prospector: 3/13/1 },,{)1()1()1(1 EFSAEEStdSAEFEE (9)
Analyzer: )},,{1()1(1 3/13/1 EFSAEEStdSA (10)
Defender: 3/13/1 },,{)1()1()1(1 EFSAEEStdSAEEEF (11)
EF = EffectivenessSA = SatisfactionEE = Extra effort
Leadership index (LI):
BTISIMICCLPLDL ,,,max
411,max1 (12)
DL = deep leadershipPL = passive leadership
ActaWasaensia 157
KVALITA INOVÁCIA PROSPERITA / QUALITY INNOVATION PROSPERITY XIII/2 – 2009
ISSN 1335-1745
12
CL = controlling leadershipIC = individualized considerationIM = inspirational motivationIS = intellectual stimulationBT = building trust and confidence
Resource index (RI) integrating with Technology index (TI): TIORITPCTIPT ,,min311 (13)
PT = people, technology, know howPC = processesIT = information systemsOR = organization (groups, teams)
BSBSCRCRSHSHTI optimaloptimaloptimal ,,max1 (14)
SH=Spearhead, CR=Core, BS=Basic
Combined total leadership index (TLI):RILIOITLI (15)
In this paper we propose a brand new idea to model the effect of technologyindex (spearhead, core, and basic technology) to resource index. The definition isproposed as follows according to the principles how resource index has beenbuilt.A. The excessive know how, meaning that caused by not the right technologybelongs directly as an extra weight to the warehouse of know how (PT), and/orlowers weights in PC, IT or OR, lowering in both the cases the resource index RIin a linear manner.B. The right technology, meaning that fitting to the manufacturing stagesincreases PC, IT or OR, and/or decreases the know how (PT) warehouse thatcaused by not the right technology, and increases in both the cases the resourceindex RI in a linear manner.Definitions A and B with the expert opinions from the case companies andequation for modelling RI are used for the analysis. The weights of SH/CR/BSare collected by interviewing the experts especially how significant or how mucheffect they are or have to be for PT and min(PC, IT, OR) and then the effects ofhow TI affects RI is analyzed. The optimal weights of SH, SR, and BS areobtained theoretically from the chosen competitor and market benchmark with
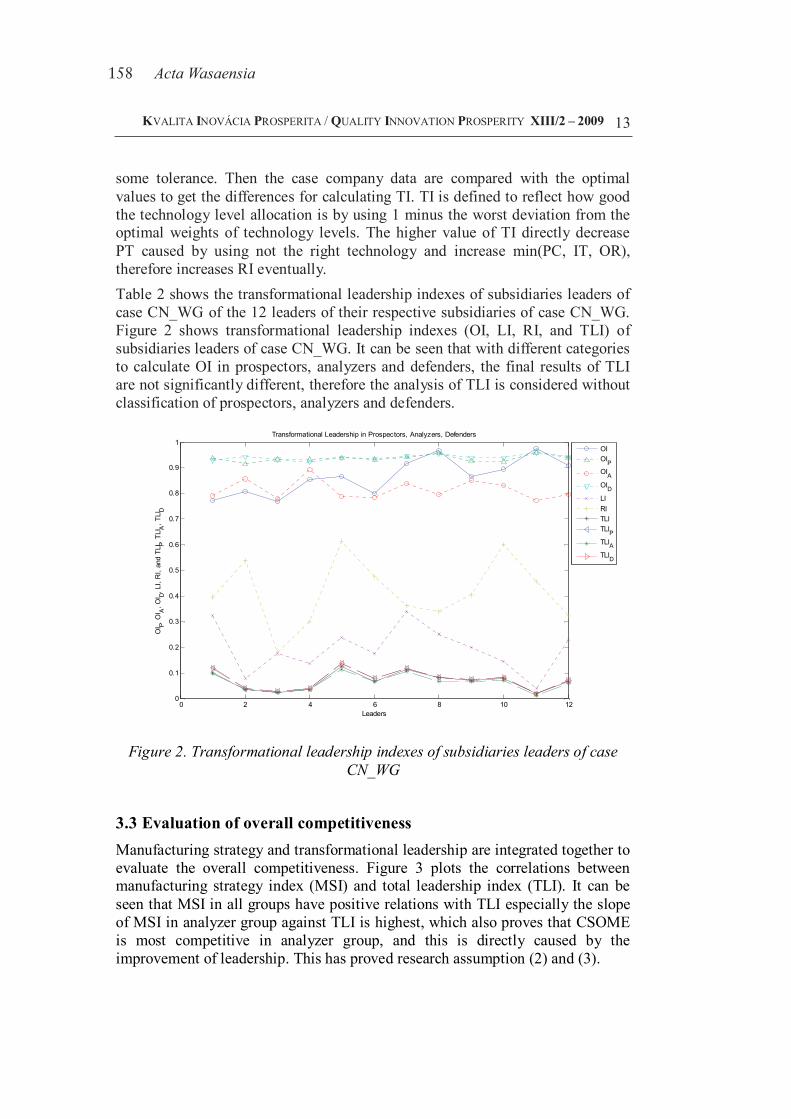
158 ActaWasaensia
KVALITA INOVÁCIA PROSPERITA / QUALITY INNOVATION PROSPERITY XIII/2 – 2009
ISSN 1335-1745
13
some tolerance. Then the case company data are compared with the optimalvalues to get the differences for calculating TI. TI is defined to reflect how goodthe technology level allocation is by using 1 minus the worst deviation from theoptimal weights of technology levels. The higher value of TI directly decreasePT caused by using not the right technology and increase min(PC, IT, OR),therefore increases RI eventually.Table 2 shows the transformational leadership indexes of subsidiaries leaders ofcase CN_WG of the 12 leaders of their respective subsidiaries of case CN_WG.Figure 2 shows transformational leadership indexes (OI, LI, RI, and TLI) ofsubsidiaries leaders of case CN_WG. It can be seen that with different categoriesto calculate OI in prospectors, analyzers and defenders, the final results of TLIare not significantly different, therefore the analysis of TLI is considered withoutclassification of prospectors, analyzers and defenders.
0 2 4 6 8 10 120
0.1
0.2
0.3
0.4
0.5
0.6
0.7
0.8
0.9
1
Leaders
OI P, O
I A, O
I D, LI,
RI,
and
TLI P, T
LIA
, TLI
D
Transformational Leadership in Prospectors, Analyzers, Defenders
OIOIPOIAOIDLIRITLITLIPTLIATLID
Figure 2. Transformational leadership indexes of subsidiaries leaders of caseCN_WG
3.3 Evaluation of overall competitivenessManufacturing strategy and transformational leadership are integrated together toevaluate the overall competitiveness. Figure 3 plots the correlations betweenmanufacturing strategy index (MSI) and total leadership index (TLI). It can beseen that MSI in all groups have positive relations with TLI especially the slopeof MSI in analyzer group against TLI is highest, which also proves that CSOMEis most competitive in analyzer group, and this is directly caused by theimprovement of leadership. This has proved research assumption (2) and (3).
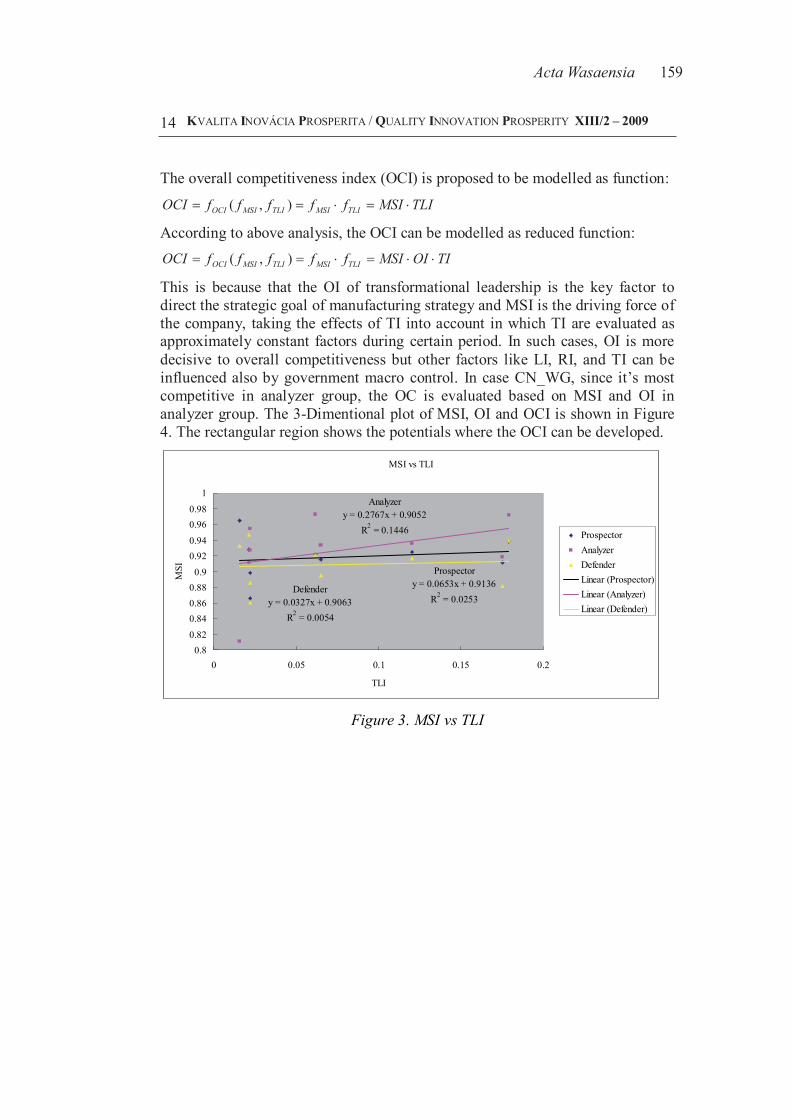
ActaWasaensia 159
KVALITA INOVÁCIA PROSPERITA / QUALITY INNOVATION PROSPERITY XIII/2 – 2009
ISSN 1335-1745
14
The overall competitiveness index (OCI) is proposed to be modelled as function:
TLIMSIfffffOCI TLIMSITLIMSIOCI ),(
According to above analysis, the OCI can be modelled as reduced function:TIOIMSIfffffOCI TLIMSITLIMSIOCI ),(
This is because that the OI of transformational leadership is the key factor todirect the strategic goal of manufacturing strategy and MSI is the driving force ofthe company, taking the effects of TI into account in which TI are evaluated asapproximately constant factors during certain period. In such cases, OI is moredecisive to overall competitiveness but other factors like LI, RI, and TI can beinfluenced also by government macro control. In case CN_WG, since it’s mostcompetitive in analyzer group, the OC is evaluated based on MSI and OI inanalyzer group. The 3-Dimentional plot of MSI, OI and OCI is shown in Figure4. The rectangular region shows the potentials where the OCI can be developed.
MSI vs TLI
Prospectory = 0.0653x + 0.9136
R2 = 0.0253
Analyzery = 0.2767x + 0.9052
R2 = 0.1446
Defendery = 0.0327x + 0.9063
R2 = 0.0054
0.80.82
0.840.860.88
0.9
0.920.94
0.960.98
1
0 0.05 0.1 0.15 0.2
TLI
MSI
ProspectorAnalyzerDefenderLinear (Prospector)Linear (Analyzer)Linear (Defender)
Figure 3. MSI vs TLI
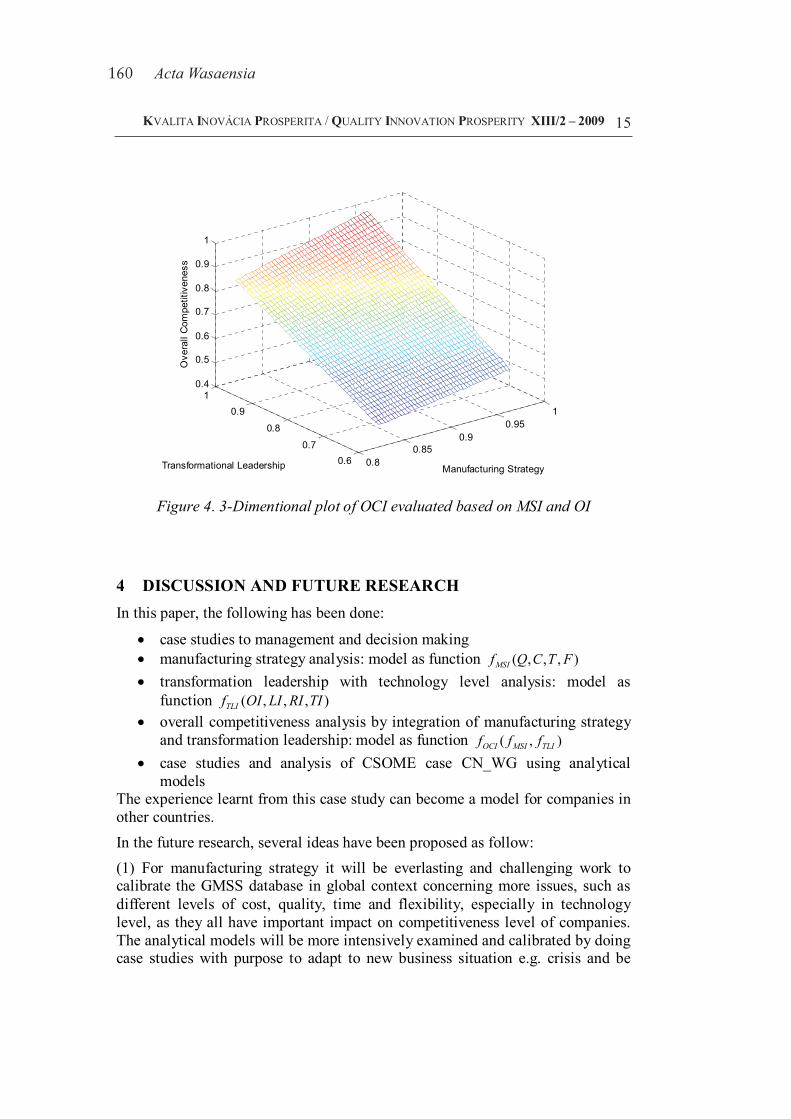
160 ActaWasaensia
KVALITA INOVÁCIA PROSPERITA / QUALITY INNOVATION PROSPERITY XIII/2 – 2009
ISSN 1335-1745
15
0.80.85
0.90.95
1
0.60.7
0.8
0.91
0.4
0.5
0.6
0.7
0.8
0.9
1
Manufacturing StrategyTransformational Leadership
Ove
rall
Com
petit
iven
ess
Figure 4. 3-Dimentional plot of OCI evaluated based on MSI and OI
4 DISCUSSION AND FUTURE RESEARCHIn this paper, the following has been done:
case studies to management and decision making manufacturing strategy analysis: model as function ),,,( FTCQfMSI
transformation leadership with technology level analysis: model asfunction ),,,( TIRILIOIfTLI
overall competitiveness analysis by integration of manufacturing strategyand transformation leadership: model as function ),( TLIMSIOCI fff
case studies and analysis of CSOME case CN_WG using analyticalmodels
The experience learnt from this case study can become a model for companies inother countries.In the future research, several ideas have been proposed as follow:(1) For manufacturing strategy it will be everlasting and challenging work tocalibrate the GMSS database in global context concerning more issues, such asdifferent levels of cost, quality, time and flexibility, especially in technologylevel, as they all have important impact on competitiveness level of companies.The analytical models will be more intensively examined and calibrated by doingcase studies with purpose to adapt to new business situation e.g. crisis and be
ActaWasaensia 161
KVALITA INOVÁCIA PROSPERITA / QUALITY INNOVATION PROSPERITY XIII/2 – 2009
ISSN 1335-1745
16
able to advise solutions based on the evaluation results obtained from analyticalmodels. These may include:
new measurement of customer behaviour through interview and casestudies
customer and market behaviour analysis under new situation how to change strategies according to different market needs and customer
behaviour. Strategies should change according to new measurement of thedifferences, e.g. to overcome the currency depreciation, change of productline, change of supplier network, increase flexibility in certain area to gainnew customer and new market (for example case Wärtsilä’s highflexibility in service intensive business)
simulate the operational performance with new adjusted strategies byutilizing analytical models
forecast the effects of crisis and the effects of adjusted strategies other adjustments except strategies
(2) For transformational leadership, the OI value should probably be scaled tohave more meaningful results. A brand new group, reactor, will be introduced.The definition and calculation of reactor group is worth to study in boththeoretical and practical level. The actual modelling of TI as part of RI will beimplemented. These give better simulation models to new business situationssuch as crisis.(3) For overall competitiveness, the evaluation will be compared with more casestudies with successful companies to verify its validity further.(4) How government behaviour (national policies, macro control) will affectenterprises may also be taken into account, whether to put them into crisis (e.g.economical sanctions) or save them from crisis (local protection, governmentsupport for the CSOME). Since many large international orders are only based onbilateral government contracts, political reasons cannot be neglected andsometimes decisive. The analytical models can be further optimized according todifferent characteristics of markets behaviour and economical situation.
5 CONCLUSIONIn this paper, a novel concept to model and evaluate overall competitiveness hasbeen proposed by integrating manufacturing strategy and transformationalleadership including technology level together. The empirical studies are focusedto case companies in China especially Chinese State-Owned ManufacturingEnterprise (CSOME). From the case CN_WG group, a typical CSOME studiedin this paper, some conclusions can be summarized as following: (1) the caseCN_WG is a highly competitive group corporation and in overall it has strongcompetitiveness especially in analyzer group. (2) Leadership index (LI) has amost significant impact on deciding total leadership index of the case CN_WG.
162 ActaWasaensia
KVALITA INOVÁCIA PROSPERITA / QUALITY INNOVATION PROSPERITY XIII/2 – 2009
ISSN 1335-1745
17
Manufacturing strategy index (MSI) has a negative effect on total leadership index (TLI) in all groups. Leaders should take the resource of the company into account when deciding manufacturing strategy of the company, as RI has a significant negative effect on MSI. (3) Manufacturing strategy index (MSI) has significant relationship with outcome index (OI), which implies that the outcome direction of leadership will have an important effect on manufacturing strategies. The OI is the key factor to direct the strategic goal and MSI is the driving force of the company, therefore the OC is proposed to be evaluated based on MSI andOI.
ACKNOWLEDGEMENT The authors gratefully acknowledge Yanshuang Li, Ye Liu, Jussi Pennanen and Rayko Toshev from our research group at the Department of Production, University of Vaasa, for their support in this research
REFERENCES Bass, B.M. (1985), Leadership and Performance beyond Expectations. New
York: Free Press. Bass, B.M. & Avolio, B.J. (1994), Improving Organizational Effectiveness
through Transformational Leadership. SAGE Publishing, USA. Bass, B.M. (1997), “Does the transactional - transformational leadership
paradigm transcend organizational and national boundaries?”, AmericanPsychologist, Vol. 52, 1997.
Kim, J.S. and Arnold, P. (1996), “Operationalizing manufacturing strategy-an exploratory study of constructs and linkage”, International Journal of Operation & Product Management, Vol. 16 No.12, pp.45-73.
Liu, Y., Li, Y., Takala, J., Kamdee, T., Toshev, R. (2008), “Improve company’s operative competitiveness using analytical models”, In Proc, IAMOT 1569082846, IAMOT 2008 ï The 17th International Conference on Management of Technology; Creating and Managing a Knowledge Economy,Dubai, United Arab Emirates, International Association for Management ofTechnology.
Liu, Y., Si, S., Takala, J. (2009), “Comparing operational competitiveness strategies in China and Finland”, In Proc, IAMOT 1569166675, IAMOT 2009 – The 18th International Conference on Management of Technology; Management of Green Technology, Orlando, Florida, USA, International Association for Management of Technology.
Madu, C.N., Aheto, J., Kuei, C. and Winokur, D. (1996), “Adoption of strategic total quality management philosophies: multi-criteria decision analysis
ActaWasaensia 163
KVALITA INOVÁCIA PROSPERITA / QUALITY INNOVATION PROSPERITY XIII/2 – 2009
ISSN 1335-1745
18
model”, International Journal of Quality & Reliability Management, Vol. 13 No. 3, pp.57-72.
Miles, R.E. and Snow, C.C. (1978), Organizational strategy, structure, andprocess, McGraw Hill, New York.
Nissinen, V. (2001), “Military leadership: A critical constructivist approach for conceptualizing, modelling and measuring military leadership in the Finnish defence forces”, Dissertation, MpKK JohtL, Edita Oy.
Phusavat, K., Kanchana, R. (2008), “Competitive priorities for service providers: perspectives from Thailand”, Industrial Management & Data Systems, Vol. 108 No. 1, pp.5-21.
Rangone, A. (1996), “An analytic hierarchy process framework for comparing the overall performance of manufacturing departments”, International Journal of Operations & Production Management, Vol. 16 No. 8, pp.104-119.
Saaty, T.L. (1980), The analytic hierarchy process, McGraw Hill, New York. Si, S., Takala, J., Liu, Y. (2008), “Competitiveness of Chinese high-tech
manufacturing companies in global context”, Industrial Management & Data Systems, Vol. 109 No. 3, pp.404-424.
Si, S., Liu, Y., Takala, J. and Sun, S. (2010), “Benchmarking and developing the operational competitiveness of Chinese state-owned manufacturing enterprises in a global context”, International Journal of Innovation andLearning, Vol. 7 No. 2, pp.202-222.
Takala, J. (2002), “Analysis and synthesising multifocused manufacturing strategies by analytical hierarchy process”, International Journal of Manufacturing Technology and Management, Vol. 4 No. 5, pp.345-350.
Takala, J., Hirvelä, J., Hiippala, P. and Nissinen, V. (2005), “Management anddeep leadership sand cone model for human resource allocation”, The 11th International Conference on Productivity and Quality Research, ICPQR'2005, December 12-15, 2005 New Delhi, India.
Takala J., Leskinen J., Sivusuo H., Hirvelä, J. and Kekäle, T. (2006),“The sand cone model: illustrating multi-focused strategies”, Management Decision, Emerald Group Publishing Ltd, Vol. 44 No. 3, pp. 335-345.
Takala, J., Hirvelä, J., Liu, Y., Malindzak, D. (2007a), “Global manufacturing strategies require “dynamic engineers”? Case study in Finnish industries”, Industrial Management & Data Systems, Vol. 107 No. 3, pp.326-344.
Takala, J., Kamdee, T., Hirvelä, J. and Kyllonen, S. (2007b), “Analytic calculation of global operative competitiveness”, In Proc, IAMOT
164 ActaWasaensia
KVALITA INOVÁCIA PROSPERITA / QUALITY INNOVATION PROSPERITY XIII/2 – 2009
ISSN 1335-1745
19
1569041789, IAMOT 2007 – The 16th International Conference on Management of Technology; Management of Technology for the ServiceEconomy, Orlando, Florida, USA, International Association for Management of Technology.
Takala, J., Kamdee, T., Hirvelä, J. and Kyllonen, S. (2007c), “Analytic calculation of global operative competitiveness: Case study in Finnish Industries”, In Proc, ISPIM 2007-XVIII, ID 43, 12 pages, International Society for Professional Innovation Manageme ehT :htworG rof noitavonnI ;tnChallenges for East & West, Warsaw, Poland.
Takala, J., Pennanen, J., Hiippala, P., Maunuksela, A., Kilpiö, O. (2008a), “Decision maker’s outcome as a function of transformational leadership”, InProc, IAMOT 2008 – The 17th International Conference on Management ofTechnology; Creating and Managing a Knowledge Economy , InternationalAssociation for Management of Technology, Dubai, United Arab Emirates.
Takala J., Kukkola A. and Pennanen J. (2008b), “Prospector, analyzer, and defender models in directions of outcome in transformational leadership”, The 17th International Conference of the Israel Society for Quality, ISAS ’08,November 18-20, 2008 Jerusalem, Israel.
Wernerfelt, B. (1984), “A resource-based view of the firm”, Strategy Management Journal, Vol.5, No.2, pp.170-180.
Zahedi, F. (1989), “Quantitative evaluation of micro versus larger database products”, Computers and Operations Research, Vol. 16 No. 6, pp.513-532.
Zgodavová, K. (2004), “On Irrationality of Financial Decision-Making: Case of Gearbox”, Computer Information System and Applications, Vol. II, pp. 304- 318, Bialstok University of Economics, Poland, ISBN 83-87256-68-4.
ABOUT THE AUTHORS Yang Liu, Department of Production, University of Vaasa, PL 700, 65101Vaasa, Finland, [email protected]. Josu Takala, Department of Production, University of Vaasa, PL 700,65101 Vaasa, Finland, [email protected]
ActaWasaensia 165
____________________Re-printed with permission of Inderscience Enterprises Ltd.
Appendix C.5
Int. J. Management and Enterprise Development, Vol. 9, No. 1, 2010 87
Copyright © 2010 Inderscience Enterprises Ltd.
Competitiveness development of Chinese manufacturing enterprises in global context for crisis management
Yang Liu* and Josu Takala Department of Production, University of Vaasa, P.O. Box 700, Vaasa 65101, Finland E-mail: [email protected] E-mail: [email protected] *Corresponding author
Abstract: This paper connects previous research in global competitiveness analysis, taking the impact of global financial crisis into account, to evaluate how manufacturing companies are able to manage crisis by adjusting their manufacturing strategy and transformational leadership together with technology level to improve operational competitiveness performance. It develops a theoretical approach of integrating the core factors which influence the operational competitiveness performance, i.e. manufacturing strategy, and transformational leadership with technology level, into conceptual analytical models to evaluate overall competitiveness. The empirical studies are focused to case companies in the most dynamic market – China, especially large- and medium-sized manufacturing enterprises, and compare their operational performances in global context. The overall competitiveness of multiple cases are studied using the proposed analytical models to conclude the experience of crisis management, which can become a model for crisis management studies of companies globally as well as foreign companies in China.
Keywords: enterprise development; manufacturing strategy; transformational leadership; technology level; competitiveness performance; crisis management.
Reference to this paper should be made as follows: Liu, Y. and Takala, J. (2010) ‘Competitiveness development of Chinese manufacturing enterprises in global context for crisis management’, Int. J. Management and Enterprise Development, Vol. 9, No. 1, pp.87–115.
Biographical notes: Yang Liu is a PhD Researcher in the Department of Production and a Part-Time Lecturer in the Department of Computer Science at the University of Vaasa, Finland. He also works as a Full-Time Senior Lecturer in the Department of Information Technology of Vaasa University of Applied Sciences, Finland. His research interests include the modelling, evaluation and optimisation of global operational competitiveness in manufacturing and technology strategies with transformational capabilities, performance analysis and enhancement of wireless communications.
Josu Takala is a Professor in Industrial Management and Vice Dean in the Faculty of Technology at the University of Vaasa, Finland, and was a Research Professor at the same university during 2006–2007 on global manufacturing strategies. He received his MSc (ElEng) from Tampere University of Technology in 1980 and DrTech (ElEng) in 1988 and business studies from
166 ActaWasaensia
88 Y. Liu and J. Takala
University of Vaasa. His interest is mainly technology management in the competitive strategies of private and public organisations in manufacturing networks by utilising the generic fields of quality management, technology strategy, new product development, production management, logistics and environmental management.
1 Introduction
With the fast growing economics, China – the most dynamic market and biggest manufacturing country will become the second largest economic entity in the world by 2010 according to Chinese economist’s forecast. The Chinese manufacturing industries are more and more competitive than ever before in the global market. The powerful Chinese economics have influenced the global market in many different areas. Everything seems to have been changed with the global economic downturn in which China prevails with its ongoing growth and huge market. China reveals more and more in leading its role in resolving the financial crisis. What has been the main driving force to keep the Chinese economics growing during the crisis? To study how Chinese enterprises are dealing with the crisis will give other foreign enterprises good indications of development routes, and therefore help them to deal with the turbulent business situations.
Chinese large- and medium-sized manufacturing enterprises (CLMME), typically state-owned holding companies, are the largest group and the most representative type of companies in China. CLMME produce majority of Chinese GDP (e.g. over 75% in 2007) and they are also majority portion of top 500 companies in China. As a fact, CLMME is the backbone and primary driving force of the growing Chinese economics even despite of the global economic downturn, and therefore the crisis management experiences of CLMME are valuable to study. Although the case studies are done for multiple CLMME cases of different industries, the results are commonly representative for majority Chinese manufacturing enterprises since mostly they share very similar characteristics.
In this paper, we mainly focus on crisis management, manufacturing strategy and transformational leadership together with technology level for CLMME, and finding solutions to overcome the crisis, based on empirical studies in China. ‘China effect’ has influenced business and manufacturing strategies globally in many different business areas (Takala et al., 2007a). We have brought the influence of ‘China effect’ and global financial crisis together to study how such will impact the operational competitiveness of CLMME on top of their previous manufacturing strategy and transformational leadership including technology level before crisis, and how CLMME will react during crisis to adjust their current manufacturing strategy and transformational leadership to manage the crisis, and even the predictions after crisis how CLMME will minimise the negative impacts from the crisis to keep their optimal operational competitiveness. We promote a novel concept of overall competitiveness to evaluate the performance of companies in global context before, during and after crisis by integrating the evaluation of manufacturing strategy and transformational leadership with technology level together using analytical models created in this paper. With global economic downturn, this research mainly focuses on how to manage and overcome the crisis when the business is
ActaWasaensia 167
Competitiveness development of Chinese manufacturing enterprises 89
in adversity. Managing crisis successfully is typically more challenging than managing growing up business in prosperity.
The theoretical reference framework of this paper starts from resource-based view of a firm for case study (Menguc et al., 2007; Wernerfelt, 1984). Avella et al. (2001) considered that the emphasis on certain manufacturing competitive priorities or capabilities and decisions or practices on the key decision areas and their internal coherence can be the base for achieving sustainable or lasting advantages over competitors, thus originating superior business performance. Takala et al. (2007a) have presented justification of multi-focused manufacturing strategies. Miles and Snow (1978) have defined four company groups which include prospector, analyser, defender and reactor. According to Miles and Snow (1978), on the contrary to the three groups which are prospector, analyser and defender, reactor does not lead to a consistent and stable organisation and therefore it is advised to change over to one of the other three groups. Based on this theory, Takala et al. (2007b) have introduced unique analytical model to evaluate global competitiveness rankings for manufacturing strategies in prospector, analyser and defender groups according to the company’s multi-criteria priority weights of Q(Quality), C(Cost), T(Time) and F(Flexibility). Such analytical models are used to gain insight into the influences and sensitivities of various parameters and processes on the alteration of manufacturing strategies. In China, the most dynamic market, Liu et al. (2008) have first time applied such analytical models to analyse and improve operational competitiveness of one private middle-size Chinese manufacturing company by adjusting competitive priorities in manufacturing strategy. Liu et al. (2009) have compared the operational competitiveness strategies in China and other countries in a global context by utilising same analytical models, in order to analyse different characteristics of manufacturing strategies in different markets and suggest how the companies can improve their operational competitiveness. But the adjustment of manufacturing strategy alone is not just enough to improve the overall competitiveness to develop the business under new business situations. Menguc et al. (2007) suggested that the improvements of transformational leadership-based competencies should lead to marketplace positional advantages through competitive strategies. Therefore, manufacturing strategy is one important factor and transformational leadership is another important and necessary factor to improve the overall competitiveness no matter in adversity or in prosperity, and can be even more decisive (Bass, 1985). Bass and Avolio (1994) provided evidence on the benefits and effectiveness of transformational leadership on leadership and training of leaders. Transformational leaders help their subordinates to learn and develop as individuals by encouraging and motivating them with a versatile repertoire of behavioural and decision-making capability (Bass, 1997; Bass and Avolio, 1994). Takala et al. (2008) introduced another unique analytical model to evaluate the level of outcome direction, leadership behaviour and resource allocation of transformational leadership. Tracey et al. (1999) suggested that organisations must formulate strategic plans that are consistent with the use of manufacturing technology to be successful in this globally competitive and rapidly changing environment. O’Regan and Ghobadian (2005) suggested that the level of technology deployed will impact on the overall strategic planning process and its main drivers: leadership and organisational culture resulting in differing levels of corporate performance. From these implications, in this paper transformational leadership is further extended by adding technology level, which is classified as spearhead technology, core technology and basic technology, as part of resource allocation. The objective here is to create a new analytical model to integrate manufacturing strategy and
168 ActaWasaensia
90 Y. Liu and J. Takala
transformational leadership including technology level together for more comprehensive evaluation of overall competitiveness to identify and manage the crisis situation. This paper continues further in China with deeper insight analysis of overall competitiveness of CLMME and suggests how to improve the overall competitiveness in order to manage the crisis situation. The related case studies include benchmarking and development of overall competitiveness of multiple CLMME cases in global context which emphasise more on the adjustment of its manufacturing strategy and transformational leadership including technology level to improve overall competitiveness in regional and global market during crisis, and forecasting the ongoing business in economic upturn after crisis.
The structure of this paper is as follow. Section 2 introduces research methodologies. Section 3 models the integration of manufacturing strategy and transformational leadership including technology level to evaluate overall competitiveness. Section 4 analyses the overall competitiveness of CLMME cases before, during and after crisis. Section 5 discusses the findings of crisis management according to analytical evaluation results. Section 6 studies how CLMME generally manage the crisis and finds solutions to overcome the crisis. Section 7 proposes the future research. Finally, Section 8 draws conclusions.
2 Research methodologies
2.1 Analytic hierarchy process method
Analytic hierarchy process (AHP) method (Saaty, 1980) is a multi-attribute decision instrument that allows considering quantitative, qualitative measures and making trade-offs. The AHP is used in this study to deal with the empirical part, which includes analysing questionnaires and calculating weights of main criteria and sub-criteria. AHP is aimed at integrating different measures into single overall score for ranking decision alternatives with pairwise comparison of chosen attributes (Rangone, 1996). This utilises pairwise comparison by interviewing the experts within the whole organisation. AHP-based models can comprehensively explore the varying degrees of importance of the indicators and drivers of competitiveness (Sirikrai and Tang, 2006). The AHP-based instruments (forms and questionnaires) have been used in our case studies for more than 20 years in successful analysis of case companies and proved to be reliable. Furthermore, some open questions are used in additional to the pairwise comparisons in the AHP questionnaires to add internal validity to the answers. The inconsistency ratio (ICR) has been calculated to assure the reliability of pairwise comparison results. Only matrixes with inconsistency value of 0.10 or less, and 0.30 or less in smaller groups with competent informants, can be used for reliable decision making. Otherwise the answers are considered as invalid and will not be used in the case studies.
The procedures of utilising the AHP are as follow in this study. The first step is to establish the model of hierarchy structure for the goal. In this study, the hierarchy models are constructed for the evaluation of manufacturing strategy by Takala et al. (2007b) and transformational leadership by Takala et al. (2008), which serves as theoretical framework of this study. The second step is the comparison of the alternatives and the criteria. They are pairwise compared with respect to each element of the next higher level. The last step is connecting the comparisons so that to get the priorities of the alternatives with respect to each criteria and the weights of each criteria with respect to
ActaWasaensia 169
Competitiveness development of Chinese manufacturing enterprises 91
the goal. The local priorities are then multiplied by the weights of the respective criteria. The results are summed up to get the overall priority of each alternative.
2.2 Data collection and analysis
The data of all case studies have been collected by answering questionnaires from senior managers or directors of different case companies. The interviewees are normally decision makers and middle management groups in the case companies, who have good knowledge about the operations of the case companies, and the number of informants is depended on the size of case company. In many cases, only a few informants from each company are enough to give consistent answers. If the operations are communicated well in the case companies, the deviation in the answers from same company should be little. To get objective and reliable answers, the following steps have been taken. Firstly, the informants were trained to understand every criteria of the questionnaire by e-mail, telephone or interview, but no hints were given in order not to bias their answers. Secondly, after they finished the questionnaires the answers were analysed by AHP software. Finally, discussions with the informants revealed the results and verified the reliabilities of the data further.
For studying the manufacturing strategy, competitiveness priorities are listed in the AHP questionnaires as main criteria consisting of quality, cost, time/delivery and flexibility. The main criteria are typical items used in evaluating the competitiveness priorities in multi-focused manufacturing strategies (Spina et al., 1996). They are formed based on typical case studies and instruments used in interviews. The sub-criteria involve 19 criterions, such as low defect rate, low cost, fast delivery, broad product line, etc. The weights are statistically measured for further analysis with analytical model (Takala et al., 2007b).
For studying the transformational leadership, leadership profiles are empirically measured with the theoretical frame of reference by AHP questionnaires (Takala et al., 2006). Statistical tests are made to find out the logic in the leadership profiles to increase the accuracy in the profiles, and in parallel by induction analytical model is built and tested statistically to measure leadership skills by leadership indexes from resource utilisations to leadership behaviours and finally to outcome directions and outcomes. Analytical model is further used to measure the effectiveness of leadership actions within different areas of outcomes and try to find out the correlation between these outcomes and leadership indexes in a forecasting way (Takala et al., 2008).
For studying the technology level, the weights of spearhead technology, core technology, and basic technology are collected by interviewing the expert informants directly.
2.3 Research questions
1 For the manufacturing strategy, because of the impact of global financial crisis, the downturn market and different customer behaviour have forced the companies to play with high flexibility, e.g. change of production volume and exploring new market. Companies will also focus on cutting down the cost more than ever before. CLMME can be very competitive before crisis, but will its competitive level drop during crisis? What could be the best group for CLMME to compete during crisis?
170 ActaWasaensia
92 Y. Liu and J. Takala
2 For the transformational leadership, will it be able to play as a turning key for CLMME to manage the crisis? Can technology level improve total leadership index?
3 Will overall competitiveness of CLMME really drop during crisis? Can it be still improved after crisis compared to before crisis?
2.4 Case study and case company
The research is based on doing numerous case studies for CLMME to analyse with existing analytical models and to create new analytical models for further evaluation, therefore the selection of case companies must be mostly representative, well performed and highly experienced in managing crisis. The CLMME cases are chosen among 10 major backbone industries of Chinese economics. Altogether nine CLMME cases have been studied, which cover industries including iron and steel, non-ferrous metal, mining, chemistry, construction, energy, equipments manufacturing, R&D, service and logistics. Based on such wide variation of industries and performances in exercising of strategy and leadership, the chosen case companies are well representative for Chinese manufacturing enterprises in the empirical study.
For side by side comparisons in performance of crisis management, we have also chosen several large- and median-sized manufacturing case companies in comparable size and similar industries from several European countries, including Finland which is known for its highly competitive technologies, Slovakia which is manufacturing base for many European and multinational companies, Spain which is another major European manufacturing centre and Iceland which is badly hit by the economic crisis. In each country, there are around 4–5 cases that have been studied. All the case studies in these countries are carried out using exactly the same methodologies as how the case studies are done in China.
3 Modelling of overall competitiveness
In this study, we propose to evaluate overall competitiveness based on two core factors, i.e. manufacturing strategy and transformational leadership. Technology level is proposed to be considered as part of resources of under transformational leadership. Existing analytical models are examined and new analytical models are proposed to integrate the two core factors as a holistic model to evaluate overall competitiveness.
3.1 Analytical models for manufacturing strategy
The analytical models for manufacturing strategy are used to calculate the operational competitiveness indexes of companies in the different groups, which are prospector, analyser and defender. According to Takala (2007a), the responsiveness, agility and leanness (RAL) holistic model supports the theory of the analytical models using four main criteria, i.e. quality, cost, time and flexibility. The analytical models are developed from our research group based on over 100 case company studies in over 10 countries worldwide, whose industrial branch varies from one to another and company size varies from big to small but they share one thing in common which is that they all compete in a
ActaWasaensia 171
Competitiveness development of Chinese manufacturing enterprises 93
highly dynamic business environment and therefore such analytical model has good transferability.
According to Takala et al. (2007b), the manufacturing strategy index (MSI) is modelled based on the multi-criteria priority weights of Q(Quality), C(Cost), T(Time) and F(Flexibility), as function MSIMSI ( , , , )f Q C T F .
The equations to calculate weights of core factors are as follow:
% QQQ C T
(1)
% CCQ C T
(2)
% TTQ C T
(3)
% FFQ C T F
(4)
where Q = Quality, C = Cost, T = Time, F = Flexibility. The analytical models to calculate the MSIs of operational competitiveness in each
group are as follow.
The analytical model for prospector group: 1/3 1/3~ 1 1 % 1 0.9 % (1 0.9 %) %Q T C F (5)
The analytical model for analyser group: 1/3
(0.95 % 0.285) 0.95 % 0.285~1 (1 %) ABS
0.95 % 0.285
Q TF
C (6)
The analytical model for defender group: 1/3 1/3~ 1 1 % 1 0.9 % (1 0.9 %) %C T Q F (7)
3.2 Analytical models for transformational leadership with technology level
Based on previous work by Takala et al. (2008), new analytical models are further developed by integrating technology into resource for the evaluations of leadership indexes and its outcomes of transformational leadership. These models are the outcome direction index which balances the directions; the leadership behaviour index which measures deep leadership, the maximum passive and/or controlling leadership and the utilisation of the cornerstones of deep leadership in different ways; and the resource allocation index which balances the utilisation of human resources. Outcome index (OI) is based on weights of factors i.e. effectiveness (EF), satisfaction (SA), extra effort (EE), therefore OI is modelled as function OIOI (EF,SA,EE)f . Leadership index (LI) is based on weights of factors i.e. deep leadership (DL), passive leadership (PL), controlling leadership (CL) and individualised consideration (IC), inspirational motivation (IM),
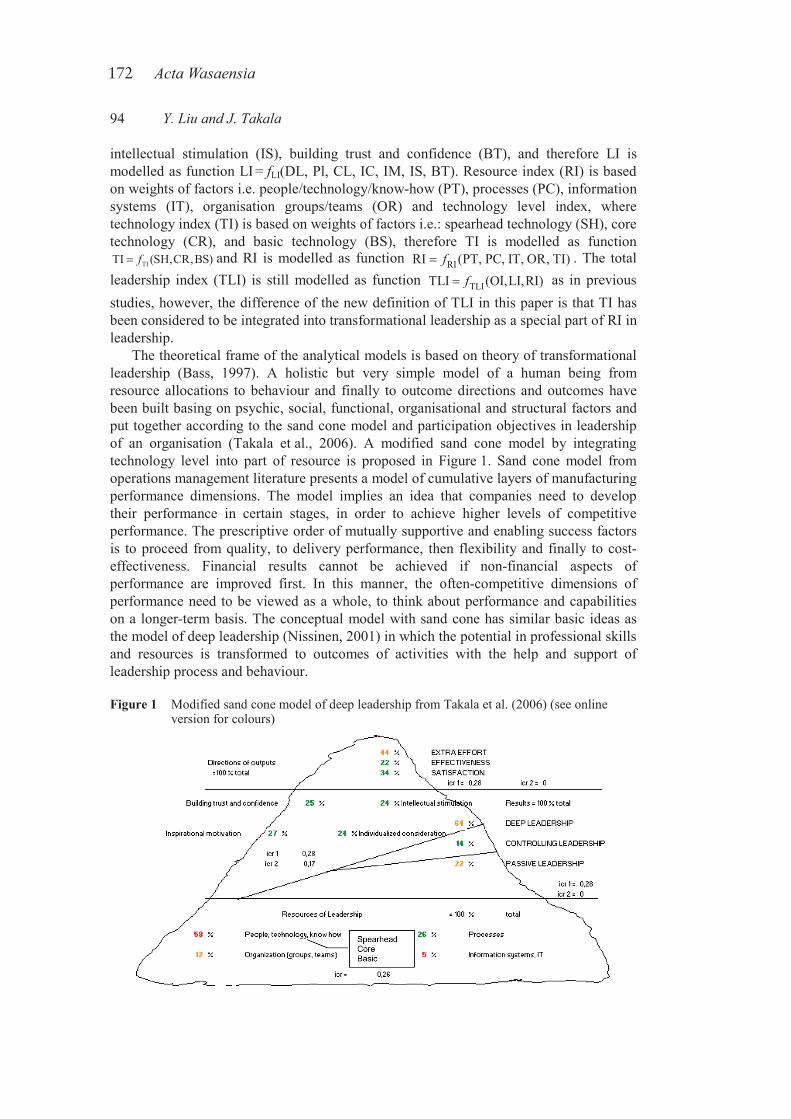
172 ActaWasaensia
94 Y. Liu and J. Takala
intellectual stimulation (IS), building trust and confidence (BT), and therefore LI is modelled as function LI = fLI(DL, Pl, CL, IC, IM, IS, BT). Resource index (RI) is based on weights of factors i.e. people/technology/know-how (PT), processes (PC), information systems (IT), organisation groups/teams (OR) and technology level index, where technology index (TI) is based on weights of factors i.e.: spearhead technology (SH), core technology (CR), and basic technology (BS), therefore TI is modelled as function
TITI (SH,CR,BS)f and RI is modelled as function RIRI (PT, PC, IT, OR, TI)f . The total leadership index (TLI) is still modelled as function TLITLI (OI,LI,RI)f as in previous studies, however, the difference of the new definition of TLI in this paper is that TI has been considered to be integrated into transformational leadership as a special part of RI in leadership.
The theoretical frame of the analytical models is based on theory of transformational leadership (Bass, 1997). A holistic but very simple model of a human being from resource allocations to behaviour and finally to outcome directions and outcomes have been built basing on psychic, social, functional, organisational and structural factors and put together according to the sand cone model and participation objectives in leadership of an organisation (Takala et al., 2006). A modified sand cone model by integrating technology level into part of resource is proposed in Figure 1. Sand cone model from operations management literature presents a model of cumulative layers of manufacturing performance dimensions. The model implies an idea that companies need to develop their performance in certain stages, in order to achieve higher levels of competitive performance. The prescriptive order of mutually supportive and enabling success factors is to proceed from quality, to delivery performance, then flexibility and finally to cost-effectiveness. Financial results cannot be achieved if non-financial aspects of performance are improved first. In this manner, the often-competitive dimensions of performance need to be viewed as a whole, to think about performance and capabilities on a longer-term basis. The conceptual model with sand cone has similar basic ideas as the model of deep leadership (Nissinen, 2001) in which the potential in professional skills and resources is transformed to outcomes of activities with the help and support of leadership process and behaviour.
Figure 1 Modified sand cone model of deep leadership from Takala et al. (2006) (see online version for colours)
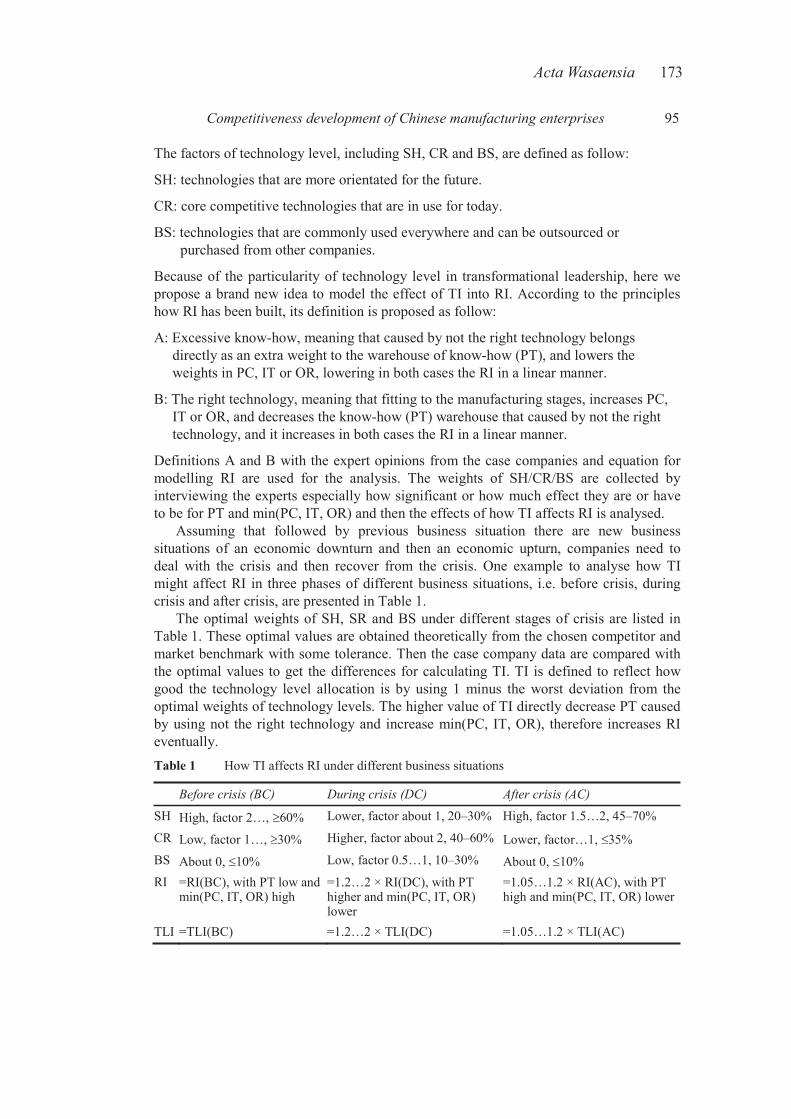
ActaWasaensia 173
Competitiveness development of Chinese manufacturing enterprises 95
The factors of technology level, including SH, CR and BS, are defined as follow:
SH: technologies that are more orientated for the future.
CR: core competitive technologies that are in use for today.
BS: technologies that are commonly used everywhere and can be outsourced or purchased from other companies.
Because of the particularity of technology level in transformational leadership, here we propose a brand new idea to model the effect of TI into RI. According to the principles how RI has been built, its definition is proposed as follow:
A: Excessive know-how, meaning that caused by not the right technology belongs directly as an extra weight to the warehouse of know-how (PT), and lowers the weights in PC, IT or OR, lowering in both cases the RI in a linear manner.
B: The right technology, meaning that fitting to the manufacturing stages, increases PC, IT or OR, and decreases the know-how (PT) warehouse that caused by not the right technology, and it increases in both cases the RI in a linear manner.
Definitions A and B with the expert opinions from the case companies and equation for modelling RI are used for the analysis. The weights of SH/CR/BS are collected by interviewing the experts especially how significant or how much effect they are or have to be for PT and min(PC, IT, OR) and then the effects of how TI affects RI is analysed.
Assuming that followed by previous business situation there are new business situations of an economic downturn and then an economic upturn, companies need to deal with the crisis and then recover from the crisis. One example to analyse how TI might affect RI in three phases of different business situations, i.e. before crisis, during crisis and after crisis, are presented in Table 1.
The optimal weights of SH, SR and BS under different stages of crisis are listed in Table 1. These optimal values are obtained theoretically from the chosen competitor and market benchmark with some tolerance. Then the case company data are compared with the optimal values to get the differences for calculating TI. TI is defined to reflect how good the technology level allocation is by using 1 minus the worst deviation from the optimal weights of technology levels. The higher value of TI directly decrease PT caused by using not the right technology and increase min(PC, IT, OR), therefore increases RI eventually. Table 1 How TI affects RI under different business situations
Before crisis (BC) During crisis (DC) After crisis (AC)
SH High, factor 2…, 60% Lower, factor about 1, 20–30% High, factor 1.5…2, 45–70%
CR Low, factor 1…, 30% Higher, factor about 2, 40–60% Lower, factor…1, 35% BS About 0, 10% Low, factor 0.5…1, 10–30% About 0, 10% RI =RI(BC), with PT low and
min(PC, IT, OR) high =1.2…2 × RI(DC), with PT higher and min(PC, IT, OR) lower
=1.05…1.2 × RI(AC), with PT high and min(PC, IT, OR) lower
TLI =TLI(BC) =1.2…2 × TLI(DC) =1.05…1.2 × TLI(AC)
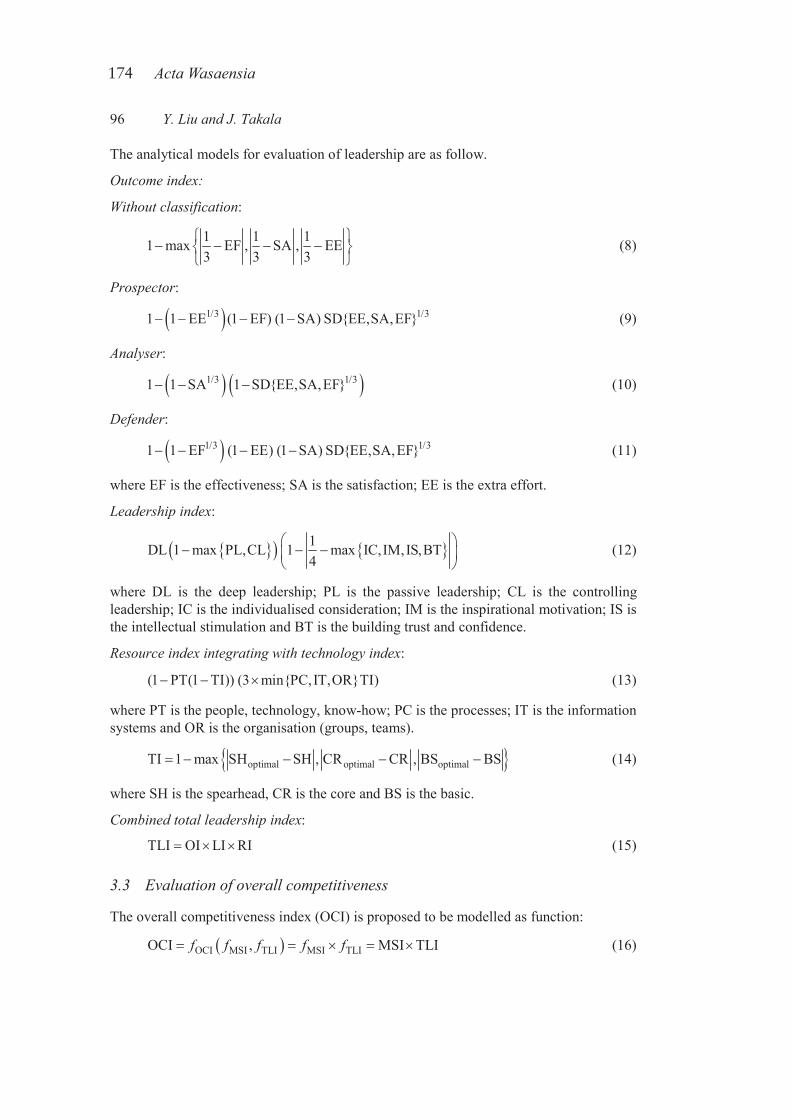
174 ActaWasaensia
96 Y. Liu and J. Takala
The analytical models for evaluation of leadership are as follow.
Outcome index:
Without classification:
1 1 11 max EF , SA , EE3 3 3
(8)
Prospector:
1/3 1/31 1 EE (1 EF) (1 SA) SD{EE,SA,EF} (9)
Analyser:
1/3 1/31 1 SA 1 SD{EE,SA,EF} (10)
Defender:
1/3 1/31 1 EF (1 EE) (1 SA) SD{EE,SA,EF} (11)
where EF is the effectiveness; SA is the satisfaction; EE is the extra effort.
Leadership index:
1DL 1 max PL,CL 1 max IC,IM,IS,BT4
(12)
where DL is the deep leadership; PL is the passive leadership; CL is the controlling leadership; IC is the individualised consideration; IM is the inspirational motivation; IS is the intellectual stimulation and BT is the building trust and confidence.
Resource index integrating with technology index:
(1 PT(1 TI)) (3 min{PC,IT,OR}TI) (13)
where PT is the people, technology, know-how; PC is the processes; IT is the information systems and OR is the organisation (groups, teams).
optimal optimal optimalTI 1 max SH SH , CR CR , BS BS (14)
where SH is the spearhead, CR is the core and BS is the basic.
Combined total leadership index:
TLI OI LI RI (15)
3.3 Evaluation of overall competitiveness
The overall competitiveness index (OCI) is proposed to be modelled as function:
OCI MSI TLI MSI TLIOCI , MSI TLIf f f f f (16)
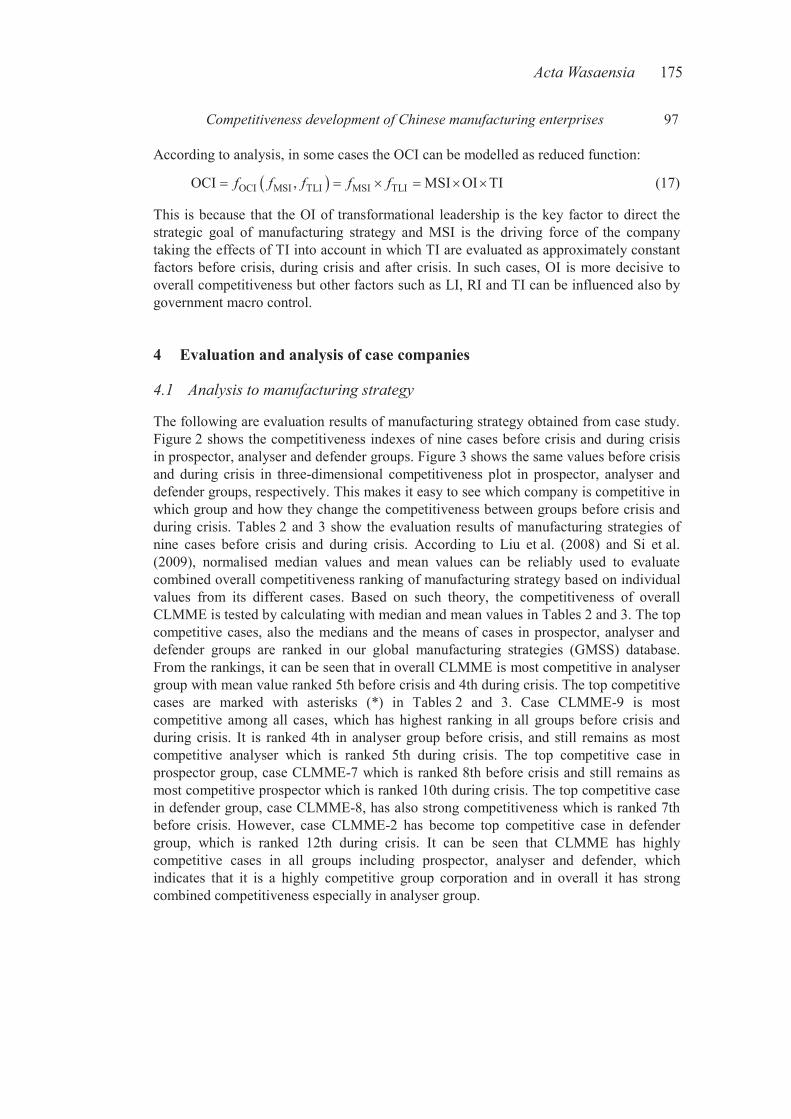
ActaWasaensia 175
Competitiveness development of Chinese manufacturing enterprises 97
According to analysis, in some cases the OCI can be modelled as reduced function:
OCI MSI TLI MSI TLIOCI , MSI OI TIf f f f f (17)
This is because that the OI of transformational leadership is the key factor to direct the strategic goal of manufacturing strategy and MSI is the driving force of the company taking the effects of TI into account in which TI are evaluated as approximately constant factors before crisis, during crisis and after crisis. In such cases, OI is more decisive to overall competitiveness but other factors such as LI, RI and TI can be influenced also by government macro control.
4 Evaluation and analysis of case companies
4.1 Analysis to manufacturing strategy
The following are evaluation results of manufacturing strategy obtained from case study. Figure 2 shows the competitiveness indexes of nine cases before crisis and during crisis in prospector, analyser and defender groups. Figure 3 shows the same values before crisis and during crisis in three-dimensional competitiveness plot in prospector, analyser and defender groups, respectively. This makes it easy to see which company is competitive in which group and how they change the competitiveness between groups before crisis and during crisis. Tables 2 and 3 show the evaluation results of manufacturing strategies of nine cases before crisis and during crisis. According to Liu et al. (2008) and Si et al. (2009), normalised median values and mean values can be reliably used to evaluate combined overall competitiveness ranking of manufacturing strategy based on individual values from its different cases. Based on such theory, the competitiveness of overall CLMME is tested by calculating with median and mean values in Tables 2 and 3. The top competitive cases, also the medians and the means of cases in prospector, analyser and defender groups are ranked in our global manufacturing strategies (GMSS) database. From the rankings, it can be seen that in overall CLMME is most competitive in analyser group with mean value ranked 5th before crisis and 4th during crisis. The top competitive cases are marked with asterisks (*) in Tables 2 and 3. Case CLMME-9 is most competitive among all cases, which has highest ranking in all groups before crisis and during crisis. It is ranked 4th in analyser group before crisis, and still remains as most competitive analyser which is ranked 5th during crisis. The top competitive case in prospector group, case CLMME-7 which is ranked 8th before crisis and still remains as most competitive prospector which is ranked 10th during crisis. The top competitive case in defender group, case CLMME-8, has also strong competitiveness which is ranked 7th before crisis. However, case CLMME-2 has become top competitive case in defender group, which is ranked 12th during crisis. It can be seen that CLMME has highly competitive cases in all groups including prospector, analyser and defender, which indicates that it is a highly competitive group corporation and in overall it has strong combined competitiveness especially in analyser group.
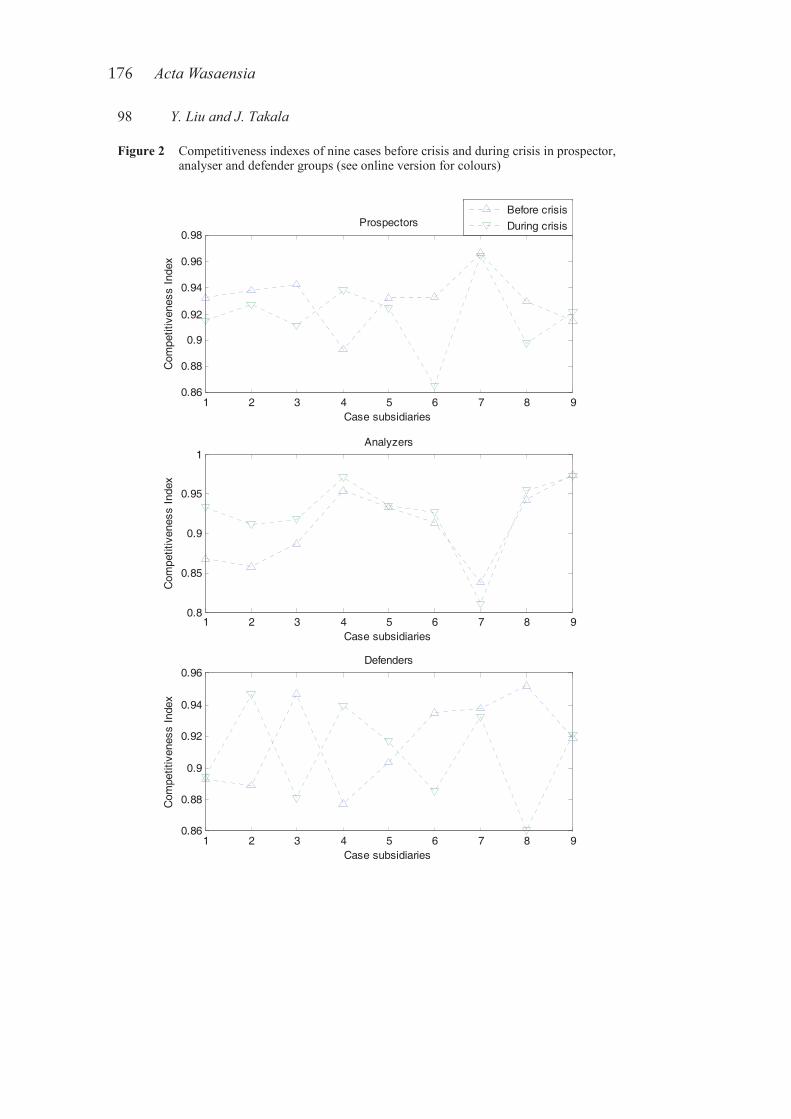
176 ActaWasaensia
98 Y. Liu and J. Takala
Figure 2 Competitiveness indexes of nine cases before crisis and during crisis in prospector, analyser and defender groups (see online version for colours)
1 2 3 4 5 6 7 8 90.86
0.88
0.9
0.92
0.94
0.96
0.98
Case subsidiaries
Com
petit
iven
ess
Inde
x
ProspectorsBefore crisisDuring crisis
1 2 3 4 5 6 7 8 90.8
0.85
0.9
0.95
1
Case subsidiaries
Com
petit
iven
ess
Inde
x
Analyzers
1 2 3 4 5 6 7 8 90.86
0.88
0.9
0.92
0.94
0.96
Case subsidiaries
Com
petit
iven
ess
Inde
x
Defenders
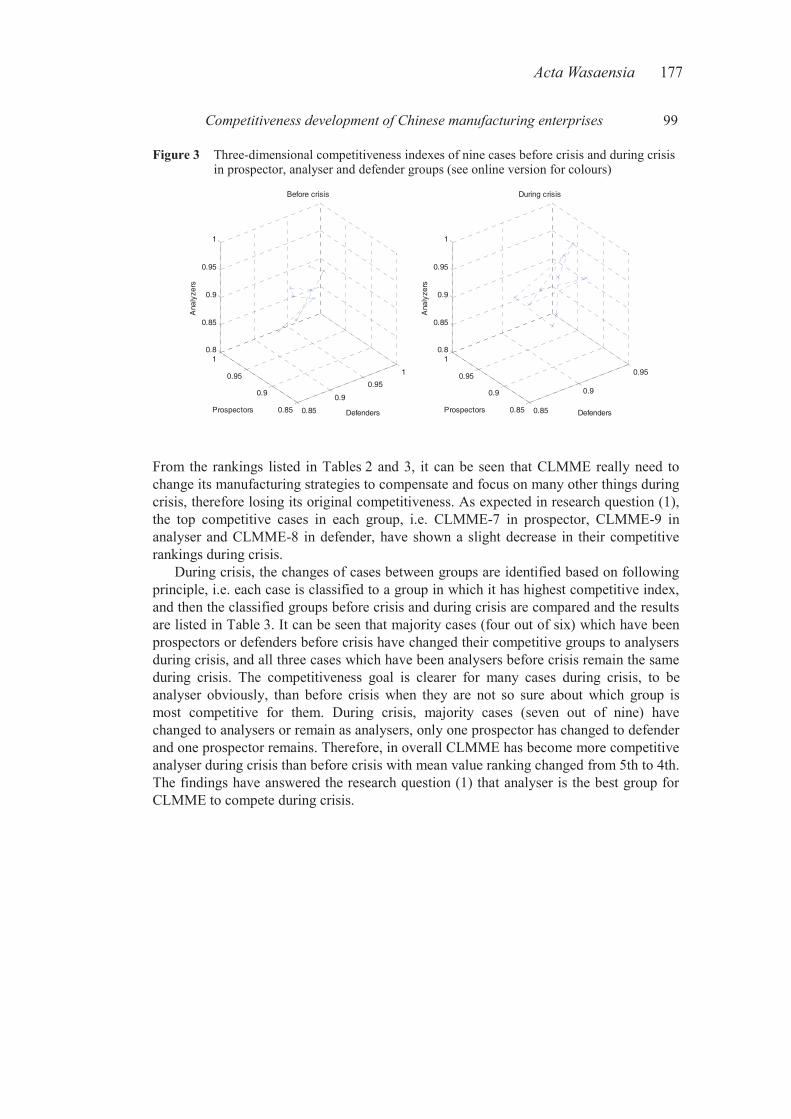
ActaWasaensia 177
98 Y. Liu and J. Takala
Figure 2 Competitiveness indexes of nine cases before crisis and during crisis in prospector, analyser and defender groups (see online version for colours)
1 2 3 4 5 6 7 8 90.86
0.88
0.9
0.92
0.94
0.96
0.98
Case subsidiaries
Com
petit
iven
ess
Inde
x
ProspectorsBefore crisisDuring crisis
1 2 3 4 5 6 7 8 90.8
0.85
0.9
0.95
1
Case subsidiaries
Com
petit
iven
ess
Inde
x
Analyzers
1 2 3 4 5 6 7 8 90.86
0.88
0.9
0.92
0.94
0.96
Case subsidiaries
Com
petit
iven
ess
Inde
x
Defenders
Competitiveness development of Chinese manufacturing enterprises 99
Figure 3 Three-dimensional competitiveness indexes of nine cases before crisis and during crisis in prospector, analyser and defender groups (see online version for colours)
0.85
0.9
0.95
1
0.85
0.9
0.95
10.8
0.85
0.9
0.95
1
Defenders
Before crisis
Prospectors
Ana
lyze
rs
0.85
0.9
0.95
0.85
0.9
0.95
10.8
0.85
0.9
0.95
1
Defenders
During crisis
Prospectors
Ana
lyze
rs
From the rankings listed in Tables 2 and 3, it can be seen that CLMME really need to change its manufacturing strategies to compensate and focus on many other things during crisis, therefore losing its original competitiveness. As expected in research question (1), the top competitive cases in each group, i.e. CLMME-7 in prospector, CLMME-9 in analyser and CLMME-8 in defender, have shown a slight decrease in their competitive rankings during crisis.
During crisis, the changes of cases between groups are identified based on following principle, i.e. each case is classified to a group in which it has highest competitive index, and then the classified groups before crisis and during crisis are compared and the results are listed in Table 3. It can be seen that majority cases (four out of six) which have been prospectors or defenders before crisis have changed their competitive groups to analysers during crisis, and all three cases which have been analysers before crisis remain the same during crisis. The competitiveness goal is clearer for many cases during crisis, to be analyser obviously, than before crisis when they are not so sure about which group is most competitive for them. During crisis, majority cases (seven out of nine) have changed to analysers or remain as analysers, only one prospector has changed to defender and one prospector remains. Therefore, in overall CLMME has become more competitive analyser during crisis than before crisis with mean value ranking changed from 5th to 4th. The findings have answered the research question (1) that analyser is the best group for CLMME to compete during crisis.
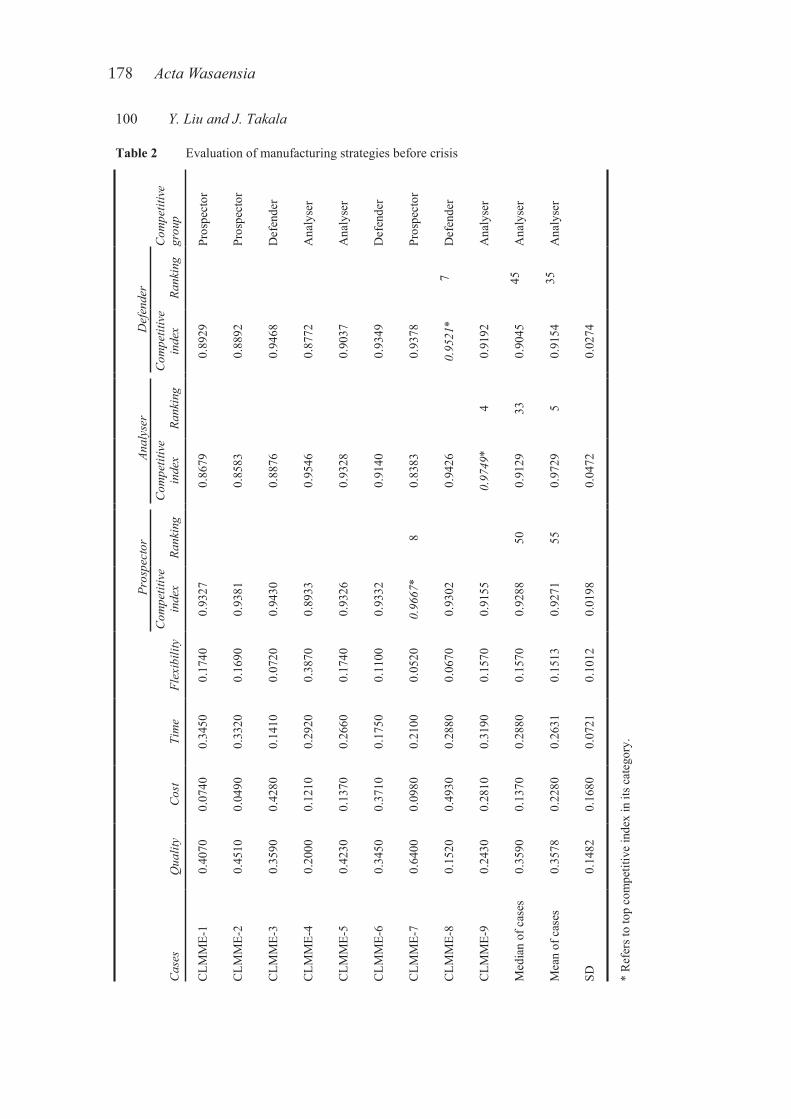
178 ActaWasaensia
100 Y. Liu and J. Takala
Table 2 Evaluation of manufacturing strategies before crisis C
ompe
titiv
e gr
oup
Pros
pect
or
Pros
pect
or
Def
ende
r
Ana
lyse
r
Ana
lyse
r
Def
ende
r
Pros
pect
or
Def
ende
r
Ana
lyse
r
Ana
lyse
r
Ana
lyse
r
Rank
ing
7 45 35
Def
ende
rC
ompe
titiv
e in
dex
0.89
29
0.88
92
0.94
68
0.87
72
0.90
37
0.93
49
0.93
78
0.95
21*
0.91
92
0.90
45
0.91
54
0.02
74
Rank
ing
4 33 5
Anal
yser
Com
petit
ive
inde
x
0.86
79
0.85
83
0.88
76
0.95
46
0.93
28
0.91
40
0.83
83
0.94
26
0.97
49*
0.91
29
0.97
29
0.04
72
Rank
ing
8 50 55
Pros
pect
orC
ompe
titiv
e in
dex
0.93
27
0.93
81
0.94
30
0.89
33
0.93
26
0.93
32
0.96
67*
0.93
02
0.91
55
0.92
88
0.92
71
0.01
98
Flex
ibili
ty
0.17
40
0.16
90
0.07
20
0.38
70
0.17
40
0.11
00
0.05
20
0.06
70
0.15
70
0.15
70
0.15
13
0.10
12
Tim
e
0.34
50
0.33
20
0.14
10
0.29
20
0.26
60
0.17
50
0.21
00
0.28
80
0.31
90
0.28
80
0.26
31
0.07
21
Cos
t
0.07
40
0.04
90
0.42
80
0.12
10
0.13
70
0.37
10
0.09
80
0.49
30
0.28
10
0.13
70
0.22
80
0.16
80
Qua
lity
0.40
70
0.45
10
0.35
90
0.20
00
0.42
30
0.34
50
0.64
00
0.15
20
0.24
30
0.35
90
0.35
78
0.14
82
Cas
es
CLM
ME-
1
CLM
ME-
2
CLM
ME-
3
CLM
ME-
4
CLM
ME-
5
CLM
ME-
6
CLM
ME-
7
CLM
ME-
8
CLM
ME-
9
Med
ian
of c
ases
Mea
n of
cas
es
SD
* R
efer
s to
top
com
petit
ive
inde
x in
its c
ateg
ory.
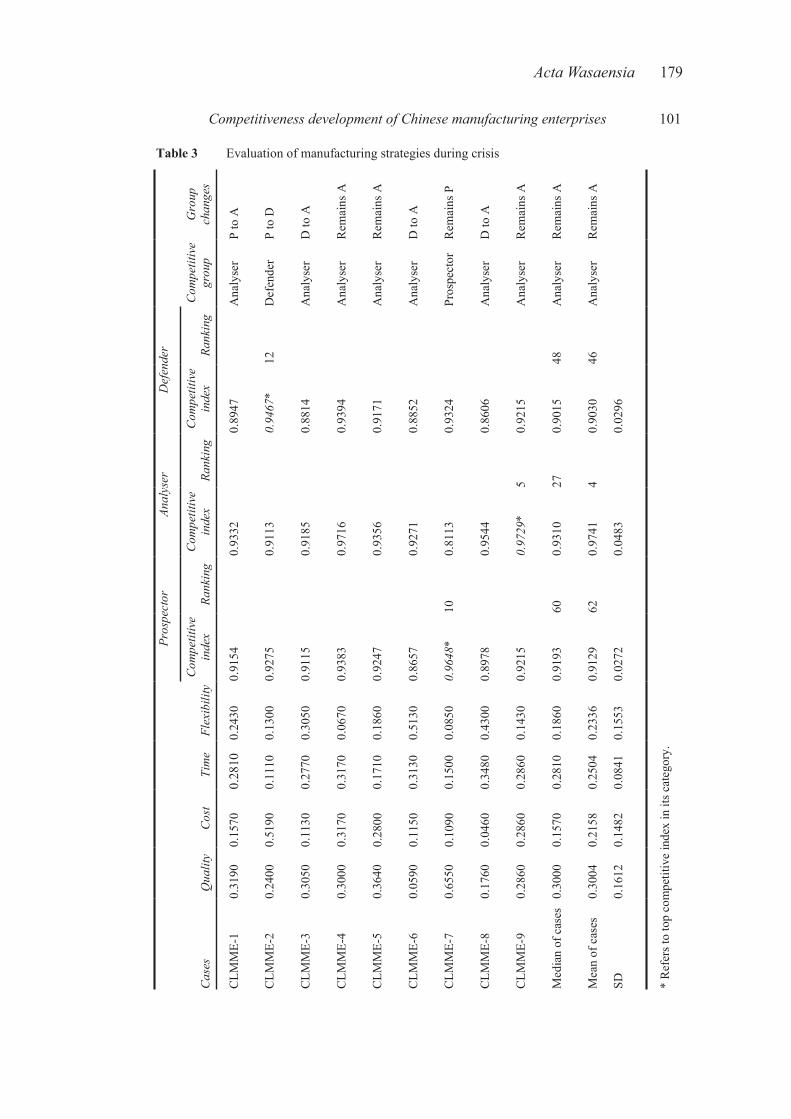
ActaWasaensia 179
Competitiveness development of Chinese manufacturing enterprises 101
Table 3 Evaluation of manufacturing strategies during crisis
Gro
up
chan
ges
P to
A
P to
D
D to
A
Rem
ains
A
Rem
ains
A
D to
A
Rem
ains
P
D to
A
Rem
ains
A
Rem
ains
A
Rem
ains
A
Com
petit
ive
grou
p
Ana
lyse
r
Def
ende
r
Ana
lyse
r
Ana
lyse
r
Ana
lyse
r
Ana
lyse
r
Pros
pect
or
Ana
lyse
r
Ana
lyse
r
Ana
lyse
r
Ana
lyse
r
Rank
ing
12 48 46
Def
ende
r
Com
petit
ive
inde
x
0.89
47
0.94
67*
0.88
14
0.93
94
0.91
71
0.88
52
0.93
24
0.86
06
0.92
15
0.90
15
0.90
30
0.02
96
Rank
ing
5 27 4
Anal
yser
Com
petit
ive
inde
x
0.93
32
0.91
13
0.91
85
0.97
16
0.93
56
0.92
71
0.81
13
0.95
44
0.97
29*
0.93
10
0.97
41
0.04
83
Rank
ing
10 60 62
Pros
pect
or
Com
petit
ive
inde
x
0.91
54
0.92
75
0.91
15
0.93
83
0.92
47
0.86
57
0.96
48*
0.89
78
0.92
15
0.91
93
0.91
29
0.02
72
Flex
ibili
ty
0.24
30
0.13
00
0.30
50
0.06
70
0.18
60
0.51
30
0.08
50
0.43
00
0.14
30
0.18
60
0.23
36
0.15
53
Tim
e
0.28
10
0.11
10
0.27
70
0.31
70
0.17
10
0.31
30
0.15
00
0.34
80
0.28
60
0.28
10
0.25
04
0.08
41
Cos
t
0.15
70
0.51
90
0.11
30
0.31
70
0.28
00
0.11
50
0.10
90
0.04
60
0.28
60
0.15
70
0.21
58
0.14
82
Qua
lity
0.31
90
0.24
00
0.30
50
0.30
00
0.36
40
0.05
90
0.65
50
0.17
60
0.28
60
0.30
00
0.30
04
0.16
12
Cas
es
CLM
ME-
1
CLM
ME-
2
CLM
ME-
3
CLM
ME-
4
CLM
ME-
5
CLM
ME-
6
CLM
ME-
7
CLM
ME-
8
CLM
ME-
9
Med
ian
of c
ases
Mea
n of
cas
es
SD
* R
efer
s to
top
com
petit
ive
inde
x in
its c
ateg
ory.
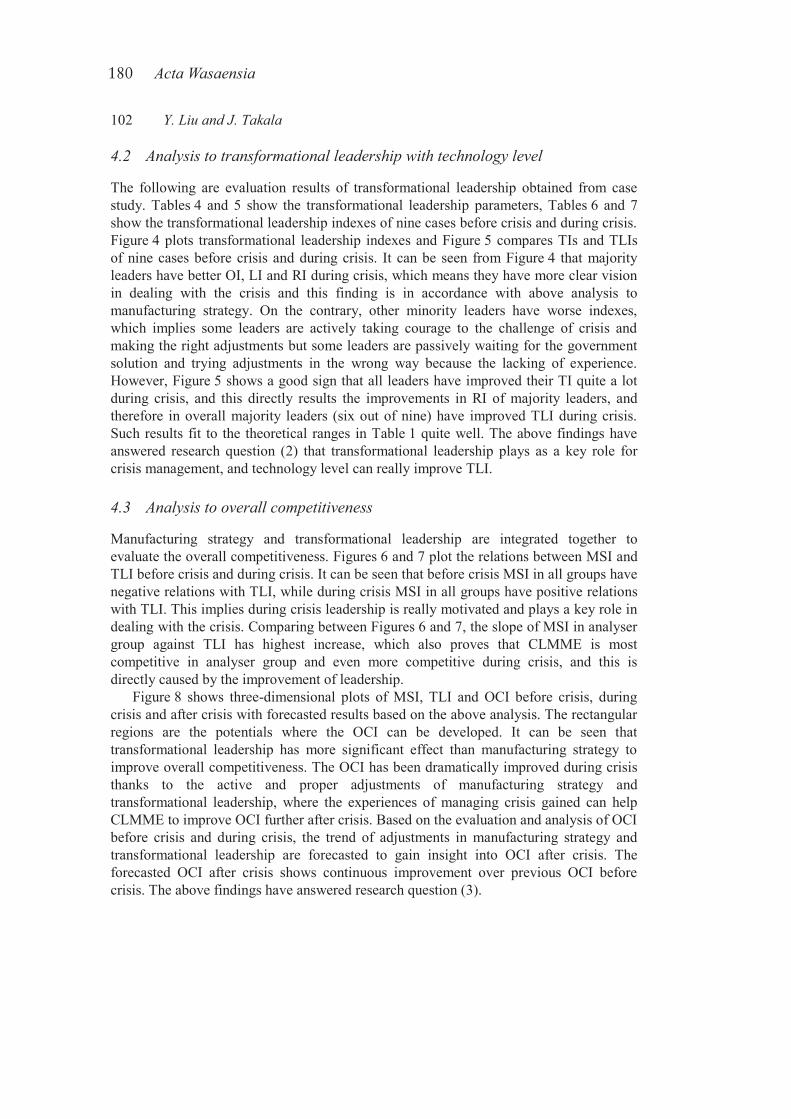
180 ActaWasaensia
102 Y. Liu and J. Takala
4.2 Analysis to transformational leadership with technology level
The following are evaluation results of transformational leadership obtained from case study. Tables 4 and 5 show the transformational leadership parameters, Tables 6 and 7 show the transformational leadership indexes of nine cases before crisis and during crisis. Figure 4 plots transformational leadership indexes and Figure 5 compares TIs and TLIs of nine cases before crisis and during crisis. It can be seen from Figure 4 that majority leaders have better OI, LI and RI during crisis, which means they have more clear vision in dealing with the crisis and this finding is in accordance with above analysis to manufacturing strategy. On the contrary, other minority leaders have worse indexes, which implies some leaders are actively taking courage to the challenge of crisis and making the right adjustments but some leaders are passively waiting for the government solution and trying adjustments in the wrong way because the lacking of experience. However, Figure 5 shows a good sign that all leaders have improved their TI quite a lot during crisis, and this directly results the improvements in RI of majority leaders, and therefore in overall majority leaders (six out of nine) have improved TLI during crisis. Such results fit to the theoretical ranges in Table 1 quite well. The above findings have answered research question (2) that transformational leadership plays as a key role for crisis management, and technology level can really improve TLI.
4.3 Analysis to overall competitiveness
Manufacturing strategy and transformational leadership are integrated together to evaluate the overall competitiveness. Figures 6 and 7 plot the relations between MSI and TLI before crisis and during crisis. It can be seen that before crisis MSI in all groups have negative relations with TLI, while during crisis MSI in all groups have positive relations with TLI. This implies during crisis leadership is really motivated and plays a key role in dealing with the crisis. Comparing between Figures 6 and 7, the slope of MSI in analyser group against TLI has highest increase, which also proves that CLMME is most competitive in analyser group and even more competitive during crisis, and this is directly caused by the improvement of leadership.
Figure 8 shows three-dimensional plots of MSI, TLI and OCI before crisis, during crisis and after crisis with forecasted results based on the above analysis. The rectangular regions are the potentials where the OCI can be developed. It can be seen that transformational leadership has more significant effect than manufacturing strategy to improve overall competitiveness. The OCI has been dramatically improved during crisis thanks to the active and proper adjustments of manufacturing strategy and transformational leadership, where the experiences of managing crisis gained can help CLMME to improve OCI further after crisis. Based on the evaluation and analysis of OCI before crisis and during crisis, the trend of adjustments in manufacturing strategy and transformational leadership are forecasted to gain insight into OCI after crisis. The forecasted OCI after crisis shows continuous improvement over previous OCI before crisis. The above findings have answered research question (3).
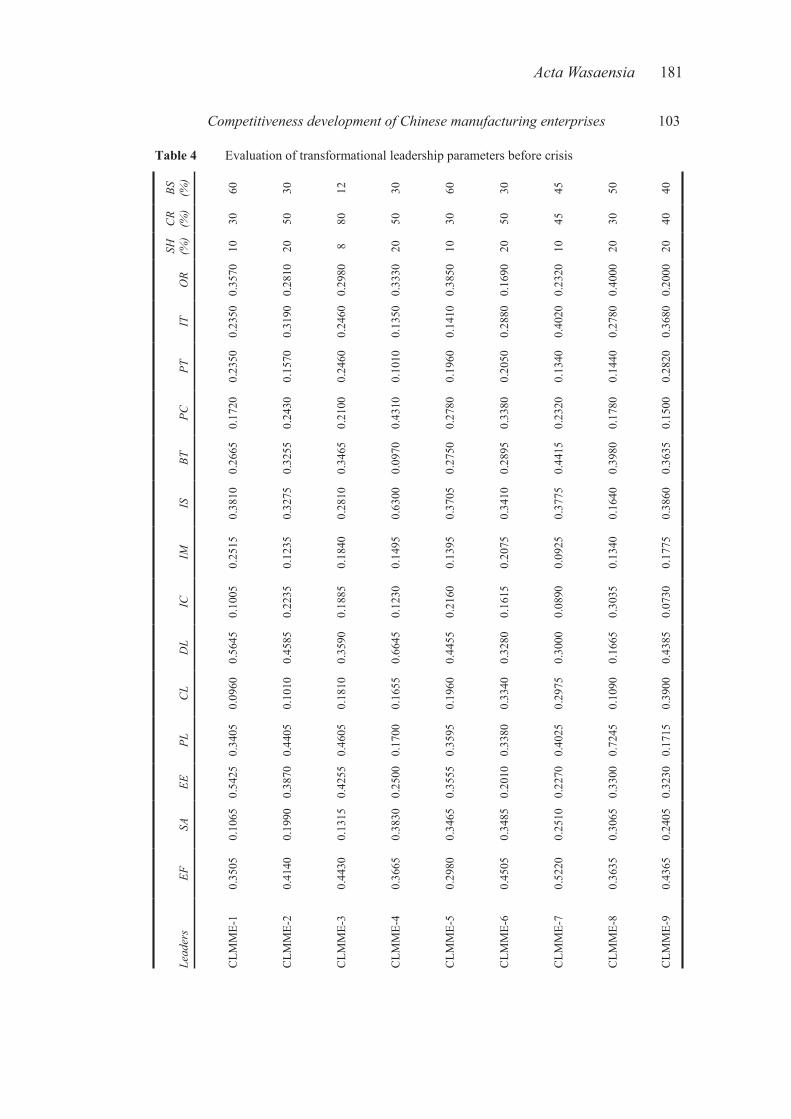
ActaWasaensia 181
Competitiveness development of Chinese manufacturing enterprises 103
Table 4 Evaluation of transformational leadership parameters before crisis BS
(%
)
60 30 12 30 60 30 45 50 40
CR
(%)
30 50 80 50 30 50 45 30 40
SH
(%)
10 20 8 20 10 20 10 20 20
OR
0.35
70
0.28
10
0.29
80
0.33
30
0.38
50
0.16
90
0.23
20
0.40
00
0.20
00
IT
0.23
50
0.31
90
0.24
60
0.13
50
0.14
10
0.28
80
0.40
20
0.27
80
0.36
80
PT
0.23
50
0.15
70
0.24
60
0.10
10
0.19
60
0.20
50
0.13
40
0.14
40
0.28
20
PC
0.17
20
0.24
30
0.21
00
0.43
10
0.27
80
0.33
80
0.23
20
0.17
80
0.15
00
BT
0.26
65
0.32
55
0.34
65
0.09
70
0.27
50
0.28
95
0.44
15
0.39
80
0.36
35
IS
0.38
10
0.32
75
0.28
10
0.63
00
0.37
05
0.34
10
0.37
75
0.16
40
0.38
60
IM
0.25
15
0.12
35
0.18
40
0.14
95
0.13
95
0.20
75
0.09
25
0.13
40
0.17
75
IC
0.10
05
0.22
35
0.18
85
0.12
30
0.21
60
0.16
15
0.08
90
0.30
35
0.07
30
DL
0.56
45
0.45
85
0.35
90
0.66
45
0.44
55
0.32
80
0.30
00
0.16
65
0.43
85
CL
0.09
60
0.10
10
0.18
10
0.16
55
0.19
60
0.33
40
0.29
75
0.10
90
0.39
00
PL
0.34
05
0.44
05
0.46
05
0.17
00
0.35
95
0.33
80
0.40
25
0.72
45
0.17
15
EE
0.54
25
0.38
70
0.42
55
0.25
00
0.35
55
0.20
10
0.22
70
0.33
00
0.32
30
SA
0.10
65
0.19
90
0.13
15
0.38
30
0.34
65
0.34
85
0.25
10
0.30
65
0.24
05
EF
0.35
05
0.41
40
0.44
30
0.36
65
0.29
80
0.45
05
0.52
20
0.36
35
0.43
65
Lead
ers
CLM
ME-
1
CLM
ME-
2
CLM
ME-
3
CLM
ME-
4
CLM
ME-
5
CLM
ME-
6
CLM
ME-
7
CLM
ME-
8
CLM
ME-
9
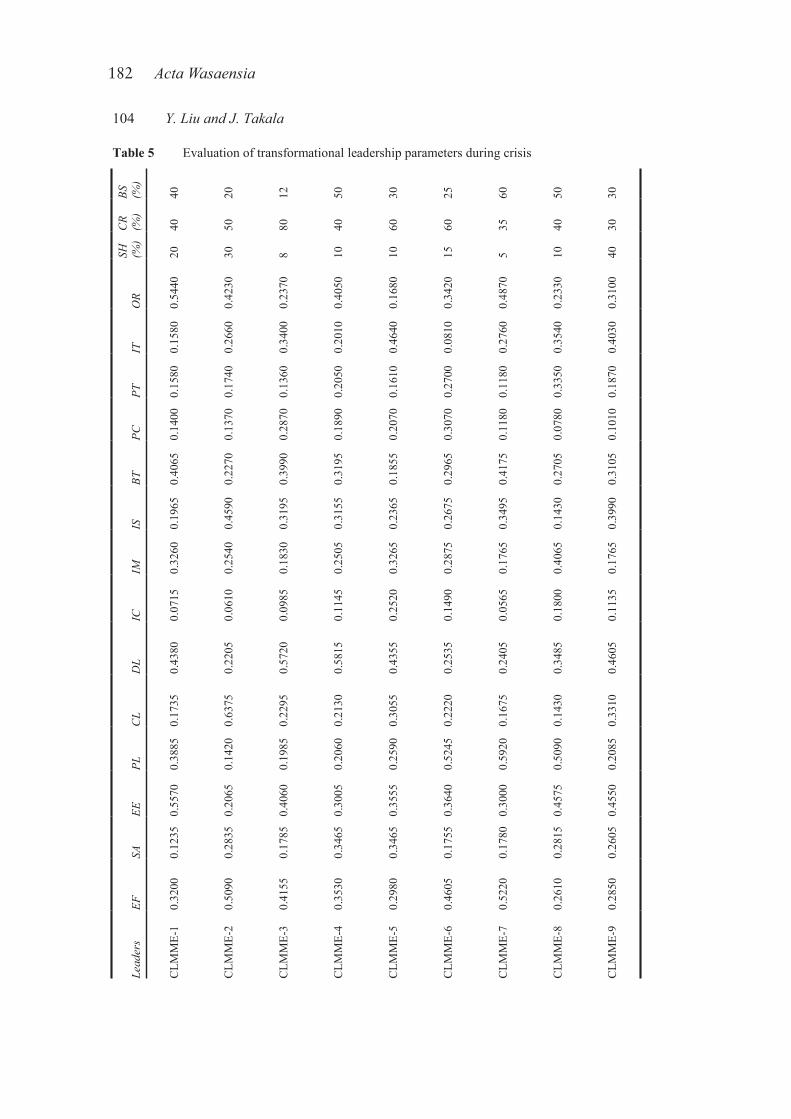
182 ActaWasaensia
104 Y. Liu and J. Takala
Table 5 Evaluation of transformational leadership parameters during crisis
BS
(%)
40 20 12 50 30 25 60 50 30
CR
(%)
40 50 80 40 60 60 35 40 30
SH
(%)
20 30 8 10 10 15 5 10 40
OR
0.54
40
0.42
30
0.23
70
0.40
50
0.16
80
0.34
20
0.48
70
0.23
30
0.31
00
IT 0.15
80
0.26
60
0.34
00
0.20
10
0.46
40
0.08
10
0.27
60
0.35
40
0.40
30
PT 0.15
80
0.17
40
0.13
60
0.20
50
0.16
10
0.27
00
0.11
80
0.33
50
0.18
70
PC 0.14
00
0.13
70
0.28
70
0.18
90
0.20
70
0.30
70
0.11
80
0.07
80
0.10
10
BT 0.40
65
0.22
70
0.39
90
0.31
95
0.18
55
0.29
65
0.41
75
0.27
05
0.31
05
IS 0.19
65
0.45
90
0.31
95
0.31
55
0.23
65
0.26
75
0.34
95
0.14
30
0.39
90
IM 0.32
60
0.25
40
0.18
30
0.25
05
0.32
65
0.28
75
0.17
65
0.40
65
0.17
65
IC 0.07
15
0.06
10
0.09
85
0.11
45
0.25
20
0.14
90
0.05
65
0.18
00
0.11
35
DL
0.43
80
0.22
05
0.57
20
0.58
15
0.43
55
0.25
35
0.24
05
0.34
85
0.46
05
CL
0.17
35
0.63
75
0.22
95
0.21
30
0.30
55
0.22
20
0.16
75
0.14
30
0.33
10
PL 0.38
85
0.14
20
0.19
85
0.20
60
0.25
90
0.52
45
0.59
20
0.50
90
0.20
85
EE 0.55
70
0.20
65
0.40
60
0.30
05
0.35
55
0.36
40
0.30
00
0.45
75
0.45
50
SA 0.12
35
0.28
35
0.17
85
0.34
65
0.34
65
0.17
55
0.17
80
0.28
15
0.26
05
EF 0.32
00
0.50
90
0.41
55
0.35
30
0.29
80
0.46
05
0.52
20
0.26
10
0.28
50
Lead
ers
CLM
ME-
1
CLM
ME-
2
CLM
ME-
3
CLM
ME-
4
CLM
ME-
5
CLM
ME-
6
CLM
ME-
7
CLM
ME-
8
CLM
ME-
9
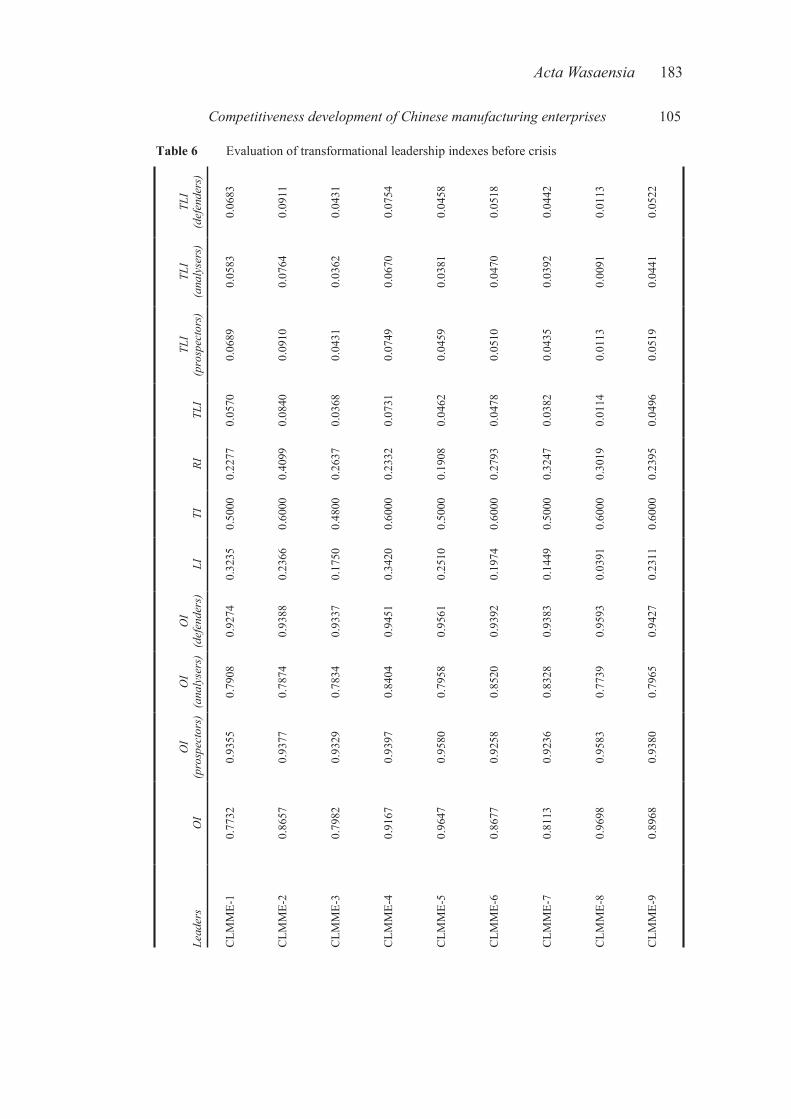
ActaWasaensia 183
Competitiveness development of Chinese manufacturing enterprises 105
Table 6 Evaluation of transformational leadership indexes before crisis
TLI
(def
ende
rs)
0.06
83
0.09
11
0.04
31
0.07
54
0.04
58
0.05
18
0.04
42
0.01
13
0.05
22
TLI
(ana
lyse
rs)
0.05
83
0.07
64
0.03
62
0.06
70
0.03
81
0.04
70
0.03
92
0.00
91
0.04
41
TLI
(pro
spec
tors
)
0.06
89
0.09
10
0.04
31
0.07
49
0.04
59
0.05
10
0.04
35
0.01
13
0.05
19
TLI
0.05
70
0.08
40
0.03
68
0.07
31
0.04
62
0.04
78
0.03
82
0.01
14
0.04
96
RI
0.22
77
0.40
99
0.26
37
0.23
32
0.19
08
0.27
93
0.32
47
0.30
19
0.23
95
TI
0.50
00
0.60
00
0.48
00
0.60
00
0.50
00
0.60
00
0.50
00
0.60
00
0.60
00
LI
0.32
35
0.23
66
0.17
50
0.34
20
0.25
10
0.19
74
0.14
49
0.03
91
0.23
11
OI
(def
ende
rs)
0.92
74
0.93
88
0.93
37
0.94
51
0.95
61
0.93
92
0.93
83
0.95
93
0.94
27
OI
(ana
lyse
rs)
0.79
08
0.78
74
0.78
34
0.84
04
0.79
58
0.85
20
0.83
28
0.77
39
0.79
65
OI
(pro
spec
tors
)
0.93
55
0.93
77
0.93
29
0.93
97
0.95
80
0.92
58
0.92
36
0.95
83
0.93
80
OI
0.77
32
0.86
57
0.79
82
0.91
67
0.96
47
0.86
77
0.81
13
0.96
98
0.89
68
Lead
ers
CLM
ME-
1
CLM
ME-
2
CLM
ME-
3
CLM
ME-
4
CLM
ME-
5
CLM
ME-
6
CLM
ME-
7
CLM
ME-
8
CLM
ME-
9
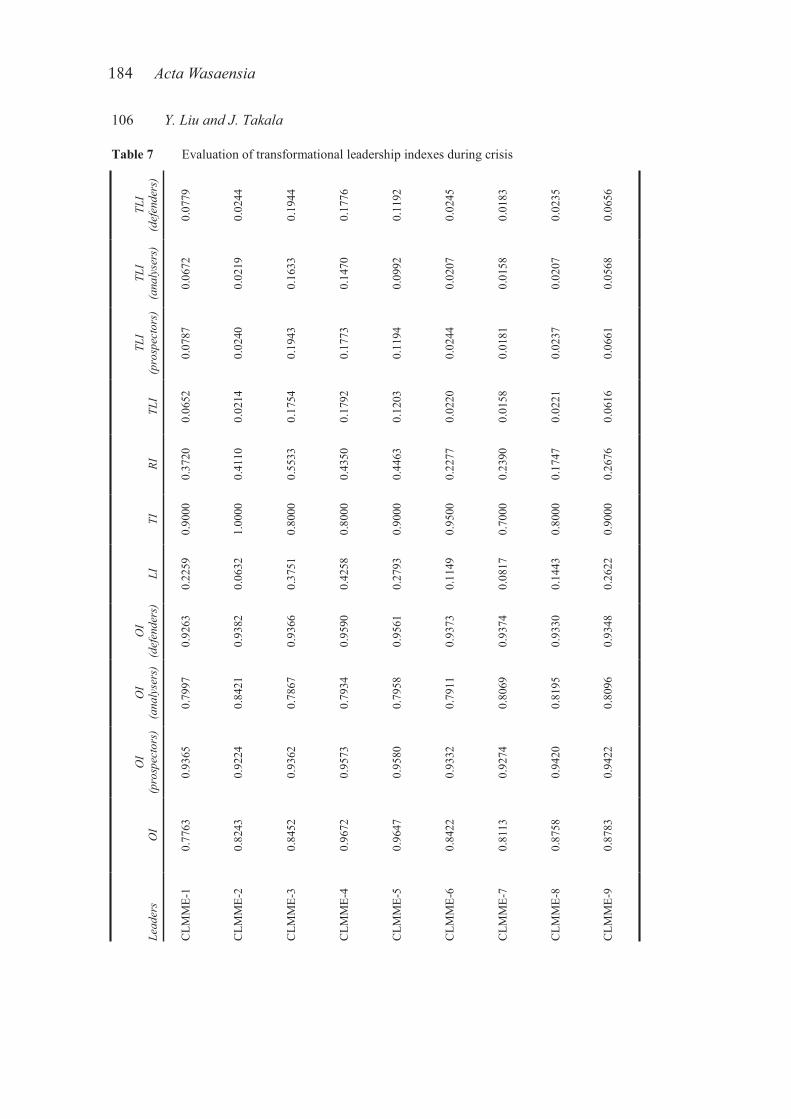
184 ActaWasaensia
106 Y. Liu and J. Takala
Table 7 Evaluation of transformational leadership indexes during crisis TL
I(d
efen
ders
)
0.07
79
0.02
44
0.19
44
0.17
76
0.11
92
0.02
45
0.01
83
0.02
35
0.06
56
TLI
(ana
lyse
rs)
0.06
72
0.02
19
0.16
33
0.14
70
0.09
92
0.02
07
0.01
58
0.02
07
0.05
68
TLI
(pro
spec
tors
)
0.07
87
0.02
40
0.19
43
0.17
73
0.11
94
0.02
44
0.01
81
0.02
37
0.06
61
TLI
0.06
52
0.02
14
0.17
54
0.17
92
0.12
03
0.02
20
0.01
58
0.02
21
0.06
16
RI
0.37
20
0.41
10
0.55
33
0.43
50
0.44
63
0.22
77
0.23
90
0.17
47
0.26
76
TI
0.90
00
1.00
00
0.80
00
0.80
00
0.90
00
0.95
00
0.70
00
0.80
00
0.90
00
LI
0.22
59
0.06
32
0.37
51
0.42
58
0.27
93
0.11
49
0.08
17
0.14
43
0.26
22
OI
(def
ende
rs)
0.92
63
0.93
82
0.93
66
0.95
90
0.95
61
0.93
73
0.93
74
0.93
30
0.93
48
OI
(ana
lyse
rs)
0.79
97
0.84
21
0.78
67
0.79
34
0.79
58
0.79
11
0.80
69
0.81
95
0.80
96
OI
(pro
spec
tors
)
0.93
65
0.92
24
0.93
62
0.95
73
0.95
80
0.93
32
0.92
74
0.94
20
0.94
22
OI
0.77
63
0.82
43
0.84
52
0.96
72
0.96
47
0.84
22
0.81
13
0.87
58
0.87
83
Lead
ers
CLM
ME-
1
CLM
ME-
2
CLM
ME-
3
CLM
ME-
4
CLM
ME-
5
CLM
ME-
6
CLM
ME-
7
CLM
ME-
8
CLM
ME-
9
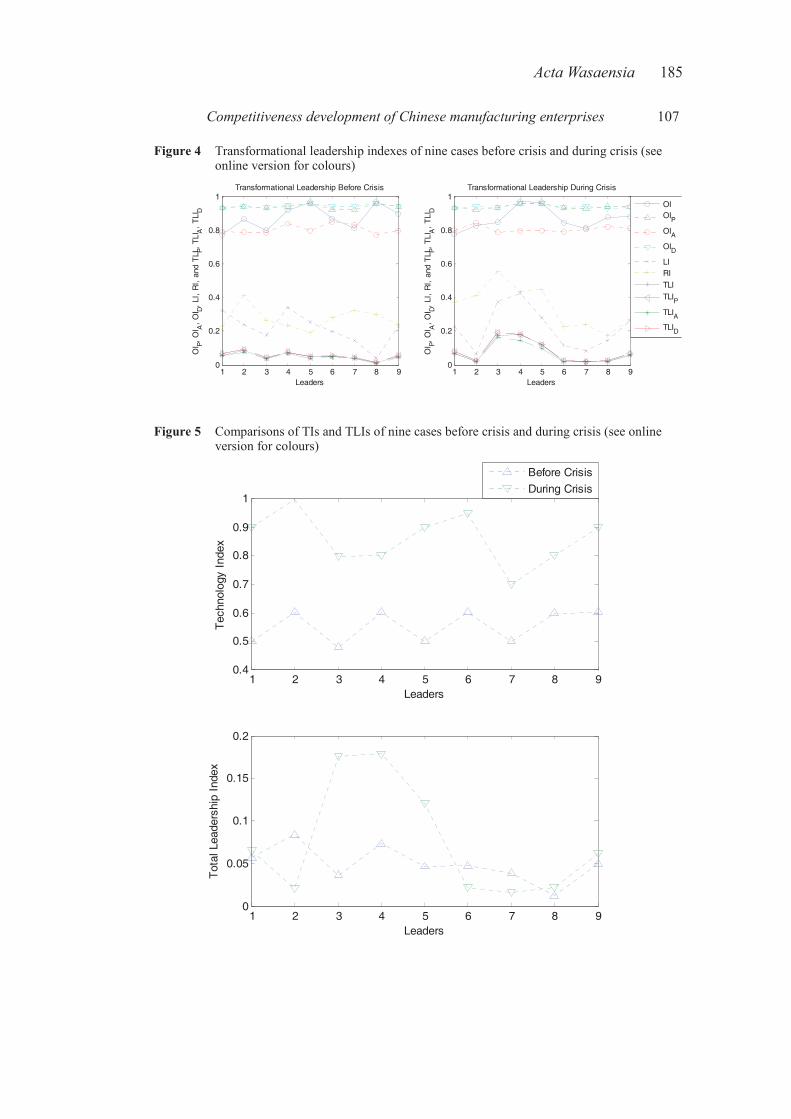
ActaWasaensia 185
Competitiveness development of Chinese manufacturing enterprises 107
Figure 4 Transformational leadership indexes of nine cases before crisis and during crisis (see online version for colours)
1 2 3 4 5 6 7 8 90
0.2
0.4
0.6
0.8
1
Leaders
OI P, O
I A, O
I D, L
I, R
I, a
nd T
LI P, TLI
A,
TLI D
Transformational Leadership Before Crisis
1 2 3 4 5 6 7 8 90
0.2
0.4
0.6
0.8
1
Leaders
OI P, O
I A, O
I D, L
I, R
I, a
nd T
LI P, TLI
A,
TLI D
Transformational Leadership During Crisis
OIOIPOIAOIDLIRITLITLIPTLIATLID
Figure 5 Comparisons of TIs and TLIs of nine cases before crisis and during crisis (see online version for colours)
1 2 3 4 5 6 7 8 90.4
0.5
0.6
0.7
0.8
0.9
1
Leaders
Tec
hnol
ogy
Inde
x
Before CrisisDuring Crisis
1 2 3 4 5 6 7 8 90
0.05
0.1
0.15
0.2
Leaders
Tot
al L
eade
rshi
p In
dex
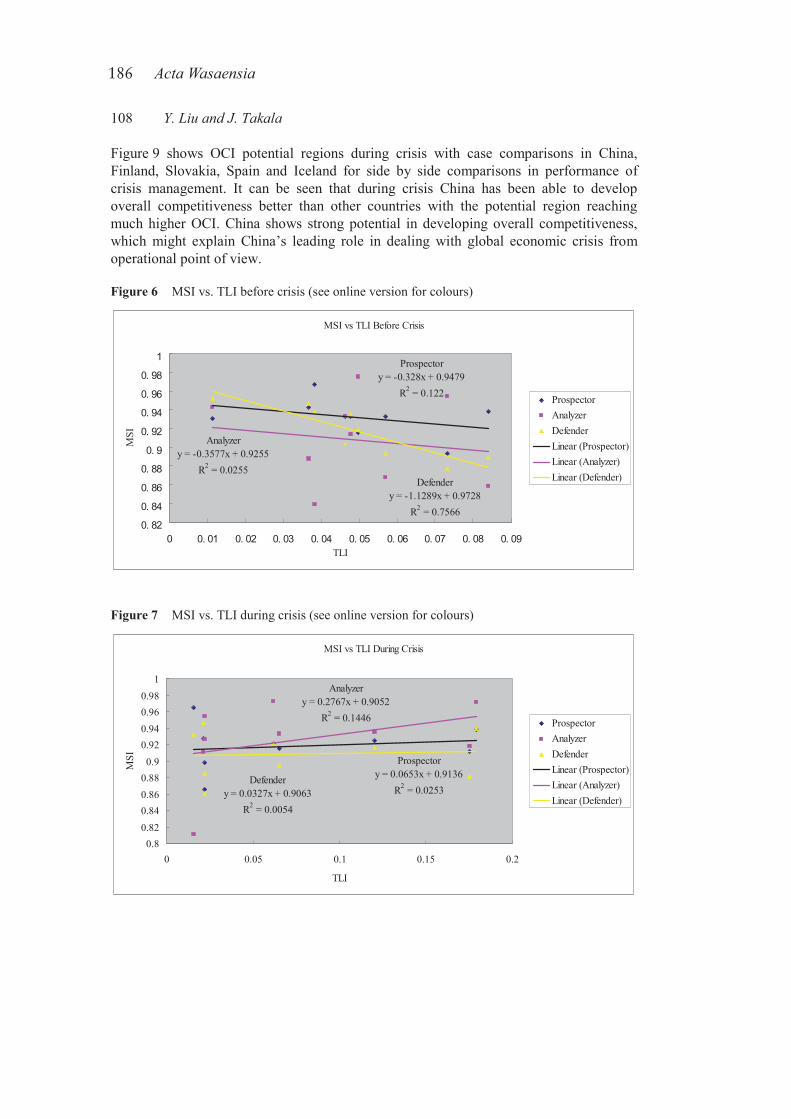
186 ActaWasaensia
108 Y. Liu and J. Takala
Figure 9 shows OCI potential regions during crisis with case comparisons in China, Finland, Slovakia, Spain and Iceland for side by side comparisons in performance of crisis management. It can be seen that during crisis China has been able to develop overall competitiveness better than other countries with the potential region reaching much higher OCI. China shows strong potential in developing overall competitiveness, which might explain China’s leading role in dealing with global economic crisis from operational point of view.
Figure 6 MSI vs. TLI before crisis (see online version for colours)
MSI vs TLI Before Crisis
Prospectory = -0.328x + 0.9479
R2 = 0.122
Analyzery = -0.3577x + 0.9255
R2 = 0.0255Defender
y = -1.1289x + 0.9728R2 = 0.7566
TLI
MSI
ProspectorAnalyzerDefenderLinear (Prospector)Linear (Analyzer)Linear (Defender)
Figure 7 MSI vs. TLI during crisis (see online version for colours)
MSI vs TLI During Crisis
Prospectory = 0.0653x + 0.9136
R2 = 0.0253
Analyzery = 0.2767x + 0.9052
R2 = 0.1446
Defendery = 0.0327x + 0.9063
R2 = 0.0054
0.80.820.840.860.880.9
0.920.940.960.98
1
0 0.05 0.1 0.15 0.2
TLI
MSI
ProspectorAnalyzerDefenderLinear (Prospector)Linear (Analyzer)Linear (Defender)
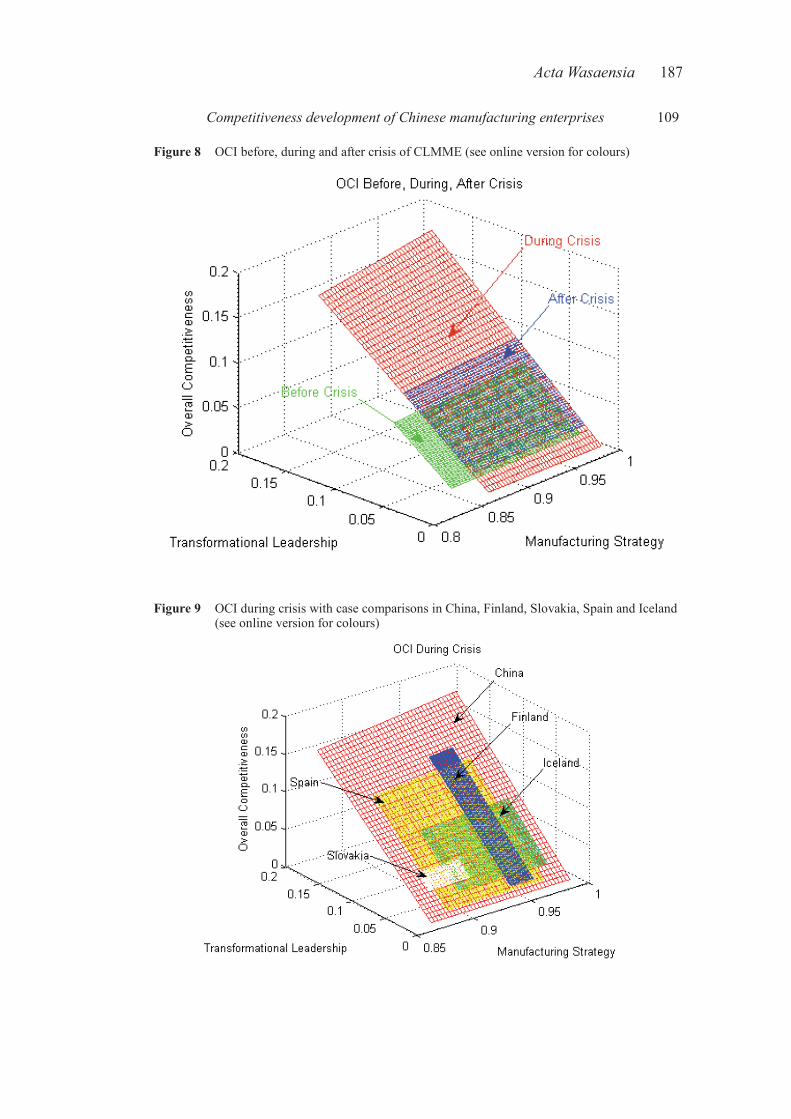
ActaWasaensia 187
Competitiveness development of Chinese manufacturing enterprises 109
Figure 8 OCI before, during and after crisis of CLMME (see online version for colours)
Figure 9 OCI during crisis with case comparisons in China, Finland, Slovakia, Spain and Iceland (see online version for colours)
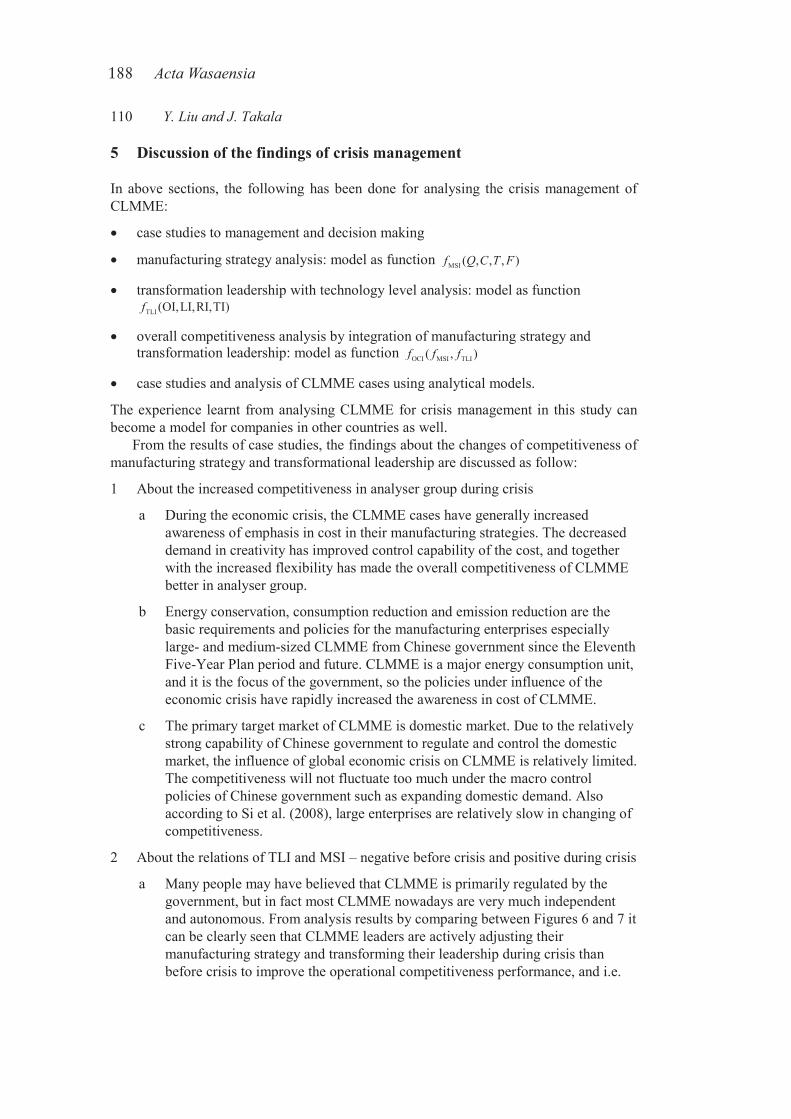
188 ActaWasaensia
110 Y. Liu and J. Takala
5 Discussion of the findings of crisis management
In above sections, the following has been done for analysing the crisis management of CLMME:
case studies to management and decision making
manufacturing strategy analysis: model as function MSI ( , , , )f Q C T F
transformation leadership with technology level analysis: model as function TLI (OI,LI,RI,TI)f
overall competitiveness analysis by integration of manufacturing strategy and transformation leadership: model as function OCI MSI TLI( , )f f f
case studies and analysis of CLMME cases using analytical models.
The experience learnt from analysing CLMME for crisis management in this study can become a model for companies in other countries as well.
From the results of case studies, the findings about the changes of competitiveness of manufacturing strategy and transformational leadership are discussed as follow:
1 About the increased competitiveness in analyser group during crisis
a During the economic crisis, the CLMME cases have generally increased awareness of emphasis in cost in their manufacturing strategies. The decreased demand in creativity has improved control capability of the cost, and together with the increased flexibility has made the overall competitiveness of CLMME better in analyser group.
b Energy conservation, consumption reduction and emission reduction are the basic requirements and policies for the manufacturing enterprises especially large- and medium-sized CLMME from Chinese government since the Eleventh Five-Year Plan period and future. CLMME is a major energy consumption unit, and it is the focus of the government, so the policies under influence of the economic crisis have rapidly increased the awareness in cost of CLMME.
c The primary target market of CLMME is domestic market. Due to the relatively strong capability of Chinese government to regulate and control the domestic market, the influence of global economic crisis on CLMME is relatively limited. The competitiveness will not fluctuate too much under the macro control policies of Chinese government such as expanding domestic demand. Also according to Si et al. (2008), large enterprises are relatively slow in changing of competitiveness.
2 About the relations of TLI and MSI – negative before crisis and positive during crisis
a Many people may have believed that CLMME is primarily regulated by the government, but in fact most CLMME nowadays are very much independent and autonomous. From analysis results by comparing between Figures 6 and 7 it can be clearly seen that CLMME leaders are actively adjusting their manufacturing strategy and transforming their leadership during crisis than before crisis to improve the operational competitiveness performance, and i.e.
ActaWasaensia 189
Competitiveness development of Chinese manufacturing enterprises 111
the key and major factor to succeed in crisis management. If they would only rely on government support, such improvement would not have happened.
b CLMME leaders usually have strong leadership capabilities, since they are in such positions to take great responsibilities of the national backbone industries. Typically, CLMME leaders are selected from most experienced entrepreneurs all over the country through tough competitions. Therefore, it is reasonable to see the TLI from cases in China can be much higher than other countries in Figure 9, and this directly leads to better MSI and OCI.
c Before crisis, the leadership is more affected by macro control of Chinese government than it is really reflected, since the leadership of CLMME at all levels is more constrained by the superior administration and corporate management departments. During crisis, the leaders must react more actively, not only passively following the external macro control to adjust the production according to the market changes but also actively developing relevant measures and policies to make internal adjustments to deal with the crisis. However, quick actions in responding to explore markets, lowering manufacturing cost, technology innovation and development and optimisation of organisation structure can be limited because of the social responsibilities that must be taken, e.g. CLMME cannot lay off employees. The leadership improvement is more reflected to active market, so after crisis CLMME leaders will be substantially improving their leadership and therefore improving manufacturing strategy and overall competitiveness by forecast.
6 Crisis management of CLMME
According to expert opinions and case studies, experiences of how CLMME generally manage the crisis are studied and summarised as follow.
The impacts of economic crisis to CLMME mainly fall into two areas. One is that products are overstocked because of the shrinkage of market demand. Another is that funding chains are broken because of the shrinkage of currency and bank loan.
The solutions for CLMME to manage the crisis are mainly from external and internal actions.
6.1 External actions: from government behaviour
CLMME is the most representative type of Chinese manufacturing enterprises with Chinese characteristics. Since CLMME is the backbone and primary driving force of the Chinese economics, the government gives support during crisis situation to help CLMME to overcome the crisis. The national policies to deal with crisis are mainly to stimulate domestic demand and to stabilise international demand by stabilising export policies. The government has invested 4 thousand billion RMB for constructing infrastructures and therefore bring up the domestic orders. The government is also putting efforts to increases loans and loose monetary policies which also help to stimulate domestic market. Such actions bring increasing orders for CLMME and the profit level back to normal situation. However, the government support alone will never be able to solve the crisis if CLMME do not save themselves.

190 ActaWasaensia
112 Y. Liu and J. Takala
6.2 Internal actions: from CLMME itself
Although government actions play a significant role, CLMME cannot rely only on government actions but also save themselves by taking measure of own actions, which are mainly from three areas:
6.2.1 Lowering the cost
The cost which can be lowered during crisis includes production cost, administration cost, salary cost and investment cost. The saved cost is used to accelerate the circulation of funding chain.
The production cost is controlled by lowering the raw material cost. The purchasing of raw materials has been expensive before crisis. But since CLMME normally need to keep relatively large inventory of raw materials for up to three months production, the expensive raw materials are overstocked during crisis when production drops dramatically. The overstocked raw material inventory is emptied as soon as possible. The new raw materials are only purchased based on production orders, and the inventory is kept small during crisis.
The administration cost is lowered by tighten the regulations to save from office expenses. During crisis the new regulations must be fulfilled by every department in CLMME, otherwise the extra cost which does not meet the requirement will be deducted from salaries.
The salary cost is cut down by decreasing salaries 10% for employees under middle management and 20% for employees above middle management. CLMME tries to stabilise employment so that no employees are laid off but only decrease salaries during crisis.
The investment cost is minimised by suspending any constructions of new plants during crisis. According to the policy of State-owned Assets Supervision and Administration Commission of the State Council of China, new plants are only allowed to be built based on the facts of eliminating old plants with outdated technologies.
6.2.2 Regulating the production
During crisis CLMME produces strictly according to orders. The production is planned after signing of sales contracts, and therefore minimises the overstock of raw materials and products. The production volume is cut down because of the decreased market demand, until the price level returns to normal standard. While the production lines are not running at saturation, it is good opportunity to do the maintenance and service for the idle production lines without interrupting the production, and to get them ready for saturated operation after crisis.
6.2.3 Increasing the marketing effort
CLMME uses the extra time and effort which are gained from unsaturated production during crisis to increase the marketing effort to get more potential markets and orders. The new markets discovered will the help of CLMME to recover from crisis better and faster.
ActaWasaensia 191
Competitiveness development of Chinese manufacturing enterprises 113
7 Future research
In the future research, several ideas have been proposed as follow:
1 For manufacturing strategy, it will be everlasting and challenging work to calibrate the GMSS database in global context concerning more issues, such as different levels of cost, quality, time and flexibility, especially in technology level, as they all have important impact on competitiveness level of companies. The analytical models will be more intensively examined and calibrated by doing case studies with purpose to adapt to new business situation, e.g. crisis and be able to advise solutions based on the evaluation results obtained from analytical models. These may include:
a New measurement of customer behaviour through interview and case studies.
b Customer and market behaviour analysis under new business situations.
c How to adjust strategies according to different market needs and customer behaviour. Strategies should be changed according to new measurement of the differences, e.g. to overcome the currency depreciation, change of product line, change of supplier network and increase flexibility in certain area to gain new customer and new market.
d Simulate the operational competitiveness performance with new adjusted strategies by utilising analytical models.
e Forecast the effects of crisis and the effects of adjusted strategies.
f Other adjustments except strategies.
2 For transformational leadership, the TLI value should probably be scaled to have more meaningful results. A brand new group, reactor, will be introduced. The definition and calculation of reactor group are worth to study in both theoretical and practical level. The modelling of TI as part of RI will be tested with new proposals such as neural network. These give better simulation models to new business situations such as crisis.
3 For overall competitiveness, the evaluation will be compared with more case studies with successful companies to verify the validity further.
4 How government behaviour (national policies and macro control) will affect enterprises may also be taken into account, whether to put them into crisis (e.g. economical sanctions) or save them from crisis (local protection, government support for the CLMME). Since many large international orders are only based on bilateral government contracts, political reasons cannot be neglected and sometimes decisive. The analytical models can be further optimised according to different characteristics of markets behaviour and economical situation.
8 Conclusion
In this paper, a novel concept to model overall competitiveness has been proposed by integrating manufacturing strategy and transformational leadership with technology level together, which is used to evaluate and analyse the performance of crisis management.
192 ActaWasaensia
114 Y. Liu and J. Takala
The empirical studies are focused to case companies in China especially large- and medium-sized manufacturing enterprises (CLMME). From multiple CLMME cases studied in this paper, some conclusions can be summarised as following:
1 CLMME is highly competitive in global context and in overall it has strong competitiveness especially in analyser group. It is even more competitive during crisis, and this is directly caused by the improvement of leadership.
2 During crisis, majority leaders of CLMME cases have improved their OIs, LIs and RIs, and all leaders have improved their TIs, therefore majority leaders have improved TLIs and i.e. the key to manage crisis.
3 The OCIs have been well improved during crisis thanks to the active and correct adjustments of manufacturing strategy and transformational leadership. The forecasted OCIs after crisis show continuous improvement over previous indexes before crisis. Transformational leadership has more significant effect than manufacturing strategy to improve overall competitiveness. In general, CLMME manages crisis by taking both external actions from government behaviour and internal actions by self adjustments.
4 For side to side comparisons with Finland and Slovakia during crisis, China has been able to develop overall competitiveness better. China shows strong potential in developing overall competitiveness which probably explains China’s leading role in dealing with global economic crisis.
Compared to previous studies which have been conducted all before crisis, such comparative studies to place a number of case studies longitudinally to examine the impact of economic crisis is a unique opportunity to find solutions to manage during crisis and recover after crisis. The adjustments of CLMME in manufacturing strategy and transformation leadership are proved to be effective and successful to manage the crisis and keep the high growth of Chinese economics despite of the global economic downturn. The experience learnt from this study can thus become a model for crisis management studies of companies globally as well as foreign companies in China.
References Avella, L., Fernández, E. and Vázquez, C.J. (2001) ‘Analysis of manufacturing strategy as an
explanatory factor of competitiveness in the large Spanish industrial firm’, Int. J. Production Economics, Vol. 72, No. 2, 20 July 2001, pp.139–157.
Bass, B.M. (1985) Leadership and Performance Beyond Expectations. New York: Free Press. Bass, B.M. (1997) ‘Does the transactional – transformational leadership paradigm transcend
organizational and national boundaries?’ American Psychologist, Vol. 52, No.2, pp.130–139. Bass, B.M. and Avolio, B.J. (1994) Improving Organizational Effectiveness Through
Transformational Leadership. USA: SAGE Publishing. Liu, Y., Li, Y., Takala, J., Kamdee, T. and Toshev, R. (2008) ‘Improve company’s operative
competitiveness using analytical models’, Proceedings of IAMOT 1569082846, IAMOT 2008 – The 17th International Conference on Management of Technology; Creating and Managing a Knowledge Economy. Dubai, United Arab Emirates: International Association for Managementof Technology.
ActaWasaensia 193
Competitiveness development of Chinese manufacturing enterprises 115
Liu, Y., Si, S. and Takala, J. (2009) ‘Comparing operational competitiveness strategies in China and Finland’, Proceeding of the IAMOT 1569166675, IAMOT 2009 – The 18th International Conference on Management of Technology; Management of Green Technology. Orlando, FL, USA: International Association for Management of Technology.
Menguc, B., Auh, S. and Shih, E. (2007) ‘Transformational leadership and market orientation: Implications for the implementation of competitive strategies and business unit performance’,Journal of Business Research, Vol. 60, No. 4, pp.314–321.
Miles, R.E. and Snow, C.C. (1978) Organizational Strategy, Structure, and Process, New York: McGraw Hill.
Nissinen, V. (2001) ‘Military leadership. A critical constructivist approach for conceptualizing, modelling and measuring military leadership in the Finnish defence forces’, Dissertation, MpKK JohtL, Edita Oy.
O’Regan, N. and Ghobadian, A. (2005) ‘Strategic planning – a comparison of high and low technology manufacturing small firms’, Technovation, Vol. 25, No. 10, pp.1107–1117.
Rangone, A. (1996) ‘An analytic hierarchy process framework for comparing the overallperformance of manufacturing departments’, Int. J. Operations and Production Management,Vol. 16, No. 8, pp.104–119.
Saaty, T.L. (1980) The Analytic Hierarchy Process. New York: McGraw Hill.Si, S., Liu, Y., Takala, J. and Sun, S. (2009) ‘Benchmarking and developing the operational
competitiveness of Chinese state-owned manufacturing enterprises in a global context’, Int. J. Innovation and Learning, Vol. 7, No. 2, pp.202–222.
Si, S., Takala, J. and Liu, Y. (2008) ‘Competitiveness of Chinese high-tech manufacturing companies in global context’, Industrial Management and Data Systems , Vol. 109, No. 3, pp.404–424.
Sirikrai, S.B. and Tang, J.C.S. (2006) ‘Industrial competitiveness analysis: using the analytic hierarchy process’, The Journal of High Technology Management Research, Vol. 17, No. 1, pp.71–83.
Spina, G., Bert, A., Cagliano, R., Draaijer, D. and Boer, H. (1996) ‘Strategically flexible production: the multi-focused manufacturing paradigm’, Int. J. Operations and ProductionManagement, Vol. 16, No. 11, pp.20–41.
Takala, J., Hirvelä, J., Liu, Y. and Malindzak, D. (2007a) ‘Global manufacturing strategies require “dynamic engineers”? Case study in Finnish industries’, Industrial Management and Data Systems, Vol. 107, No. 3, pp.326–344.
Takala, J., Kamdee, T., Hirvelä, J. and Kyllonen, S. (2007b) ‘Analytic calculation of global operative competitiveness’, Proceeding of IAMOT 1569041789, IAMOT 2007 – The 16th International Conference on Management of Technology; Management of Technology for the Service Economy. Orlando, FL, USA: International Association for Management ofTechnology.
Takala, J., Leskinen, J., Sivusuo, H., Hirvelä, J. and Kekäle, T. (2006) ‘The sand cone model: illustrating multi-focused strategies’, Management Decision, Vol. 44, No. 3, pp.335–345.
Takala, J., Pennanen, J., Hiippala, P., Maunuksela, A. and Kilpiö, O. (2008) ‘Decision maker’s outcome as a function of transformational leadership’, Proceedings of IAMOT 2008, 17th International Conference on Management of Technology; Creating and Managing a KnowledgeEconomy, Dubai, United Arab Emirates: International Association for Management of Technology.
Tracey, M., Vonderembse, M.A. and Lim, J.S. (1999) ‘Manufacturing technology and strategy formulation: keys to enhancing competitiveness and improving performance’, Journal of Operations Management, Vol. 17, No. 4, pp.411–428.
Wernerfelt, B. (1984) ‘A resource-based view of the firm’, Strategy Management Journal, Vol. 5, No. 2, pp.170–180.
Top Related