


![Document Clustering using Improved K-means Algorithm · means algorithm [4] presented how ontological domains are used in clustering documents. Improved document clustering algorithm](https://static.fdocuments.us/doc/165x107/5fa98bfc29d9331b0b2a1030/document-clustering-using-improved-k-means-algorithm-means-algorithm-4-presented.jpg)
Languages
Pages
Legal

Implementation of Clustering Algorithm using
Graph Embeddings and Graph Data Science on
Yelp Restaurant Dataset
Sayali Karangutkar
Applied project submitted in partial fulfilment of the
requirements for the degree of
Msc. In Data Analytics
At
Dublin Business School
Supervisor: Ms. Terri Hoare
August 2020

1 | P a g e
Declaration
I Sayali Karangutkar declare that this applied project that I have submitted to Dublin Business
School for the award of Master of Science In Data Analytics is the result of my own investigations,
except where otherwise stated, where it is clearly acknowledged by references. Furthermore, this
work has not been submitted for any other degree.
Signed: SAYALI KARANGUTKAR
Student Number: 10521898
Date: 25/08/2020

2 | P a g e
Acknowledgement
First of all, I convey my sincere gratitude to Prof. Terri Hoare. Whenever I had any query during
any time of the day or late nights, she was always available and responded. Because of her I got to
learn many new methods and techniques of Data science. She would regularly ask for updates that
kept me motivated to work on my thesis. Every meeting with her was very informative and a new
interesting lesson for me. She was also my lecturer for Data Mining subject so, from her lectures
as well as during the dissertation I got to learn a lot. Secondly, I would like to thank the Neo4j
team for providing new techniques on site through which I got to learn and implement a lot in my
thesis. Next, I would like to thank all the college professors for teaching subjects of Data Analytics.
Finally, I would like to thank my Family, Friends for providing lots of support and encouragement
during my course.
Thank You,
Sayali Karangutkar.

3 | P a g e
Abstract
This research uses the leading property graph DBMS, Neo4j to implement a Restaurant
Knowledge Graph of the Yelp Dataset (Challenge 2020 – business; users; category; reviews). The
application of CYPHER queries; graph algorithms for insight and graph embeddings for machine
learning on the graph are presented. Recently released (April 2020) Version 1.3 of the Neo4j Graph
Data Science library on Neo4j 4.1.0 is explored using the Python library Py2Neo. Use cases for
the graph algorithms PageRank and Overlap Similarity are presented.
It is shown that using Py2neo library, data can be prepared for the application of machine learning
algorithms in Python. A graph embedding algorithm (Node2vec) is applied for clustering using a
traditional k-Means clustering algorithm using Tableau. The results are visualized in Tableau.
4 | P a g e
Table of Contents
Abstract ........................................................................................................................................... 3
CHAPTER 1 - Introduction ............................................................................................................ 8
1.1 Research Problem .................................................................................................................. 9
1.2 Scope ................................................................................................................................... 10
1.3 Limitations .......................................................................................................................... 10
1.4 Dissertation Roadmap ......................................................................................................... 11
CHAPTER 2 - Literature Review ................................................................................................. 12
2.1 Overview of previous Research Papers ............................................................................... 12
2.2 Overview of Relational Databases vs Graph Databases ..................................................... 16
2.3 Overview of steps of Graph Data Science .......................................................................... 17
2.4 Overview of Graph Embeddings ......................................................................................... 18
CHAPTER 3 – Research Methodology ........................................................................................ 19
3.1 Business Understanding ...................................................................................................... 21
3.1.1 A Graph Data Model .................................................................................................... 21
3.1.2 A Graph Data Science Library ..................................................................................... 22
3.1.3 Graph Data Science Algorithms ................................................................................... 24
3.2 Data Understanding ............................................................................................................. 27
3.2.1 Data set Description ...................................................................................................... 27
3.2.2 Data Storage ................................................................................................................. 29
3.2.3 Graph modelling ........................................................................................................... 29
3.3 Data Preparation .................................................................................................................. 31
3.3.1 Architecture and Design ............................................................................................... 32
3.3.2 Installation of Neo4j ..................................................................................................... 33
3.3.3 Loading of the data into Neo4j ..................................................................................... 34
3.3.4 The Yelp Graph Data Model ........................................................................................ 37
3.4 Modelling ............................................................................................................................ 38
3.4.1 Clustering analysis ........................................................................................................ 38
CHAPTER 4 - Data Analysis ....................................................................................................... 39
4.1 Graph feature extraction ...................................................................................................... 39
4.2 Graph algorithms ................................................................................................................. 43

5 | P a g e
4.2.1 PageRank Algorithm .................................................................................................... 43
4.2.2 Overlap Similarity Algorithm ....................................................................................... 46
4.3 Graph Embeddings .............................................................................................................. 49
4.3.1 Node2vec Algorithm .................................................................................................... 49
4.4 Clustering ............................................................................................................................ 51
4.4.1 Visualizations ............................................................................................................... 52
CHAPTER 5 - Conclusion ............................................................................................................ 54
5.1 Future Work ........................................................................................................................ 54
REFERENCES ............................................................................................................................. 55
APPENDICES .............................................................................................................................. 58

6 | P a g e
List of Figures
Figure 1. Dissertation Roadmap ................................................................................................... 11
Figure 2. The Steps of Graph Data Science .................................................................................. 17
Figure 3. CRISP-DM Methodology .............................................................................................. 20
Figure 4. A Comparison of Graph Data Science Library with Graph Algorithm Library............ 22
Figure 5. Nodes displaying User names ....................................................................................... 29
Figure 6. Relationships displaying ‘REVIEWS’ relationship ...................................................... 30
Figure 7. Process of Loading Yelp Data in Neo4j Database ........................................................ 32
Figure 8. Neo4j Desktop ............................................................................................................... 33
Figure 9. Cypher Query for loading Business file ........................................................................ 34
Figure 10. Cypher Query for creating constraint on Business file ............................................... 34
Figure 11.Cypher Query for loading Review file ......................................................................... 34
Figure 12. Cypher Query for creating constraint on Review file ................................................. 35
Figure 13.Cypher Query for loading User file .............................................................................. 35
Figure 14. Cypher Query for creating constraint on User file ...................................................... 35
Figure 15. Cypher Query for creating relationship 'REVIEWS' ................................................... 36
Figure 16. Cypher Query for creating relationship 'WROTE' ...................................................... 36
Figure 17.. Cypher Query for creating relationship 'In_Category' ............................................... 36
Figure 18. Cypher Query to unwind city from Business file ........................................................ 36
Figure 19. Cypher Query for creating relationships 'In_City' and 'In_State' ................................ 37
Figure 20. The Yelp Graph Data Model ....................................................................................... 37
Figure 21. K-means Clustering ..................................................................................................... 38
Figure 22. Count of Labels ........................................................................................................... 39
Figure 23. Count of Relationships ................................................................................................ 40
Figure 24. Feature Extraction Python Data Frame 1 .................................................................... 40
Figure 25. Feature Extraction Python Data Frame 2 .................................................................... 41
Figure 26. Feature Extraction Python Data Frame 3 .................................................................... 41
Figure 27. Feature Extraction Python Data Frame 4 .................................................................... 42
Figure 28. Cypher Query to create a Graph for PageRank ........................................................... 43
Figure 29. Cypher Query for PageRank function ......................................................................... 44
Figure 30. Cypher Query for Damping Factor in PageRank ....................................................... 45
Figure 31. Cypher Query for Overlap Similarity .......................................................................... 46
Figure 32. Cypher Query for Category hierarchy in Overlap Similarity ...................................... 48
Figure 33. Cypher Query to create a graph for Node2vec ............................................................ 49
Figure 34. Cypher Query for Node2vec Algorithm ...................................................................... 50
Figure 35. Clustering Visualization 1 ........................................................................................... 52
Figure 36. Clustering Visualization 2 ........................................................................................... 53

7 | P a g e
List of Tables
Table 1. Description of Business File ........................................................................................... 27
Table 2. Description of User file................................................................................................... 28
Table 3. Description of Review File ............................................................................................. 28

8 | P a g e
CHAPTER 1 - Introduction
Yelp is one of the largest online searching and reviewing systems for kinds of businesses, including
restaurants, shopping, home services (Cui, 2015). To acquire the interests of users which will help
in the improvement of the next-generation system, it is valuable to analyse the real-world data
from Yelp Dataset Challenge 2020.
In the development of the technology of databases, there are many Data models. The three types
of databases commonly used in this developing technology are Relational Database, Graph
Database, and Hierarchical Database. Relational databases such as SQL Server, MySQL, Oracle
have been the mainstream of database management systems for a long time(Zou and Liu, 2020).
The relational model works on the strict mathematical foundation. There are high data
independence and security in the relational model. The operations of the relational model are also
simple. In the current situation, the Relational Database models are the most widely used Database
models. As Internet technology is continuously innovating, the amount of Data networks is also
increasing with an increase in the complexity of Data. Data is becoming more diversified.
Relational Database Management System has exposed some shortcomings in the data model,
storage, and queries(Zou and Liu, 2020). The relational data model works with JOIN operations.
Therefore, larger amounts of JOIN operations are performed when dealing with complex datasets.
The efficiency of data queries is affected by the JOIN operations. This problem can be solved by
a Graph Database more efficiently. It is intuitive to use the form of Graph to show the relationship
between things in the real world(Zou and Liu, 2020).
Graph Databases like Neo4j, gStore, FlockDB, GraphDB, TITAN, etc. have also been widely used.
In this research, a leading property graph DBMS, Neo4j is used.
Neo4j is a popular Graph Database Management System with the following properties.
• It has fast reading and writing speed.
• It has a flexible data design.
• Strong adaptability
• It is easy to use and convenient for modelling.
Neo4j is a high-performance non-relational graph database management system that stores
structured data on the network that is mathematically called graphs(Zou and Liu, 2020). Neo4j
Graph database is an embedded, disk-based, fully transactional Java persistence engine with all
the features of a mature database(Zou and Liu, 2020).The analytics of large graph data set has
become an important means of understanding and influencing the world (Allen et al., 2019).
Important but hidden relationships are uncovered by analysing graph-structured data. The hidden
patterns and hidden structures within the connected data can be analysed with the help of Graph
analytics. This results in accurate predictions and faster decisions. Graph analytics which is
efficient and well-integrated with the management of graph data is required to achieve these
objectives. Such an environment is provided by the Neo4j graph database. Neo4j graph algorithms
of the Graph data Science Library are the central elements for graph elements in the graph
platform. An efficient and parallel version of graph algorithms is provided by Neo4j Graph Data
Science Library which is optimized for the Neo4j transactional database. The research paper
9 | P a g e
describes the implementation of the clustering algorithm on the embedded data obtained through
the ‘Node2vec’ algorithm of graph embeddings and feature extraction of the connected graph
features using the py2neo library in python and demonstrate our process on Yelp Dataset
Challenge Analysis.
Behind the layers of many other connections, hidden data are the relationships of interest. Graph
data and graph analytics have become increasingly important for uncovering such hidden
information. For the performance of Graph Analytics, a comprehensive software stack is provided
by the Neo4j graph platform. From data loading to data visualizations, it handles everything. The
Neo4j Graph Algorithms of Graph Data Science Library can be used in the graph analytics. Some
of the graph algorithms like the Centrality algorithm PageRank and Similarity Algorithm Overlap
similarity are presented in this paper. Graph algorithms are well integrated with the other different
components of the graphical platform. They offer to provide a comprehensive library of user-
defined procedures. The Graph data science library covers the Graph algorithms like Centrality
Algorithms, Community Detection Algorithms, Similarity Algorithms, Link Prediction
Algorithms, Pathfinding Algorithms, Node Embedding Algorithms, and many more. All the
procedures required for the graph algorithms can be called within a Cypher query.
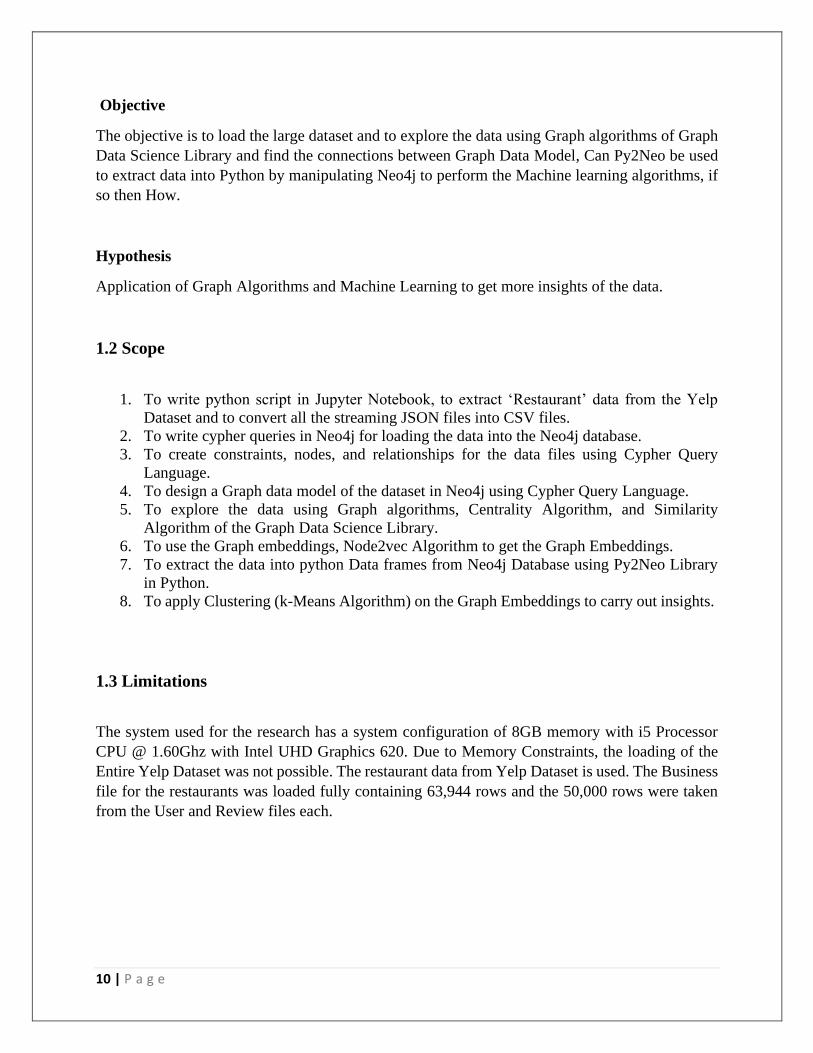
1.1 Research Problem
The research deals with Yelp Dataset (Challenge 2020). The main problem with this dataset is
because of its size of 9.74GB it is difficult to load and explore for further analysis. There are many
unresolved queries on the internet regarding the loading of this dataset. The first part of the
research deals with the loading of the dataset. A recent version of the Neo4j Graph Data Science
Library containing new features and functionalities is launched in April 2020, which is unexplored.
So, the second part of the research deals with exploring the Yelp Dataset using this new Graph
Data Science Library. The research is conducted using a graph DBMS, Neo4j, and Graph Data
Science Library to explore the Graph Algorithms for insights of the Yelp Data and Graph
Embeddings for the machine learning on the graph.
Research Questions
Exploring large datasets and obtaining insights using an unexplored Graph Data Science Library.
Neo4j has released a lot of algorithms that allow us to run on the graph models. Use of Centrality
Algorithm (PageRank) and Similarity Algorithm (Overlap Similarity) on the Graph model.
Aim
The aim is to get the insights of the data using Graph Algorithms PageRank and Overlap Similarity
of the Graph Data Science Library and to use Graph Embeddings to form clusters using a
traditional k-Means clustering algorithm.
10 | P a g e
Objective
The objective is to load the large dataset and to explore the data using Graph algorithms of Graph
Data Science Library and find the connections between Graph Data Model, Can Py2Neo be used
to extract data into Python by manipulating Neo4j to perform the Machine learning algorithms, if
so then How.
Hypothesis
Application of Graph Algorithms and Machine Learning to get more insights of the data.
1.2 Scope
1. To write python script in Jupyter Notebook, to extract ‘Restaurant’ data from the Yelp
Dataset and to convert all the streaming JSON files into CSV files.
2. To write cypher queries in Neo4j for loading the data into the Neo4j database.
3. To create constraints, nodes, and relationships for the data files using Cypher Query
Language.
4. To design a Graph data model of the dataset in Neo4j using Cypher Query Language.
5. To explore the data using Graph algorithms, Centrality Algorithm, and Similarity
Algorithm of the Graph Data Science Library.
6. To use the Graph embeddings, Node2vec Algorithm to get the Graph Embeddings.
7. To extract the data into python Data frames from Neo4j Database using Py2Neo Library
in Python.
8. To apply Clustering (k-Means Algorithm) on the Graph Embeddings to carry out insights.
1.3 Limitations
The system used for the research has a system configuration of 8GB memory with i5 Processor
CPU @ 1.60Ghz with Intel UHD Graphics 620. Due to Memory Constraints, the loading of the
Entire Yelp Dataset was not possible. The restaurant data from Yelp Dataset is used. The Business
file for the restaurants was loaded fully containing 63,944 rows and the 50,000 rows were taken
from the User and Review files each.
11 | P a g e
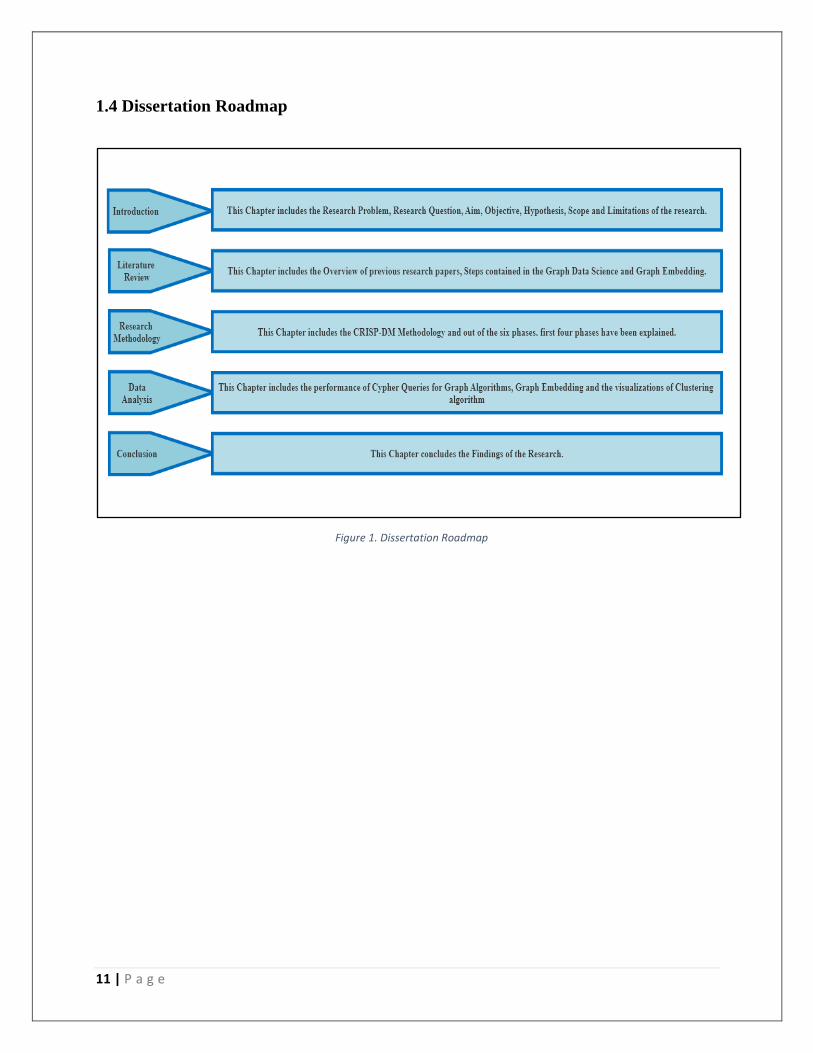
1.4 Dissertation Roadmap
Figure 1. Dissertation Roadmap
12 | P a g e
CHAPTER 2 - Literature Review
2.1 Overview of previous Research Papers
This research is done on the Yelp dataset Challenge in which an unsupervised machine learning
technique, Clustering is used on the embedded data formed by using Graph embedding algorithms.
The application of Graph algorithms and comparison between them was not an easy task. For a
better understanding of all the concepts and theories, the following research papers were used.
The paper,(Farhan, 2014) restaurants data from Yelp dataset was used to make logical reasoning
for future predictions. A linear regression predictor was used to give restaurant owners insights on
their performance and to improve customer satisfaction based on restaurant attributes. Feature
inspection had been done on the business and review files of the Yelp Dataset. The predictive
analysis methods used were Naive Bayes, Neural networks, Random forests (Decision trees), and
Linear regression. As per the research, the best method was Linear Regression having achieved a
Linear Regression Test MSE 1.701775.
The paper,(Kronmueller et al., 2019) the popular Graph Database Neo4j was used to store the Yelp
dataset 2018 Challenge. Basic concepts and applications of Cypher Graph pattern language were
explained. Cypher was used to obtain basic statistics of the dataset to demonstrate how the Yelp
dataset can be used. Graph algorithm library of the Neo4j graph database was used to explore
interesting graph patterns in the dataset such as bipartite and connected components.
The paper,(Rahman et al., 2019) the first attempt in the direction of graph embeddings was made.
Specifically, for graph embeddings, the concentration on the Node2vec algorithm was made.
Node2vec, a semi-supervised algorithm for scalable feature learning in networks was used. Two
datasets were used, and biasness existed in Node2vec when it was used for friendship
recommendations. So, the Fair walk method was proposed as a fairness-aware friendship method
to extend Node2vec. Experimental results demonstrated that Fair walk reduced the biasness under
multiple metrics fairness and preserved the utility. The added flexibility in the exploration of
neighborhoods allowed Node2vec to outperform the other benchmark algorithms. The search
strategy in Node2vec was both flexible and controllable exploring network neighborhoods through
the parameters. The extension of node embeddings to link prediction outperformed popular
heuristic scores were designed for the task.

13 | P a g e
The paper, (Pradhan, Zhang and Chitrakar, 2016) A collaborative filtering-based rating prediction
system with multi-view clustering was used. The multi-view clustering algorithm called CoNMF
to perform joint factorization for multiple data matrices from multiple views through regularization
was used. How users or items leveraging information from multiple modalities can be clustered
with multi-view clustering and the accuracy of CF-based prediction systems can be improved was
showed. Multiple views for both users and restaurants were identified. For the prediction of
unknown ratings of a user for a restaurant, the averages of KNN from the respective user and
restaurant clusters were computed. Results suggested that to improve the accuracy of CF-based
rating prediction systems, multi-view clustering can leverage the utility of each view to cluster
similar users or items together. Multi-view clustering produced better results in the other methods.
The paper,(Shen et al., 2016) A research showed ways to solve a question ‘’How many useful
votes a Yelp review will receive?' By using different techniques like a bag of words, geographical,
statistical, popularity, and other qualitative features extracted from the user, business, and review
information provided by Yelp. A batch mode localized weighted regression model was introduced
to gain performance improvement. 10 linguistic features alone performed much better than the best
Bag of words features. So, Bag of words was safely eliminated from further research. The
performance was significantly improved by 12% after the addition of statistical and geographic
features. The regression algorithm on the machine learning side performed better than the other
algorithms. The localized regression approach resulted in RMSLE of 0.47769, which was better
than the traditional methods.[4]
The paper,(Allen et al., 2019) a Neo4j Graph platform has been used to understand the trolls with
efficient analytics of Large Graphs. The design and integration of Neo4j Graph Algorithms were
described to demonstrate the utility of approach with a Twitter Troll analysis and showcase its
performance with a few experiments on large graphs. The graph was loaded into succinct in-
memory data structures. Graph algorithms have been applied and results are obtained. Pathfinding,
Centrality measuring, and Community detection algorithms were used. Write back results, tabular
aggregated results, and tabular streamed results have been formed. The total runtime of the
complete procedure was measured. Hidden relationships were uncovered. The graph algorithms
were designed to be executed on large to very large graphs and were tested with several billion
nodes and tens of billions of relationships, exhibiting linear performance gain, and scalability on
large multi-core machines.
The paper,(McClanahan and Gokhale, 2016) the approach was to construct a mutual customer
business graph where businesses were represented by nodes and the strength of their mutual
customer population was represented by edges. It was estimated based on the reviews of Yelp
dataset. Centrality and spectral analysis techniques were used to construct and analyze mutual
customer business graphs. The result stated that businesses with high graph centralities tend to be
geographically central relative to other businesses. One mutual customer business graph is
14 | P a g e
constructed for each city and both the unweighted and weighted versions of degree and Page rank
centralities are computed for each business in each graph. Groups of tightly connected businesses
in each graph were identified with spectral clustering. The genres among businesses from the
mutual customer business graph were also identified by the spectral clustering.
The paper,(Sawant, 2013) A personal recommendation system on the Yelp dataset challenge was
implemented using the network-based-inference collaborative filtering algorithm. A
recommendation problem was posed by Graph projection with the representation of the Yelp
dataset using a weighted bipartite graph where edges from user to business were weighted by
rating. A network-based resource allocation process was followed to produce similarity measures
between every pair of users and businesses. They were used to produce predicted ratings and
recommendations. The performance of the system was evaluated with popular commenting ways
of recommendation systems such as Cosine similarity and Pearson correlation with the use of non-
network-based approaches to collaborative filtering. The results were compared to the naïve
baseline. The first experiment used the k-means clustering algorithm to compress our graph into a
bipartite graph. Two more experiments were conducted to modify the definition of the algorithm
and to combat the intolerance to robustness in the second experiment.
The paper,(Prithivirajan et al., 2015) An analysis of star ratings in consumer reviews of Yelp
dataset was done. Particularly consumer reviews about the food category of yelp businesses were
analyzed. How well or poorly the star ratings (on a scale of one star to five stars) associated with
these reviews tally with the sentiment derived from the textual portion of the consumer review
were analyzed. It was proved that across all the consumer reviews overall cuisine types, 68% of
them were positive (scores of 4 and 5). The relationship between the star rating and the review
comment’s sentiment score was investigated.
The paper,(Asghar, 2016) Yelp dataset was used for training and testing models. The Review
rating prediction was treated as a multi-class classification problem for the restaurant reviews of
the Yelp dataset. With the combination of four feature extraction methods, sixteen different
prediction models were built. Those models were unigrams, bigrams, trigrams, Latent Semantic
Indexing with four Machine Learning algorithms Logistic Regression, Naïve Bayes classification,
Perceptron, and Linear support-vector. Sixteen prediction systems were constructed to examine
feature extraction and supervised learning methods. Experimentation and performance evaluation
through k-fold cross validation yield one system. It was concluded that Logistic Regression
exhibited better predictive powers as compared to other models on the set of top 10,000 features
obtained from Unigrams and Bigrams.
The paper,(Effendi, van der Merwe and Balke, 2020) Graph database technology is better suited
or not as compared to the extended relational approach is investigated in this paper. Three database

15 | P a g e
technologies were investigated PostgreSQL, JanusGraph, and TigerGraph. The datasets used were
Yelp dataset and the ambulance response simulation dataset. Different results were obtained to
analyze and compare the response times of three database technologies to handle interconnected
Spatio-temporal data. The Graph database solutions scaled more horizontally and the linear growth
in the relational model was clearly illustrated. It was found out that the scalability of NoSQL
Databases was improved over traditional relation models when querying the larger amounts of
data. The results proved that Spatio-temporal data, graph database technology outperformed
PostgreSQL in all kernels used in the experiments. A dense graph was produced by the dataset on
which Graph database was able to perform effective traversals as compared to relational
implementation which performed multi-join styled queries. The Spatio-temporal multi-
dimensional aspect was shown to be supported well in all of the databases.
The paper,(Cui, 2015) An Evaluation of the Yelp dataset provided in the Yelp Data Challenge is
showed in this paper. Neo4j Graph database was used to store the dataset as it had a great web UI
which makes Graph visualizations possible and a SQL-query language Cypher was easy to use
and learn. Two kinds of nodes Users and Businesses were used from the dataset. The scan-once
method was adopted to improve the performance of data importing. It took 2 weeks to import all
the 366K users' basic information and their relationships. Simple queries were performed using
Cypher and for the complex queries Python scripts were created and py2neo was used to
manipulate Neo4j. A lot of interesting work was done, and different results were obtained. The
model used review text, network structure, and user metadata to find elite users. It was concluded
that the model needed to consider all the information to improve its accuracy. Several efficient
indicators for elite users were found.
In all the researches mentioned in the Literature Review, various techniques for the Yelp Data
Analysis have been used. Machine learning models like Naive Bayes, Neural networks, Random
forests, Decision trees, Linear regression, Bag of Words, etc. were used by the researchers. Neo4j
graph platform was used to store the large dataset and the application of various graph algorithms
was done in the previous researches.
This thesis uses Graph DBMS, Neo4j to implement the Yelp Restaurants Knowledge Graph. A
recent Graph Data Science Library containing Graph Algorithms and Graph Embeddings has been
used which is the new attempt as no research papers are available for the same. Application of a
traditional k-Means clustering algorithm on the Graph embeddings has been performed using the
py2Neo Library in Python. A PageRank Algorithms for the Centrality and Overlap Similarity
Algorithm for the Similarity, of the Graph Data Science Library are used to get insights of the data.

16 | P a g e
2.2 Overview of Relational Databases vs Graph Databases
The recent proliferation of database technologies is a testament to the fact that for every job, a
relational database is not suitable. There are specific uses of relational databases like the consistent
structure of the data and data having fixed schema. If there is a demand for flexibility or high
connections among the data, then there must be an alternative option to relational databases.
There are relational databases like Oracle, MySQL. When it is about capturing repetitive, tabular
data, the relational databases are less effective at storing or expressing relationships between the
stored data elements. In a relational database, the columns can be related within a table, but it can
become difficult to relate the information in different tables. Relationships between columns exist
to support set operations. In the real world, relationships exist between individual data elements,
so this is very different from that.
The graph data model can have an impact on the following important areas:
• The data will be modelled with a high number of relationships between the data.
• There will be flexibility to expand the model, new data and relationships can be added.
• In real-time, data relationships will be queried.
Attempting to take a data model based on relationships and forcing it into a tabular framework
creates a mental disconnection between the way business stakeholders think about data and
processes and the way the database model is implemented (Neo4j Graph Database Platform, 2015).
Due to the complexity of the tabular data model, difficulty in understanding it, and lack of
matching with the developer's mental model of the application the developer’s productivity
suffers.
Changes to the data model can be made without much impact to the application, using the graph
data model. Unlike a relational database, a graph database is structured completely around data
relationships. Graph databases treat relationships not as a schema structure but as data, like other
values.

17 | P a g e
2.3 Overview of steps of Graph Data Science
Figure 2. The Steps of Graph Data Science (Neo4j Graph Database Platform, 2019)
The x-axis on the bottom represents enterprise delivery, or how long it takes technology to be
ready for an enterprise to adopt. The y-axis is data science complexity, or how difficult a problem
is.
Steps are as follows:
Query Based Knowledge Graphs- This step is a great starting point and it is mature as well as
common.
Query Based Graph Analytics- This step incorporates some of the machine learning models into
the application. At this point, some of the graph features can be added to Machine Learning but
still, an expert is required.
Graph Algorithm Feature Engineering- This step is unsupervised. Graph algorithms can be
used on the data, analysis can be performed. Graphical features can be put into machine learning
models.
Graph Embeddings- If the learned representations of the graph can be taken into considerations,
this step is interesting. Graph Embeddings are a toe in the water of deep learning.
Graph Neural Networks- This step focuses on keeping both the output and input in the Graph
and perform native learning.
As mentioned in the diagram above, there are 5 steps on the path of Graph Data Science. A
Restaurant Knowledge Graph has been created and fulfilled the First step of Query based
Knowledge Graphs. Next step contains the Graph Analytics. In the research, the Graph Algorithms
18 | P a g e
like PageRank and Overlap Similarity have been applied to get the insights of the data. After the
application of Graph Algorithms that is Graph Analytics, the research jumps on the fourth step, to
the use of Graph Embeddings. The application of Machine Learning Algorithm, Clustering cannot
be done on the Knowledge Graphs directly as Clustering needs the data in like a spreadsheet and
work on it. So, Graph Embeddings have been formed as mentioned in the fourth step. Embeddings
are formed on the data using the algorithm Node2vec and Clustering is applied on the Graph
Embeddings to get the further insights of the data using a traditional K-Means clustering
Algorithm.
2.4 Overview of Graph Embeddings
A graph is transformed into a feature vector or a collection of features with the help of Graph
Embeddings. The topology, connectivity, and attributes of various nodes and edges in a graph are
described by them. These vectors usually include some form of dimensionality and they contain
x-, y-, z- coordinates as well. Unlike traditional algorithms that use pre-calculated formulas, based
on the neural networks or linear algebra, the representation of the graph is learned by the
Embeddings. An algorithm that creates the node embeddings for the node of a graph is called the
Node2vec algorithm. A d-dimensional featured vector is generated for each node by the Node2vec
algorithm, where d is a tunable parameter in the algorithm. A traditional expression of a feature of
a graph used in data science is called Graph embeddings. Embeddings are a hot research topic
nowadays.
From computational biology to marketing, a task having countless applications, for the nodes
related to Clustering, node embeddings have proved to be a powerful tool for visualizations. It is
possible to apply the clustering algorithm on any set of node embeddings because each node is
associated with its embedding which is real valued vector representation of a node as an
embedding. For example, k-means or DB-scan can be applied to node embeddings. New
methodological opportunities get open because the structural as well as functional roles played by
different nodes can get easily captured by node embeddings. For the traditional community
detection, this can prove to be an open ended as well as powerful alternative.(Hamilton, Ying and
Leskovec, 2017)
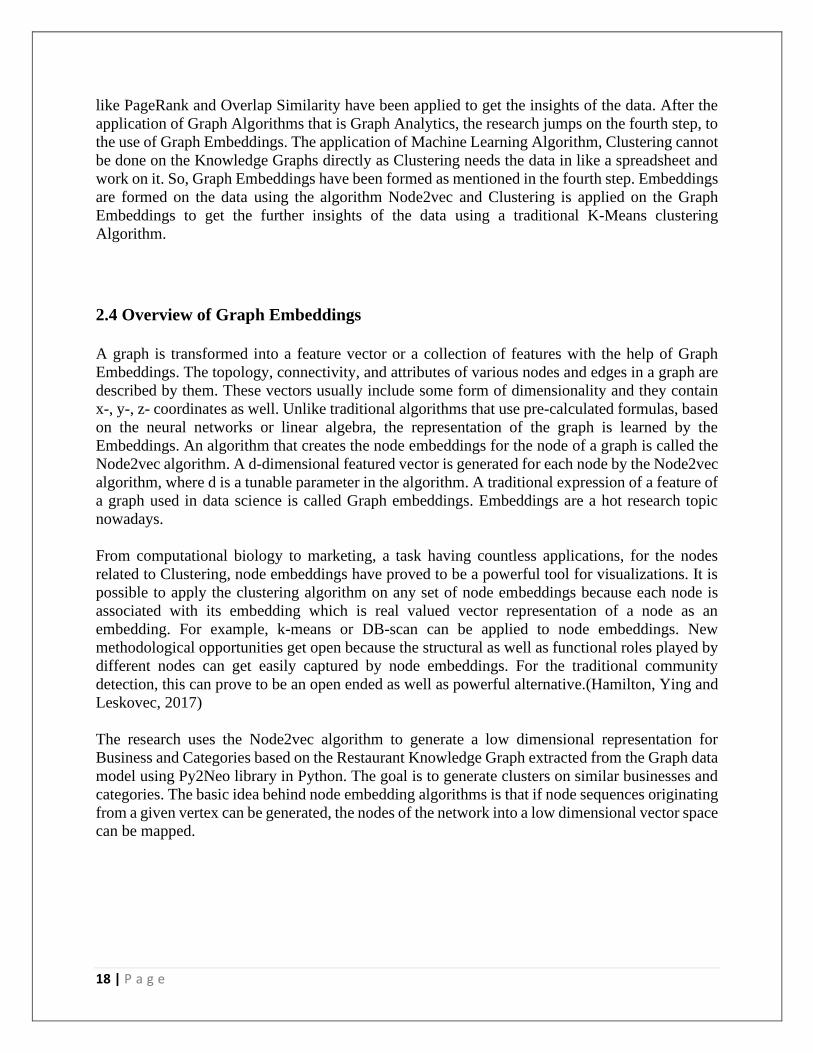
The research uses the Node2vec algorithm to generate a low dimensional representation for
Business and Categories based on the Restaurant Knowledge Graph extracted from the Graph data
model using Py2Neo library in Python. The goal is to generate clusters on similar businesses and
categories. The basic idea behind node embedding algorithms is that if node sequences originating
from a given vertex can be generated, the nodes of the network into a low dimensional vector space
can be mapped.

19 | P a g e
CHAPTER 3 – Research Methodology
Database, Programming Languages, and Tools used
Database
The database used in this thesis is a Popular Neo4j Graph Database. A query language used is a
Cypher Query language which is used to query the database.
Programming Language
The programming language used in this thesis is Python. It is used in three different steps:
1. Initially, Python is used to filter the restaurant's data from Yelp and convert it into CSV
files.
2. Secondly, Python is used to run the Py2neo Library that helped to extract the necessary
data and feed into Python Data frames.
3. Finally, Python is used to prepare and sort the data obtained from Graph Embeddings, so
that it is used for the unsupervised machine learning.
Tools
The tool used for this thesis is Tableau. Tableau is a data visualization tool. It is used for the
Clustering Analysis. Clusters are formed and visualized.
Methodology
In the last few years, there has been a huge growth in the field of Data Analytics. In various IT
companies, corporate sectors, and industries an enormous amount of data is stored in Databases.
This huge data is also known as Big Data cannot be used for analysis without proper
methodologies. Data mining is one of the most important parts of Data Analytics that has qualities
to select useful data from this huge data and uncover the hidden information in Big data which
ends up with the Decision-making process.
There are various methodologies to perform the operations of Data Mining. In this research,
CRISP-DM Methodology is used. Crisp DM is the most popular method of Data mining. The
crisp-DM model is created by four leaders of the nascent Data mining market in the late 1990s and
it is known to be a de-facto standard methodology of Data Mining.
20 | P a g e
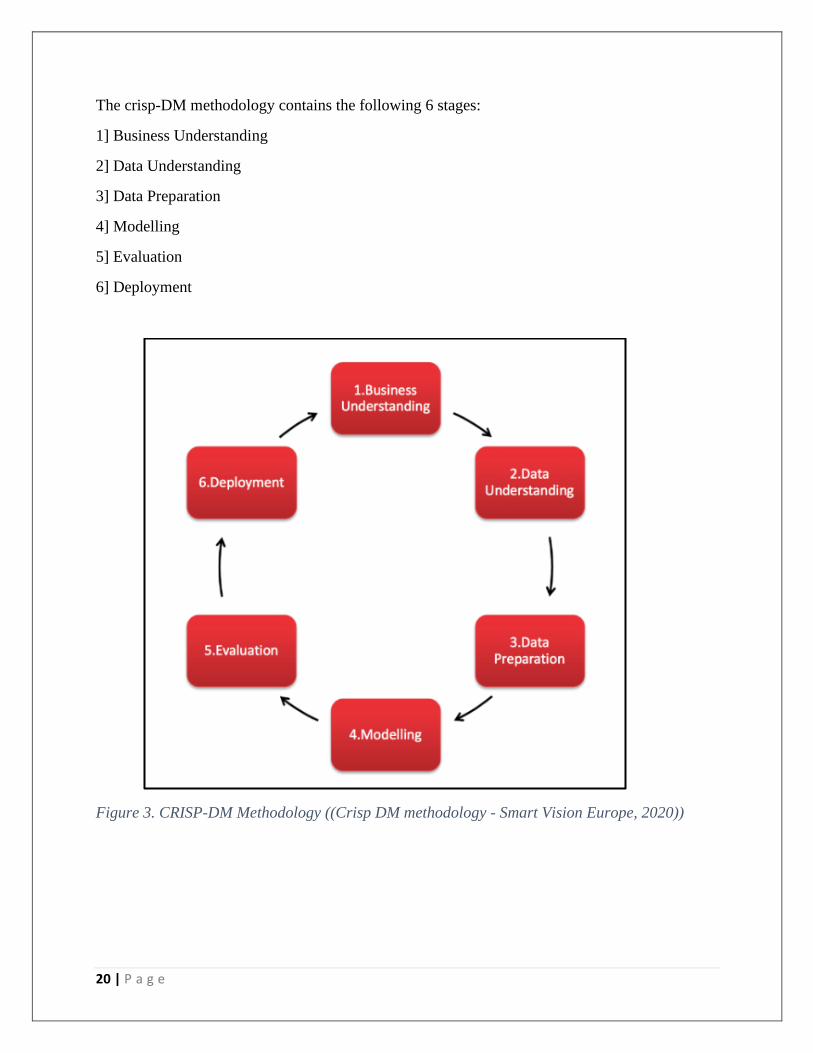
The crisp-DM methodology contains the following 6 stages:
1] Business Understanding
2] Data Understanding
3] Data Preparation
4] Modelling
5] Evaluation
6] Deployment
Figure 3. CRISP-DM Methodology ((Crisp DM methodology - Smart Vision Europe, 2020))
21 | P a g e
3.1 Business Understanding
The process starts with the primary phase of business understanding. The data is viewed through
the business point of view. The business objectives are determined which will be useful for further
process and results will be beneficial. The main criteria for this phase are to uncover important
information.
This research aims to use the Graph Data Science Library and various Graph algorithms of the
Graph Data Science Library. For this, a Popular NoSQL Database Neo4j has been used to store
the Restaurants Yelp Dataset. The study has been conducted for the “Implementation of Clustering
Algorithm using Graph Embeddings and Graph Data Science on Yelp Restaurant Dataset”.
3.1.1 A Graph Data Model
There are two approaches to use the dataset, namely, Language centric approach and Database
centric approach. The Database centric approach is used to import the Dataset into a Database
which can be further extracted by the users for different applications. So, Database centric is used
to store the Dataset. The Language centric approach is used for programming languages such as
R, Python, etc. Using language centric approach, the dataset from the database can be imported to
memory-resident data structures like data-frames in R, Python, and use it for specific applications.
Today, two types of Database systems are in use, SQL (Relational Database) and NoSQL (Not
Only SQL). In this project, I have decided to use a Graph Database which is a type of NoSQL
Database. Recently, in NoSQL Databases, Graph databases have appeared as one of the key
databases to store the data which contains the data connected with relationships. A Graph Database
is used in this research to store the dataset to take advantage of its explicit representation of
connected data and its visual graph data model for a more transparent view of the data semantics.
Furthermore, a graph data query language, based on path pattern matching, provides a powerful
means to retrieve complex graph patterns.
Neo4j Graph Database supports a Graph data model called a labeled property graph. It works with
the Graph Query Language (GQL) called Cypher. Cypher uses ASCII-art to depict graphs. Cypher
is an easy to learn language. It can be used for creating and retrieving relations between data
without the use of complex queries like Joins.
Neo4j Graphs have Nodes and Relationships. The labeled property graph is a graph consisting of
labeled nodes (so that each Node has a distinct label or class, which can be used to describe its
functional role and for faster node retrieval). These nodes are connected to each other with labeled
edges called Relationships. Both nodes and relationships have their properties. Although the
labeled property graph is required to be directed, Neo4j GQL, cypher, can navigate a path in both
directions. As a result, a Neo4j graph can be used as a directed or undirected graph based on its
user’s commands. (Kronmueller et al., 2019)

22 | P a g e
3.1.2 A Graph Data Science Library
A 1.3 Version of Neo4j Graph Data Science Library is officially released in April 2020 with the
new features and functionalities. The Graph Data Science Library leverages the Neo4j versions
4.0.1 and 4.1. The enterprise features like support for role-based access control and multi-database
have been added into the Library. It includes 50 Unsupervised Algorithms and a Preview of Graph
Embeddings. Before the release of the Graph Data Science Library, the Graph Algorithms Library
was in use but now it is deprecated.
Difference between Neo4j Graph Data Science Library and Neo4j Graph Algorithms
Library
The GDS library reflects principal API changes resulting in a more intuitive surface. GDS has
improved usability with more suggestive error handling and better memory management. The
production-tier algorithms in the GDS Library are now between 10% and 85% percent faster than
the deprecated library(neo4j 2020).
The above figure shows the comparison of performance of various Graph Algorithms of Graph
Data Science Library (GDS) and Graph Algorithm Library(Graph Algo).
Figure 4. A Comparison of Graph Data Science Library with Graph Algorithm Library (Neo4j Graph Database Platform, 2020)
After loading the data into Neo4j Database, the Graph Data Science library is used for the
exploratory analysis of data.
The Neo4j Graph Data Science (GDS) library provides extensive analytical capabilities centered
around graph algorithms. The library includes algorithms

23 | P a g e
• Syntax Overview
• Community Detection Algorithms
• Centrality Algorithms
• Similarity Algorithms
• Path Finding Algorithms
• Node Embeddings
• Link Prediction Algorithms
Except for these, graph catalogue procedures are designed to support data science workflows and
machine learning tasks over various graphs. All operations are designed for massive scale and
parallelization, with a custom and general API tailored for graph-global processing, and highly
optimized compressed in-memory data structures. The Graph Data Science library is not
compatible with the Graph Algorithms library, only one plugin can be installed per database.
The relationships and network structures in the data are used by Graph Data Science to address the
complex questions about system dynamics and group behaviour. To make valuable predictions out
of the data, the insights of the data are used by businesses.
Addressing various questions has become feasible with the help of the Neo4j Graph Data Science
Library. Data scientists benefit from a customized, flexible data structure for global computations
and a repository of powerful, robust algorithms to quickly compute results over tens of billions of
nodes.(neo4j 2020).
The unsupervised machine learning methods and heuristics with which the topology of the graph
can be learned and described are provided by the Graph algorithms. The hardened graph algorithms
with enterprise features and deterministic seeding to get the consistent results and reproducible
machine learning workflows are all included in the Graph Data Science Library.
All the algorithms of the Neo4j Graph Data Science Library are divided into categories that
represent different problem classes. The three categories are:
Production-quality
• The algorithms are tested with regards to stability and scalability is indicated in Production-
quality.
• Algorithms in this tier are prefixed with gds.<algorithm>
Beta
• The algorithm that is a candidate for a Production-quality tier is indicated is Beta.
• Algorithms in this tier are prefixed with gds.beta.<algorithm>
Alpha
• The algorithm is experimental and can be changed or removed any time is indicated in
Alpha.
• Algorithms in this tier are prefixed with gds.alpha.<algorithm>

24 | P a g e
3.1.3 Graph Data Science Algorithms
Community Detection Algorithms
This algorithm is used to cluster the Graph based on relationships to find communities where
members have more significant interactions. These algorithms can evaluate how groups of nodes
get clustered or partitioned and their tendency to strengthen or break apart. Community detection
includes various algorithms such as Louvain, Label Propagation, Weakly Connected Components,
Triangle count, Local Clustering Coefficient in Production quality tier. K-1 colouring and
Modularity Optimization are in the Beta tier as well as Strongly Connected Components are in the
Alpha tier. To predict the similar behaviour or preferences, to find the duplicate entities, to estimate
resilience or for the other analysis. This information is helpful.
Centrality Algorithms
To determine the importance of distinct nodes in a network, the centrality algorithms are used. To
uncover the roles of individual nodes and their impact, based on the graph topology which nodes
are important is revealed by the Centrality algorithms. Centrality algorithms have the famous
PageRank algorithm. The influential nodes are identified by these algorithms based on their
position in the network. To infer group dynamics such as rippling vulnerability, credibility, and
bridges between groups are used by these algorithms.
It includes algorithms like PageRank and Betweenness centrality in the Production-quality tier. In
the Alpha tier, the algorithms ArticleRank, Closeness Centrality, Harmonic Centrality, Degree
Centrality, and Eigenvector Centrality are included.
PageRank Algorithm
The algorithm that measures the transitive or directional influence of nodes is called PageRank
Algorithm. The other centrality algorithms focus on measuring the direct influence of a node,
whereas if we look at PageRank, it considers the influence of the node’s neighbours and their
neighbours.
Example: If a node has few influential friends, it could raise PageRank more than having a larger
number of influential friends.
The determination of estimation of the importance of a page is done by the PageRank algorithm
by counting the number and quality of links to a page. So, Important pages are more likely to
receive a higher volume of links as compared to the other influential pages.
𝑃𝑅(𝐴) = (1 − 𝑑) + 𝑑(𝑃𝑅(𝑇1)
𝐶(𝑇1)+ ⋯ +
𝑃𝑅(𝑇𝑛)
𝐶(𝑇𝑛)
• we assume that page A has pages T1 to Tn which point to it.
• d is a damping factor which can be set between 0 and 1. It is usually set to 0.85.
• C(A) is defined as the number of links going out of page A. (neo4j.com, n.d.)

25 | P a g e
Similarity Algorithms
These algorithms are the comparison of scores of individual nodes with their neighbours. In
applications such as personalized recommendations and developing categorical hierarchies, these
algorithms are used.
Similarity algorithms include Node Similarity in production-quality tier and algorithms such as
Approximate Nearest Neighbours, Cosine Similarity, Euclidean Similarity, Jaccard Similarity,
Overlap Similarity, and Pearson Similarity in its Alpha tier.
Cosine Similarity Algorithm
The cosine of the angle between two n-dimensional vectors in an n-dimensional space is called
Cosine Similarity. The dot product of the two vectors divided by the length of the product of two
vectors is Cosine Similarity. It calculates the similarity between two nodes. Two sets of the data
are considered to calculate the Cosine Similarity.
𝑠𝑖𝑚𝑖𝑙𝑎𝑟𝑖𝑡𝑦(𝐴, 𝐵) =𝐴. 𝐵
||𝐴|| × ||𝐵||=
∑ 𝐴𝐼 × 𝐵𝐼)𝑛𝑖=1
√∑ 𝐴𝑖2 × √∑ 𝐵𝑖
2𝑛𝑖=1
𝑛𝑖=1
Overlap Similarity Algorithm
Overlap Similarity measures the overlapping between two sets. The size of the intersection of the
two sets divided by the size of smaller of the two sets is called Overlap Similarity.
O(A,B) = |𝐴 ∩𝐵|
min (|𝐴|,|𝐵|)
To calculate the similarity between the sets of data, procedures, and functions are both contained
in this library. If the similarity between small numbers of sets has to be calculated, then this
function is the best. The computation is parallelized by the procedures, so it is more appropriate
for the computation of similarities on bigger datasets.
Path Finding Algorithms
To traverse between the nodes, the most efficient or shortest path is found by the Path Finding
Algorithms. With finding the shortest paths between two or more nodes, these algorithms also
evaluate the availability and quality of paths.
It includes Minimum Weight Spanning Tree, Shortest Path, A*, Random Walk, etc. Algorithms in
the Alpha tier.

26 | P a g e
Graph Embeddings
Graph embeddings are a new class of Algorithms through which a topology of graphs gets
translated into a unique, numerical representation of each node that can be used for feature
engineering, similarity calculations, or visualizations. They are used to compute low-dimensional
vector representations of nodes in a graph. These vectors are the embeddings which can be used
for Machine learning modelling.
It includes Node2Vec, GraphSAGE, and Random Projection in the Alpha tier.
Node2Vec
Node2Vec is a node embedding algorithm that computes a vector representation of a node based
on random walks in the graph. The neighbourhood is sampled through random walks. Using
several random neighbourhood samples, the algorithm trains a single hidden layer neural network.
The neural network is trained to predict the likelihood that a node will occur in a walk based on
the occurrence of another node.(neo4j 2020)
27 | P a g e
3.2 Data Understanding
Data Understanding is the second phase of the CRISP-DM process in which the data listed in the
project resources should be acquired.
This phase starts with an initial step of Data collection and then it proceeds to further activities to
get familiar with the dataset. In this phase, the data quality problems can be identified, the first
insights into the data can be discovered and interesting subsets of hidden information can be
detected. There is a close link between Business Understanding and Data Understanding(Wirth,
2000).
Yelp Dataset Challenge 2020 obtained from Kaggle is used to perform the thesis. This dataset
contains 5 JSON files namely Business (Different businesses including their Categories), Review
(Different reviews written by the users on businesses), User (Registered members of Yelp), Tip
(Tips are given by users on the specific dates with comments), Check-in (Check-ins for businesses
with date and timings).
In total, there are:
• 5,200,000 user reviews
• Information on 174,000 businesses
• The data spans 11 metropolitan areas
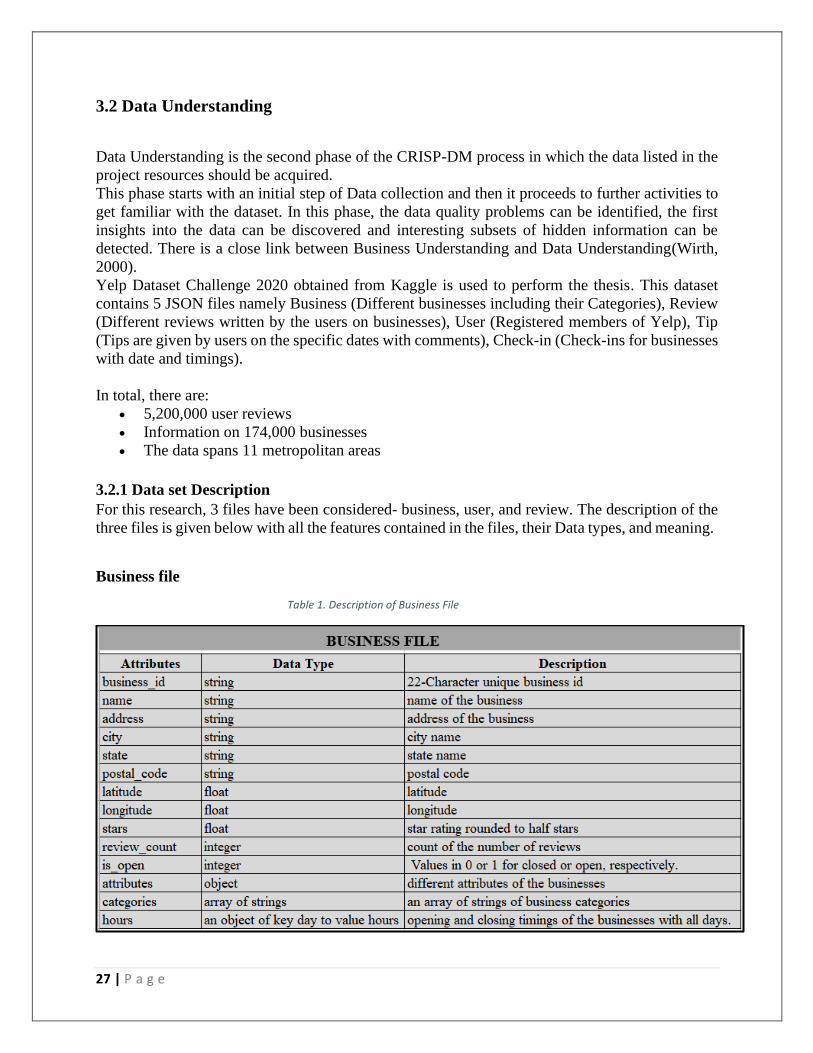
3.2.1 Data set Description
For this research, 3 files have been considered- business, user, and review. The description of the
three files is given below with all the features contained in the files, their Data types, and meaning.
Business file
Table 1. Description of Business File

28 | P a g e
User file
Table 2. Description of User file
Review file
Table 3. Description of Review File

29 | P a g e
3.2.2 Data Storage
It is time-consuming and inconvenient to analyse the statistics of the Yelp Dataset Challenge
without the help of the Data storage system because of the larger size of the dataset. It is natural
to use Graphs to model the network of the Yelp dataset. Users, Businesses, and Reviews can be
abstracted as nodes with different properties. They can be connected to each other with specific
relationships. So, the best fit for this purpose is the Graph Database. Neo4j Database has been used
for this research as the Graph visualizations can be done with it and it uses Cypher query language
which is easy to learn and use. Apart from that, to get the insights of the data, it provides a Graph
Data Science Library which comes with the 50 unsupervised Graph Algorithms and many more
features.
3.2.3 Graph modelling
The mathematical structure of objects in which some pairs of objects are connected to each other
by links is called a Graph. A process described by the user in which an arbitrary domain is showed
as a connected graph of nodes with their specific relationships with the properties and labels is a
Graph Data Modelling.
Nodes
The objects which are denoted by abstractions are called nodes. Entities are modelled as nodes.
Nodes are the main data elements.
The above diagram shows the user nodes of the user file which is used in this research on which
the name of the user is displayed.
Figure 5. Nodes displaying User names

30 | P a g e
Relationships
The links between the nodes are denoted by relationships. A depict directed, semantically relevant
connections between the two nodes are called Relationships. A relationship in Neo4j will always
have a start node, an end node, and a single type. Relationships should be always created in a
specific direction and while traversing them, the direction can be ignored.
The above diagram shows the relationship between the business file and review file in which the
review is connected to the business with the relationship ‘REVIEWS'. The business node is
displaying the name of the business whereas the review node is displaying a unique id of the
review.
Figure 6. Relationships displaying ‘REVIEWS’ relationship
Labels
Labels are used to represent the role of the nodes. Labels can be multiple on the specific node at
the same time. Labels add more meaning to the nodes as well as they also add constraints and
indices which are local to the label.
Properties
The Key-value pairs that contain information of the nodes and relationships are called Properties.
Properties allow storing the essential data about the node or relationship with the described entity.

31 | P a g e
3.3 Data Preparation
1. Three files from the Yelp Dataset Challenge have been considered for this research. Files
business, user, and review are in JSON format.
2. Yelp Dataset contains information regarding the number of different businesses. This
research focuses on the restaurant's data from Yelp Dataset. Therefore, the extraction of
restaurant data from the Yelp dataset has been done using Python.
3. A Business file contains restaurant data into its ‘categories’ column. With the help of the
‘Restaurant’ category from the ‘categories’ column, the restaurant data from the business
file has been filtered and the file is converted into CSV format.
4. Further, the restaurant's data from user and review files have also been extracted.
5. The business file contains a unique ‘business_id' column. So, each Business ID belongs to
each business. Review file also contains these unique business ids in its ‘business_id’
column. By matching the new extracted business file’s business is with the review file, the
restaurant data from the review file has been extracted and the new review file is converted
into CSV format.
6. Review file contains a unique ‘user_id' column which maps with the ‘user_id' column of
the user file. In a similar way, the restaurant data from the user file is extracted and a new
user file with restaurant data is converted into a CSV format.
7. The files have been converted into CSV format for fast loading into the Neo4j Database.
All three CSV files (Business, User, Review) containing restaurant data are ready to be
loaded into Neo4j Database.
32 | P a g e
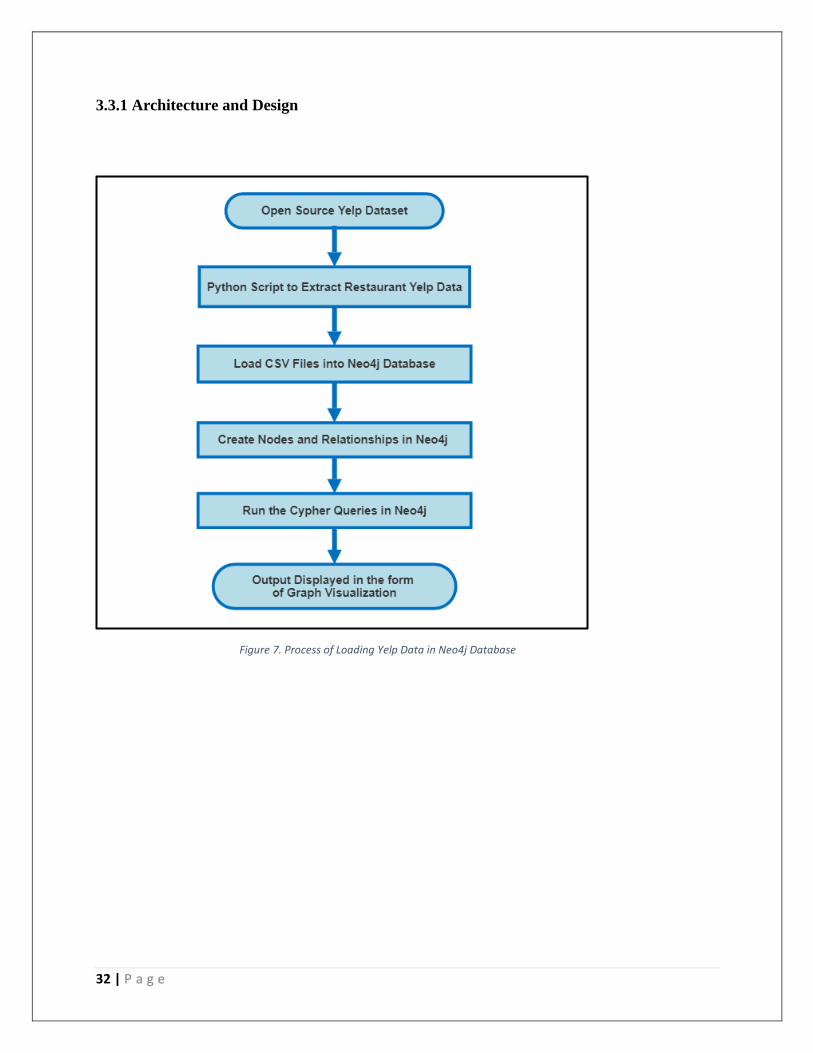
3.3.1 Architecture and Design
Figure 7. Process of Loading Yelp Data in Neo4j Database

33 | P a g e
3.3.2 Installation of Neo4j
Neo4j Desktop is a convenient way for developers to work with local Neo4j databases. After
installation of Neo4j Desktop, the APOC and Graph Data Science Library have also been installed.
Necessary configuration settings are made. By clicking on the ‘New' label on the left top shown
in the above figure, the new Project has been created named ‘Yelp Dataset Challenge 2020'. Inside
the project, a new Graph database is created which is used to store the Yelp Graph Data Model.
Figure 8. Neo4j Desktop
34 | P a g e
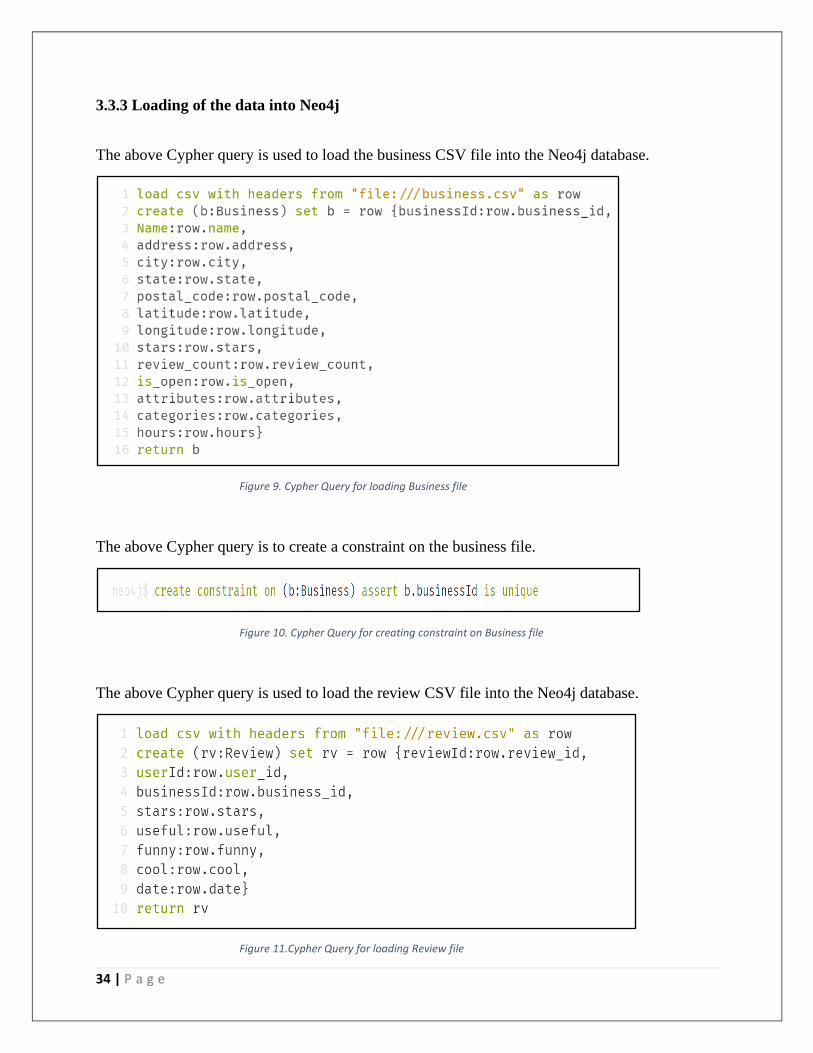
3.3.3 Loading of the data into Neo4j
The above Cypher query is used to load the business CSV file into the Neo4j database.
Figure 9. Cypher Query for loading Business file
The above Cypher query is to create a constraint on the business file.
Figure 10. Cypher Query for creating constraint on Business file
The above Cypher query is used to load the review CSV file into the Neo4j database.
Figure 11.Cypher Query for loading Review file

35 | P a g e
The above Cypher query is to create a constraint on the review file.
Figure 12. Cypher Query for creating constraint on Review file
The above Cypher query is used to load the user CSV file into the Neo4j database.
Figure 13.Cypher Query for loading User file
The above Cypher query is to create a constraint on the user file.
Figure 14. Cypher Query for creating constraint on User file

36 | P a g e
The above Cypher query is to create a relationship between the business and the review file. The
relationship name ‘REVIEWS' is created between review and business files.
Figure 15. Cypher Query for creating relationship 'REVIEWS'
The above query is to create a relationship between the user and the review file. The relationship
name ‘WROTE' is created between the user and the review files.
Figure 16. Cypher Query for creating relationship 'WROTE'
The above query is to load the business file and unwind categories column from business file and
to create a relationship between business and category. The relationship name ‘In_Category' is
created between the business file and category.
Figure 17.. Cypher Query for creating relationship 'In_Category'
The above query is to load the business file and unwind the city column from the business file.
Figure 18. Cypher Query to unwind city from Business file

37 | P a g e
The above query is to load the business file and unwind the state column from the business file
and two relationships have been created. The relationship name ‘In_City' is created between the
business file and the city. The second relationship name ‘In_State' is created between the city and
state.
Figure 19. Cypher Query for creating relationships 'In_City' and 'In_State'
3.3.4 The Yelp Graph Data Model
Figure 20. The Yelp Graph Data Model
38 | P a g e
3.4 Modelling
3.4.1 Clustering analysis
Machine learning has three types of learning techniques: Supervised learning technique,
Unsupervised learning technique, and Semi-supervised learning technique. When the model gets
trained on the unlabelled data and an algorithm finds the structure in the input data, it is called
unsupervised learning. Clustering comes into an Unsupervised machine learning technique. The
process of dividing data into small groups of clusters having similar characteristics based on
measured distance is called Clustering. It is basically a collection of objects based on the
similarities and dissimilarities between them. For the determination of intrinsic grouping among
the unlabelled data, the Clustering technique is important. There are no criteria specified for the
good clustering algorithm. Users can select the criteria which satisfy their need.
To find the representatives for homogeneous groups, to find the natural clusters, and to describe
the unknown properties of clusters, clustering can be used. The assumptions constituting the
similarity of points are made by the clustering algorithm. Each of the assumptions makes different
and equally valid clusters.
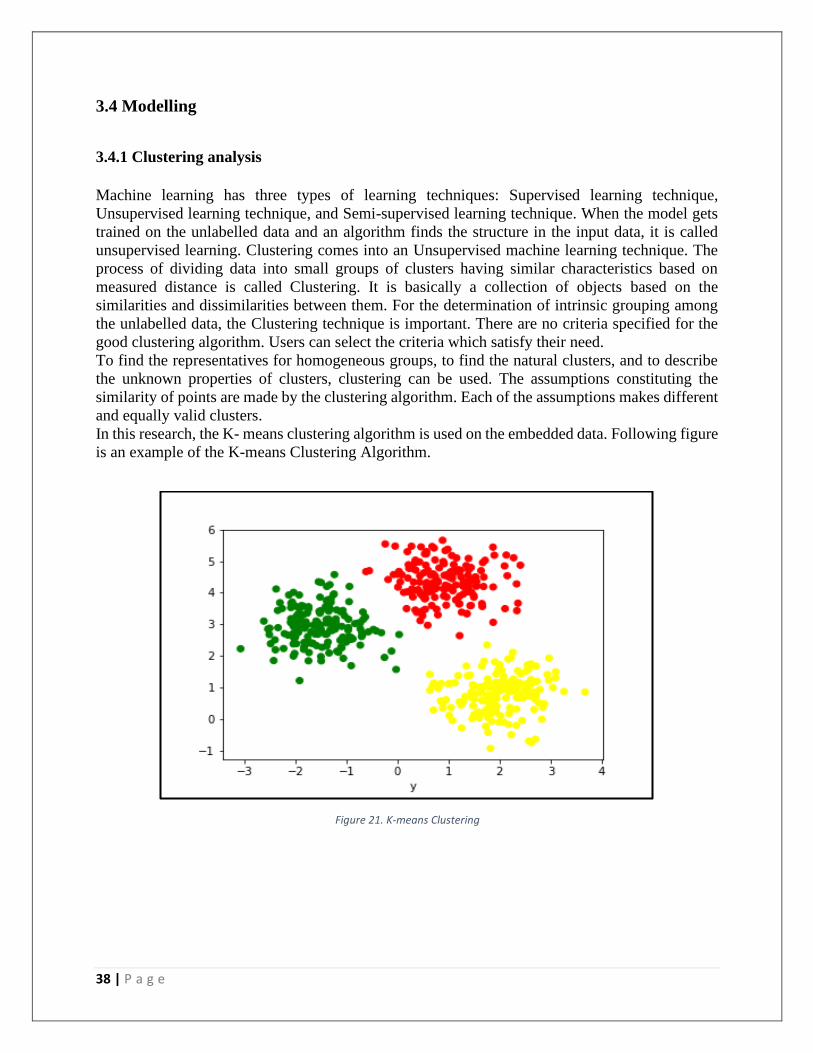
In this research, the K- means clustering algorithm is used on the embedded data. Following figure
is an example of the K-means Clustering Algorithm.
Figure 21. K-means Clustering

39 | P a g e
CHAPTER 4 - Data Analysis
4.1 Graph feature extraction
Py2Neo
Py2neo is a client library to work with Neo4j from within Python applications. It can be done from
the command line as well. Both Bolt and HTTP connections are supported by this library. Py2neo
is the interface between the python programming language and the neo4j database. It allows us to
talk to the database and get the necessary data into python programming.
In this research, the py2neo library has been used to connect to Neo4j from within python to run
cypher queries on graph data and extract it into the python Data frames.
The following query installs the py2neo library into python which is running on the Jupyter
Notebook environment.
The following query is to connect with the Neo4j bolt connection.
The following cypher query is to show the count of Labels in the Neo4j Database.
Figure 22. Count of Labels

40 | P a g e
The following cypher query is to show the count of Relationships in the Neo4j Database.
Figure 23. Count of Relationships
The following cypher query is to extract the data from the Neo4j Database. Columns businessId,
businessName, city, etc. are considered from business, columns stars, useful, etc. are considered
from review and columns cool, elite, fans, etc. are considered from the user. A Data frame has
been formed with this data with 17467 rows and 18 columns.
Figure 24. Feature Extraction Python Data Frame 1
41 | P a g e
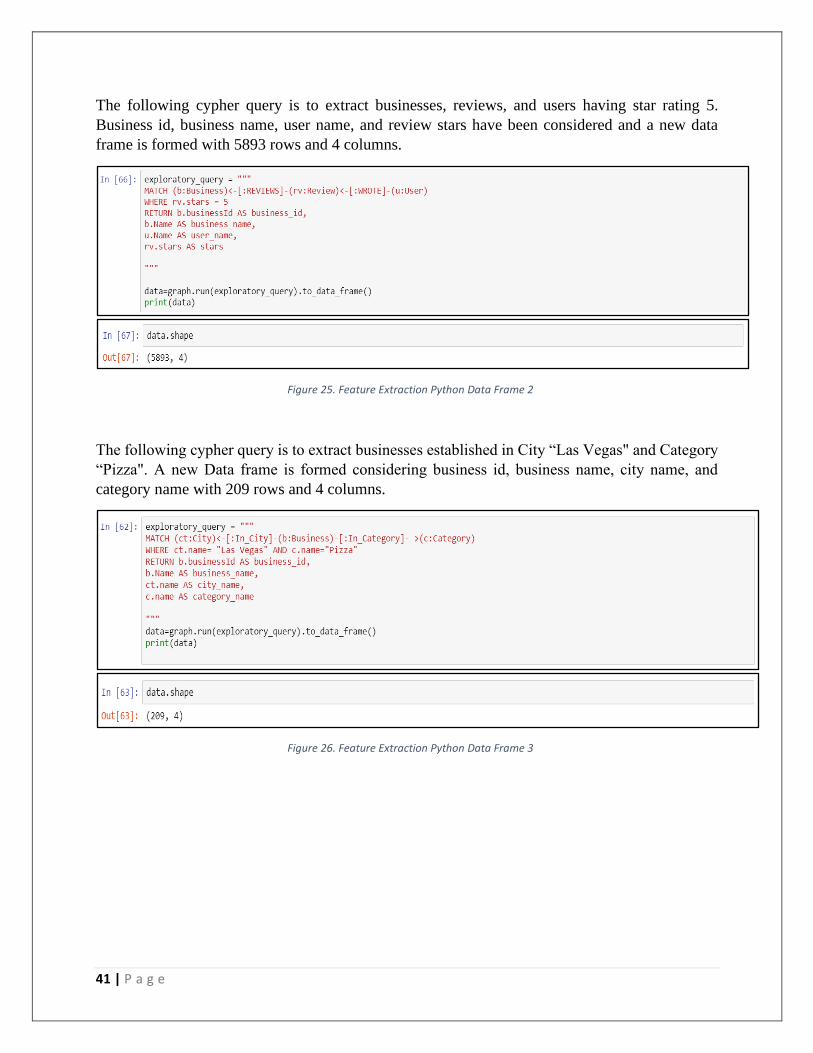
The following cypher query is to extract businesses, reviews, and users having star rating 5.
Business id, business name, user name, and review stars have been considered and a new data
frame is formed with 5893 rows and 4 columns.
Figure 25. Feature Extraction Python Data Frame 2
The following cypher query is to extract businesses established in City “Las Vegas" and Category
“Pizza". A new Data frame is formed considering business id, business name, city name, and
category name with 209 rows and 4 columns.
Figure 26. Feature Extraction Python Data Frame 3

42 | P a g e
The following cypher query is to extract businesses, reviews and users having the user name
“Tristan". A new Data frame is formed with business id, business name, business review count,
user name, and review stars with 2 rows and 5 columns.
Figure 27. Feature Extraction Python Data Frame 4
43 | P a g e
4.2 Graph algorithms
4.2.1 PageRank Algorithm
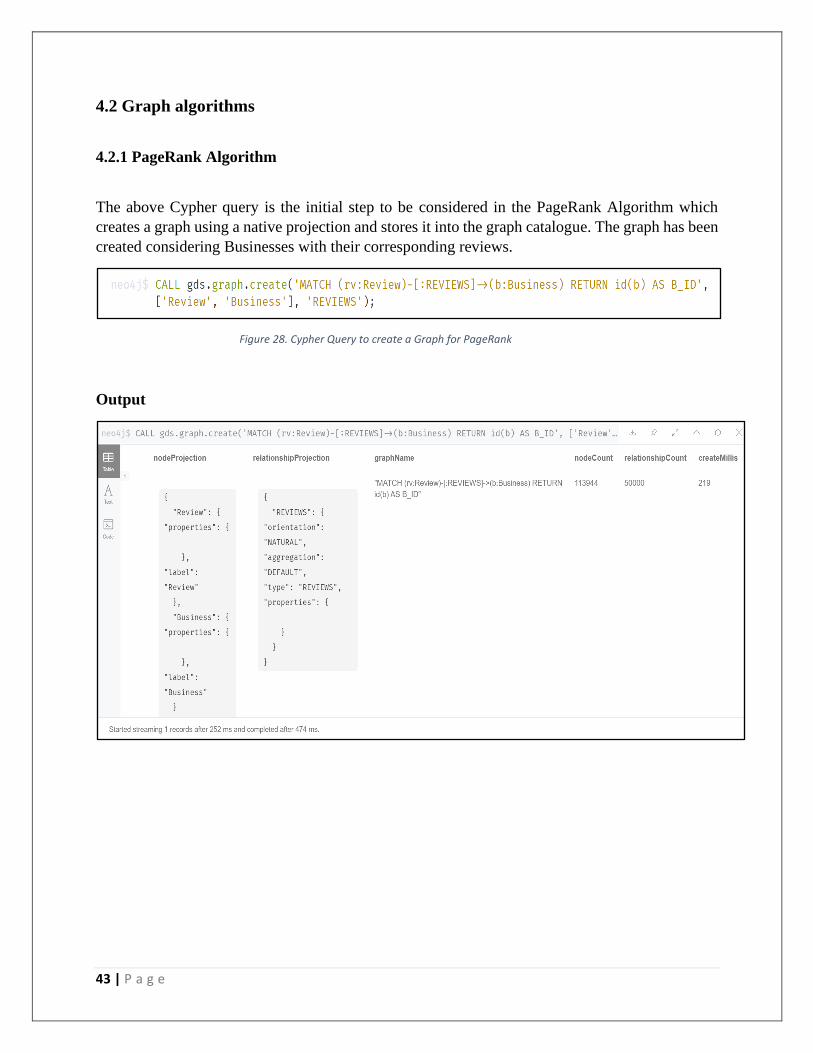
The above Cypher query is the initial step to be considered in the PageRank Algorithm which
creates a graph using a native projection and stores it into the graph catalogue. The graph has been
created considering Businesses with their corresponding reviews.
Figure 28. Cypher Query to create a Graph for PageRank
Output
44 | P a g e
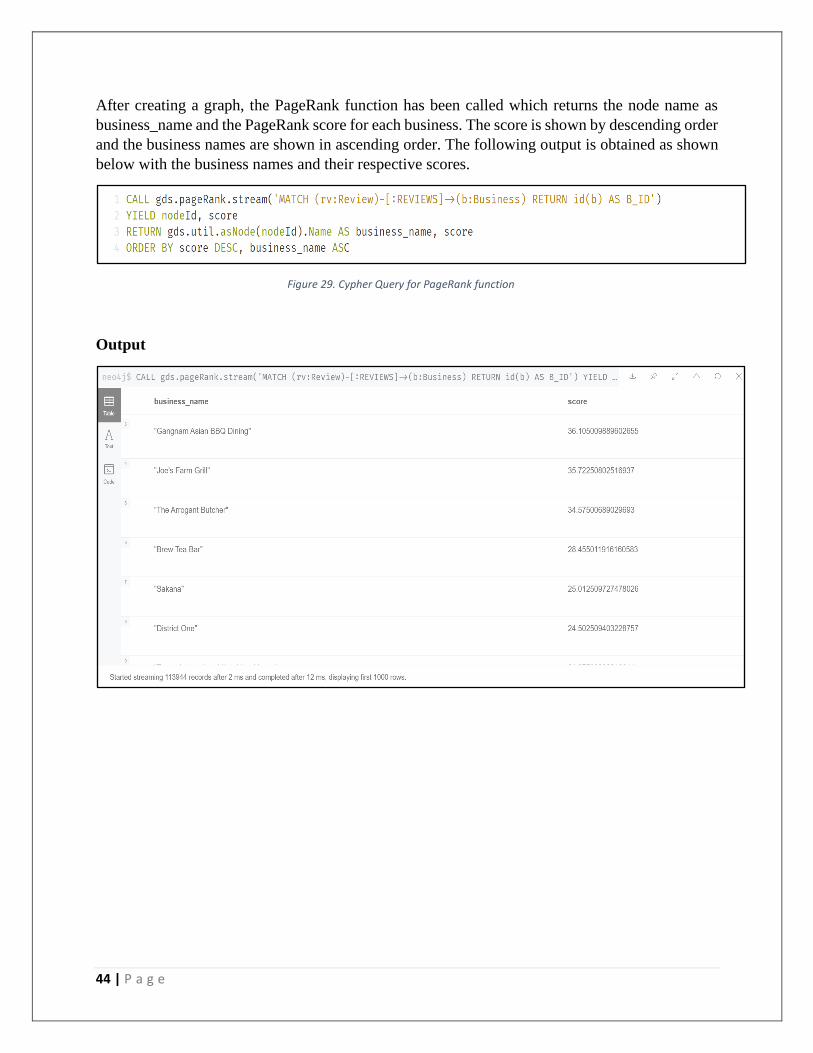
After creating a graph, the PageRank function has been called which returns the node name as
business_name and the PageRank score for each business. The score is shown by descending order
and the business names are shown in ascending order. The following output is obtained as shown
below with the business names and their respective scores.
Figure 29. Cypher Query for PageRank function
Output

45 | P a g e
The Damping factor is applied in the Page Rank Algorithm and the following output is generated.
The score has shifted to lower values as the Damping factor considers the values between 0 and 1
and our scores have higher values. Therefore, with the application of a Damping Factor, the lower
valued scores have been generated.
Figure 30. Cypher Query for Damping Factor in PageRank
Output

46 | P a g e
4.2.2 Overlap Similarity Algorithm
The above Cypher query will return a stream of node pairs. Their intersections and similarities are
calculated.
Figure 31. Cypher Query for Overlap Similarity
Output

47 | P a g e
The above Cypher Query will find the most similar Category for each Category and store a
relationship between those Categories. Minimum, maximum, mean, and p95 scores are generated
in the output. The minimum score generated is 0.5 And the maximum is 1.0.
Output

48 | P a g e
The above Cypher Query will find the Category hierarchy for ‘Food' Category. In the output, it
can be seen that ‘Restaurants' Category is the category hierarchy for ‘Food' Category.
Figure 32. Cypher Query for Category hierarchy in Overlap Similarity
Output

49 | P a g e
4.3 Graph Embeddings
4.3.1 Node2vec Algorithm
For the application of the Node2vec algorithm, the creation of a Graph is necessary with the
respective nodes on which the Node2vec will be applied. Therefore, the graph has been created
using the following query with the business and category nodes which is stored into a Graph
catalogue of Neo4j Database.
Figure 33. Cypher Query to create a graph for Node2vec
The following output has been obtained which shows the nodes and relationships count and
projections with which the graph is created successfully.
Output

50 | P a g e
The following query is running in Python for applying the Node2vec algorithm on the graph
created in the previous query. The algorithm query is running in Python so that the embedded data
can be extracted into a Data frame in Python as shown in the query below. The Embedding size is
set to 2. So, two values of Embeddings for each Node Id have been formed in the list data structure.
The data can be prepared for further machine learning operations.
Figure 34. Cypher Query for Node2vec Algorithm

51 | P a g e
4.4 Clustering
The research uses traditional K-means Clustering Algorithm. The clustering has been applied with
the help of Tableau Analytics to get the better visualizations.
The Graph is created based on Business and Category nodes connecting them with the relationship
between them. The relationship name is ‘In_Category'. Before the application of the Node2vec
graph algorithm, the graph must be created which gets saved into a graph catalogue of Neo4j
Database. On the created graph, the Node2vec algorithm has been applied and the embeddings on
the data have been formed. This new data is extracted into a python Data frame so that the data
preparation on the embedded data for the application of further machine learning algorithms would
be easier.
For the application of K-Means clustering algorithm, it is necessary to prepare the data obtained
from Graph Embeddings. Following steps are taken to prepare the data.
1. The embedding feature is into a list format containing two embedding scores as shown in
figure 34.
2. Using python, the ‘Embedding’ feature containing a list structure with two values is
converted into two different features named ‘Embedding 1' and ‘Embedding 2' and the
values are separated into two different columns with the use of string separator.
3. Now, a new file containing features ‘NodeId', ‘Embedding1', and ‘Embedding2' is formed.
In this file, there are two types of Node ids for businesses and categories as the embedding
was formed on the two files.
4. These Node Ids have been separated using Excel. A new feature is created named ‘Label'.
In this new column, the ‘Business’ name is filled for the Node ids of businesses and the
‘Category' name is filled for the Node ids of categories. This made the visualization look
and sort better in Tableau Analytics.
5. Two more files for the Business names and Category names have been extracted from the
database.
6. Then, specific business names and category names have been added for the respected Node
ids by merging the Data frames using the ‘MERGE' operation in Python.
7. The clustering is applied to the newly prepared data with Tableau and the clustered data
has been formed. Six clusters are formed, and the following visualization is obtained.

52 | P a g e
4.4.1 Visualizations
Visualization 1
Six clusters are formed on the Embeddings of Businesses and Categories. The filter is created for
the feature ’Label’. The filter is set to ‘Business' for this Visualization. Businesses who are closely
connected to each other with their Business Names, based on Embeddings are visualized. Cluster
1 is the largest cluster containing 17.41% of the Businesses.
Figure 35. Clustering Visualization 1
53 | P a g e
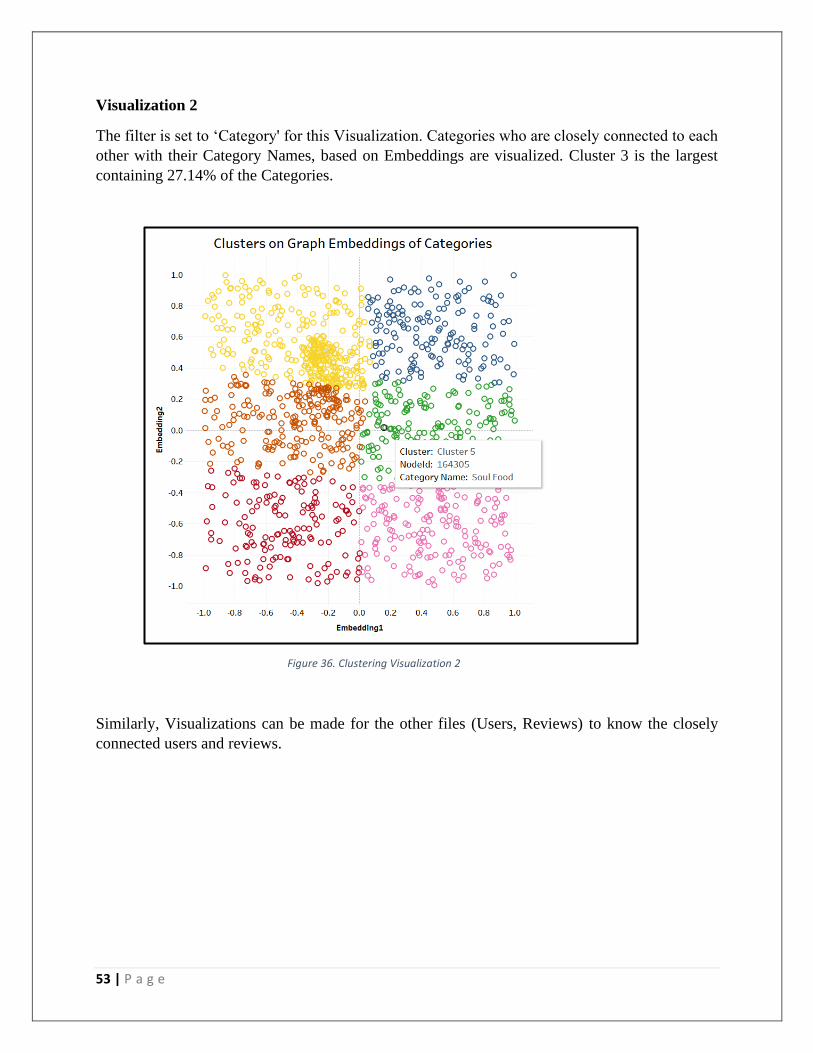
Visualization 2
The filter is set to ‘Category' for this Visualization. Categories who are closely connected to each
other with their Category Names, based on Embeddings are visualized. Cluster 3 is the largest
containing 27.14% of the Categories.
Figure 36. Clustering Visualization 2
Similarly, Visualizations can be made for the other files (Users, Reviews) to know the closely
connected users and reviews.

54 | P a g e
CHAPTER 5 - Conclusion
This Chapter concludes the work done in the research. Yelp Dataset is a very Challenging dataset
to explore because of its large size. On the internet, many unresolved queries on the loading of the
Yelp dataset can be found. The research showed a way of loading the dataset into a Graph DBMS,
Neo4j and exploring it. As compared to relational database, Graph database is more flexible. A
Graph Database is structured around the data and relationships. Changes to the data model can be
made without much impact to the application, using the graph data model. A graph database
provided the Graph Data Science library was focus of the research. Application of Py2Neo was
done for the feature extraction in Python. Different data frames were created in Python that could
be used for the various Machine Learning Operations. PageRank and Overlap Similarity
Algorithms gave the results of multiple outputs related to the insights of the data. Application of
Graph Embeddings was done and used in the K-Means Clustering algorithm, that gave the
visualizations of closely connected Businesses as well as Categories.
5.1 Future Work
➢ To avoid the issues of memory constraints while loading the data into Neo4j database,
Cloud Environment of the Neo4j Database can be explored in the future.
➢ Different machine learning operations can be used to get the more insights of the data.
55 | P a g e
REFERENCES
Kronmueller, M. et al. (2019) ‘A Graph Database of Yelp Dataset Challenge 2018 and Using
Cypher for Basic Statistics and Graph Pattern Exploration’, 2018 IEEE International Symposium
on Signal Processing and Information Technology, ISSPIT 2018. IEEE, pp. 135–140. doi:
10.1109/ISSPIT.2018.8642700.
Farhan, W. (2014) ‘Predicting Yelp restaurant reviews’, pp. 1–6.
Pradhan, L., Zhang, C. and Chitrakar, P. (2016) ‘Multi-view Clustering in Collaborative Filtering
Based Rating Prediction’, Proceedings - 2016 IEEE 10th International Conference on Semantic
Computing, ICSC 2016. IEEE, pp. 250–253. doi: 10.1109/ICSC.2016.40.
Shen, R. et al. (2016) ‘Predicting usefulness of Yelp reviews with localized linear regression
models’, Proceedings of the IEEE International Conference on Software Engineering and Service
Sciences, ICSESS. IEEE, 0, pp. 189–192. doi: 10.1109/ICSESS.2016.7883046.
McClanahan, B. and Gokhale, S. S. (2016) ‘Centrality and Cluster Analysis of Yelp Mutual
Customer Business Graph’, Proceedings - International Computer Software and Applications
Conference. IEEE, 1, pp. 592–601. doi: 10.1109/COMPSAC.2016.79.
Prithivirajan, M. et al. (2015) ‘Analysis of star ratings in consumer reviews: A case study of Yelp’,
Proceedings - 2015 IEEE International Conference on Big Data, IEEE Big Data 2015. IEEE, pp.
2954–2956. doi: 10.1109/BigData.2015.7364134.
Asghar, N. (2016) ‘Yelp Dataset Challenge: Review Rating Prediction’. Available at:
http://arxiv.org/abs/1605.05362.
Effendi, S. B., van der Merwe, B. and Balke, W. T. (2020) ‘Suitability of graph database
technology for the analysis of spatio-temporal data’, Future Internet, 12(5), pp. 1–31. doi:
10.3390/FI12050078.
Cui, Y. (2015) ‘An Evaluation of Yelp Dataset’, pp. 1–6. Available at:
http://arxiv.org/abs/1512.06915.

56 | P a g e
Sawant, S. (2013) ‘Collaborative Filtering using Weighted BiPartite Graph Projection - A
Recommendation System for Yelp’, Proceedings of the CS224W: Social and Information Network
Analysis Conference. Available at: http://web.stanford.edu/class/cs224w/projects2013/cs224w-
038-final.pdf.
Jindal, T. (2015) ‘Finding Local Experts From Yelp Dataset’, p. 1-36.
Wirth, R. & Hipp, Jochen. (2000). CRISP-DM: Towards a standard process model for data mining.
Proceedings of the 4th International Conference on the Practical Applications of Knowledge
Discovery and Data Mining.
Zou, Y. and Liu, Y. (2020) ‘The Implementation Knowledge Graph of Air Crash Data based on
Neo4j’, Proceedings of 2020 IEEE 4th Information Technology, Networking, Electronic and
Automation Control Conference, ITNEC 2020, (Itnec), pp. 1699–1702. doi:
10.1109/ITNEC48623.2020.9085182.
Wiese, L. (2019) ‘Tutorial: Data analytics with graph algorithms - A hands-on tutorial with Neo4j’,
Lecture Notes in Informatics (LNI), Proceedings - Series of the Gesellschaft fur Informatik (GI),
P-290, pp. 259–261. doi: 10.18420/btw2019-ws-26.
Rahman, Tahleen & Surma, Bartlomiej & Backes, Michael & Zhang, Yang. (2019). Fairwalk:
Towards Fair Graph Embedding. 3289-3295. 10.24963/ijcai.2019/456.
Allen, D. et al. (2019) ‘Understanding trolls with efficient analytics of large graphs in Neo4j’,
Lecture Notes in Informatics (LNI), Proceedings - Series of the Gesellschaft fur Informatik (GI),
P-289(Btw), pp. 377–396. doi: 10.18420/btw2019-23.
Hamilton, W. L., Ying, R. and Leskovec, J. (2017) ‘Representation Learning on Graphs: Methods
and Applications’, (August). Available at: http://arxiv.org/abs/1709.05584.
Neo4j Graph Database Platform. (2015). The Database Model Showdown: An RDBMS vs. Graph
Comparison. [online] Available at: https://neo4j.com/blog/database-model-comparison/
[Accessed 12 Aug. 2020]

57 | P a g e
Neo4j Graph Database Platform. (n.d.). Neo4j Graph Data Science Library – Graph Algorithms &
Analytics. [online] Available at: https://neo4j.com/graph-data-science-library/ [Accessed 15 Aug.
2020].
Neo4j Graph Database Platform. (2019). DeepWalk: Implementing Graph Embeddings in Neo4j.
[online] Available at: https://neo4j.com/blog/deepwalk-implementing-graph-embeddings-in-
neo4j/ [Accessed 15 Aug. 2020].
neo4j.com. (n.d.). 5.7.1. Node2Vec - 5.7. Node embeddings. [online] Available at:
https://neo4j.com/docs/graph-data-science/current/algorithms/node-embeddings/node2vec/
[Accessed 10 Aug. 2020].
Neo4j Graph Database Platform. (2020). Upgrade Your Graph Data Science Library Now (or Miss
Out on Cool New Features). [online] Available at: https://neo4j.com/blog/upgrade-your-graph-
data-science-library-now/ [Accessed 15 Aug. 2020].
neo4j.com. (n.d.). 5.2.1. PageRank - 5.2. Centrality algorithms. [online] Available at:
https://neo4j.com/docs/graph-data-science/current/algorithms/page-rank/ [Accessed 15 Aug.
2020].
neo4j.com. (n.d.). 5.4.6. Overlap Similarity - 5.4. Similarity algorithms. [online] Available at:
https://neo4j.com/docs/graph-data-science/current/alpha-algorithms/overlap/ [Accessed 15 Aug.
2020]
Image.slidesharecdn.com. 2020. [online] Available at:
<https://image.slidesharecdn.com/qdm5gazjtiydqhmjx8kx-signature-
a7979faeff760dbbf946e07829837a6f8fba2aec6402a99a6073d6414f2c467d-poli-
191114202923/95/how-graphs-are-changing-ai-30-638.jpg?cb=1573766645> [Accessed 20
August 2020].
Smart Vision Europe. 2020. Crisp DM Methodology - Smart Vision Europe. [online] Available at:
<https://www.sv-europe.com/crisp-dm-methodology/> [Accessed 12 August 2020].
Implementing K-means clustering in Python from Scratch, 2020, viewed 15th August,
https://cmdlinetips.com/2019/05/k-means-clustering-in-python/
58 | P a g e
APPENDICES
This section will guide through the contents of the Artefacts and steps to execute all the Python
scripts, Neo4j Cypher queries and Tableau.
Contents of the artefacts
Dataset- Yelp Dataset Challenge 2020.
Downloaded from- https://www.kaggle.com/yelp-dataset/yelp-dataset
Yelp Dataset has 5 Files in total out of which 3 files Business, Review and User have been
considered for the research.
Script to Extract Restaurants Data from Yelp Dataset and convert into CSV file format in
To+Extract+Restaurants+from+Yelp+Dataset.ipynb
Neo4j Cypher Queries to load the Restaurant Yelp into database code in Yelp_Data_Load.cyp
Insights of the data using py2neo, script Insights+with+py2neo.ipynb
Insights using PageRank and Overlap Similarity algorithms cypher queries in
PageRank&OverlapAlgorithm.cyp
Script for the Graph Embeddings and Preparation of Embedded data to further apply for Clustering
in Embedding+with+py2neo.ipynb
Model-
Clustering
Finally, the application of Clustering Algorithm and visualizations in Clustering.twbx
Top Related