


Languages
Pages
Legal


Implementation
and Outcomes of
Kansas Multi-Tier System
of Supports
Final Evaluation Report—2014
Submitted to:
Colleen Riley
Kansas State Department of
Education
900 SW Jackson St.
Topeka, KS 66612
Submitted by:
WestEd
Learning Innovations Program
300 Unicorn Park Drive, 5th Floor
Woburn, MA 01801
Tel : 781-481-1100
Fax : 781-481-1120
Contacts:
Kristin Reedy, Ed.D., and
Natalie Lacireno-Paquet, Ph.D.
Project Co-Directors, WestEd
Tel: 781-481-1100
Fax: 781-481-1120
Email: [email protected]
Date: January 2015
WestEd — a national nonpartisan, nonprofit research, development, and service
agency — works with education and other communities to promote excellence,
achieve equity, and improve learning for children, youth, and adults. WestEd has
15 offices nationwide, from Washington and Boston to Arizona and California,
with its headquarters in San Francisco. For more information about WestEd,
visit WestEd.org; call 415.565.3000 or, toll-free, (877) 4-WestEd; or write:
WestEd / 730 Harrison Street / San Francisco, CA 94107-1242.
© 2015 WestEd. All rights reserved.

Table of Contents
Executive Summary i
About the Evaluation i
Evaluation Findings iii
Introduction 1
Evaluation Findings 4
Scope and Reach of Kansas MTSS 4
Successful Implementation of Kansas MTSS 4
The Benefits of Kansas MTSS 14
KSDE Support for Kansas MTSS Implementation and
Sustainability 21
Refinement of Kansas MTSS Statewide
Implementation 24
Conclusion 26
Next Steps for Scaling-Up Kansas MTSS 27
Next Steps for Sustaining Kansas MTSS 28
Recommendations 29
Appendices 30
Appendix A: Evaluation Methods 30
Appendix B: Kansas MTSS School Survey of Effective
Instructional Practices Summary, 2014 34
Appendix C: Analysis of Kansas MTSS School Survey
of Effective Instructional Practices, by Stages of
Implementation 39
Appendix D: Infographic: MTSS Implementation:
What does it take? 51
References 53

Figures
Executive Summary Figure 1. Percentage of Schools at Various
Stages of Implementation, 2012 to 2014 v
Executive Summary Figure 2. Change in the Percentage of
Students at Benchmark, Fall to Spring, 2013/2014 vi
Figure 1. Stages of Implementation 9
Figure 2. Percentage of Schools Reporting MTSS Impact on
Student Outcomes “to some extent” or “to a great extent,” 2014 14
Figure 3. Reading: Average Increase in Percentage of Students
at Benchmark from Fall to Spring, 2013/14 16
Figure 4. Math: Average Change in Percentage of Students at
Benchmark from Fall to Spring, 2013/14 17
Figure 5. Behavior: Average Change in Percentage of Students
at Benchmark from Fall to Spring, 2013/14 18
Figure C1. School Participated in Structured Training 39
Figure C2. School Participated in Implementation Training 39
Figure C3. MTSS District- or Building-Led? 39
Figure C4. Building-Based Leadership Team? 40
Figure C5. Collaborative Teacher Teams or PLCs? 40
Figure C6. Building-based MTSS Facilitator or Coach? 40
Figure C7. Planning to Implement Reading? 41
Figure C8. Planning to Implement Math? 41
Figure C9. Shared Vision for MTSS at My School 42
Figure C10. Common Language About MTSS 42
Figure C11. Leadership Team Analyzes Universal Screening Data 42
Figure C12. Screening Data Informs Decision Making 43
Figure C13. Progress Monitoring Informs Decisions 43
Figure C14. Increase in Students at Benchmark on Screener 43
Figure C15. Increase in “Proficient” or Above on State Assessment 44
Figure C16. Decrease in Office Discipline Referrals 44
Figure C17. Decrease in Special Education Referrals 44
Figure C18. Professional Development Resources to Support MTSS 45
Figure C19. Barrier: Staff Turnover 45
Figure C20. Barrier: Change in District Leadership 45
Figure C21. Barrier: Lack of Fiscal Resources 46
Figure C22. Barrier: Lack of Building Leadership Support 46
Figure C23. Barrier: Lack of District Central Office Support 46

Figure C24. Barrier: Lack of Instructional Staff Support 47
Figure C25. Barrier: Lack of Parent Support 47
Figure C26. Barrier: Competing School Improvement Initiatives 47
Figure C27. Barrier: Lack of Time to Implement with Fidelity 48
Figure C28. MTSS Aligned Resources within Federal, State, or
Local Education Programs 48
Figure C29. MTSS Institutionalized 49
Figure C30. MTSS Integrated with School Improvement 49
Figure C31. Ongoing Professional Development to Sustain MTSS 49
Figure C32. Have Leadership to Sustain MTSS 50
Figure C33. Staff Support MTSS 50
Tables
Executive Summary Table 1. Classification of Responding
Schools by Stage of Implementation iv
Table 1. Classification of Responding Schools by Stage of
Implementation 10
Table 2. Movement of Schools between Stages of
Implementation, 2013 to 2014 11
Table 3. Number of Implementation Criteria Achieved by
Schools, 2014 12
Table 4. Reading: Average Change in Percentage of Students at
Benchmark from Fall to Spring, 2013/14 16
Table 5. Math: Average Change in Percentage of Students at
Benchmark from Fall to Spring, 2013/14 17
Table 6. Behavior: Average Change in Percentage of Students
at Benchmark from Fall to Spring, 2013/14 18
Table 7. Average Percentage of Elementary Schools Meeting or
Exceeding Standards on the Kansas Mathematics Assessment,
by Stage of Implementation, 2011, 2012, and 2013 19
Table 8. Average Percentage of Elementary Schools Meeting or
Exceeding Standards on the Kansas Reading Assessment, by
Stage of Implementation, 2011, 2012, and 2013. 20
Table A1. Classification of Responding Schools by Stage of
Implementation 31

i
Executive Summary The focus of the Kansas Multi-Tier System of Supports (MTSS) is to improve outcomes for all
students by instituting system-level change across the classroom, school, district, and state. Such
systemic change is accomplished through development of a coherent continuum of evidence-
based, system-wide practices to support a rapid response to each student’s academic and
behavioral needs, and features frequent data-based monitoring for instructional decision making.
Kansas MTSS integrates what is known about the components of effective schools into a single
framework for improved social and academic outcomes for all students. Core components
include evidence-based curriculum, high-quality instruction, a comprehensive assessment
system, data-based decision making, effective intervention, fidelity of implementation, ongoing
professional development, and leadership within an empowering school and district culture.
Implementation of MTSS has grown rapidly in Kansas and is a key approach used for turning
around low-performing schools in the state, with more than a third of all public schools
implementing MTSS to date. WestEd finds that Kansas MTSS is substantially contributing to
improved student outcomes at the local level, as well as benefitting teachers, improving
instruction, and supporting better school functioning.
About the Evaluation
After a competitive request for proposal process, the Kansas State Department of Education
(KSDE) contracted with WestEd, an independent, not-for-profit research, evaluation, technical
assistance, and professional development organization, to conduct an external evaluation of the
Kansas Multi-Tier System of Supports (MTSS). The WestEd evaluation team’s task was to design,
pilot, refine, and implement an evaluation system that measures the statewide progress of MTSS
toward its main goal: creating a statewide system of support to local schools and districts in
order to increase school capacity to use resources in ways that enable every child to be
successful. The project provided formative and summative evaluation information to KSDE for
improving and sustaining MTSS at the school, district, and state levels.
WestEd finds that Kansas MTSS is substantially contributing to improved student outcomes at
the local level as well as resulting in benefits to teachers, improved instruction, and school
functioning. Leadership and support from the KSDE Office of the Commissioner has been
instrumental in the promulgation of MTSS as a framework for improving the education of all
students. This summative evaluation report synthesizes data collected throughout the four-year
evaluation project, describes the current status of MTSS implementation, and provides insights
as to what it takes to implement MTSS with fidelity. It concludes with comments about the next
steps for MTSS implementation in Kansas.

ii
The evaluation was guided by five evaluation questions:
Scope: How many schools and districts are participating in MTSS?
Implementation: Annually, how many schools and districts are (a) exploring the use of MTSS to
meet students’ academic and behavioral needs, (b) adopting and installing components of MTSS
(e.g., assessments, curriculum, instruction, etc.), or (c) successfully implementing MTSS with
fidelity?
Student Outcomes: How are students in schools and districts that are fully implementing MTSS
performing?
Statewide System and Infrastructure: How effective are KSDE and MTSS Core Team activities
in supporting statewide implementation of MTSS with fidelity by schools and districts?
Sustainability: How successful are schools and districts in sustaining MTSS?
WestEd designed a multi-year, mixed-methods evaluation system. The evaluation system was
piloted and refined in 2011 prior to full implementation in 2012 through 2014. Key data collection
activities included:
An annual survey, entitled the Kansas MTSS School Survey of Effective Instructional Practices, with responses from more than 500 schools per year;
Two-day site visits to six schools where core and intervention instruction and team meetings were observed, and interviews and focus groups with leadership teams, teachers, and staff were conducted;
A multi-day site visit to Wichita Public Schools that included interviews and/or focus groups with the Superintendent, leadership teams, the MTSS advisory team, as well as day-long visits to five schools (2 high schools, 1 middle school, and 2 elementary schools). Multiple cross-district focus groups were conducted with teachers, principals, and school-based MTSS Facilitators/coaches;
A follow-up visit to Wichita Public Schools that included interviews with the Superintendent, a group interview with the leadership team, and interviews with over ten focus groups with more than 100 teachers, coaches, and principals;
Periodic interviews with KSDE leadership;
Periodic interviews with all members of the Core Team;
Focus groups with Recognized MTSS Facilitators;
Document review;
Annual observation and participation in the Kansas MTSS Symposium;
Annual collection of grade-level universal screening data for selected schools; and
Annual analysis of school-level state assessment data.
The evaluation system was designed to give a complete picture of the implementation and early
impact of MTSS. A mixed methods design was used to provide a full and comprehensive view of

iii
MTSS implementation across Kansas from the perspectives of key stakeholders and participants
and to offer an in-depth portrait of implementation in selected schools and districts across the
state.
This final, summative report synthesizes data collected throughout the four-year evaluation
project, describes the current status of MTSS implementation, and provides insights as to what it
takes to implement MTSS with fidelity. The key questions are:
Who participates in Kansas MTSS?
What happens in schools implementing MTSS?
What are the benefits of MTSS?
How does the KSDE support and sustain implementation of MTSS?
How has MTSS implementation changed over time?
What are the next steps for MTSS in Kansas?
Evaluation Findings
Who Participates in Kansas MTSS?
Finding 1: The scope and reach of MTSS as a statewide initiative is well-established in Kansas.
The statewide MTSS “presence” is pervasive. The state may be at a “tipping point” in terms of
statewide scale-up and installation of MTSS across the state.
At this point in time, 48.0% of the 1,472 schools in Kansas have participated in some level of
formal MTSS training. These schools represent 67.0% of the 293 districts across the state,
showing that approximately two-thirds of public school districts in Kansas have schools that have
participated in MTSS formal training experiences (2005–2014). Eighteen districts have taken a
district-wide approach to implementing MTSS. About 224,000 (43.0%) of all Kansas public school
students are enrolled in schools that have participated in Structuring or Implementation training
since 2008.
What Happens in Schools Implementing MTSS?
Finding 2: Schools are demonstrating the hallmarks of strong implementation of the Kansas
MTSS framework, specifically, they are demonstrating strong leadership at the school and district
level, high-quality core curriculum, instruction, and assessment practices, an empowering
culture with increased teacher collaboration, data use, ongoing professional development, and
the alignment and integration of school improvement initiatives. The consistent implementation
of these practices results in a smoothly run system that is achieving its intended outcomes.

iv
Finding 3: Implementation of MTSS at the school level is increasingly consistent with the Kansas
MTSS framework. Schools are moving from exploration/learning about MTSS to more advanced
implementation stages over time.
The 2014 statewide Kansas MTSS School Survey of Effective Instructional Practices yielded results
that provided a snapshot of MTSS implementation in schools across Kansas. Respondents to the
survey reported that they were currently implementing MTSS (75.5%), with another 10.7% of
respondents planning to implement. About 81.0% (448) of schools responding to the survey are
implementing MTSS at the initial implementation level or higher, and this is likely an
underestimate as it is based only on those schools responding to the survey. The majority are
implementing in reading (84.8%). More than half of respondents are implementing in math
(56.9%) and 43.7% of respondents are implementing in behavior (see Appendix B for a summary
of the 2014 survey findings). The percentage of schools scoring at the full implementation stage
remained stable at 8.3% for 2014. A similar pattern of responses was reported in 2012 and 2013
(see Executive Summary Table 1 and Executive Summary Figure 1).
Executive Summary Table 1. Classification of Responding Schools by Stage of Implementation
Stage of
Implementation
2012 2013 2014
Number Percentage Number Percentage Number Percentage
No stage 77 11.7 55 9.3 31 5.6
Exploration 266 40.5 70 11.8 70 12.6
Installation 58 8.8 16 2.7 6 1.1
Initial Implementation 215 32.8 402 67.9 402 72.4
Full Implementation 40 6.1 49 8.3 46 8.3
Total Implementers 579 88.2 537 90.7 524 94.4
Total 656 100.0% 592 100.0% 555 100.0%
Source: Authors’ analyses of primary data collected

v
Executive Summary Figure 1. Percentage of Schools at Various Stages of Implementation, 2012 to 2014
Source: Authors’ analyses of primary data collected
What are the benefits of MTSS?
Finding 4: MTSS is substantially contributing to improved student outcomes at the local level as
well as resulting in benefits to teachers, improved instruction, and school functioning.
Statewide, most respondents to the Kansas MTSS School Survey of Effective Instructional
Practices reported that to “some extent” or “to a great extent” implementing MTSS has had a
positive impact on student outcomes: students scoring at benchmark (89.5%); students scoring
as proficient on the state assessment (70.3%); a decrease in Office Discipline Referrals (77.1%);
and a decrease in special education referrals (63.4%).
Universal screening assessment data from a sample of schools at full implementation shows gains
on average for reading and math (except third-grade math), with the largest gains evidenced in
kindergarten (see Executive Summary Figure 2).
11.7
9.3
5.6
49.3
14.5
13.7
32.8
67.9
72.4
6.1
8.3
8.3
0 20 40 60 80 100
2012
2013
2014
No Stage
Expl./Installation
Initial Impl.
Full Implementation

vi
Executive Summary Figure 2. Change in the Percentage of Students at Benchmark, Fall to Spring,
2013/2014
Source: Authors’ analyses of primary data collected
However, hard data on student achievement/improvement is not available statewide. State
assessment data is inconclusive as to any patterns or trends in the achievement levels of schools
implementing MTSS.
In survey data and interviews with the Core Team and case study sites, respondents report
benefits to students, teachers, and schools as a result of implementation of MTSS. Survey
responses show that schools are observing more students scoring at benchmark on the universal
screeners, behavior is improving, there are fewer special education referrals, and student
engagement and motivation has improved. Focus group and interview data indicate that schools
and teachers are changing their attitudes and practices related to collaboration and shared
responsibility for all students, developing a common language, and using data in their decision-
making processes. MTSS helps schools to focus on strengthening the core curriculum and
instruction as well as on interventions.
How Does the KSDE Support and Sustain the Implementation of Kansas MTSS?
Finding 5: KSDE has established an effective statewide infrastructure to support and sustain
MTSS implementation.
Components include the MTSS Core Team, the cadre of Recognized MTSS Facilitators, the
annual MTSS Symposium, an extensive and frequently updated website of materials, research,
and resources on MTSS, and an ongoing dissemination plan implemented in coordination with
-10
-5
0
5
10
15
20
K 1st 2nd 3rd 4th 5th
Reading
Math

vii
the Technical Assistance System Network (TASN). Professional development materials are well
aligned with national professional learning standards, such as the Learning Forward standards
(2012).
Evidence from the 2014 school survey, Core Team, KSDE leadership, case study principal and
administrator interviews and focus groups, the document review, and the MTSS website
demonstrate that KSDE and the Core Team are effectively supporting implementation of MTSS
with fidelity. Specifically, respondents to the 2014 school survey reported that, “to some extent”
or “to a great extent,” KSDE has established the necessary infrastructure to sustain and extend
MTSS implementation over time (77.4%), that KSDE effectively disseminates information about
MTSS (75.9%), that there are sufficient resources (76.0%), and that MTSS is clearly aligned with
other state and local improvement initiatives (79.3%). Sixty-one percent of respondents agreed
that there are sufficient MTSS Facilitators to support MTSS statewide.
How Has Kansas MTSS Implementation Changed Over Time?
Finding 6: MTSS implementation is being refined in Kansas to focus on the district rather than
the individual school level, and to the use of an “integrated model” where the areas of reading,
math, and behavior are approached simultaneously.
The shift to investment at the district level using the integrated MTSS—a comprehensive,
integrated three-tier (MTSS: CI3T) framework—will require increased capacity on the part of the
Core Team. According to the 2014 school survey, a slight majority (56.1%) of respondents
described MTSS as a “district-led” initiative; however, this does not necessarily mean that the
district has taken a district-wide approach (as Wichita has done). Sixty-seven percent of Kansas
districts have had schools who have participated in formal MTSS training, according to the data
on annual training participation, while 18 districts have engaged in district-wide training and are
taking a district-wide approach to MTSS.
What are the Next Steps for MTSS in Kansas?
Next steps for MTSS in Kansas may be summed up as, “Stay the course.” Investment in district-
level capacity building, the strengthening of the Core Team, and continual adherence to the
MTSS framework, as more and more districts and schools join the MTSS ranks, will sustain and
expand MTSS over time. Investment in a statewide data system would enable KSDE to document
the impact MTSS is having on student outcomes.
The evaluation activities over the past four years—from the annual online survey to the school
case studies, the in-depth study of Wichita as the evaluation’s district-wide example to interviews
with the Core Team—have provided a valuable perspective on sustainability of a statewide
initiative such as MTSS—what it takes and what the challenges are. Staff buy-in and support, the

viii
integration and institutionalization of MTSS practices so that it becomes routine, the “way of
doing things” and the umbrella for all school improvement efforts appear to be key. Training of
staff, flexible scheduling, and the purchase of resource materials are all necessary but not
sufficient. Sustained and continued district and school leadership support for MTSS through
words and action are critical for statewide and local sustainability.
Kansas is both at a turning point and tipping point with regard to MTSS. The shift to a district-
level focus for training and support and the move to the integrated model represent key decision-
points in the process of statewide implementation. A scaling up tipping point may have been
reached in terms of the number of schools and districts that are engaged in MTSS statewide. At
this point in time, 48.0% of the 1,472 schools in Kansas have participated in some level of formal
MTSS training. These schools represent 67.0% of the 293 districts across the state.
A stay-the-course/on-message approach from the state level on down appears to be the way to
move forward with expansion and sustainability.

1
Introduction The focus of Kansas Multi-Tier System of Supports (MTSS) is to improve outcomes for all
students by instituting system-level change across the classroom, school, district, and
state. Such systemic change is accomplished through development of a coherent
continuum of evidence based, system-wide practices to support a rapid response to each
student’s academic and behavioral needs, and features frequent data-based monitoring for
instructional decision making.
Kansas MTSS integrates what is known about the components of effective schools into a
single framework for improved social and academic outcomes for all students. Core
components include evidence-based curriculum, high-quality instruction, a
comprehensive assessment system, data-based decision making, effective intervention,
fidelity of implementation, on-going professional development, and leadership within an
empowering school and district culture.
Implementation of MTSS has grown rapidly in Kansas and is a key approach used for
turning around low-performing schools in the state, with more than a third of all public
schools implementing MTSS to date. WestEd finds that Kansas MTSS is substantially
contributing to improved student outcomes at the local level, benefits to teachers,
improved instruction, and better school functioning.
After a competitive request for proposal process, the Kansas State Department of
Education (KSDE) contracted with WestEd, an independent, not-for-profit research,
evaluation, technical assistance, and professional development organization, to conduct
an external evaluation of the Kansas Multi-Tier System of Supports (MTSS).
The WestEd evaluation team’s task was to design, pilot, refine, and implement an
evaluation system that measures the statewide progress of MTSS toward its main goal:
creating a statewide system of support to local schools and districts in order to increase
school capacity to use resources in ways that enable every child to be successful. The
project was intended to provide formative and summative evaluation information to KSDE
for improving and sustaining MTSS at the school, district, and state levels.
A conceptual framework was developed by KSDE to visually
represent MTSS (at right). The graphic illustrates that MTSS
is more than a system of tiered academic and behavioral
interventions targeted to “few,” “some,” or “all” students.
Curriculum, instruction, and assessment form the core of
the framework that supports all students while the core, in
turn, is supported by leadership, professional development,
and an empowering culture. Taken together, these
components represent the Kansas MTSS framework.

2
This final, summative report synthesizes data collected throughout the four-year
evaluation project, describes the current status of MTSS implementation, and provides
insights as to what it takes to implement MTSS with fidelity.
WestEd found that Kansas MTSS is substantially contributing to improved student
outcomes at the local level as well as resulting in benefits to teachers, improved
instruction, and school functioning. Leadership and support from the Kansas State
Department of Education (KSDE) Office of the Commissioner has been instrumental in
the promulgation of MTSS as a framework for improving the education of all students.
This summative evaluation report synthesizes data collected throughout the four-year
evaluation project, describes the current status of MTSS implementation, and provides
insights as to what it takes to implement MTSS with fidelity. The report is organized
around the evaluation’s six main findings summarized in the Executive Summary. It
concludes with comments about the next steps for MTSS implementation in Kansas.
The evaluation was guided by five evaluation questions:
Scope: How many schools and districts are participating in MTSS?
Implementation: Annually, how many schools and districts are (a) exploring the use of
MTSS to meet students’ academic and behavioral needs, (b) adopting and installing
components of MTSS (e.g., assessments, curriculum, instruction, etc.), or (c) successfully
implementing MTSS with fidelity?
Student Outcomes: How are students in schools and districts that are fully
implementing MTSS performing?
Statewide System and Infrastructure: How effective are KSDE and MTSS Core Team
activities in supporting statewide implementation of MTSS with fidelity by schools and
districts?
Sustainability: How successful are schools and districts in sustaining MTSS?
WestEd designed a multi-year, mixed-methods evaluation system. The evaluation system
was designed to give a complete picture of the implementation and early impact of MTSS.
A mixed methods design was used to provide a full and comprehensive view of MTSS
implementation across Kansas from the perspectives of key stakeholders and participants
and to offer an in-depth portrait of implementation in selected schools and districts across
the state. The system was piloted and refined in 2011 prior to full implementation in 2012
through 2014. Key data collection activities included:
An annual survey, entitled the Kansas MTSS School Survey of Effective Instructional Practices with responses from more than 500 schools per year;
Two-day site visits to six schools where core and intervention instruction and team meetings were observed and interviews and focus groups were conducted with leadership teams, teachers, and staff;

3
A multi-day site visit to Wichita Public Schools that included interviews and/or focus groups with the Superintendent, leadership teams, MTSS advisory team, and day-long visits to five schools (2 high schools, 1 middle school, and 2 elementary schools). Multiple cross-district focus groups were conducted with teachers, principals, and school-based MTSS Facilitators/coaches;
A follow-up visit to Wichita Public Schools that included interviews with the Superintendent, a group interview with the leadership team, and over ten focus groups with more than 100 teachers, coaches, and principals;
Periodic interviews with KSDE leadership;
Periodic interviews with all members of the Core Team;
Focus groups with Recognized MTSS Facilitators;
Document review;
Annual observation and participation in the Kansas MTSS Symposium;
Annual collection of grade-level universal screening data for selected schools; and
Annual analysis of school-level state assessment data.

4
Evaluation Findings
Scope and Reach of Kansas MTSS
The scope and reach of MTSS as a statewide initiative is well-established in Kansas, with
48.0% of all schools having participated in formal MTSS training. The state may be at a
“tipping point” in terms of statewide scale-up and installation of MTSS across the state.
At this point in time, 48.0% of the 1,472 schools in Kansas have participated in formal
MTSS Structuring or Implementation training in one or more content areas (reading,
math, and behavior). These schools represent 67.0% of the 293 districts across the state
showing that approximately two-thirds of public school districts in Kansas have schools
that have participated MTSS formal training between 2005 and 2014. Eighteen districts
have taken a district-wide approach to implementing MTSS. About 224,000 (43.0%) of all
Kansas public school students are enrolled in schools that have participated in Structuring
or Implementation training since 2008, the point at which the current MTSS framework
and training model being evaluated began being used.
Over the course of the MTSS evaluation, participation in formal MTSS training and local
implementation has increased across the state. To date, 704 schools have participated in
one or more Structuring trainings to plan and prepare to implement the MTSS framework
in reading, math, or behavior, with 408 (58.0%) of these continuing on to complete
Implementation Training. The majority of training has been in the area of reading,
followed by behavior and then math.
Based on 2014 interviews with the state-level Core Team, members’ assessment of the
current status of MTSS implementation in Kansas is that:
“Everyone knows what MTSS is.”
“The whole state knows what a multi-tier system is but they may not have chosen to
do it.”
“The message is out there: MTSS is the school improvement approach in the state.”
Given that there is no state mandate for schools and districts to implement MTSS, Core
Team members and KSDE leadership are encouraged by the growth in the number of
implementing schools over the past five years. They expect continued scaling-up of MTSS
implementation across the state.
Successful Implementation of Kansas MTSS
Hallmarks of strong implementation include adherence to the Kansas MTSS framework,
specifically leadership at the school- and district- levels; high-quality core curriculum,

5
instruction, and assessment practices; an empowering culture with increased teacher
collaboration; data use; ongoing professional development; and the alignment and
integration of school improvement initiatives.
Over the course of the evaluation, common practices and features of schools fully
implementing MTSS show what it takes for successful MTSS implementation. The
consistent implementation of these practices results in a smoothly run system that is
achieving its intended outcomes.
What MTSS Looks Like in Schools
Commonalities among the case study schools provide a good picture of what MTSS looks
like in practice. At the elementary and middle grades level, we typically see a school-level
leadership team involving classroom teachers, special education teachers, one or more
administrators, and sometimes a counselor or school psychologist. This group serves to
train teachers and paraprofessionals; it reviews school-wide data and makes decisions
using the data-based feedback loop. Frequently this group is charged with vetting and
deciding upon which curricular interventions to use and organizing the three-times-per-
year universal screening. In addition to the leadership team, schools at full
implementation often have a formal or informal MTSS site coordinator—frequently the
Title I teacher. This coordinator usually meets with grade-level teams on a weekly basis to
review progress monitoring data and/or review and adjust the student groupings for
intervention. At the elementary level, it is not uncommon for student groups to change on
a weekly basis. At the middle school level, groups change less frequently but usually on a
monthly basis or at the end of a marking period. At the high school level, seat time and
credit requirements often result in intervention time being offered as an elective “class”
with adjustments made on a semester basis.
At the elementary and middle grades level, we see schools that have carved one or two
intervention blocks into their daily schedules. These blocks are sometimes the result of
slightly longer school days or shortened periods, or, at the middle and high school levels,
by shortening the time between classes. During intervention blocks, all students
participate in a small group activity based on the results of their universal screening and
diagnostic assessment data. Students identified as at-risk or below grade level participate
in focused skill-based reading and/or math interventions. At the elementary school level,
we might see groups of three to five students working with a teacher or paraprofessional
on very specific reading and language skills such as consonant blends. At the middle
school, it is typical to see small groups working on reading with age-appropriate stories
that teach and reinforce basic reading skills such as fluency or comprehension.
Schools establish a consistent schedule for intervention time. Students typically leave their
classrooms and walk to their designated intervention group, which may be meeting in
another classroom or school space, such as the library. Students generally participate in

6
intervention activities for four days a week, with the fifth day reserved for quick progress
monitoring assessments, the results of which are used to determine the appropriate group
and activities for the following week. Grade-level teams meet weekly to coordinate the
intervention time, determine interventions to be used, and review data.
Supports for Implementation
Key supports identified through the evaluation include leadership, ongoing professional
development, integration of school improvement initiatives, and paying attention to
fidelity. Across evaluation data sources, these supports emerged as key to ensuring a high
level of implementation. None of the factors are surprising, as they have been identified in
other studies as important facilitators to school-level program implementation.1
Leadership
Consistently across all data sources, leadership at the school and district levels is
necessary for successful implementation. District and principal leadership and support are
needed to make big changes and hard decisions, such as changes to schedules, staffing,
and allocation of resources. The priorities of district and school leadership also send clear
messages to teachers about what the focus of their efforts should be. For example, in
Wichita, the superintendent and school board clearly articulated that implementing an
MTSS framework in reading and behavior is the work and focus of the whole district. They
laid out a five-year implementation plan that included initial and ongoing professional
development, the development of tools and processes to support and track the work, and
the creation of cross-district teams to inform and guide the process. In Wichita schools,
the impact of these leadership actions is evident; schools are engaging in the key MTSS
practices with a high degree of fidelity and there is use of common language across the
district to describe these practices.
Fidelity
In this evaluation, fidelity to the MTSS framework was determined through school-level
self-report in response to the annual Kansas MTSS School Survey of Effective Instructional
Practices. Survey items addressed the degree to which the key features of the
MTSS framework are being addressed in schools implementing MTSS. For the case study
schools, the evaluators also observed for fidelity to the framework during their site visits.
1 See for example: Kincaid et al., 2007; Fixsen et al., 2009; Mendenhall et al., 2013.

7
Professional development/preparation to implement
Consistent with the implementation science literature2, schools identify professional
development, especially ongoing professional learning supports, as key to
implementation. Schools report that it is helpful to participate in a year of Structuring
training before actual implementation. Implementation is also supported by working with
a Recognized MTSS Facilitator and/or a school-based MTSS coordinator. Working with a
facilitator provides school staff with an external expert who can answer questions and/or
help work through challenges. Similarly, an in-house coordinator can provide such
supports as professional learning for data use and advice for small group instructional
interventions.
Integration across school improvement initiatives
Research supports the idea that coherence and alignment among various school programs
are important factors in supporting their implementation.3 When MTSS is established as
the framework under which all school improvement initiatives are organized, as opposed
to “just one more” initiative, there is a greater level of support for implementation among
school staff. Such coherence is evident in MTSS case study schools in the coordination of
staff, resources, and schedules. Examples of state initiatives that have been aligned with
MTSS include the Kansas Learning Network (KLN), which supports low-performing Focus
and Priority Schools identified under the ESEA waiver, school accreditation standards,
teacher evaluation systems, and the adoption of the Kansas College and Career Ready
Standards.
Attention to fidelity of implementation
Case study and survey data indicate that schools that established formal processes for
monitoring fidelity of implementation seemed to achieve stronger or higher levels of
implementation. These schools had teams, such as the MTSS leadership team, who
monitored to ensure that teachers were teaching the core curriculum, that progress
monitoring occurred, that students participated in interventions, and that the
interventions were delivered with fidelity. These schools closely followed the
state-developed Structuring and Implementation guides in monitoring MTSS practices.
Challenges to Implementation
As consistently described across data sources, high-quality implementation of MTSS is not
necessarily easy or smooth. To implement MTSS with fidelity requires systems change,
2 Fixsen et al., 2005. 3 Beaver & Weinbaum, 2012; Newmann et al., 2001

8
which the literature and experience indicates is never without challenge.4 Some challenges
consistently noted by schools implementing MTSS in Kansas include:
Changes in staff and leadership
In the early phases of implementation, there is frequently a “champion” for MTSS at the
school level. This champion is often a teacher, Title I teacher, or principal. When this
leader or champion leaves a school before MTSS is firmly ingrained or institutionalized,
MTSS implementation may be difficult to sustain. Related, while a great deal of
professional development for teachers and staff occurs early in the implementation
process, if ongoing professional development is not continued, there can be a loss of
understanding and knowledge about MTSS, particularly with staff turnover.
Course selection and credit accumulation at the secondary level
Implementation of MTSS in middle and high school is complicated by course selection
and, at the high school level, credit accumulation issues. Because of the way most middle
and high schools schedule classes, intervention time usually takes the place of an actual
class, typically an elective. Students are locked into the intervention period for an entire
semester regardless of how quickly they master the targeted skills or content.
Furthermore, students may be forced to give up an elective class they enjoy in order to
participate in intervention, which may be a disincentive to getting needed academic
support.
Scheduling time for implementing the MTSS framework
It is challenging for educators to find time in their daily schedules to implement all of the
required tasks and practices of the MTSS framework. Scheduling challenges also include
the time it takes to find, vet, organize, and prepare for the daily intervention activities.
Time for collaborative teacher teams to review student progress and to plan interventions
is also difficult to work into the school day.
Integrating multiple MTSS content areas
To date, most schools have started MTSS implementation with one MTSS content area
(reading, math, or behavior) and once implementation is solid, consider adding an
additional area. Schools find it a logistical challenge to integrate a second or third MTSS
area, because this expansion raises organizational and coordination questions such as
whether two leadership teams are required and/or two intervention periods.
Staff knowledge and skill in designing intensive interventions
Some school staff report concerns or challenges in finding the appropriate intervention for
students who are not progressing as expected when using a particular intervention. The
4 See for example, Fixsen et al., 2005; Hall & Hord, 2006.

9
question becomes how to appropriately address the needs of students who need more
intensive, highly individualized support.
Stages of Implementation
Implementation of MTSS at the school level is increasingly consistent with the Kansas
MTSS framework. Schools are moving from exploration or learning about MTSS to more
advanced implementation stages over time.
The evaluation was designed to gauge the stage of implementation of each school
implementing MTSS. Progress of MTSS implementation at the school level appears to be
consistent with the Kansas MTSS framework. MTSS is being implemented to some degree
in 94.4% of the 555 schools that responded to the Kansas MTSS School Survey of Effective
Instructional Practices. Schools are increasingly at the initial implementation stage that
includes a key set of practices related to universal screening, leadership practices,
assessment, instruction, data use, and professional development.
Stages of Implementation
Dean Fixsen and colleagues (2005) developed a typology to describe program
implementation along a continuum of six stages. The Fixsen framework was used to
inform WestEd’s thinking about the range of implementation of MTSS in school buildings
and districts. The increasing levels or stages of implementation include exploration and
adoption, installation, initial implementation, full implementation, innovation, and
sustainability. The stages can be viewed as markers along a continuum of
implementation, as depicted in Figure 1. Given that it can take 3–5 years for a program
to reach the full implementation stage, for the purposes of this evaluation, WestEd
focused on the first four stages. A school’s stage of implementation was determined by
the school’s response to a set of 22 items on the Kansas MTSS School Survey of Effective
Instructional Practices.
Figure 1. Stages of Implementation
Adapted from Fixsen et al. (2005)
The 2014 statewide Kansas MTSS School Survey of Effective Instructional Practices yielded
results that provide a snapshot of MTSS implementation in schools across Kansas. Among
the 555 respondents, 75.5% reported that they were currently implementing MTSS and
another 10.7% of respondents reported they are planning to implement. About 81.0% (448)
of respondents are implementing MTSS at the initial implementation level or higher, and
this is likely an underestimate as it is based only on those schools responding to the
survey. A large majority (84.8%) of respondents are implementing in reading, more than
Exploration and Adoption
Program Installation
Initial Implementation
Full Implementation
Innovation Sustainability

10
half are implementing in math (56.9%), and 43.7% of respondents are implementing in
behavior (see Appendix B for a summary of the 2014 survey findings). The percentage of
schools scoring at the full implementation stage remained stable at 8.3% for 2014. A
similar pattern of responses was reported in 2012 and 2013.
Table 1 shows responding schools’ stages of MTSS implementation by year. Among the
2014 respondents, 46 schools (8.3%) scored at the full implementation stage and have
institutionalized the practices of MTSS to a high degree of self-reported fidelity. Another
72.4% were at the initial implementation stage. A comparison with 2012 and 2013 results
shows that the percentage of schools scoring in the initial implementation stage increased
significantly, from 32.8% in 2012, to 67.9% in 2103, to 72.4% in 2014. This corresponds to a
parallel change in schools scoring in the exploration stage which shifted from 40.5% (2012)
to only 11.8% (2013) and 12.6% (2014), indicating movement from exploration to initial
implementation from one year to the next.
Table 1. Classification of Responding Schools by Stage of Implementation
Stage of
Implementation
2012 2013 2014
Number Percentage Number Percentage Number Percentage
No stage 77 11.7 55 9.3 31 5.6
Exploration 266 40.5 70 11.8 70 12.6
Installation 58 8.8 16 2.7 6 1.1
Initial Implementation 215 32.8 402 67.9 402 72.4
Full Implementation 40 6.1 49 8.3 46 8.3
Total Implementers 579 88.2 537 90.7 524 94.4
Total 656 100.0% 592 100.0% 555 100.0%
Source: Authors’ analyses of primary data collected
Statewide 2014 MTSS survey data indicate that MTSS is being implemented to some
degree in 94.4% of responding schools; that is, those respondents that scored in one of the
stages of implementation. This percentage increased steadily from 88.2% in 2012 and
90.7% in 2013. Survey responses in 2014 indicated that 72.4% of responding schools were at
the initial implementation stage and 46 schools (8.3%) were at the full implementing
stage.
Table 2 shows how schools moved between the stages of implementation from 2013 to
2014. The table is based on the 292 schools that responded to the survey in both 2013 and

11
2014. Looking at the row of initial implementation in 2013, we see that of the schools
scoring in the initial implementation stage in 2013, 88.5% remained at initial
implementation in 2014, 7.4% scored at full implementation in 2014, and 4.1% scored at
the exploration stage. Of those schools at full implementation in 2013, 37.8% remained at
full implementation and 62.2% scored at the initial implementation stage. It is important
to note that the criteria used for survey scoring at the full implementation stage are quite
stringent and a different response to one or two items can move a school from full to
initial implementation, one year to the next. As noted above, systems change is not a
linear process. Schools may move back and forth on the stages continuum, gradually
making progress over time.
Table 2. Movement of Schools between Stages of Implementation, 2013 to 2014
Stage of
Implementation
Exploration
2014
Installation
2014
Initial
Implementation
2014
Full
Implementation
2014
Exploration 2013 18 (51.4%) 0 (0.0%) 16 (45.7%) 1 (2.9%)
Installation 2013 3 (42.9%) 0 (0.0%) 4 (57.1%) 0 (0.0%)
Initial Implementation
2013 9 (4.1%) 0 (0.0%) 192 (88.5%) 16 (7.4%)
Full Implementation
2013 0 (0.0%) 0 (0.0%) 23 (62.2%) 14 (37.8%)
Note: This table is based on the subset of schools that responded to the survey in both 2013 and 2014.
Source: Authors’ analyses of primary data collected
To achieve full implementation, schools must meet nine specific criteria, corresponding to
20 items on the Kansas MTSS School Survey of Effective Instructional Practices. For the
initial implementation stage, schools need to achieve between one and eight of the
criteria. Table 3 below shows the number of criteria achieved by schools in the initial and
full implementation stages. The table indicates that 58 schools scored eight of the criteria
and almost achieved the full implementation stage, that is, they missed only one of the
nine criteria necessary for full implementation.

12
Table 3. Number of Implementation Criteria Achieved by Schools, 2014
Number of
Criteria Met
Number of
Schools
Percentage of
Schools
1 36 8.0%
2 42 9.4%
3 41 9.1%
4 53 11.8%
5 57 12.7%
6 57 12.7%
7 58 13.0%
8 58 13.0%
9 (Full Implementation) 46 10.3%
Total 448 100.0%
Source: Authors’ analyses of primary data collected
Further analysis of the self-reported survey data shows that the criterion related to data-
based decision making is the one that is met the least consistently, with only 43.9% of
schools meeting the criterion in 2014. The items related to data-based decision making
include that the school leadership team reviews data monthly. In contrast, the criterion
related to universal screening is the mostly likely to be met, with 87.5% of schools
reportedly conducting universal screening three times per year (once a year for high
school).
Requirements for Fully Implementing MTSS
Analysis of the 2014 school survey data shows that schools scoring in the full
implementation stage on the school survey appear to share common practices and
characteristics. These trends are demonstrated in a series of charts presented in
Appendix C. These practices were also evident in the case study schools, which, except for
one high school, scored at full implementation.
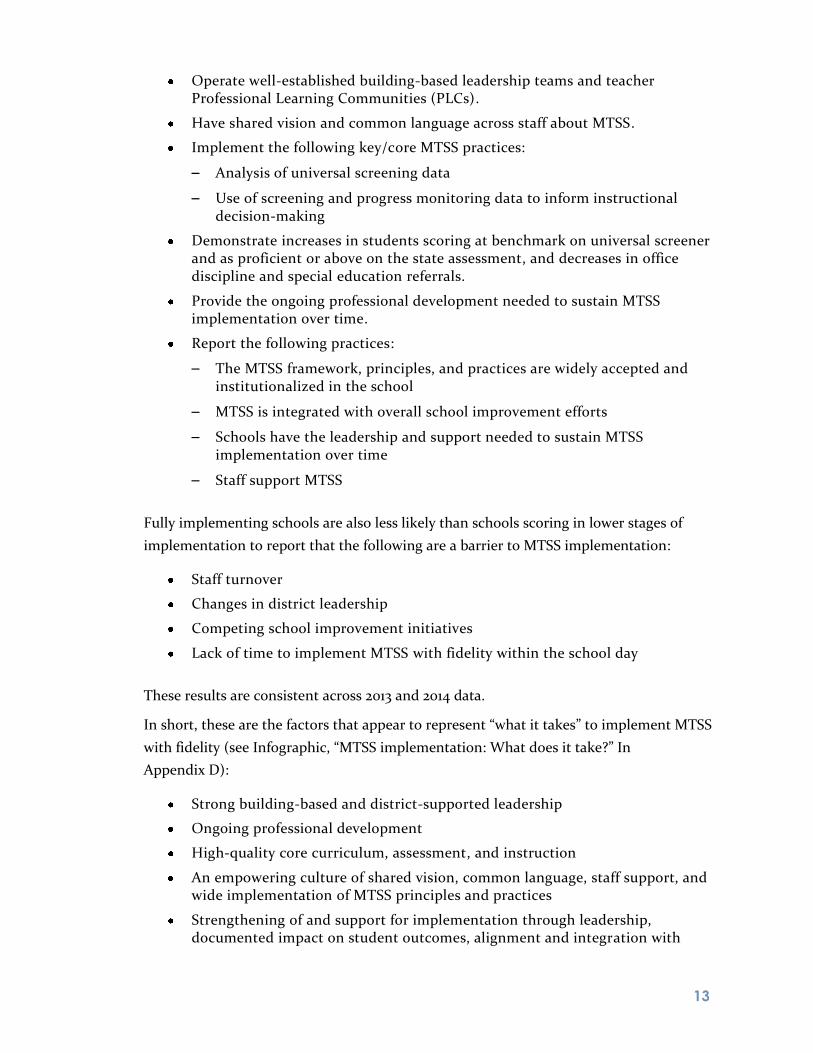
Schools in the full implementation stage are more likely than schools in the lower stages
to:
Have participated in formal MTSS training experiences, both Structuring and Implementation training.
Describe their MTSS work as a district-led rather than a building-led initiative.
13
Operate well-established building-based leadership teams and teacher Professional Learning Communities (PLCs).
Have shared vision and common language across staff about MTSS.
Implement the following key/core MTSS practices:
– Analysis of universal screening data
– Use of screening and progress monitoring data to inform instructional decision-making
Demonstrate increases in students scoring at benchmark on universal screener and as proficient or above on the state assessment, and decreases in office discipline and special education referrals.
Provide the ongoing professional development needed to sustain MTSS implementation over time.
Report the following practices:
– The MTSS framework, principles, and practices are widely accepted and institutionalized in the school
– MTSS is integrated with overall school improvement efforts
– Schools have the leadership and support needed to sustain MTSS implementation over time
– Staff support MTSS
Fully implementing schools are also less likely than schools scoring in lower stages of
implementation to report that the following are a barrier to MTSS implementation:
Staff turnover
Changes in district leadership
Competing school improvement initiatives
Lack of time to implement MTSS with fidelity within the school day
These results are consistent across 2013 and 2014 data.
In short, these are the factors that appear to represent “what it takes” to implement MTSS
with fidelity (see Infographic, “MTSS implementation: What does it take?” In
Appendix D):
Strong building-based and district-supported leadership
Ongoing professional development
High-quality core curriculum, assessment, and instruction
An empowering culture of shared vision, common language, staff support, and wide implementation of MTSS principles and practices
Strengthening of and support for implementation through leadership, documented impact on student outcomes, alignment and integration with

14
other school improvement initiatives, and adequate planning and collaborative problem-solving within the school day.
The Benefits of Kansas MTSS
The consistent implementation of MTSS practices is substantially contributing to
improved student outcomes at the local level as well as resulting in benefits to teachers,
improved instruction, and school functioning. Data from multiple sources, including the
school survey, focus groups, interviews, and school site visits, indicate that MTSS is
resulting in increased learning for students, including improved skills in reading and math
that position students for ongoing achievement at expected levels.
Benefits to Students
Qualitative Data
As noted in Figure 2, respondents to the Kansas MTSS School Survey of Effective
Instructional Practices reported that to “some” or “to a great extent” implementing MTSS
has had a positive impact on student outcomes: students scoring at benchmark (89.5%);
students scoring as proficient on the state assessment (70.3%); decrease in Office
Discipline Referrals (77.1%); and decrease in special education referrals (63.4%).
Figure 2. Percentage of Schools Reporting MTSS Impact on Student Outcomes “to some extent” or
“to a great extent,” 2014
Source: Authors’ analyses of primary data collected
Interview and focus group data from the Core Team, KSDE leadership, case study school
interviews, and Wichita focus groups with teachers; principals and MTSS Facilitators also
support the positive impact of MTSS on student achievement and behavior.
Commonly reported benefits included (1) local school and district data showing
improvements in both academics and behavior (e.g., universal screening data, progress
0
20
40
60
80
100
Increase in
Benchmark
Increase in Proficient
on KSA
Decrease in Office
Discipline Referrals
Decrease in Special
Ed Referrals

15
monitoring data) and the progress of students from lower levels of tiered interventions;
(2) improvements in school culture and attitudes about student discipline, including
schools taking a systemic view and intentional review of student data; (3) students
receiving support and intervention earlier and thus “catching up” due to early
intervention; (4) increased individual student goal setting based on their own data,
(5) increased student motivation and pride in accomplishments; and (6) increased
efficiency in the special education referral and evaluation process, which now includes
more data-based information about referred students.
Building-Level Status Form Data
Universal screening assessment data from a sample of schools shows gains on average for
reading and math, with the exception of third grade math. The largest gains were
evidenced in Kindergarten.
Behavior data, which are tracked as office discipline referrals by grade level, show a
decrease in students scoring at benchmark (see Tables 4–6). Specifically, in reading the
greatest gains are in Kindergarten and first grade. Similar growth was found for math in
Kindergarten but the trend did not hold for grade 1. The behavior data show a loss of
progress over the course of the school year. It is important to note that Building-Level
Status Form data are from a small number of schools and cannot be considered causal.
The low number of reporting schools, especially in math (9–11 schools) and behavior
(5 schools) makes the Building-Level Status Form data inconclusive.5
When interpreting these data it is important to consider that universal screeners are not
pre/post tests but rather are designed to measure student academic growth over the
school year. During that period, the expectations increase as the school year progresses.
As a result, a student who scores below benchmark in September may grow in his/her
skills but may not yet reach the higher end-of-year benchmark. Similarly, a student above
benchmark in the fall may not stay at that level if he/she does not acquire the expected
increase in skills over the school year. Benchmark screening data are summarized in tables
4 through 8 and figures 3 through 5 below. The tables show the average change in the
percentage of students scoring at benchmark by grade and subject. The tables also show
the minimum observed difference and the maximum observed difference.
5 BLSF data in reading and math were collected only from schools at the full implementation stage
that serve any of grades K–5. Behavior data were collected only from schools at the full
implementation stage that serve any of grades 6–8.

16
Table 4. Reading: Average Change in Percentage of Students at Benchmark from Fall to Spring,
2013/14
Reading Change in % at Benchmark (Spring minus Fall)
Grade Average
Minimum
Difference
Maximum
Difference N
K 9.4 -37 37 18
1st 8.3 -12 38 18
2nd 4.8 -14 36 19
3rd 1.6 -23 18.8 19
4th 2.4 -7 22.7 19
5th 1.9 -12.8 23 17
Source: Authors’ analyses of primary data collected
Figure 3. Reading: Average Increase in Percentage of Students at Benchmark from Fall to Spring,
2013/14
Source: Authors’ analyses of primary data collected
0
1
2
3
4
5
6
7
8
9
10
K 1st 2nd 3rd 4th 5th

17
Table 5. Math: Average Change in Percentage of Students at Benchmark from Fall to Spring,
2013/14
MATH Change in % at Benchmark (Spring minus Fall)
Grade Average
Minimum
Difference
Maximum
Difference N
K 18.5 5.1 36.1 9
1st 1.9 -37.6 25.8 10
2nd 6.7 -7.2 17 9
3rd -9.2 -35.9 15 11
4th 6 -9.3 24 11
5th 3.3 -33 24.8 10
Source: Authors’ analyses of primary data collected
Figure 4. Math: Average Change in Percentage of Students at Benchmark from Fall to Spring,
2013/14
Source: Authors’ analyses of primary data collected
-15
-10
-5
0
5
10
15
20
K 1st 2nd 3rd 4th 5th

18
Table 6. Behavior: Average Change in Percentage of Students at Benchmark from Fall to Spring,
2013/14
BEHAVIOR Change in % at Benchmark (Spring minus Fall)
Grade Average
Minimum
Difference
Maximum
Difference N
6th -7.6 -16.6 1.5 5
7th -9.8 -18.21 0.6 5
8th -7.92 -16.1 -0.7 5
Source: Authors’ analyses of primary data collected
Figure 5. Behavior: Average Change in Percentage of Students at Benchmark from Fall to Spring,
2013/14
Source: Authors’ analyses of primary data collected
State Assessment Analyses
To examine the achievement of students in schools implementing MTSS, WestEd also
analyzed student performance on the Kansas State Assessment in math and reading.
Evaluators did not have access to individual student data. Further, data were aggregated
to the school level due to low numbers of students in each cell when looking at
achievement by grade.
Table 7 presents the school-wide elementary math data and Table 8 presents the
elementary reading data. The tables show the percentage of tested students school-wide
who scored in the “meets” or “exceeds” standards category in 2011, 2012, and 2013 for
schools according to their 2013 implementation stage, compared to other elementary
schools. The tables also show change over time. Note that Kansas State Assessment results
saw a sharp decline statewide in 2013 compared to previous years, possibly due to a change
in standards that was not reflected on the assessments.
-12
-10
-8
-6
-4
-2
0
6th 7th 8th

19
For math (Table 7), schools statewide saw decreases between 2012 and 2013 in the
percentage of students meeting or exceeding standards, with fully implementing schools
reporting the smallest percentage point decrease.
Table 7. Average Percentage of Elementary Schools Meeting or Exceeding Standards on the
Kansas Mathematics Assessment, by Stage of Implementation, 2011, 2012, and 2013
Stage of
Implementation† N 2011 N 2012 N 2013
Percentage
Point Change
2011 to 2012
Percentage
Point
Change
2012 to 2013
Full Implementers 36 88.80 36 88.30 36 82.00 -0.50 -6.30
Initial Implementers 244 89.05 245 89.41 245 82.05 0.36 -7.36
Installation 6 86.62 6 91.45 6 79.56 4.83 -11.89
Exploration 24 89.36 23 90.49 23 83.15 1.13 -7.34
Some Training* 169 88.42 164 88.25 158 80.60 -0.17 -7.65
No Implementation/
No Training* 386 87.74 380 87.51 376 80.50 -0.23 -7.01
† Note that the stage of implementation is based on each school’s categorization as of the 2013 survey.
*Note: Schools in these categories did not respond to the survey and therefore could not be classified by stage of
implementation.
Source: Authors’ analyses of Kansas State Department of Education data
The average percentage of students meeting or exceeding standards in elementary reading
(Table 8) declined over time among MTSS implementers at all stages, as well as all
elementary schools statewide. The decreases from 2012 to 2013 are larger than the
decreases evidenced from 2011 to 2012.

20
Table 8. Average Percentage of Elementary Schools Meeting or Exceeding Standards on the
Kansas Reading Assessment, by Stage of Implementation, 2011, 2012, and 2013.
Stage of
Implementation† N 2011 N 2012 N 2013
Percentage
Point
Change
2011 to 2012
Percentage
Point
Change
2012 to 2013
Full Implementers 36 87.33 36 87.00 36 83.48 -0.33 -3.52
Initial Implementers 244 89.81 245 89.43 245 86.34 -0.38 -3.09
Installation 6 88.45 6 89.71 6 82.15 1.26 -7.56
Exploration 24 91.06 53 90.26 23 87.44 -0.8 -2.82
Some Training* 169 88.40 164 86.94 158 83.14 -1.46 -3.8
No Implementation/
No Training* 386 89.07 380 87.41 376 84.04 -1.66 -3.37
† Note that the stage of implementation is based on each school’s categorization as of the 2013 survey.
*Note: Schools in these categories did not respond to the survey and therefore could not be classified by stage of
implementation.
Source: Authors’ analyses of Kansas State Department of Education data
School-level analysis of achievement data is not particularly sensitive because it can mask
differences between grade levels. Nonetheless, it is the only student achievement data
available to compare schools fully implementing MTSS to other schools. Due to the fact
that the 2014 assessment was different from prior years and to problems with
implementing the statewide assessment in 2014, no new statewide data on the
achievement of schools implementing MTSS is available. The analyses above relied on
data from 2011 through 2013. Hard data on student achievement is not available statewide.
State assessment data is inconclusive as to any patterns or trends in the achievement
levels of schools implementing MTSS.
Benefits to Teachers
Data from interviews, focus groups, surveys, and case studies also identified benefits for
teachers in schools implementing MTSS. These benefits include increased teacher
collaboration through common planning and data review meetings, greater awareness of
student levels of functioning and how to meet those needs, and increased use of data.
Teachers reported that “MTSS makes them better teachers.”
Teachers and school leaders in the case study schools and at the district level reported
that through MTSS implementation teachers: (1) develop a common language; (2) develop
a culture of collaboration with less isolation, and the breaking down of “silos”; (3) improve
instruction and classroom/behavior management; (4) demonstrate greater ownership of

21
and comfort with looking at and using data; and (5) show wider acceptance of shared
responsibility for all students.
These reported impacts of MTSS enhance teachers’ work and skills and increase
instructional quality and teacher capacity to serve all students, reaffirming what has been
found in the literature on what is needed to support school improvement.
KSDE Support for Kansas MTSS Implementation and Sustainability
KSDE has established an effective statewide infrastructure to support and sustain MTSS
implementation. Components include the MTSS Core Team, the cadre of Recognized
MTSS Facilitators, the annual MTSS Symposium, an extensive and frequently updated
website of materials, research, and resources on MTSS, and an ongoing dissemination plan
implemented in coordination with the Kansas Technical Assistance System Network
(TASN). Professional development materials are well aligned with national professional
learning standards (Learning Forward, 2012).
Respondents to the 2014 school survey reported that, “to some extent” or “to a great
extent,” KSDE has established the necessary infrastructure to sustain and extend MTSS
implementation over time (77.4%), that KSDE effectively disseminates information about
MTSS (75.9%), that there are sufficient resources (76.0%), and that MTSS is clearly aligned
with other state and local improvement initiatives (79.3%). Sixty-one percent of
respondents agreed that there are sufficient Recognized MTSS Facilitators to support
MTSS statewide.
Effective Dissemination
Information gathered from principals of schools around the state indicates a high level of
agreement that the KSDE disseminates information about MTSS effectively. The 2014
school survey results showed that 75.9% of respondents agreed “to some extent” or “to a
great extent” that KSDE/MTSS Core Team effectively disseminates information about
MTSS.
Dissemination about MTSS occurs in several ways, most notably the KSDE’s annual MTSS
Symposium and the KSDE website, the TASN website, and the
http://www.KansasMTSS.org website. Support for MTSS implementation statewide was
also included in Principle 2 of the state’s ESEA Flexibility Waiver
(http://www2.ed.gov/policy/elsec/guid/esea-flexibility/map/ks.html) and MTSS is a
requirement for Focus and Priority Schools identified under the waiver.
The Symposium is a two-day event that includes pre-session MTSS and related practices
training with the MTSS Core Team and national content experts (e.g., Anita Archer in
reading and Randy Sprick in behavior). For each of the past five years, over
1,000 participants have attended the Symposium. The 2014 Symposium included

22
approximately 1,300 participants from Kansas and a number of other states, a pattern of
cross-state participation that is growing year by year. Kansas’ MTSS Symposium is
becoming known as the “go to” conference for in-state and out-of-state implementers of
MTSS.
State Level Resources Available to Schools and Districts
The statewide availability of resources for MTSS implementation includes the cadre of
Recognized MTSS Facilitators, the MTSS materials, and the Core Team and their support
for district-level training. Schools and districts contract with educational service centers
or individual Recognized MTSS Facilitators to provide training and support. Direct Core
Team support is provided to schools identified as “Priority” schools under the state’s ESEA
flexibility waiver. To facilitate coordination and integration, MTSS and the work of the
Core Team have been integrated with the Kansas Technical Assistance System Network
(TASN), which provides technical assistance to support school districts’ systematic
implementation of evidence-based practices designed to improve achievement and
outcomes for students with disabilities (http://ksdetasn.org).
The Kansas MTSS website contains a wealth of resources and information about MTSS
with guidance documents to support the exploration of, planning for, and implementation
of MTSS. The website is frequently updated with new information and resources,
including Structuring and Implementation guides. These are “open source” materials
available to anyone.
Quality of Kansas MTSS Training and Guidance Materials
In 2014, WestEd conducted a second extensive and systematic review of MTSS training
and guidance documents. The documents reviewed include those that were developed to
be used in formal MTSS training and by schools engaged in the Structuring and
Implementation process. The purpose of the document review was to assess the alignment
of the training materials with nationally accepted standards for professional development
and to update findings from the original 2012 review. All documents reviewed are available
on the KSDE MTSS website at http://www.kansasmtss.org. WestEd found that MTSS
training programs and materials are well aligned with evidence-based professional
development principles and practices.6
6 The Learning Forward Standards for Professional Learning (2012) were used as the standard. Learning
Forward identifies seven standards, and several corresponding indicators for professional development
designed to support adult learning, change teacher practice, and result in positive outcomes for all
students.
23
Further Investments KSDE Needs to Make
Evidence collected from a number of sources suggests that KSDE has been very thoughtful
and intentional in its approach to supporting MTSS implementation and sustainability.
Evidence from the 2014 school survey, the Core Team, KSDE leadership, case study
principal and administrator interviews and focus groups, the document review, and the
MTSS website demonstrates that KSDE and the Core Team are effectively supporting
implementation of MTSS with fidelity. Examples include the regular updating of training
materials to incorporate and reflect the changing research base, the development of new
refinement training, and the oversight of Recognized MTSS Facilitators until a high level
of fidelity to the training is achieved. The incorporation of “lessons learned” from the Core
Team’s current approach to working with schools and districts (e.g., the change to a focus
on district level capacity building prior to school building training) provides further
evidence of KSDE’s responsiveness.
When asked what investments or actions KSDE needs to take to further strengthen MTSS,
the Core Team’s responses focused on the following: (1) a statewide data system that
would create the ability to look at data across the state and trends at the state level; (2) the
integration of reporting requirements; (3) staying on message: “MTSS is the work”; (4)
periodic updates to the State Board; and (5) investment in coaching capacity at the district
and school level.
Many of these same issues were identified by KSDE leadership, which also noted the need
to more fully integrate early childhood into the MTSS framework and to provide
additional district-level support, particularly with implementation issues at the middle
and secondary levels. KSDE leaders also emphasized the need for continued investment in
resources to support Core Team capacity, statewide professional development, and
ongoing support to districts and schools.

24
Refinement of Kansas MTSS
Statewide Implementation MTSS implementation is being refined in Kansas to focus at the district, rather than the
individual, school level, and to the use of an “integrated model” where the areas of
reading, math, and behavior are approached simultaneously.
Implementing MTSS on a school-by-school basis has brought the initiative to this point,
but to fully build capacity across the entire system to continuously implement the MTSS
framework with a high level of fidelity, it will take a coherent, systematic, district-focused
approach. This evaluation and experience with school-level implementation also pointed
to the need to integrate the three MTSS areas of reading, math, and behavior. The shift to
investment at the district level in using the comprehensive, integrated three-tier MTSS:
CI3T framework will require increased capacity on the part of the Core Team.
Four 2014 evaluation activities addressed changes in MTSS implementation from the
perspective of those directly involved either at the state, district, or school building level.
As described by Core Team members and KSDE leaders, there are two major changes
occurring in MTSS implementation in Kansas: (1) a shift from a focus of implementation at
the individual school level to an emphasis on district-level or district-wide
implementation and (2) a change from a “one area at a time” approach (i.e., reading, math,
or behavior) to an integrated approach where a district and the schools within it embark
on all three areas at once, integrating academics and behavior into one multi-tiered
system of support. This refined approach is referred to as the Kansas MTSS: CI3T model,
which brings together the Kansas MTSS framework and the comprehensive, integrated,
three-tiered model of prevention (http://ci3t.org/) developed by Dr. Kathleen Lane and
Dr. Wendy Oaks. The integrated model brings together all of the components of Kansas
MTSS and CI3T into a single, integrated whole.
Role of the Core Team
The move to an integrated approach has changed the role of the Core Team. The Core
Team has moved from a model where members specialized in one content area to
integration of and collaboration in how the team members deliver services, provide
training, and work with districts. It has also changed from a focus on the development of
the cadre of Recognized MTSS Facilitators to an emphasis on working directly with
districts to develop their capacity to support schools within the district. As one team
member described it, “The Core Team really is our ‘boots on the ground’ for having a
sense of how MTSS is being implemented through our state training system.” And another
noted, “We are in the beginning stages of recreating ourselves.” “We’ll be state coaches.”
25
Changes at the Local Level
The follow-up visit to Wichita, as the evaluation’s example of district-wide MTSS
implementation, revealed a number of changes over the course of the district’s four years
of work: (1) an increased reliance on data for decision-making; (2) an acceptance of shared
responsibility for the success of all students; and (3) a renewed focus on quality core
instruction.
For the case study school principals, several reported administrative or leadership changes
at the local level. Other changes in MTSS implementation included: (1) scheduling
adjustments; (2) selecting new curriculum or intervention materials; (3) a decision to use
certified teachers rather than para-educators for implementing interventions; (4) an
emphasis on more “standardized” practices in terms of interventions, overall curriculum,
or use of collaborative team time; and (5) adding a new MTSS area (e.g., math or
behavior). The overall impression is that schools are attempting to fine-tune, tighten up,
or improve MTSS implementation but are challenged by administrative and staff turnover
and reorganization.
Shift in Focus for Investment
Since the inception of MTSS in Kansas, a large part of the Core Team’s work was to train
and monitor Recognized MTSS Facilitators who then provided MTSS training to schools
and school-level teams (trainer-of-trainers model). This investment in the cadre of
Recognized MTSS Facilitators was intended to make statewide expert training and
ongoing support available to schools as they moved through the stages of MTSS
implementation. In 2014, KSDE and the Core Team made the decision to shift their focus
from further development of the cadre of Recognized MTSS Facilitators to an investment
in the development of district capacity for the implementation of MTSS. Recognized
MTSS Facilitators are still available to support individual schools or districts through
contracts with one of Kansas’s regional Educational Service Centers; however, the Core
Team will be working with district teams with the intent of developing district-level
capacity for system-wide implementation of MTSS. The 2014 school survey showed that
60.6% of respondents agreed that “to some” or “to a great extent” there are sufficient
Recognized Facilitators to support MTSS statewide. A current list of MTSS Facilitators is
available at http://kansasmtss.org/training.html.
The shift to investment at the district level using the integrated MTSS: CI3T framework
will require increased capacity on the part of the Core Team. According to the 2014 school
survey, a slight majority (56.1%) of respondents described MTSS as a “district-led”
initiative; however, this does not necessarily mean that the district has taken a district-
wide approach (as Wichita has done). While 67.0% of Kansas districts have had schools
who have participated in formal MTSS training, according to the data on annual training
participation, just 18 districts have engaged in district-wide training and are taking a
district-wide approach to MTSS. The MTSS Core Team will need to strengthen its capacity
to meet the anticipated demand for district-level support.

26
Conclusion This is a final, summative report of the four-year MTSS external evaluation conducted by
WestEd for the Kansas State Department of Education. The evaluation was designed to
assess the state’s progress in creating a statewide system of support to local schools and
districts in order to increase school capacity to use resources in ways that enable every
child to be successful.
The Core Team’s shift in MTSS implementation from a focus at the school to the district-
level marks a critical turning point in MTSS implementation in Kansas. In the absence of a
state mandate, the degree of MTSS scale-up or lasting systems change envisioned by the
KSDE and the Core Team cannot be achieved statewide through a one-building-at-a-time
approach, such as that initially used to launch MTSS. Recent research supports the state’s
district-focused strategy for expanding MTSS.7 School districts in the U.S. that have been
able to demonstrate system-wide school improvement indicate that district-level support
is essential if the system’s lowest performing schools are to improve.8 However, in other
respects, Kansas is at a “tipping point” with regard to MTSS implementation.9
Experts on scaling-up of new innovations estimate that the threshold for scaling-up an
evidence-based program is reached when at least 60.0% of the “service units” (in this case
schools implementing MTSS) in a system are using the program (in this case MTSS) with
fidelity and positive outcomes.10 It is at this point of implementation, they hypothesize,
that the system itself would need to have changed to sustain the outcomes of the program.
MTSS has met this “scaling up” or “tipping point” standard for implementation in Kansas,
based on the Kansas MTSS School Survey of Effective Instructional Practices, which
indicates 90.0% of schools that responded to the survey are implementing MTSS to some
degree, i.e., scoring in at least one of the stages of implementation. Further, participation
data for formal MTSS training show that 67.0% of Kansas school districts and 48.0% of all
public schools have participated in some level of formal MTSS training. The move to focus
at the district level at this point makes good “implementation sense.”
Kansas is on the brink of the threshold that will tip the scale of implementation to full
scale-up of MTSS. As Fixsen and colleagues have observed, the capacity for scaling-up
innovations statewide is dependent upon the ability to capitalize on opportunities to
7 Zavadsky, 2012. 8 Zavadsky, 2013. 9 Gladwell (2000) defines “tipping point” as “the moment of critical mass, the threshold, the boiling
point." 10 Fixsen et al., 2013.

27
“develop and institutionalize the infrastructure needed to support the full and effective
use of innovations.”11 As data from this evaluation show, Kansas is doing just that.
Next Steps for Scaling-Up Kansas MTSS
Kansas must keep its focus on MTSS, continuing to integrate the framework into the
state’s other statewide policy initiatives while it also continues to use its statewide
networks, expert Core Team, and training and professional development resources to
continue to build the state’s capacity to sustain and grow MTSS.
Comprehensive data and findings from this evaluation provide clear indicators of what it
takes for a school to reach full implementation of MTSS. Successful implementation
requires:
Leadership—at the building and, increasingly, at the district level
High-quality core curriculum, assessment systems, and instruction—a coherent
system that starts with a strong curricular and instructional foundation, informed by
assessments
Empowering culture—where a majority of staff support MTSS and all staff speak a
common language and share a collective vision of MTSS, with wide-spread acceptance of
the MTSS principles and practices and protected time for collaboration around instruction
and assessment
Professional development—ongoing professional development to support
implementation with fidelity, training for new staff, and ongoing coaching and facilitation
Support for implementation—integration and alignment of MTSS practices with school
needs and other initiatives, documentation of impact on student outcomes, district-wide
support, and opportunity for collaboration within the school day
Kansas is both at a turning point and tipping point with regard to MTSS. Next steps for
MTSS in Kansas may be summed up as, “stay the course.” Investment in district-level
capacity building, the strengthening of the Core Team, and continual adherence to the
MTSS framework as more and more districts and schools join the MTSS ranks will sustain
and expand MTSS over time. Investment in a statewide data system would enable KSDE to
document the impact MTSS is having on student outcomes. An “on- message” approach
from the state level on down appears to be the way to move forward with expansion and
sustainability.
11 Fixsen et al., 2009, p. 1.

28
Next Steps for Sustaining Kansas MTSS
Next steps for MTSS in Kansas may be summed up as “stay the course.” Investment in
district-level capacity building, the strengthening of the Core Team, and continual
adherence to the MTSS framework as more and more districts and schools join the MTSS
ranks will sustain and expand MTSS over time. Investment in a statewide data system
would enable KSDE to document the impact MTSS is having on student outcomes.
There is high confidence in the sustainability of Kansas MTSS across all respondents.
Schools responding to the 2014 Kansas MTSS School Survey of Effective Instructional
Practices reported few major barriers to sustainability. Two main barriers to sustaining
MTSS were noted by survey respondents: (1) the time it takes to implement MTSS with
fidelity within the school day, where 89.0% of respondents indicated that this was a
barrier “to some” or “to a great extent” and (2) lack of fiscal resources, which 88.8%
reported concern “to some” or “to a great extent.”
Similarly, follow-up interviews with the case study schools and the district case study site,
Wichita, also showed high confidence in the sustainability of MTSS. Even in the face of a
number of administrative changes at the local level, the majority of the case study school
principals interviewed in 2014 are optimistic about MTSS sustainability. They have an
established system in place that can be built upon and strengthened. They advocated for
continued administrative and district-level leadership and support, refresher professional
development, and mentoring for new staff. They noted the importance of keeping teachers
motivated by giving teachers clear direction with flexibility and time to work together.
Interviews and focus groups conducted in 2014 with the Core Team, KSDE leadership, and
with case study school principals surfaced similar issues. The factors identified as essential
for sustainability included: (1) building leadership; (2) district commitment/ownership; (3)
“social validity”—staff buy-in; (4) increased capacity to support the integrated model as
more cohorts come onboard (e.g., statewide coaches); (5) capacity to support
schools/districts that were trained in the “old model”; (6) integrate the new model and
keep schools “on track”; (7) a “culture of collaboration” to support MTSS; (8) fidelity to the
process; and (9) a statewide data system to demonstrate impact.
Several other key sustainability issues raised by the Core Team and KSDE leadership
included the integration of MTSS content areas, the need to integrate MTSS with other
state initiatives, and ensuring support to districts and district support to schools. They
also reported a need for the state to maintain the focus on MTSS, including maintaining it
as a State Board priority, so that school/district attention is not diverted by potentially
competing priorities. Related is the idea that the TASN grants can be leveraged to increase
the impact of MTSS. The state has aligned new school accreditation standards with the
MTSS framework, and TASN grants will be awarded contingent on MTSS core features.
State-level leadership also acknowledged that the work of implementation needs the

29
commitment of statewide resources, through TASN’s statewide projects, which provide
direct support to schools and districts. Investment in the Core Team will be necessary to
maintain the expanded role of Core Team members in supporting district-level
implementation. State leaders see MTSS as the vehicle through which districts and schools
will achieve systems change and improvement.
The evaluation activities over the past four years—from the annual online survey to the
school case studies, the in-depth study of Wichita as the evaluation’s district-wide
example, and the interviews with the Core Team—have provided a valuable perspective on
the challenges and capacity required to sustain a statewide initiative such as MTSS. Staff
buy-in and support, the integration and institutionalization of MTSS practices so that it
becomes routine, the “way of doing things,” and the umbrella for all school improvement
efforts appear to be key. Training of staff, flexible scheduling, and the purchase of resource
materials are all necessary but not sufficient. Sustained and continued district and school
leadership support for MTSS through words and action are critical for statewide and local
sustainability.
Recommendations
To support high-quality MTSS implementation with fidelity in schools and districts across
Kansas, KSDE will want to:
Support robust and accurate statewide data collection to establish and monitor the impact of MTSS implementation on students.
Invest in district-level/district-wide training and support and capacity development to assist in further scaling-up of MTSS across Kansas.
Balance the decreased investment in the cadre of Recognized MTSS Facilitators with increased district-level/district wide training and ongoing support to schools within districts.

30
Appendices
Appendix A: Evaluation Methods
In this section we outline the evaluation methods implemented during 2014 and used as
data sources for this report. These methods and data sources build upon the evaluation
efforts in 2012 and 2013.
School Survey
In the spring of 2014, WestEd fielded the third collection of the online survey Kansas
MTSS School Survey of Effective Instructional Practices. This survey was designed to be
completed by the principal of every K-12 public school building in Kansas, even those not
implementing MTSS. Requests for survey completion were sent by email to schools from
the office of the Deputy Commissioner, Division of Learning Services, Brad
Neuenswander, using KSDE email lists. An initial email request and several follow-up
requests were sent.
The survey was designed to gauge the extent to which schools are implementing MTSS.
Responding schools were asked an extensive series of questions about their practices and
perspectives in the following areas:
Leadership and Empowerment
Assessment Practices
Curricular and Instructional Practices
Data-based Decision-making
Tiered Interventions
Student Outcomes
Professional Development
Barriers and Supports to Implementation
Integration and Sustainability
Survey methods and results can be found in the Executive Summary of the Effective
Instructional Practices Survey Findings which is in Appendix B of this report.
The survey was designed to categorize each responding school into one of five stages of
implementation based on their responses (see table A 1 below). The stages are based on
the essential features and required practices of MTSS, as outlined in the KSDE’s MTSS
Innovation Configuration Matrix. Among the respondents in 2014, 46 schools or 8.3%
scored at the full implementation stage and have institutionalized the practices of MTSS
to a high degree of self-reported fidelity. The percentage of schools at full implementation

31
is the same as in 2013. Another 72.4% were at the initial implementation stage, which is an
increase over the previous two years, suggesting that over time, schools are implementing
the MTSS framework to a greater degree. Overall, 94.4% of schools scored in one of the
stages of implementation. Over time, the evaluators will continue to track the stage of
implementation of responding schools through future administrations of the survey.
Table A1. Classification of Responding Schools by Stage of Implementation
Stage of
Implementation
2012 2013 2014
Number Percentage Number Percentage Number Percentage
No stage 77 11.7 55 9.3 31 5.6
Exploration 266 40.5 70 11.8 70 12.6
Installation 58 8.8 16 2.7 6 1.1
Initial Implementation 215 32.8 402 67.9 402 72.4
Full Implementation 40 6.1 49 8.3 46 8.3
Total Implementers 579 88.2 537 90.7 524 94.4
Total 656 100.0% 592 100.0% 555 100.0%
Source: Authors’ analyses of primary data collected
Limitations of the survey include that schools indicating they were implementing MTSS
were over-represented in the respondent pool. This may be an indication that those
schools not implementing MTSS were less inclined to respond to the survey. While the
results provide an accurate impression of the practices being used in schools
implementing MTSS, the survey responses do not provide a precise account of the number
of schools implementing MTSS as a percentage of all schools across the state. Another
limitation of the survey is the fact that the data come from self-reports. Further, the
survey was sent to principals at all schools; however, it is possible that the principal may
not have been the person at the school with the most knowledge of MTSS practices.
Principals were instructed that they could respond to the survey in consultation with
others, and survey data show that most respondents were indeed self-identified principals.
Building-Level Status Form Collection
Building-Level Status Form (BLSF) data represent the grade level universal screening
results gathered in the Fall, Winter, and Spring of each year. The data report the
percentage of students in each grade and time period who are at Benchmark (Tier 1) and
those who score at the Supplemental (Tier 2) and Intensive levels (Tier 3). These data were
32
requested only from schools that were classified as fully implementing MTSS according to
the school responses on the Kansas MTSS School Survey of Effective Instructional
Practices. Data were requested for the 2013/14 school year.
BLSF data were collected from fully implementing schools for specific grade levels and
MTSS focus areas:
Math—grades preK–5
Reading—grades preK–5
Behavior—grades 6–8
BLSF data are used to examine change in the percentage of students scoring at benchmark
from the fall to the spring of each academic year. An analysis of the BLSF data is provided
in the section entitled “Benefits to Students.”
Extant KSDE State Assessment Data
In addition to BLSF data, extant school-level data from the Kansas state assessment were
examined to address student outcomes. This analysis can be found in the section on
student outcomes (see section entitled “Benefits to Students”).
WestEd requested school-level assessment data from the KSDE Research and Evaluation
Team, which provided school-level data (for schools with 10 or more students reporting)
for the 2010/11, 2011/12, and the 2012/13 school years. State assessment data from 2014 were
not produced and would not have been comparable given that the assessment changed
from the previous years.
We examined the percentage of students scoring at meeting and exceeding the standards
for schools grouped by stage of implementation as determined by the Effective
Instructional Practices Survey. We also looked at change in the percentage of students
meeting or exceeding standards from 2011 to 2012 to 2013 for schools classified as fully
implementing compared to schools that had not participated in MTSS. This analysis was
done separately for math and reading.
Building-Level Training Participation
The MTSS Core Team has been tracking school and district participation in formal MTSS
training since 2005/06. These data were provided to the WestEd evaluation team to
determine the scope of MTSS training participation across the state (Evaluation
Question 1). Several analyses of these data are conducted to examine which types of
schools and districts are participating in training.

33
Focus Groups with Recognized MTSS Facilitators
To address Evaluation Questions 4 and 5 regarding the effectiveness of the statewide
MTSS system and infrastructure and questions about the sustainability of MTSS, WestEd
gathered qualitative data in group interviews with Recognized MTSS Facilitators. In
September 2013, at the annual MTSS Symposium in Wichita, Kansas, WestEd evaluators
conducted two focus groups with Recognized MTSS Facilitators.
Interviews with KSDE Leadership and Core Team Members
In the fall of 2014, individual telephone interviews were conducted with five key
individuals in leadership roles at KSDE to obtain an update on MTSS implementation
from their perspective. Interviews addressed status and progress in MTSS implementation,
changes to MTSS and the training model, facilitators and barriers to implementation, and
integration of various policy initiatives.
Case Studies
A key source of data for Evaluation Question 2 on implementation is in-depth case studies
of MTSS implementers. In October 2013, WestEd evaluators conducted site visits to two
“full implementation” schools and one “initial” implementer. Observations and data from
the case studies are found in the section on Evaluation Question 2.
The three case study schools were selected from the pool of schools classified as “fully
implementing” MTSS based on their survey responses; in other words, only schools
categorized as “fully implementing” MTSS according to their survey responses were
considered for case studies. No high schools met the criteria for full-implementation, and
a high school case study site was selected from the pool of initial implementers.
Two-day site visits were conducted with each case study school. The onsite activities
included: (1) direct observation of how MTSS operates in school buildings, including
observation of instruction and intervention at Tier 1 (core), Tier 2 (strategic), and Tier 3
(intensive) instruction and intervention levels; (2) individual and/or group interviews with
teachers, administrators, paraprofessionals, and others who support implementation of
MTSS; and (3) a review of other extant data on student outcomes and related MTSS
documents.

34
Appendix B: Kansas MTSS School Survey of Effective Instructional
Practices Summary, 2014

MTSS 2014 Survey of Effective School Practices: Executive Summary Introduction This Executive Summary presents a summary of responses received for the MTSS School Survey of Effective Instructional Practices. This survey was conducted in March and April 2014 by WestEd as part of the external evaluation of Kansas MTSS. The purpose of the survey was to gather school-‐level data about the implementation of MTSS and the effective instructional practices being used in schools across the state. The 2014 administration of the survey was the third and final administration as part of the evaluation. Principals of 1,472 public schools in Kansas were asked to complete the on-‐line survey, even if they were not currently implementing MTSS. The survey was voluntary and principals could refuse to participate. At the end of the survey, 554 valid responses were received, resulting in a response rate of 38 percent statewide. The survey was organized by the following topic areas: • Introductory Questions • Leadership and Empowerment • Assessment Practices • Curricular and Instructional Practices • Data-‐based Decision-‐making • Tiered Interventions • Student Outcomes • Professional Development • Barriers and Supports to Implementation • Integration and Sustainability The survey was designed to categorize schools by stage of implementation based on their responses. Scoring criteria were developed based largely on the Kansas MTSS Innovation Configuration Matrix. Fixsen et al. (2005) conceptualize the implementation of an innovation along a continuum of six stages: Exploration, Installation, Initial Implementation, Full Implementation, Innovation, and Sustainability. The survey was used to categorize schools into four of the six stages, up to Full Implementation.
Summary of Survey Results The survey provides a snapshot of MTSS implementation across schools in Kansas. The respondents to the survey were currently implementing MTSS (75.5%) with another 10.7 percent of respondents planning to implement. The majority of those implementing are doing so in reading (84.8%). More than half of respondents are
Appendix B: Kansas MTSS School Survey of Effective Instructional Practices Summary, 2014 35

implementing Math (56.9%) and 43.7 percent of respondents are implementing in behavior. Data from the survey indicates that schools are using the MTSS resources provided by or via state. A majority of schools have: participated in an MTSS Introductory Session (86.8%); participated in MTSS Leadership Essentials (57.8%); participated in an MTSS Symposium (66.2%); accessed documents or materials on the MTSS website (79.5%). Additionally, over 60% of schools reported having participated in Structuring and/or Implementation Training with a recognized MTSS facilitator.
Leadership In more than half of the responding schools, MTSS is a district-‐led initiative (56.1%). Districts are providing a range of supports for MTSS implementation, with the two most common being curriculum and intervention materials (70.4%) and PD on MTSS or specific interventions or assessments (74.3%). But few schools report having a building-‐based MTSS facilitator or coach, either full (15.1%) or part-‐time (14.9%).
Implementation The practice of universal screening is more common in the areas of reading and math, than in behavior. Almost three-‐quarters of schools (73.8%) implementing in reading report conducting universal screening at least three times a year, as do 61.5 percent of schools implementing in math. However, only 18.9% of schools implementing in behavior report universal screening in behavior at least 3 times per year. Schools are reporting usually or always engaging in data-‐based decision-‐making practices to support MTSS, such as reviewing school-‐wide academic data or using data to provide interventions. Similarly, a large percentage of schools report usually or always engaging in recommended MTSS tiered-‐intervention practices, such as monitoring student progress on interventions (87.5%) and using decision rules to determine the need, intensity, and duration of interventions (73.2%). Most schools also report providing protected daily core instruction (94.3%) and daily protected intervention time (85.8%).
Student Outcomes Most respondents report to “some” or “to a great extent” that implementing MTSS has had positive impacts on student outcomes: students scoring at benchmark (89.5%); students scoring as proficient on the state assessment (70.3%); decrease in Office Discipline Referrals (77.1%); and decrease in special education referrals (63.4%).
Appendix B: Kansas MTSS School Survey of Effective Instructional Practices Summary, 2014 36

Professional Development Schools appear to be implementing the recommended MTSS practices to some extent. For example, 94 percent of schools report having provided professional development to teachers and other staff on MTSS implementation. However, 40.5 percent of respondents indicate that they received no on-‐going support from a recognized MTSS Facilitator.
Barriers and Supports to Implementation Schools report many factors as supporting implementation and few as major barriers. The three supports that respondents most frequently identify as “major supports” to implementation are: (1) district support (53.3%), (2) building leadership support (58.9%), (3) impact on student outcomes (47.6%). The three barriers that respondents most commonly identify as “major barriers” are: (1) the time it takes to implement (18.3%), (2) the complexity to implement (8.8%), and (3) the quality of their facilitator (6.2%).
Integration and Sustainability Schools appear to be taking steps to integrate MTSS into other initiatives, or to integrate other initiatives with MTSS. Most respondents report they have aligned resources to support MTSS to a great extent (50.4%) and that to a great extent MTSS is integrated with other school improvement initiatives (68%). Additionally, a majority report that MTSS is institutionalized in their school to some or a great extent (94.5%), that staff support MTSS (96.2%) and that they have the leadership to sustain MTSS (95.6%). In terms of long-‐term sustainability of MTSS, the most common areas of concern are the time it takes to implement (42.3%) and fiscal concerns (48.5%).
Stages of Implementation The evaluators categorized each responding school into a stage of implementation based on their survey responses. Among the current respondents, 46 schools or 8.8 percent scored at the “full implementation” stage and have institutionalized the practices of MTSS to a high degree of self-‐reported fidelity. The largest percentage of respondents (76.7%) are at the “initial implementation stage.” The table below shows that over the three years of the evaluation, schools are increasingly moving into the initial implementation stage. The criteria to achieve full implementation are quite rigorous and few schools achieve all of them. Stage 2012* 2013* 2014 Exploration 40.5% 11.8% 13.4% Installation 8.8% 2.7% 1.2% Initial Implementation 32.8% 67.9% 76.7% Full Implementation 6.1% 8.3% 8.8% *Some responding schools were classified as “no stage” and thus the totals may not equal 100%.
Appendix B: Kansas MTSS School Survey of Effective Instructional Practices Summary, 2014 37

Conclusion Data from the 2014 implementation of the MTSS School Survey of Effective Instructional Practices are relatively consistent with the 2013 survey. The data show that for schools implementing MTSS, and that is 75.5 percent of survey respondents, the majority are engaging in the key MTSS practices of training, universal screening, providing protected core and intervention time, using data, and progress monitoring. The survey respondents report that to a great extent, their schools are aligning resources to support MTSS implementation, MTSS is integrated with other school improvement initiatives and is becoming institutionalized in their schools.
Appendix B: Kansas MTSS School Survey of Effective Instructional Practices Summary, 2014 38

39
Appendix C: Analysis of Kansas MTSS School Survey of Effective
Instructional Practices, by Stages of Implementation
Has your school participated (or is currently participating) in MTSS Structuring?
Figure C1. School Participated in Structured Training
Has your school participated (or is currently participating) in MTSS Implementation
training?
Figure C2. School Participated in Implementation Training
Thinking about MTSS in your district, is MTSS more district- or building-led?
Figure C3. MTSS District- or Building-Led?
0% 10% 20% 30% 40% 50% 60% 70% 80% 90% 100%
Full Implementation
Initial Implementation
Exploration/Installation
Yes
No
Don't Know
0% 10% 20% 30% 40% 50% 60% 70% 80% 90% 100%
Full Implementation
Initial Implementation
Exploration/Installation
Yes
No
Don't Know
0% 10% 20% 30% 40% 50% 60% 70% 80% 90% 100%
Full Implementation
Initial Implementation
Exploration/Installation
District Led
Building Led

40
Does your School have a build-based Leadership Team?
Figure C4. Building-Based Leadership Team?
Does your school have collaborative teacher teams or professional learning communities?
Figure C5. Collaborative Teacher Teams or PLCs?
Does your school have a building-based MTSS facilitator or coach that is employed by
your school or district?
Figure C6. Building-based MTSS Facilitator or Coach?
0% 20% 40% 60% 80% 100%
Full Implementation
Initial Implementation
Exploration/Installation
Yes
No
0% 10% 20% 30% 40% 50% 60% 70% 80% 90% 100%
Full Implementation
Initial Implementation
Exploration/Installation
Yes
No
0% 10% 20% 30% 40% 50% 60% 70% 80% 90% 100%
Full Implementation
Initial Implementation
Exploration/Installation
Full-Time
Part-Time
None

41
In which content areas are you implementing or planning to implement? – Reading?
Figure C7. Planning to Implement Reading?
In which content areas are you implementing or planning to implement? – Math?
Figure C8. Planning to Implement Math?
0% 10% 20% 30% 40% 50% 60% 70% 80% 90% 100%
Full Implementation
Initial Implementation
Exploration/Installation
Currently
Planning
0% 10% 20% 30% 40% 50% 60% 70% 80% 90% 100%
Full Implementation
Initial Implementation
Exploration/Installation
Currently
Planning

42
Please indicate the extent to which the following leadership practices occur at my school:
Shared vision for MTSS at my school? Common language about MTSS?
Figure C9. Shared Vision for MTSS at My School
Figure C10. Common Language About MTSS
The Leadership Team analyzes universal screening data after each collection.
Figure C11. Leadership Team Analyzes Universal Screening Data
0% 20% 40% 60% 80% 100%
Full Implementation
Initial Implementation
Exploration/Installation
To a great extent
To some ext
Not at all
Don't Know
0% 20% 40% 60% 80% 100%
Full Implementation
Initial Implementation
Exploration/Installation
To a great extent
To some extent
Not at all
Don't Know
0% 20% 40% 60% 80% 100%
Full Implementation
Initial Implementation
Exploration/Installation
To a great extent
To some extent
Not at all
Don't Know

43
Universal screening data are used to inform decisions at the school and system level.
Figure C12. Screening Data Informs Decision Making
Progress monitoring data are used to inform decisions at the school and system level.
Figure C13. Progress Monitoring Informs Decisions
Overall, we have seen an increase in students scoring at benchmark on the school's
universal screening assessment.
Figure C14. Increase in Students at Benchmark on Screener
0% 10% 20% 30% 40% 50% 60% 70% 80% 90% 100%
Full Implementation
Initial Implementation
Exploration/Installation Always
Usually
Sometimes
Never
Don't Know
0% 10% 20% 30% 40% 50% 60% 70% 80% 90% 100%
Full Implementation
Initial Implementation
Exploration/Installation Always
Usually
Sometimes
Never
Don't Know
0% 20% 40% 60% 80% 100%
Full Implementation
Initial Implementation
Exploration/Installation
A great extent
To some extent
Not at all
Don't Know

44
Overall, we have seen an increase in the percentage of students scoring at proficient or
above on the state assessment.
Figure C15. Increase in “Proficient” or Above on State Assessment
Overall, we have seen a decrease in the number of Office Discipline Referrals.
Figure C16. Decrease in Office Discipline Referrals
Overall, we have seen a decrease in the numbers of new special education referrals.
Figure C17. Decrease in Special Education Referrals
0% 20% 40% 60% 80% 100%
Full Implementation
Initial Implementation
Exploration/Installation
A great extent
To some extent
Not at all
Don't Know
0% 20% 40% 60% 80% 100%
Full Implementation
Initial Implementation
Exploration/Installation
A great extent
To some extent
Not at all
Don't Know
0% 20% 40% 60% 80% 100%
Full Implementation
Initial Implementation
Exploration/Installation
A great extent
To some extent
Not at all
Don't Know

45
Our school has sufficient resources to provide ongoing professional development to
support MTSS implementation.
Figure C18. Professional Development Resources to Support MTSS
Thinking about sustaining MTSS over time, to what extent is each of the following a
barrier to sustaining MTSS in your school? Instructional staff turnover?
Figure C19. Barrier: Staff Turnover
Thinking about sustaining MTSS over time, to what extent is each of the following a
barrier to sustaining MTSS in your school? Changes in leadership at the building level?
Figure C20. Barrier: Change in District Leadership
0% 20% 40% 60% 80% 100%
Full Implementation
Initial Implementation
Exploration/Installation
A great extent
To some extent
Not at all
Don't Know
0% 20% 40% 60% 80% 100%
Full Impl.
Initial Impl.
Exp./Install.
A great extent
To some extent
Not at all
Don't Know
0% 20% 40% 60% 80% 100%
Full Implementation
Initial Implementation
Exploration/Installation
A great extent
To some extent
Not at all
Don't Know

46
Thinking about sustaining MTSS over time, to what extent is each of the following a
barrier to sustaining MTSS in your school? Lack of fiscal resources?
Figure C21. Barrier: Lack of Fiscal Resources
Q53 Thinking about sustaining MTSS over time, to what extent is each of the following a
barrier to sustaining MTSS in your school? Lack of building leadership support?
Figure C22. Barrier: Lack of Building Leadership Support
Thinking about sustaining MTSS over time, to what extent is each of the following a
barrier to sustaining MTSS in your school? Lack of district/central office support?
Figure C23. Barrier: Lack of District Central Office Support
0% 20% 40% 60% 80% 100%
Full Implementation
Initial Implementation
Exploration/Installation
A great extent
To some extent
Not at all
Don't Know
0% 20% 40% 60% 80% 100%
Full Implementation
Initial Implementation
Exploration/Installation
A great extent
To some extent
Not at all
Don't Know
0% 20% 40% 60% 80% 100%
Full Implementation
Initial Implementation
Exploration/Installation
A great extent
To some extent
Not at all
Don't Know

47
Thinking about sustaining MTSS over time, to what extent is each of the following a
barrier to sustaining MTSS in your school? Lack of instructional staff support?
Figure C24. Barrier: Lack of Instructional Staff Support
Thinking about sustaining MTSS over time, to what extent is each of the following a
barrier to sustaining MTSS in your school? Lack of parent support/parent opposition to
MTSS?
Figure C25. Barrier: Lack of Parent Support
Thinking about sustaining MTSS over time, to what extent is each of the following a
barrier to sustaining MTSS in your school? Competing school improvement initiatives?
Figure C26. Barrier: Competing School Improvement Initiatives
0% 20% 40% 60% 80% 100%
Full Implementation
Initial Implementation
Exploration/Installation
A great extent
To some extent
Not at all
Don't Know
0% 20% 40% 60% 80% 100%
Full Implementation
Initial Implementation
Exploration/Installation
A great extent
To some extent
Not at all
Don't Know
0% 20% 40% 60% 80% 100%
Full Implementation
Initial Implementation
Exploration/Installation
A great extent
To some extent
Not at all
Don't Know

48
Thinking about sustaining MTSS over time, to what extent is each of the following a
barrier to sustaining MTSS in your school? Time to implement the model with fidelity
within the school day?
Figure C27. Barrier: Lack of Time to Implement with Fidelity
To what extent do you agree with each of the following statements about the integration
of MTSS in your school? Our school has aligned resources within federal, state, or local
education programs to support the implementation of MTSS.
Figure C28. MTSS Aligned Resources within Federal, State, or Local Education Programs
0% 20% 40% 60% 80% 100%
Full Implementation
Initial Implementation
Exploration/Installation
A great extent
To some extent
Not at all
Don't Know
0% 20% 40% 60% 80% 100%
Full Implementation
Initial Implementation
Exploration/Installation
A great extent
To some extent
Not at all
Don't Know

49
Q52 To what extent do you agree with each of the following statements about the
integration of MTSS in your school? MTSS frameworks, principles, and practices are
widely accepted/institutionalized in our school.
Figure C29. MTSS Institutionalized
To what extent do you agree with each of the following statements about the integration
of MTSS in your school? MTSS is integrated with our school improvement efforts.
Figure C30. MTSS Integrated with School Improvement
To what extent do you agree with each of the following statements about the integration
of MTSS in your school? Our school has the on-going professional development needed to
sustain MTSS implementation over time.
Figure C31. Ongoing Professional Development to Sustain MTSS
0% 20% 40% 60% 80% 100%
Full Implementation
Initial Implementation
Exploration/Installation
A great extent
To some extent
Not at all
Don't Know
0% 20% 40% 60% 80% 100%
Full Implementation
Initial Implementation
Exploration/Installation
A great extent
To some extent
Not at all
Don't Know
0% 20% 40% 60% 80% 100%
Full Implementation
Initial Implementation
Exploration/Installation
A great extent
To some extent
Not at all
Don't Know
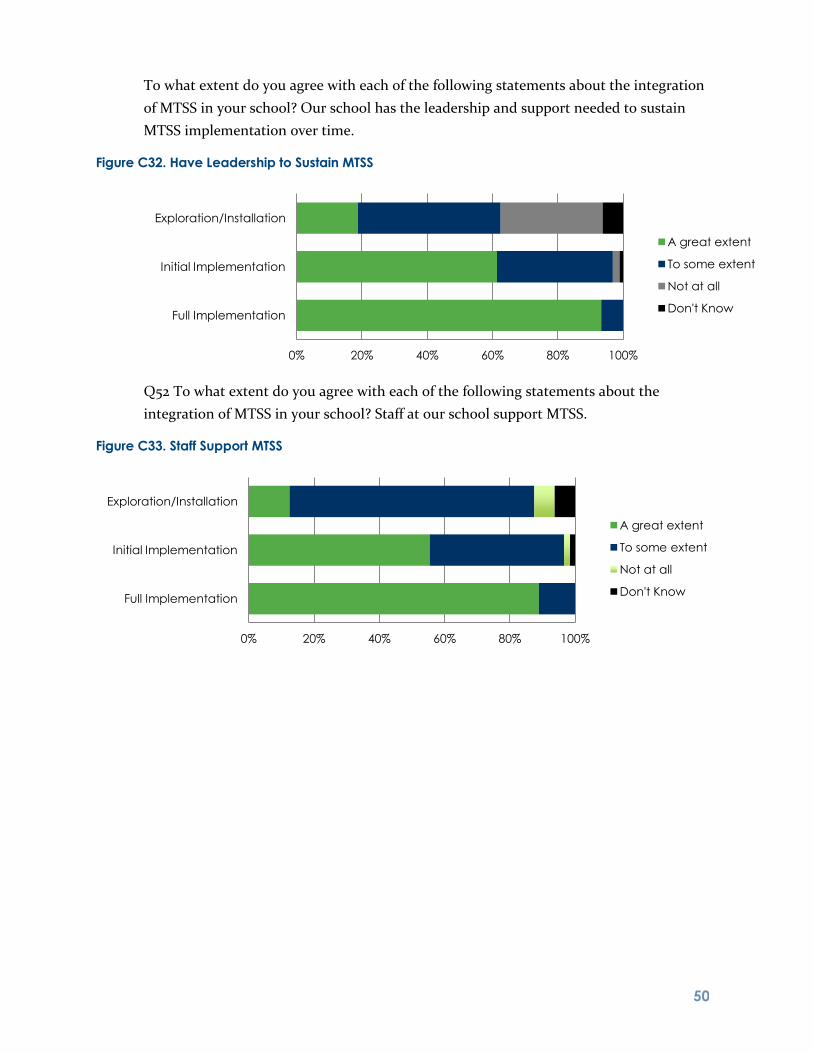
50
To what extent do you agree with each of the following statements about the integration
of MTSS in your school? Our school has the leadership and support needed to sustain
MTSS implementation over time.
Figure C32. Have Leadership to Sustain MTSS
Q52 To what extent do you agree with each of the following statements about the
integration of MTSS in your school? Staff at our school support MTSS.
Figure C33. Staff Support MTSS
0% 20% 40% 60% 80% 100%
Full Implementation
Initial Implementation
Exploration/Installation
A great extent
To some extent
Not at all
Don't Know
0% 20% 40% 60% 80% 100%
Full Implementation
Initial Implementation
Exploration/Installation
A great extent
To some extent
Not at all
Don't Know

51
Appendix D: Infographic: MTSS Implementation: What does
it take?

High Quality Core Curriculum, Assessment, and Instruction
Leadership teams moni-tor for fidelity, Tiers 1-3
Teams use data frequently & comprehen-sively to monitor progress & make deci-
sions at the school & individual student level.
Provide protected daily intervention time
Leadership team reviews universal screening data after every administration
Curriculum based universal screen-ing assessments are used to determine the need for interventions.
93 %
Strong Leadership
Observation of impact on student outcomes*
Regular collabora-tive plan-ning time
during school day
District- level support
Alignment with school
needs, status,
interest
76 %
87 %
78 %
MTSS IMPLEMENTATION What does it take?
Leadership
97%
98%
67%
Building leadership team that includes the principal in
97% of responding schools.
Leadership for sustainability reported in 98% of schools
at Full Implementation.
District- led initiative in 67% of schools at
Full Implementation Stage.
49% 96%
Common Language about MTSS
Professional Development
Shared Vision for MTSS
89% 47%
Majority of Staff Support MTSS
89% 55%
MTSS Principles/Practices widely accepted
91% 48%
Empowering Culture
36% 71%
vs
Ongoing professional development to support sustainability:
MTSS facilitation and ongoing coaching help support implementation.
Initial Full
Initial Full Implementation
89 %
Support for Implementation
Integration of MTSS**
*Increase in universal screening benchmarks & state assess-ment scores; decrease in office discipline & special ed. refer-rals
**89% of schools at Full Implementation report integra-tion of MTSS with other school improvements vs 62% Initial Implementation Schools
59%
91%
80%-84%
86%
86%
100 %
October 2014
Appendix D: Infographic: MTSS Implementation. What does it take? 52

53
References
Beaver, J. K., & Weinbaum, E. H. (2012). Measuring school capacity, maximizing school
improvement. Policy Brief RB-53, July 2012. Philadelphia, PA: Consortium for Policy Research in
Education.
Fixsen, D., Blase, K., Horner, R., & Sugai, G. (2009). Scaling-up evidence-based practices in
education. FPG Child Development Institute: University of North Carolina at Chapel Hill.
Fixsen, D., Blase, K., Metz, A., & VanDyke, M. (2013). Statewide implementation of evidence-based
programs. Exceptional Children, 79(2), 213–230.
Fixsen, D. L., Naoom, S. F., Blase, K. A., Friedman, R. M., & Wallace, F. (2005). Implementation
research: A synthesis of the literature. Tampa, FL: University of South Florida.
Gladwell, M. (2000). The tipping point: How little things can make a big difference. Boston, MA:
Back Bay Books.
Hall, G., & Hord, S. (2006). Implementing change: Patterns, principles, and potholes (2nd ed.).
Boston, MA: Allyn and Bacon.
Kansas State Department of Education (2012). Kansas ESEA flexibility request, revised July 11, 2012.
Topeka, Kansas: Author.
Kincaid, D., Childs, K., Blase, K. A., & Wallace, F. (2007). Identifying barriers and facilitators in
implementing schoolwide positive behavior support. Journal of Positive Behavior Interventions, 9(3),
Summer 2007, 174–184.
Learning Forward (2012). Standards for professional learning. Retrieved from
http://www.learningforward.org/standards/leadership#.UNyq06wZ8TC
Mendenhall, A. N., Iachini, A., & Anderson-Butcher, D. (2013). Exploring stakeholder perceptions of
facilitators and barriers to implementation of an expanded school improvement model. Children &
Schools, 35(4), 225–234.
Newmann, F. M., Smith, B. A., Allensworth, E., & Bryk, A. S. (2001). School instructional program
coherence benefits and challenges. Chicago, IL: Consortium on Chicago School Research.
Zavadsky, H. (2012). School turnarounds: The essential role of districts. Cambridge, MA: Harvard
Education Press.
Zavadsky, H. (2013). Scaling turnaround: A district-improvement approach. Education Outlook,
No. 3, April 2013. American Enterprise Institute for Public Policy Research.
Top Related