


Languages
Pages
Legal

Master’s Thesis MEE10:85
Implementation and Evaluation of NIST Biometric
Image Software for Fingerprint Recognition
Sainath Maddala
Sreekanth Rao Tangellapally
Examination
Master of Science in Electrical Engineering Technology
Blekinge Institute of Technology
September 2010
School of Engineering
Department of Electrical Engineering
Blekinge Institute of Technology, Sweden
Supervisor : Josef Ström Bartunek
Examiner : Mikael Nilsson

Implementation and Evaluation of NIST Biometric Image Software for
Fingerprint Recognition
This thesis is presented as part of Double Degree Master of Technology and Master of
Science in Electrical Engineering with emphasis on Signal Processing.

Contact Information:
Authors:
Sainath Maddala
email: [email protected]
Sreekanth Rao Tangellapally
email: [email protected]
Supervisor:
Josef Ström Bartunek
School of Engineering (ING)
Dept of Electrical Engineering,
Blekinge Institute of Technology, Sweden
email: [email protected]
Examiner:
Mikael Nilsson
School of Engineering (ING)
Dept of Electrical Engineering,
Blekinge Institute of Technology, Sweden
email: [email protected]

Abstract
Fingerprints are rich in details which are in the form of discontinuities in ridges
known as minutiae and are unique for each person. The main desire of this
thesis is to implement and evaluate National Institute of Science and
Technology (NIST) Biometric Image Software (NBIS) for fingerprint
recognition using C language MEX-files. NBSI source code is written in ANSI
C programming language. A system developed in Matlab environment using C
language MEX-files is used for implemented and evaluated the NIST source
code. Minutiae extraction and minutiae matching are performed by using a
function developed with NBIS. The extracted minutiae are passed through the
function with NBIS that match two minutiae patterns and produce a match
score. Finally the performance of the system is evaluated on various fingerprint
databases and results are presented in Receiver Operating characteristics (ROC)
graphs.


ACKNOWLEDGMENT
First of all we would like to thank our supervisor JOSEF STRÖM BARTUNEK for
giving the opportunity to work on this topic and guiding us until the final stage of
the thesis work. The meetings with him during the most difficult times have been
fruitful in finding solutions to our queries and problems we encountered time to
time.
We are thankful to MIKAEL NILSSON for allotting time in busy schedule and
giving lectures on ROC graphs. These lectures helped us in the practical
part of our work.
Last but not least, we are thankful to our beloved parents and friends in
India for inspiring us all through our stay in Sweden and supporting us.
Without them nothing would not have been possible. Thank you very
much!
Sainath Maddala, Sreekanth Tangellapally, 2010, Sweden.

Contents
1 INTRODUCTION .......................................................................... 1
1.1 Biometrics ................................................................................................ 1
1.2 Fingerprints History ................................................................................ 1
1.3 Fingerprint Classification ....................................................................... 2
1.3.1 Fingerprint Analysis ...................................................................... 4
1.3.2 Fingerprint Recognition ................................................................. 5
1.4 Fingerprint Database ............................................................................... 6
1.5 Outline .................................................................................................... 6
2 Minutiae Extraction ..................................................................... 7
2.1 Introduction ............................................................................................ 7
2.2 Operations Performed on Fingerprint ...................................................... 7
2.3 Pre-Processing ...................................................................................... 8
2.3.1 Fingerprint Enhancement using Fourier Transform ...................... 8
2.3.2 Fingerprint Enhancement using Histogram Equalization .............. 9
2.4 Minutiae Extraction .............................................................................. 10
2.4.1 Definition of Minutiae ................................................................ 10
2.4.2 Detecting Minutiae Position and Orientation ............................ 10
2.5 Post-Processing ..................................................................................... 12
3 Fingerprint Matching ................................................................. 15
3.1 Introduction .......................................................................................... 15
3.2 Factors Responsible for Intra Class Verification ................................. 15
3.3 Types of Fingerprint Matching ............................................................. 16
3.3.1 Correlation based Matching ....................................................... 16

3.3.2 Minutiae based Matching ........................................................... 16
3.3.3 Ridge Feature based Matching ................................................... 16
3.4 Bozorth3 ................................................................................................ 17
3.5 Results obtained for Genuine and Imposter Match ............................ 19
4 MEX-Files .................................................................................... 21
4.1 Introduction .......................................................................................... 21
4.2 Components of C MEX-File ................................................................ 21
4.3 Working Procedure with Example ....................................................... 23
4.3.1 Create Mex Source File .............................................................. 23
4.3.2 Create Gateway Routine ............................................................. 23
4.3.3 Build the MEX-file ..................................................................... 25
5 Receiver Oriented Characteristics (ROC) Graphs .................. 26
5.1 Introduction .......................................................................................... 26
5.2 Classification ........................................................................................ 26
5.3 Area under ROC Curve (AUC) ............................................................ 29
5.4 Evaluating Accuracy of Biometric System using ROC Graphs ......... 29
5.5 Experimental Results ........................................................................... 33
6 Conclusion .................................................................................... 35
Bibliography .................................................................................... 36

List Of Figures
1.1 (a) Inked impression Fingerprint, (b) Live-scanned Fingerprint ............... 2
1.2 (a)Tented Arch, (b) Arch, (c) Right Loop, (d) Left Loop, ……. … .
…... (e)Whorl ..................................................................................................... 3
1.3 Fingerprint image with bifurcations and terminations ............................... 4
1.4 Main modules of Fingerprint verification system ..................................... 5
2.1 Flowchart representing for Minutiae Detection Process .......................... 7
2.2 Flowchart representing operations performed before and after .
,,,,,, extracting minutiae .................................................................................... 8
2.3 Fingerprint enhancement using Fourier transformation method ............... 9
2.4 Fingerprint orientation after processing (a) Original image,
. (b)Enhanced image .................................................................................... 9
2.5 (a)Basic fingerprint image, (b) Fingerprint image with bifurcations and .
…. terminations ............................................................................................ 10
2.6 Pixel patterns used to detect minutiae ...................................................... 11
2.7 Minutiae orientation ................................................................................. 11
2.8 Spurious minutiae obtained for the fingerprint without keeping any .,,,,,
, . threshold (quality) .................................................................................... 12
2.9 (a)Broken ridges, (b) Bridge, (c)Short ridge, (d)Short ridge, ………... ………..
… (e)Short Ridge, (f)Hole ............................................................................. 12
2.10 (a) Fingerprint image containing both false and real minutiae,
(b)Fingerprint image containing only real minutiae ..................................... 14
3.1 Fingerprint image in a and b looks different but the impressions .,,,,,,,,,,
. are of same finger and c, d looks similar but they are from different .
. figure ......................................................................................................... 15

3.2 Intra-Fingerprint minutiae comparison ................................................... 18
3.3 Flowchart illustrating minutiae matching process .................................... 20
4.1 C MEX Internal Operation ...................................................................... 22
4.2 Flow of data between MATLAB and Visual Studio 2008 using
.,,,,,, MEX-Files ............................................................................................... 25
5.1 Confusion matrix .................................................................................... 27
5.2 ROC curve with 4 predicted values from the classifier ........................... 28
5.3 Area under the curve of the classifier A and B ...................................... 29
5.4 FNR and FNMR for a given threshold t .................................................. 30
5.5 Typical operating of different applications displayed on a ROC curve .......... 31
5.6 ROC curve between FMR and FNMR where EER, ZeroFMR and .,,,,, .
. ZeroFNMR are highlighted ................................................................... 32
5.7 Plotting FRR(t) and FNR(t) obtained from Genuine and ………...
…......imposter distributions (3500 genuine pairs and 67319
……..imposter pairs)........................................................................................... 33
5.8 Plotting FMR(t) and 1-FNMR(t) obtained from Genuine and imposter
…… distributions (3500 genuine pairs and 67319 imposter pairs)………..…34
Chapter 1
Introduction
1.1 Biometrics
“Biometrics” (bios metron = “life measurement”) is defined as the automated methods
of identifying or authenticating the identity of a living person based upon one or more
intrinsic physical or behavioral traits. A number of biometric technologies have been
developed and are being used in numerous applications such as secure identification
and personal verification solutions etc. Some examples of different biometrics are
fingerprints, face recognition, iris, retina scan, signature etc. “Although biometrics
emerged from its extensive use in law enforcement to identify criminals (e.g., illegal
aliens, security clearance for employees for sensitive jobs, fatherhood determination,
forensics, and positive identification of convicts and prisoners), it is being
increasingly used today to establish person recognition in a large number of civilian
applications” [19].
1.2 Fingerprints History
Human fingertips are fully formed at about seven months of fetus development and
ridge configurations which form distinctive patterns. Patterns on fully developed
fingerprints do not change throughout the life of an individual except due to accidents
such as bruises and cuts on the fingertips. Print of these patterns is known as
fingerprints [1]. Fingerprinting first created by a British surgeon called Dr. Henry
Fault. In late nineteenth century Sir Francis Galton discovered some of the points or
characteristics from which fingerprints can be identified. Hence the term “Fingerprint
identification” is founded by the Galton points for the science technology. Fingerprint
identification began its transition to automation in the late 1960. In 1969, the Federal
Bureau of Investigation (FBI) developed a system to automate fingerprint
identification. This is first used for manual process and then it is connected to
National Bureau of Standards (NBS) known as National Institute of Standards and
Technology (NIST). NIST is an organization to study the process of automating
fingerprint classification, feature extraction and matching. It identifies two key
challenges:
1. Scanning fingerprint cards and extracting minutiae from each fingerprint.
2. Feature extraction, comparing and matching list of minutiae against list of large
….repositories of fingerprints [2].
1

2 CHAPTER 1. INTRODUCTION
In the early 1990's, NIST began developing a system to enable the electronic
exchange of fingerprint records and images by law enforcement agencies. Also to
handle electronic transactions with these agencies which is called the Integrated
Automated Fingerprint Identification System (IAFIS) [3]. In 1994 three major
challenges are identified and investigated:
1. Digital fingerprint acquisition.
2. Local ridge characteristic extraction.
3. Ridge characteristic pattern matching.
At present fingerprint verification systems began to appear of various access control
and verification functions.
One of the most important tasks considering an automatic fingerprint recognition
system is the minutiae biometric pattern extraction from the captured image of the
fingerprint [4]. The capture device returns an image, usually with 256 grey-levels,
which consists of dark (ridges) and bright (valleys) lines. The most widespread
fingerprint matching approach relies on the uniqueness of a fingerprint’s prominent
singular points known as minutiae. These minutiae are represented either by
bifurcation or termination of ridges. A fingerprint image is captured in one of two
ways shown in Fig. 1.1.
1. Scanning an inked impression of a person’s finger
2. Using a live-scan fingerprint scanner.
(a) (b)
Figure 1.1: (a) Inked impression fingerprint (b) Live-scanned fingerprint.
1.3 Fingerprint Classification
Over the past few decades, a large scale of fingerprint recognition techniques has been
proposed by researches for distinguishing fingerprint classes. Classifying a fingerprint

CHAPTER 1. INTRODUCTION 3
images is a very difficult pattern recognition problem, due to the small interclass
variability, the large intraclass variability, the presence of noise and the ambiguous
properties of fingerprints. Adopting a classification approach can greatly reduce the
number of comparisons during fingerprint retrieval and consequently reduce the
response time of the identification process. As an increasing database of fingerprint
images, it became important to have an efficient method of classifying the
fingerprints. The most widely used classification method is based on Henry’s
classification which consists of eight classed: Plain Arch, Tented Arch, Left Loop,
Right Loop, Plain Whorl, Central-Pocket Whorl, Double Loop Whorl and Accidental
Whorl. Fig. 1.2 shows basic categories of fingerprint classes [5].
(a)
(b)
(c)
(d) (e)
Figure 1.2: Tented Arch (b) Arch (c) Right Loop (d) Left Loop (e) Whorl.

4 CHAPTER 1. INTRODUCTION
Another major challenge is related to the presence of noise in fingerprint images.
Noise fingerprint will make the classification task more difficult even for a human
expert. Random noise and other effects caused by the skin conditions such as dry,
sweaty, dirty, and diseased will degrade quality of fingerprint images. Recovering
original ridge patterns from the fingerprint is important. This can be done by
performing pre-processing operation on fingerprint. Hence proposed fingerprint
classification algorithm rejects such images because this would be less damaging than
a wrong decision. For this reason, several classification approaches include a rejection
mechanism, which improves the accuracy at the cost of discarding some fingerprints.
1.3.1 Fingerprint Analysis
The fingerprints, when analyzed at different scales, produce different types of
features. At global level, patterns known as ridges and valleys exhibits a number of
particular shapes called singularities, which are classified as: loop, delta and whorl. At
the local level, ridge characteristics, called minutia. There are several types of
minutiae, but the two most prominent ridge characteristics are: ridge ending (point
where ridge ends abruptly) and ridge bifurcation (points where ridge forks or diverges
into branch ridges) as shown in Fig. 1.3. The rest of the minutiae are combination of
each or those two types. A good quality of image may have between 40 to 100 of
minutia, each described by its location (𝑥,𝑦 coordinates) and its orientation (𝜃).
.
Figure 1.3: Fingerprint image with bifurcations and terminations marked out.
CHAPTER 1. INTRODUCTION 5
1.3.2 Fingerprint Recognition
Fingerprint classification and matching are key parts in an automated fingerprint
recognition system. The fingerprint matcher compares features from the input search
point against all appropriate records in the database to determine if a probable match
exists. There are various approaches of automatic fingerprint matching that have been
proposed which include minutiae based approaches, and image based approaches.
Minutia based approaches are the most popular ones being included in almost all
contemporary fingerprint identification and verification system.
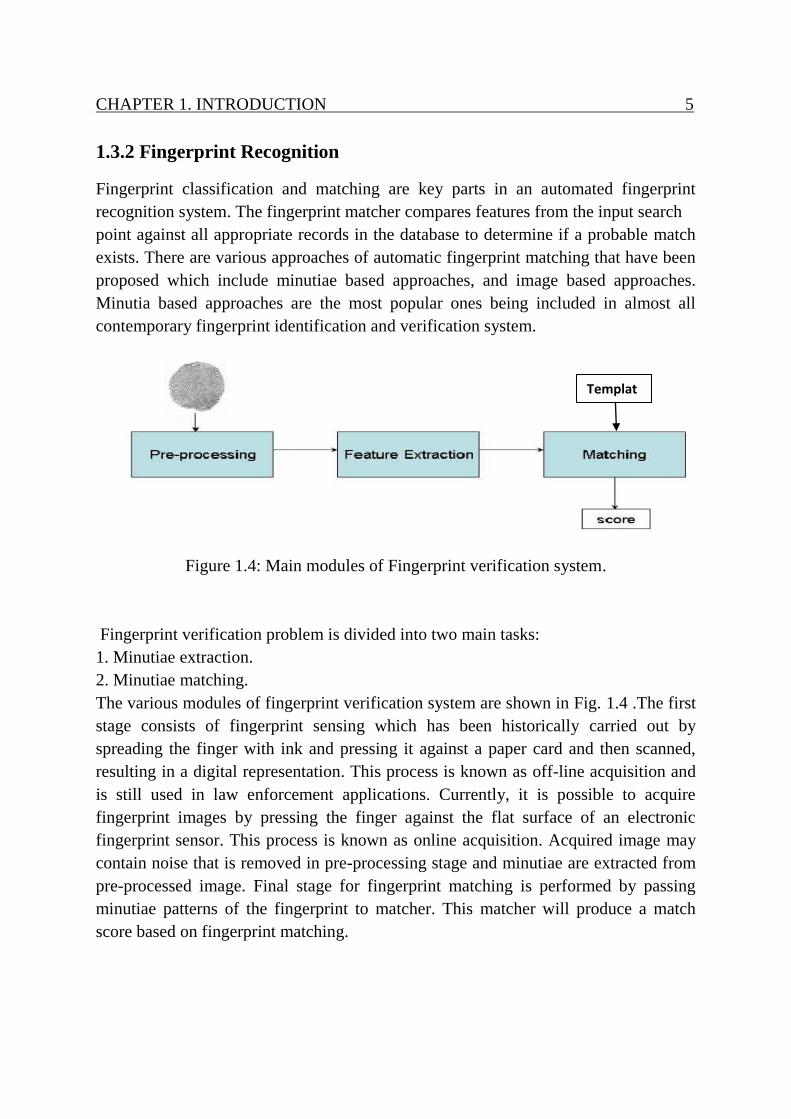
Figure 1.4: Main modules of Fingerprint verification system.
Fingerprint verification problem is divided into two main tasks:
1. Minutiae extraction.
2. Minutiae matching.
The various modules of fingerprint verification system are shown in Fig. 1.4 .The first
stage consists of fingerprint sensing which has been historically carried out by
spreading the finger with ink and pressing it against a paper card and then scanned,
resulting in a digital representation. This process is known as off-line acquisition and
is still used in law enforcement applications. Currently, it is possible to acquire
fingerprint images by pressing the finger against the flat surface of an electronic
fingerprint sensor. This process is known as online acquisition. Acquired image may
contain noise that is removed in pre-processing stage and minutiae are extracted from
pre-processed image. Final stage for fingerprint matching is performed by passing
minutiae patterns of the fingerprint to matcher. This matcher will produce a match
score based on fingerprint matching.
Templat
e

6 CHAPTER 1. INTRODUCTION
1.4 Fingerprint Database
Research in biometrics profoundly depends on the availability of sensed data. The
growth that the field has experienced over the past two decades has led to the
appearance of increasing numbers of biometric databases. Previous to the
International Fingerprint Verification Competitions (FVC) [20], the only large,
publicly available datasets were the NIST databases [6]. However, these databases
were not well suited for the evaluation of algorithms operating with live scan images
[1]. The evaluation of the implemented NBIS system is performed on available
biometric databases that include the fingerprint trait acquired with live-scan sensors.
1.5 Outline
The main aim of this thesis is to implement and evaluate of NIST Biometric Image
Software for fingerprint recognition in MATLAB environment. The NBIS source
code is entirely written in ANSI 𝐶 programming language. NBIS is implemented in 𝐶
language MEX-files to run in MATLAB. First fingerprint image is enhanced and
minutiae are extracted. The extracted minutiae are passed through the function that
match two minutiae patterns and produce a match score. Performance of the system is
evaluated on various fingerprint databases and the results obtained are presented in
Receiver Operating Characteristics (ROC) graphs.
Chapter 2
Minutiae Extraction
2.1 Introduction
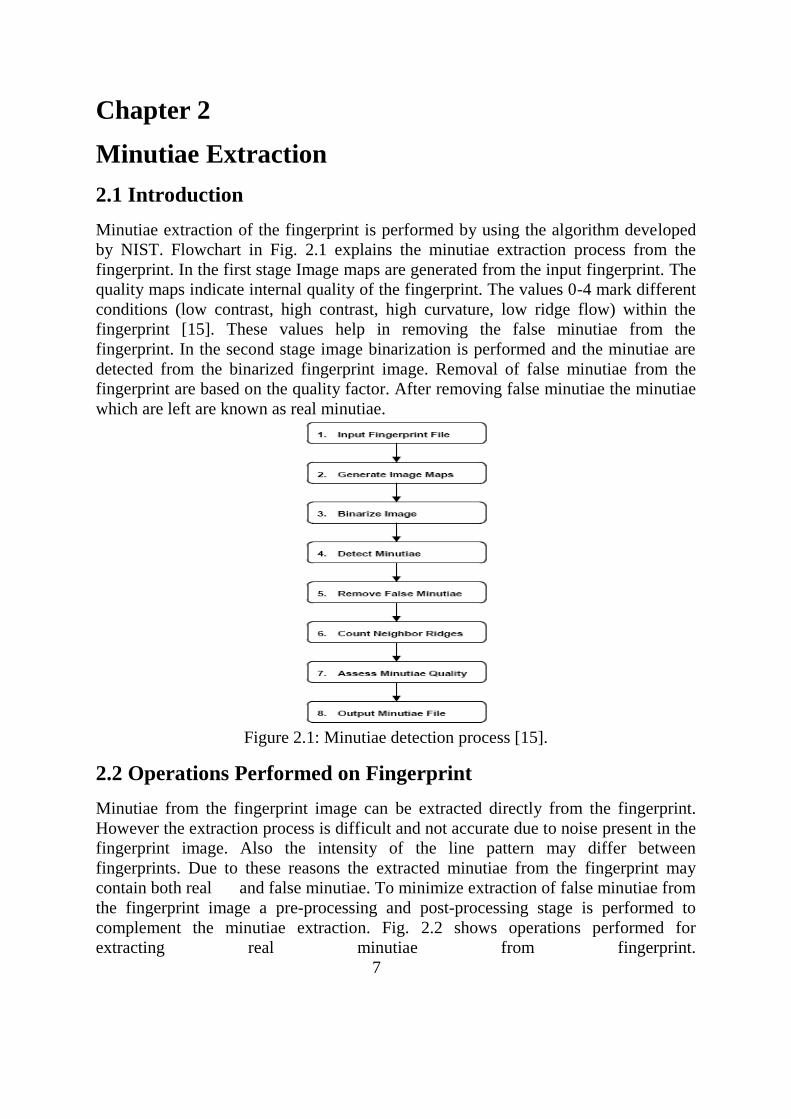
Minutiae extraction of the fingerprint is performed by using the algorithm developed
by NIST. Flowchart in Fig. 2.1 explains the minutiae extraction process from the
fingerprint. In the first stage Image maps are generated from the input fingerprint. The
quality maps indicate internal quality of the fingerprint. The values 0-4 mark different
conditions (low contrast, high contrast, high curvature, low ridge flow) within the
fingerprint [15]. These values help in removing the false minutiae from the
fingerprint. In the second stage image binarization is performed and the minutiae are
detected from the binarized fingerprint image. Removal of false minutiae from the
fingerprint are based on the quality factor. After removing false minutiae the minutiae
which are left are known as real minutiae.
Figure 2.1: Minutiae detection process [15].
2.2 Operations Performed on Fingerprint
Minutiae from the fingerprint image can be extracted directly from the fingerprint.
However the extraction process is difficult and not accurate due to noise present in the
fingerprint image. Also the intensity of the line pattern may differ between
fingerprints. Due to these reasons the extracted minutiae from the fingerprint may
contain both real and false minutiae. To minimize extraction of false minutiae from
the fingerprint image a pre-processing and post-processing stage is performed to
complement the minutiae extraction. Fig. 2.2 shows operations performed for
extracting real minutiae from fingerprint.
. 7

8 CHAPTER 2. MINUTIAE EXTRACTION
Figure 2.2: Flowchart representing operations performed before and after extracting
minutiae.
2.3 Pre-Processing
Pre-processing operation is used for enhancing the contrast of the fingerprint image.
Quality of the acquired fingerprint depends on the condition of the finger and sensor
used. Both factors may lead to poor quality between ridges, crossovers and bifurcation
in the fingerprint image. So pre-processing operation should be performed before
extracting the minutiae from the fingerprint. Pre-processing operation can be
performed with various methods. For example histogram equalization will increase
the contest of the image. The function trim_histtails_contrast_boost() developed by
NIST use histogram modulation for increasing the contrast of the fingerprint image.
Quality of the image can also be increased by using the filters. Low pass filter
decrease the noise from the image, band pass filter decrease undesired noise from
orientations which helps in preserving true ridges [14]. Image enhancement can also
be performed using Fourier transform based method [15].
2.3.1 Fingerprint Enhancement using Fourier Transform
Divide the fingerprint image into sequence of squares each of size 32X32 pixels and
perform a 2 dimensional fast Fourier transform (2𝐷 𝐹𝐹𝑇) to the fingerprint image.
Next the nonlinear function is applied to increase the power of useful information
(orientation of ridges and valleys, to decrease noise etc). Where the nonlinear function
is performed by multiplying the FFT of the block by its magnitude a set of times to
increase the strength of the frequencies. Then inverse 2𝐷 FFT is applied to transform
the enhanced data to spatial representation. Fig. 2.3 shows the enhanced image using
Fourier transform method [15].
Minutiae Extraction
Preprocessing
Post processing
Preprocessing
Pre-processing
Preprocessing

CHAPTER 2. MINUTIAE EXTRACTION 9
(a) (b)
Figure 2.3: (a) Fingerprint after segmentation, (b) Fingerprint enhanced using Fourier
transform method.
2.3.2 Fingerprint Enhancement using Histogram Equalization
In this work trim_histtails_contrast_boost() function developed by NIST is used for
fingerprint enhancement. This function computes and analizes the pixel intensity
histogram and expands pixel intensities across computed intensity range. First lower
pixel limit and upper pixel limit values are computed then each pixel intensity in the
fingerprint is observed. If the pixel intensity is lower than lower pixel limit then reset
pixel intensity to lower limit and in the same way if the pixel intensity is grater than
upper pixel limit then reset pixel intensity to upper limit. Fig. 2.4 shows original
image and enhanced image using _histtails_contrast_boost() function.
(a) (b)
Figure 2.4: Fingerprint obtained after preprocessing (a) Original image (b) Enhanced
image.
10 CHAPTER 2. MINUTIAE EXTRACTION
2.4 Minutiae Extraction
2.4.1 Definition of Minutiae
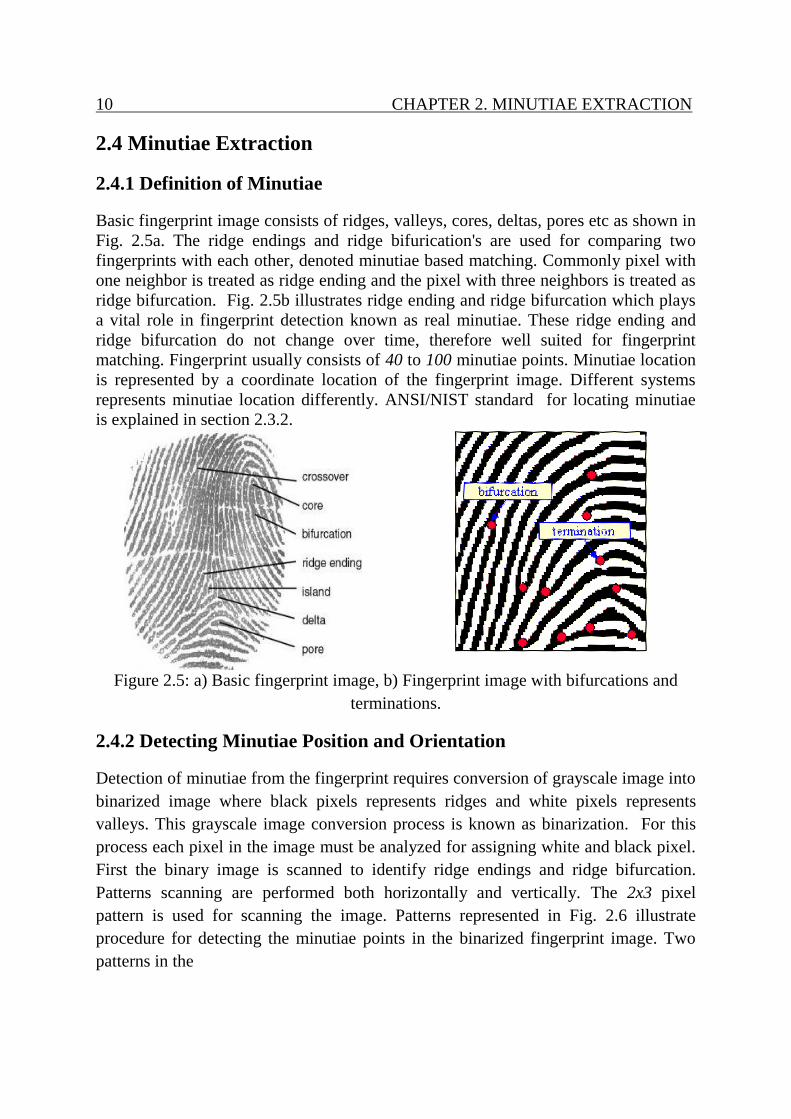
Basic fingerprint image consists of ridges, valleys, cores, deltas, pores etc as shown in
Fig. 2.5a. The ridge endings and ridge bifurication's are used for comparing two
fingerprints with each other, denoted minutiae based matching. Commonly pixel with
one neighbor is treated as ridge ending and the pixel with three neighbors is treated as
ridge bifurcation. Fig. 2.5b illustrates ridge ending and ridge bifurcation which plays
a vital role in fingerprint detection known as real minutiae. These ridge ending and
ridge bifurcation do not change over time, therefore well suited for fingerprint
matching. Fingerprint usually consists of 40 to 100 minutiae points. Minutiae location
is represented by a coordinate location of the fingerprint image. Different systems
represents minutiae location differently. ANSI/NIST standard for locating minutiae
is explained in section 2.3.2.
Figure 2.5: a) Basic fingerprint image, b) Fingerprint image with bifurcations and
terminations.
2.4.2 Detecting Minutiae Position and Orientation
Detection of minutiae from the fingerprint requires conversion of grayscale image into
binarized image where black pixels represents ridges and white pixels represents
valleys. This grayscale image conversion process is known as binarization. For this
process each pixel in the image must be analyzed for assigning white and black pixel.
First the binary image is scanned to identify ridge endings and ridge bifurcation.
Patterns scanning are performed both horizontally and vertically. The 2x3 pixel
pattern is used for scanning the image. Patterns represented in Fig. 2.6 illustrate
procedure for detecting the minutiae points in the binarized fingerprint image. Two
patterns in the

CHAPTER 2. MINUTIAE EXTRACTION 11
Fig.2.6 represents ridge endings and rest represents bifurcations.
Figure 2.6: Pixel patterns used to detect minutiae.
The coordinates and orientation of each ridge endings and bifurcations are essential
for fingerprint matching. ANSI/NIST specifies units in degrees of 0.01𝑚𝑚 from
origin in the bottom left corner of the image. For example, if an image of size
500X600 is scanned at 19.69 pixels per millimeter (ppmm) with units 0.01𝑚𝑚 is
2539,3047 = 500
19.69∗0.01 𝑋
600
19.69∗0.01 . (2.1)
Pixel coordinates (100,150) represented in standard units as
507, 2284 = 100
19.69∗0.01, 3047 − 1 −
150
19.69∗0.01 . (2.2)
Minutiae orientation is represented in degrees. Horizontal axis from ridge ending and
ridge bifurcation represents zero degrees and increasing angle in counter-clockwise.
Orientation of ridge ending is the angle between line projected at the ridge ending and
horizontal axis [15]. Orientation of bifurcation is the angle between line projected at
the middle of ridge bifurcation and horizontal axis is as shown in Fig. 2.7.
Figure 2.7: Minutiae Orientation.
12 CHAPTER 2. MINUTIAE EXTRACTION
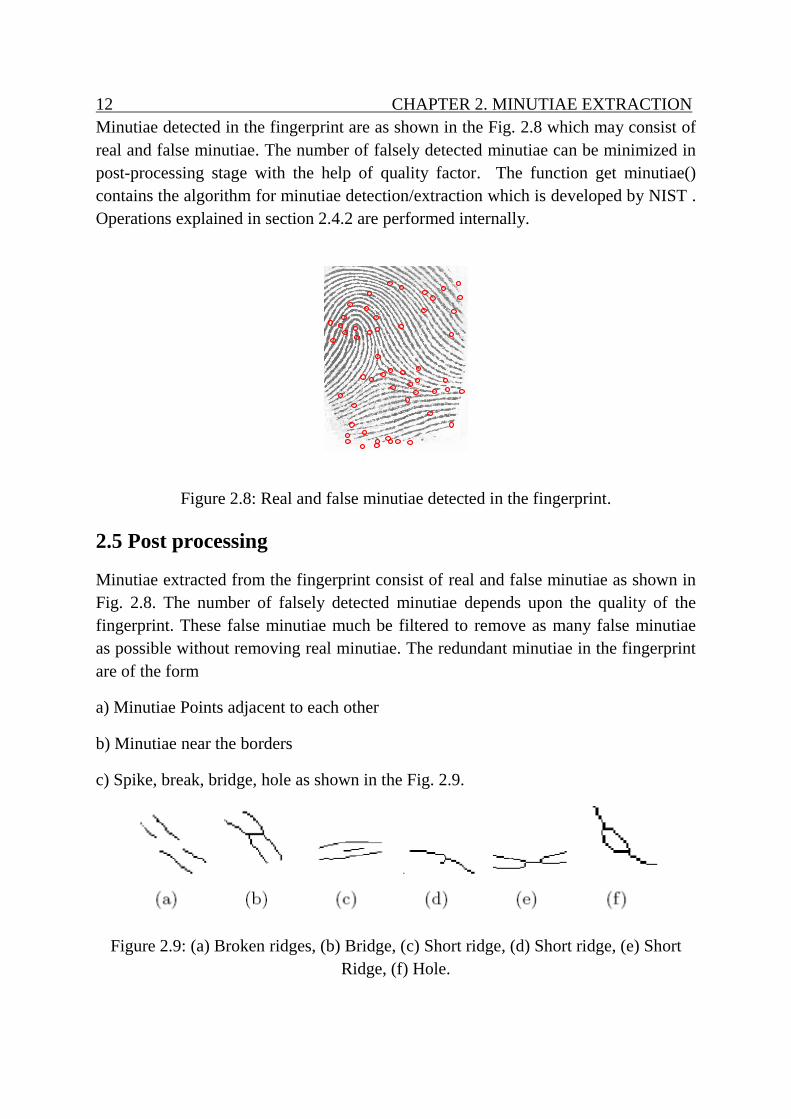
Minutiae detected in the fingerprint are as shown in the Fig. 2.8 which may consist of
real and false minutiae. The number of falsely detected minutiae can be minimized in
post-processing stage with the help of quality factor. The function get minutiae()
contains the algorithm for minutiae detection/extraction which is developed by NIST .
Operations explained in section 2.4.2 are performed internally.
Figure 2.8: Real and false minutiae detected in the fingerprint.
2.5 Post processing
Minutiae extracted from the fingerprint consist of real and false minutiae as shown in
Fig. 2.8. The number of falsely detected minutiae depends upon the quality of the
fingerprint. These false minutiae much be filtered to remove as many false minutiae
as possible without removing real minutiae. The redundant minutiae in the fingerprint
are of the form
a) Minutiae Points adjacent to each other
b) Minutiae near the borders
c) Spike, break, bridge, hole as shown in the Fig. 2.9.
Figure 2.9: (a) Broken ridges, (b) Bridge, (c) Short ridge, (d) Short ridge, (e) Short
Ridge, (f) Hole.
CHAPTER 2. MINUTIAE EXTRACTION 13
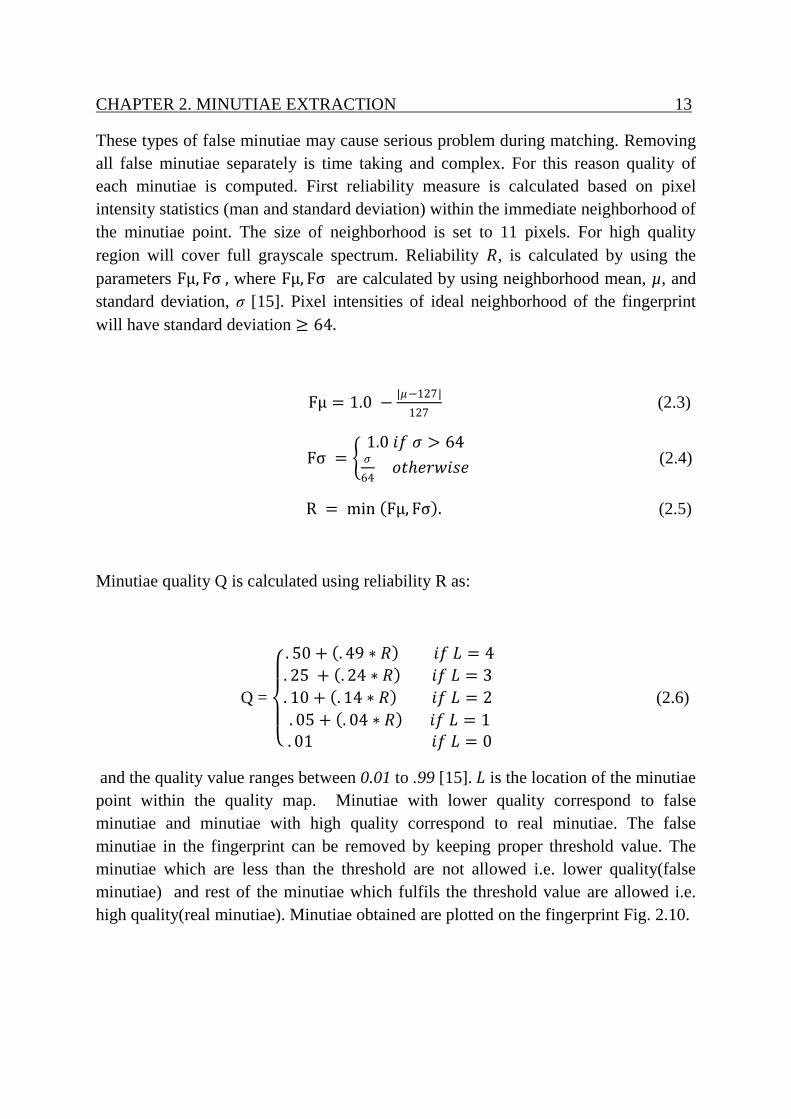
These types of false minutiae may cause serious problem during matching. Removing
all false minutiae separately is time taking and complex. For this reason quality of
each minutiae is computed. First reliability measure is calculated based on pixel
intensity statistics (man and standard deviation) within the immediate neighborhood of
the minutiae point. The size of neighborhood is set to 11 pixels. For high quality
region will cover full grayscale spectrum. Reliability 𝑅, is calculated by using the
parameters Fµ, Fσ , where Fµ, Fσ are calculated by using neighborhood mean, µ, and
standard deviation, σ [15]. Pixel intensities of ideal neighborhood of the fingerprint
will have standard deviation ≥ 64.
Fµ = 1.0 −|𝜇−127|
127 (2.3)
Fσ = 1.0 𝑖𝑓 𝜎 > 64𝜎
64𝑜𝑡𝑒𝑟𝑤𝑖𝑠𝑒
(2.4)
R = min Fµ, Fσ . (2.5)
Minutiae quality Q is calculated using reliability R as:
Q =
. 50 + . 49 ∗ 𝑅 𝑖𝑓 𝐿 = 4
. 25 + . 24 ∗ 𝑅 𝑖𝑓 𝐿 = 3
. 10 + . 14 ∗ 𝑅 𝑖𝑓 𝐿 = 2
. 05 + . 04 ∗ 𝑅 𝑖𝑓 𝐿 = 1. 01 𝑖𝑓 𝐿 = 0
(2.6)
and the quality value ranges between 0.01 to .99 [15]. 𝐿 is the location of the minutiae
point within the quality map. Minutiae with lower quality correspond to false
minutiae and minutiae with high quality correspond to real minutiae. The false
minutiae in the fingerprint can be removed by keeping proper threshold value. The
minutiae which are less than the threshold are not allowed i.e. lower quality(false
minutiae) and rest of the minutiae which fulfils the threshold value are allowed i.e.
high quality(real minutiae). Minutiae obtained are plotted on the fingerprint Fig. 2.10.

14 CHAPTER 2. MINUTIAE EXTRACTION
(a)
(b)
Figure 2.10: a) Fingerprint image containing both false and real minutiae, b) Fingerprint
image containing real minutiae with “𝑜” in green and false minutiae with “ + ”in red.

Chapter 3
Fingerprint Matching
3.1 Introduction
Fingerprint matching is the process of matching two fingerprint images. Matching
may be from same person or from different person. If the matching is from same
person it is known as genuine match and if the matching is from different persons it is
known as imposter matching.
3.2 Factors responsible for intra-class variations
Reliably matching fingerprint images is an extremely difficult problem, mainly due to
large variability in different impressions of the same finger. Displacement, rotation,
non-linear distortion, noise and feature extraction errors are the main factors
responsible for intra-class variations. Due to this reasons fingerprints from the same
finger may sometimes appear quite different whereas fingerprints from different
fingers may appear quite similar (see Figure3.1)
(a)
(b)
(c)
(d)
Figure 3.1: Fingerprint images in a) and b) appear different, however, the impressions
are of same finger c) & d) appear similar; however, they are from different fingers.
15
16 CHAPTERS 3. FINGERPRINT MATCHING
3.3 Fingerprint matching
Fingerprint matching is a difficult approach due to quality variations of the fingerprint
from the same user in time. These variations are due to changing skin conditions,
noise, errors caused during extraction. Some of the fingerprint matching techniques
are
Correlation-based matching,
Minutiae-based matching,
Ridge feature-based matching.
3.3.1 Correlation-based matching
Two fingerprint images are superimposed and the correlation (at the intensity level)
between corresponding pixels is computed for different alignments. This method is
gaining good results in matching fingerprint patterns in authentication process. High
matching accuracy can be obtained with this method. In correlation method gray-level
information is taken and the matching of the fingerprint’s are performed [13].
Correlation based approach is the alternative approach when the fingerprint image is
not good, in this situation’s extracting minutiae may cause problem. However,
correlation based approach cannot be used in various applications due to its large
computational effort.
3.3.2 Minutiae-based matching
In minutiae based matching depends on position and orientation of minutiae points
obtained from fingerprint. How to find the minutiae coordinates and orientation has
been explained in chapter 2. In this work, minutiae based fingerprint detection is
performed by using the BOZORTH3 algorithm developed by NIST. This algorithm
generates a score based on pairing minutiae of the fingerprints. Total operation of
BOZORTH3 is explained in section 3.4.
3.3.3 Ridge feature-based matching
Ridge feature maps could also be used for fingerprint matching [18]. Utilizes both
orientation and frequency information, eliminates the need of minutiae detection in
fingerprint.
CHAPTERS 3. FINGERPRINT MATCHING 17
Minutiae extraction is difficult in low-quality fingerprint images, whereas other
features of the fingerprint ridges pattern (local orientation and frequency, ridge shape)
may be extracted more reliably than minutiae. The approaches belonging to this
category compare fingerprints in terms of feature extraction from the ridge pattern.
3.4 BOZORTH3
BOZORTH3 is an algorithm and utility that matches two minutiae patterns with each
other and produces a match score. Matching between the fingerprint can be one-to-
one verification or one-to-many identification. Bozorth algorithm includes three steps
for fingerprint matching:
Step 1: Construction of Intra-Fingerprint Minutiae Comparison Tables
Step 2: Construction of Inter-Fingerprint Compatibility Table
Step 3: Traverse Inter-Fingerprint Compatibility Table constructed in second step
In step 1 probe fingerprint comparison table and gallery fingerprint comparison table
are constructed. Table construction for both galley and probe fingerprint mainly
depends on position and orientation of minutiae. Relative measurements from each
minutiae to all other minutiae are computed in a fingerprint and tabulated in the table
known as minutiae comparison table. Relative measurements of minutiae in a
fingerprint to find the distance between the minutiae and orientation of the fingerprint.
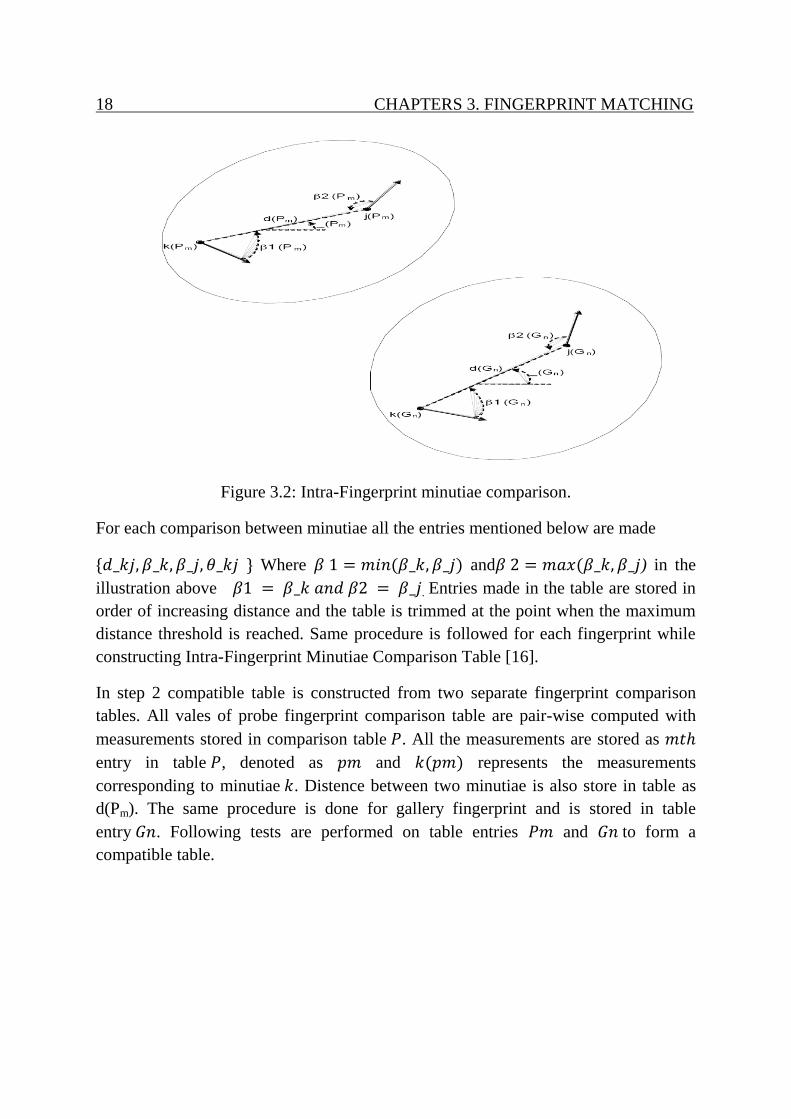
Consider Fig.3.2 in which 𝑘 and 𝑗 represents minutiae points on fingerprint. Consider
point 𝑘 where 𝑘 (𝑥_𝑘, 𝑦_𝑘) represents location of minutiae 𝑘 on the fingerprint and 𝛽1
represents the orientation 𝜃_𝑘 of minutiae. All the minutiae of the fingerprint are
represented in this style. In Fig. 3.2 𝑑(𝑝𝑚) represents the distance between two
minutiae’s 𝑘, 𝑗 as distance between two minutiae’s will remain constant regardless of
how much shifting and rotation may exist between two points. 𝛽_𝑘,𝛽_𝑗 are computed
relative to the intervening line as shown by incorporating 𝜃_𝑘𝑗 and each minutiae’s
orientation 𝑡[16].
18 CHAPTERS 3. FINGERPRINT MATCHING
Figure 3.2: Intra-Fingerprint minutiae comparison.
For each comparison between minutiae all the entries mentioned below are made
{𝑑_𝑘𝑗,𝛽_𝑘,𝛽_𝑗, 𝜃_𝑘𝑗 } Where 𝛽 1 = 𝑚𝑖𝑛(𝛽_𝑘,𝛽_𝑗) and𝛽 2 = 𝑚𝑎𝑥(𝛽_𝑘,𝛽_𝑗) in the
illustration above 𝛽1 = 𝛽_𝑘 𝑎𝑛𝑑 𝛽2 = 𝛽_𝑗. Entries made in the table are stored in
order of increasing distance and the table is trimmed at the point when the maximum
distance threshold is reached. Same procedure is followed for each fingerprint while
constructing Intra-Fingerprint Minutiae Comparison Table [16].
In step 2 compatible table is constructed from two separate fingerprint comparison
tables. All vales of probe fingerprint comparison table are pair-wise computed with
measurements stored in comparison table 𝑃. All the measurements are stored as 𝑚𝑡
entry in table 𝑃, denoted as 𝑝𝑚 and 𝑘(𝑝𝑚) represents the measurements
corresponding to minutiae 𝑘. Distence between two minutiae is also store in table as
d(Pm). The same procedure is done for gallery fingerprint and is stored in table
entry 𝐺𝑛. Following tests are performed on table entries 𝑃𝑚 and 𝐺𝑛 to form a
compatible table.

CHAPTERS 3. FINGERPRINT MATCHING 19
∆d d pm , d Gn < 𝑇d (3.1)
∆β β1 pm ,β1 Gn < 𝑇β (3.2)
∆β(β2(pm),β2(Gn)) < 𝑇β. (3.3)
These tests checks if the corresponding distances and angles are in specified tolerance.
Where ∆𝛽() and ∆𝑑() represents the difference function.
Step 3 determines how well two fingerprints match each other based on the
compatibility table designed in step 2.
3.5 Results obtained for Genuine and Imposter matching
First minutiae tables are constructed for both probe and gallery fingerprint as shown in
Fig.3.3. In the table 𝑋,𝑌 represents the coordinates of each minutiae, 𝑇 represents
orientation 𝜃 and 𝐷 represents the minutiae quality. These tables containing all
minutiae parameters are then passed to the minutiae matcher for generating the
scores. S(P1,P2) represents scores obtained from genuine matach where 𝑃1 and
𝑃2 are the fingerprints from same person. 𝑆(𝐺1,𝐺2) represents scores obtained from
imposter matach where 𝐺1 and 𝐺2 are the fingerprints from different persons. As
larger the matching score, the fingerprints are more likely from the same person.

20 CHAPTERS 3. FINGERPRINT MATCHING
X Y T D
14 39 8 7
23 17 3 20
30 42 4 9
X Y T D
21 32 4 32
14 44 9 49
35 22 8 15
Figure 3.3: Flowchart illustrating minutiae matching process.
A new compatibility table is constructed by
comparing the probe fingerprint table and
gallery fingerprint table.
Matched score is
obtained from the
compatibility table
one table for probe
fingerprint and one table
for gallery fingerprint.
Minutiae based matching
using Bozorth algoririthm

Chapter 4
MEX-Files
4.1 Introduction
Algorithms written in c programming language are possible to reuse in MATLAB
through MEX-Files. Algorithms developed by NIST for minutiae extraction and
fingerprint matching are written in 𝐶 programming language, however, converting the
source files written in 𝐶 language into Matlab script is very complex and waste of
time. To overcome this problem MEX-Files are used.
4.2 Components of a C MEX-file
The source code for a MEX-file consists of two distinct parts.
Computational routine.
Gateway routine.
Computational routine helps in performing the computations that are implemented in
the MEX-file and it may be numerical computations, inputting and outputting data.
Gateway routine helps in interfacing the computational routine with Matlab using
mexFunction and its parameters prhs, nrhs, plhs, nlhs where
Prhs is an array of right-hand input arguments,
Nrhs is number of right-hand input arguments,
Plhs is an array of left-hand output arguments and
Nlhs is number of left-hand output arguments.
In gateway routine, data can be access by using mxArray structure and data
manipulation is in 𝐶 computational subroutine. Flowchart shown in Fig. 4.1 shows the
working procedure of MEX-Files in Matlab.
21

22 CHAPTER 3. MEX-FILES
Figure 4.1: C MEX Internal Operation [12].
OUTPUT
func.c
void mexFunction(
int nlhs, mxArray *plhs[],
int nrhs, const mxArray
*prhs[])
In the gateway routine:
Use the mxcreate function to
create the MATLAB array for
your output arguments.set
plhs[0],[1].. to the points to
the newly created MATLAb
arrays.
Use the mexGet functions to
extract your data from
prhs[0],[1].....
Call your C subroutine
passing the input and output
data points as function
parameters.
Const mxArray *A
A =prhs[0]
Const mxArray *B
B = prhs [1]
MATLAB
A call to MEX_file
func :
[C,D]=func(A,B)
tells MATLAB to
pass variables A
and B to your
MEX-file. C and D
unassigned
INPUT
MATLAB
On return from
MEX-file func :
[c,d]=func(A,B)
plhs[0] is assigned
to c and plhs[1] is
assigned to D.
mxArray *D
D = plhs[1]
mxArray *c
C = plhs [0]

CHAPTER 3. MEX-FILES 23
4.3 Working Procedure with Example
Create Mex Source File,
Create Gateway Routine,
Verify Input and Output Parameters,
Read Input Data,
Prepare Output Data,
Build the MEX-File.
These are the steps to be followed for creating and calling the MEX-File from Matlab
[11].
4.3.1 Create Mex Source File
For example open Visual Studio 2008, create new Project and choose one . 𝑐 templet
name the templet as imageBoost used for enhancing the contrast of the image by using
the functionality “trim_histtails_contrast_boost” the total functionality of the function
“trim_histtails_contrast_boost” had been written in separate 𝑐 file. This file is the
computational routine and the name of the mex file is imageBoost.
4.3.2 Create Gateway Routine
At the beginning of the C file use the header
#include "mex.h"
Add the Gateway routime mexfunction and is of the form
void mexFunction(int nlhs, mxArray *plhs[], int nrhs,
const mxArray *prhs[])
{
idata = (unsigned char*)mxGetData(prhs[0]);//mxGetPr(prhs[0]);
ippmm = DEFAULT_PPI / (double)MM_PER_INCH;
id=8;
memcpy(y1,idata,mrows*ncols*sizeof(unsigned char));
/* ENHANCE IMAGE CONTRAST IF REQUIRED*/ argument

24 CHAPTER 3. MEX-FILES
trim_histtails_contrast_boost(idata,mrows,ncols);
}
Parameters nlhs and nlhs contains number of left-hand side arguments and right-hand
side arguments which invokes the MEX-File .
General form of Matlab functions can represented using the sintax
𝑎, 𝑏, 𝑐 = 𝑓𝑢𝑛 𝑑, 𝑒, 𝑓,
Where 𝑎, 𝑏, 𝑐 are left-hand arguments and 𝑑, 𝑒, 𝑓 are right-hand arguments.
Paramentes plhs and prhs are vectors that contain pointes to both lext and righ-hand
side arguments. Thses are declared as type mxArray * .
For example consider a function
𝑥 = 𝑓𝑢𝑛(𝑦, 𝑧); Which invoves MEX-Files from Matlab using the arguments
nlhs = 1
nrhs = 2
prhs is a 2-element 𝐶 array where first element is a pointer to mcArray named y and
second element named as 𝑧. plhs is 1-elemenr 𝐶 array where the single element is null
pointer and it is points to nouthing because the output 𝑥 is not created untill subroutine
executes.

CHAPTER 3. MEX-FILES 25
4.3.3 Build the MEX-File
Build the MEX-File and change the path of the current directery of Matlab for
accessing the executable file. Input parameters are passed from Matlab to executable
file to perform total functionality. In this example a fingerprint image is passed from
Matlab to executable file which performs image boosting operation and the output is
given back to Matlab as shown in Fig. 4.2.
From MATLAB
Figure 4.2: Flow of data between MATLAB and Visual Studio 2008 using MEX-
Files.
x=imread(’11_1.tif’);
y=test(x);
Executable file which performs
imageBoost functionality and the
output is given back to Matlab

Chapter 5
Receiver Operating Characteristics (ROC) Graphs
5.1 Introduction
Receiver operating characteristics (ROC) is a technique used for organizing classifiers
and visualizing the performance. ROC graphs are frequently used in the areas of
medical decision making, machine learning and data mining. In the machine learning
community the usage of ROC graphs are increased. By considering the performance
of the set of classifier a graph can be drawn which remains stable at derived
conditions. The shape of the graph will also be change based on conditions of the
classifier. So the annalist of that particular application will obtain an idea at which
conditions which classifier is suitable. ROC graphs for example are applied in
speech/music discriminations; it may be detection of speech and detection of music
[8].
“In addition to begin a generally useful performance graphing method, they have
properties that make them especially useful for domains with skewed class
distribution and unequal classification error cost. These characteristics have become
increasingly important as research continues into the areas of cost-sensitive learning
and learning in the presence of unbalanced classes”[9].
5.2 Classification
Given a classifier and instance, there are four possible outcomes. If the instance is
positive and the instant is classified as positive, it is considered as true positive; if the
instance is classified as negative it is treated as false negative. If the instance is
negative and the instance is classified as positive, it is considered as false positive; if
the instance is classified as negative it is treated as true negative as shown in the
Fig. 5.1 [9].
26

27 CHAPTER 5. ROC GRAPHS
True Class
Y
Hypothesized Class
N
P N
Figure 5.1: Confusion matrix.
The true positive rate is the ratio of number of positives correctly classified (i.e. True
Positive) by total number of positives in the classifier, also called as hit rate of the
classifier is estimated as
tp rate ≈𝑃𝑜𝑠𝑖𝑡𝑖𝑣𝑒𝑠 𝑐𝑜𝑟𝑟𝑒𝑐𝑡𝑙𝑦 𝑐𝑙𝑎𝑠𝑠𝑖𝑓𝑖𝑒𝑑
𝑇𝑜𝑡𝑎𝑙 𝑝𝑜𝑠𝑖𝑡𝑖𝑣𝑒𝑠. (5.1)
The false positive rate of ratio of number of negative incorrectly classified (i.e. False
Negative positive) by total number of negatives in the classifier, also called as false
alarm rate of the classifier is estimated as
fp rate ≈ 𝑁𝑒𝑔𝑎𝑡𝑖𝑣𝑒 𝑖𝑛𝑐𝑜𝑟𝑟𝑒𝑐𝑡𝑙𝑦 𝑐𝑙𝑎𝑠𝑠𝑖𝑓𝑖𝑒𝑑
𝑇𝑜𝑡𝑎𝑙 𝑁𝑒𝑔𝑎𝑡𝑖𝑣𝑒𝑠. (5.2)
True
Positive
False
Positive
False
Negative
True
Negative

CHAPTER 5. ROC GRAPHS 28
Figure 5.2: ROC curve with 4 predicted values from the classifier.
From the Fig. 5.2 the 𝑥 −axes represents false positive rate and the 𝑦 −axes represents
true positive rate. The ROC graph shows four predicted values from 𝐴 to 𝐷 in the
classifier, the point (0,0) doesn’t represent a positive classifier ,point (0,1) represents
perfect classification, the straight line represents random guessing, the area above the
straight line is good for strong predication with strong evidence and the area below the
line is totally in inverse (worse predication).In the figure from the predicted vales
𝐴,𝐵,𝐶,𝐷. Here 𝐴 and 𝐵 clearly represents the good performance where 𝐴 is far better
than 𝐵 and 𝐶 lies on the diagonal line (random Guessing) and finally performance of
𝐷 is too bad when compared to all the three (𝐴,𝐵,𝐶).
Area of positive
predication with strong
evidence Area of positive
predication with
weak evidence
Randomly
Guessing
Area is very bad
compared to predicted
values A, B, C
29 CHAPTER 5. ROC GRAPHS
5.3 Area under ROC Curve (AUC)
Performance of the classifier can be depicted using ROC curve. For comparing
classifiers performance, a common method is to calculate the area under the ROC
curve (AUC). AUC is the position of unit squire, its value varies between 0 and 1.
Random guessing creates a value between (0,0) and (1,1), which has a area of 0.5.
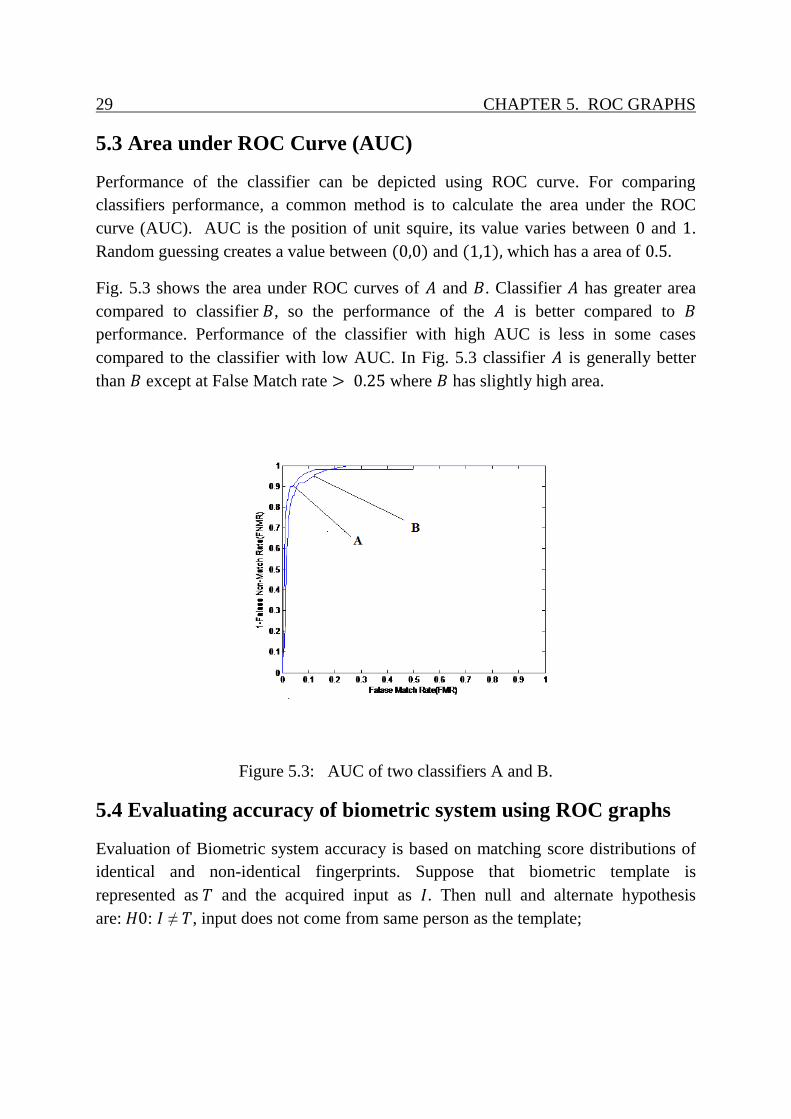
Fig. 5.3 shows the area under ROC curves of 𝐴 and 𝐵. Classifier 𝐴 has greater area
compared to classifier 𝐵, so the performance of the 𝐴 is better compared to 𝐵
performance. Performance of the classifier with high AUC is less in some cases
compared to the classifier with low AUC. In Fig. 5.3 classifier 𝐴 is generally better
than 𝐵 except at False Match rate > 0.25 where 𝐵 has slightly high area.
Figure 5.3: AUC of two classifiers A and B.
5.4 Evaluating accuracy of biometric system using ROC graphs
Evaluation of Biometric system accuracy is based on matching score distributions of
identical and non-identical fingerprints. Suppose that biometric template is
represented as 𝑇 and the acquired input as 𝐼. Then null and alternate hypothesis
are: 𝐻0: 𝐼 ≠ 𝑇, input does not come from same person as the template;
CHAPTER 5. ROC GRAPHS 30
𝐻1: 𝐼 = 𝑇, input comes from same person as the template.
𝐷0: person who is not claims to be;
𝐷1: person who claims to be.
If the matching score 𝑠(𝑇, 𝐼) is greater than the threshold 𝑡 then the score is
categorized into 𝐷1, else it is categorized into 𝐷1. According to the communication
theory main goal is to detect the message from noise. 𝐻0 is the hypothesis where the
received signal is noise and 𝐻1 is the hypothesis where the received signal is message
and noise. Such hypothesis testing contains two types of errors:
Type1: false match (𝐷1 is decided when 𝐻0 is true);
Type2: false non-match (𝐷0 is decided when 𝐻1 is true).
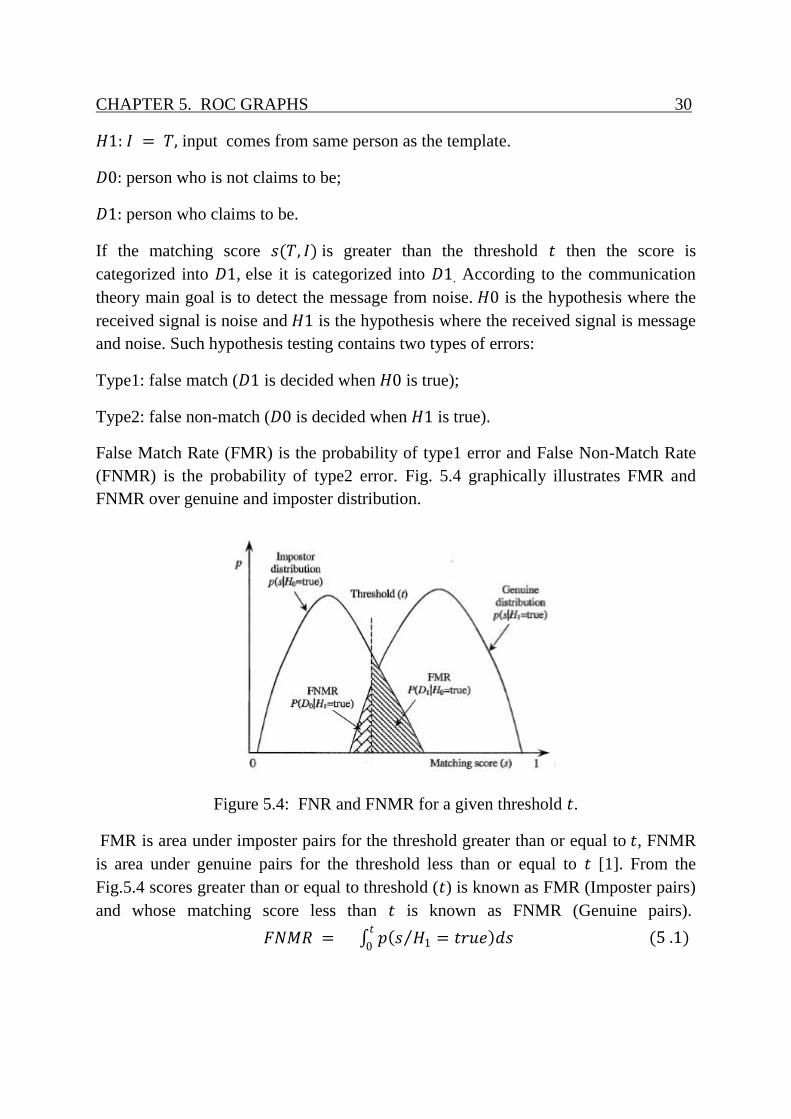
False Match Rate (FMR) is the probability of type1 error and False Non-Match Rate
(FNMR) is the probability of type2 error. Fig. 5.4 graphically illustrates FMR and
FNMR over genuine and imposter distribution.
Figure 5.4: FNR and FNMR for a given threshold 𝑡.
FMR is area under imposter pairs for the threshold greater than or equal to 𝑡, FNMR
is area under genuine pairs for the threshold less than or equal to 𝑡 [1]. From the
Fig.5.4 scores greater than or equal to threshold (𝑡) is known as FMR (Imposter pairs)
and whose matching score less than 𝑡 is known as FNMR (Genuine pairs).
𝐹𝑁𝑀𝑅 = 𝑝 𝑠 𝐻1 = 𝑡𝑟𝑢𝑒 𝑑𝑠𝑡
0 (5 .1)
31 CHAPTER 5. ROC GRAPHS
𝐹𝑀𝑅 = 𝑝 𝑠 𝐻0 = 𝑡𝑟𝑢𝑒 𝑑𝑠. 𝑡
0 (5.2)
Both FMR and FNMR are functions of threshold (𝑡). As the value of t decreases FMR
(𝑡) increases and the system becomes more tolerant to noise which may lead high
probability to imposters to get in. The system becomes more secure when the value of
𝑡 increases, then FNMR (𝑡) increases. By using ROC graphs we can represent the
system performance at all points of 𝑡. It helps the system designer to observe the
system performance at all points so that the system can be used for particular
applications at particular values of 𝑡[1].
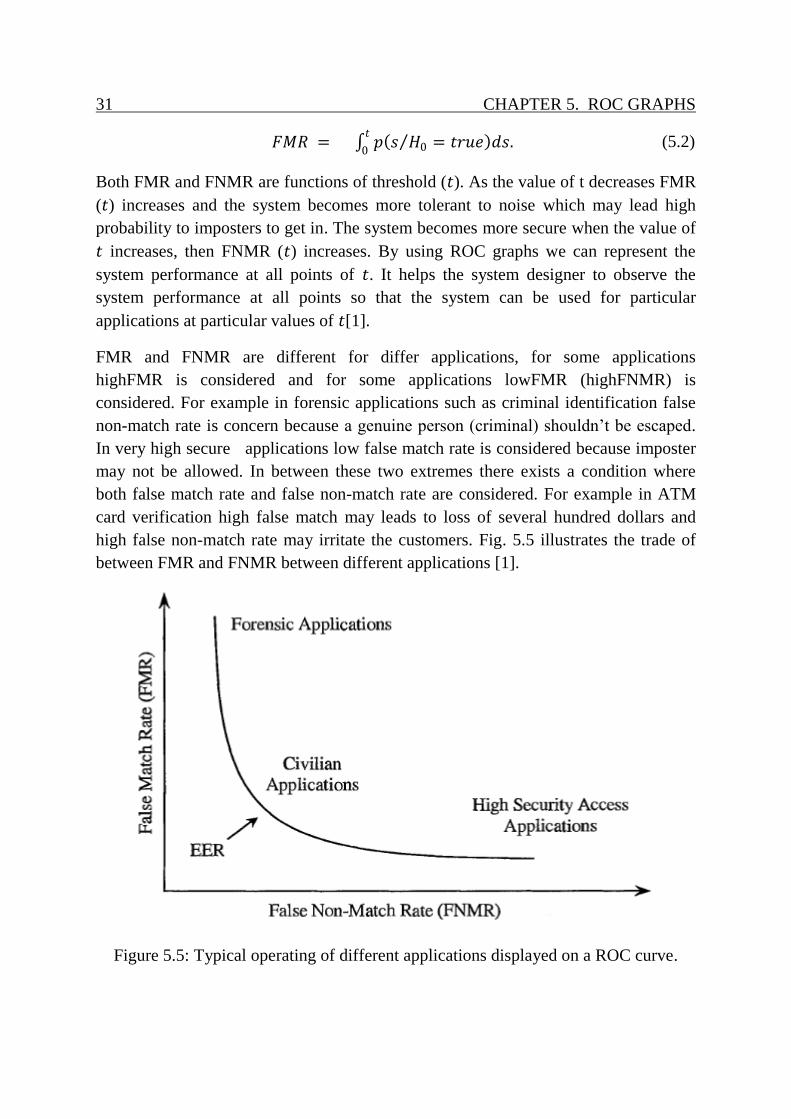
FMR and FNMR are different for differ applications, for some applications
highFMR is considered and for some applications lowFMR (highFNMR) is
considered. For example in forensic applications such as criminal identification false
non-match rate is concern because a genuine person (criminal) shouldn’t be escaped.
In very high secure applications low false match rate is considered because imposter
may not be allowed. In between these two extremes there exists a condition where
both false match rate and false non-match rate are considered. For example in ATM
card verification high false match may leads to loss of several hundred dollars and
high false non-match rate may irritate the customers. Fig. 5.5 illustrates the trade of
between FMR and FNMR between different applications [1].
Figure 5.5: Typical operating of different applications displayed on a ROC curve.

CHAPTER5. ROC GRAPHS 32
From the Fig. 5.4, Fig. 5.6
Genuine Match
Match between two samples of the same fingerprint.
Imposter Match
Match between two different Fingerprints.
False Accept Rate (FAR)
Falsely accepting an imposter match.
False Reject Rate (FRR)
Falsely rejecting a genuine match.
Equal-Error Rate: The point at which FMR and FNMR are identical i.e.
FMR(𝑡) = FNMR(𝑡).
ZeroFMR is the point at which false matcher occurs.
ZeroFNMR is the point at which no false matcher occurs.
Figure 5.6: ROC curve between FMR and FNMR where EER, ZeroFMR and
ZeroFNMR are highlighted.

33 CHAPTER 5. ROC GRAPHS
5.5 Experimental Results
“FVC 2000 Database1_a” [17] was used to evaluate the NIST software in this thesis.
This Database consists of 100 users fingers with 8 different samples from each finger.
Among 100 different fingers top 60 users with 8 different samples from each finger
are used in this work. This type of database is used to evaluate the fingerprint
matching at different conditions. ROC graphs of FNMR is calculated from 60
different fingers with 8 different samples from each user of genuine attempts. A single
image of the 8 samples I compared to rest of the 7 fingerprint for the same user. FMR
is calculated for 60 different fingers with 8 different samples from each finger of
imposter matching in which each fingerprint is matched with all imposter images.
For FNMR it will be around 3500 combinations,
For FMR it will be around 67319 combinations.
As explained in section 5.4 based on the vales of t the system becomes more tolerant
to noise and more secure. So the system performance is reported at all operating
points(threshold, t). Scores obtained from FNMR and FMR are plotted using
ROC graphs so that the performance of the Biometric system can be identified. If
we plot the scores obtained from different biometric systems with that curve a genuine
system can be identified at different points of thresholds [10].
Figure 5.7: Plotting FMR (𝑡) and FNMR (𝑡) obtained from Genuine and imposter
distributions (3500 genuine pairs and 67319 imposter pairs).
0 0.1 0.2 0.3 0.4 0.5 0.6 0.7 0.8 0.9 10
0.1
0.2
0.3
0.4
0.5
0.6
0.7
0.8
0.9
1
EER
FMR(t)
FNMR(t)
t
Err
or

CHAPTER 5. ROC GRAPHS 34
Results displayed below shows the ROC curve for the proposed algorithm for NIST
software. Fig. 5.7 specifies FMR(𝑡) and FNMR(𝑡) obtained from Genuine and
imposter distributions which resembles with the ROC-curve shown in Fig. 5.6. Fig.
5.8 evaluates the performance of the system i.e. area under ROC curve as explained in
section5.3. For evaluating the performances of two systems same plot is made for the
scores obtained for different technique using same DB and the system with more AUC
is treated as best system.
Figure 5.8: Plotting FMR(𝑡) and 1-FNMR(𝑡) obtained from Genuine and imposter
distributions (3500 genuine pairs and 67319 imposter pairs).
0 0.1 0.2 0.3 0.4 0.5 0.6 0.7 0.8 0.9 10
0.1
0.2
0.3
0.4
0.5
0.6
0.7
0.8
0.9
1
1-F
ala
se N
on-M
atc
h R
ate
(FN
MR
)
Falase Match Rate(FMR)
Chapter 6
Conclusion
NBSI source code for fingerprint recognition which is entirely written in ANSI
𝑪 programming language is implemented and evaluated by using the system
developed in Matlab environment. This is performed by using 𝑪 language
MEX-files which enables to run original 𝑪 code without reimplementing it as
Matlab script. A function is developed with NBIS which helps to extract
minutiae from grayscale fingerprint image and match two minutiae patterns to
produce a match score. In this work 60 unique users with 8 fingerprints per user
i.e., 480 fingerprints had been used for evaluating the system. Scores obtained
from minutia matcher after comparing with genuine and imposter matching had
been plotted using Receiver Operating Characteristic (ROC) graphs.
Finally the performance of the system is evaluated by analyzing plotted
Receiver Operating characteristics (ROC) graphs. The results obtained by using
this functionality can be used for comparing the results obtained with other
technique for measuring the system performance (same DB is used in both
cases) using ROC graphs.
35
Bibliosgraphy
[1] D. Maltoni, D. Maio, A.K. Jain and S. Prabhakar, Handbook of
Fingerprint Recognition, Springer, 2003, ISBN 0-387-95431-7.
[2] The central source of information on biometrics-related activities of the
Federal government, available at
http://www.biometrics.gov/Documents/FingerprintRec.pdf.
[3] NIST Biometric Image Software, available at
http://fingerprint.nist.gov/NBIS/nbis_non_export_control.pdf.
[4] I A. Jain, L. Hong and R. Bolle, “On-Line Fingerprint Verification”,
IEEE Trans. Pattern Analysis and Machine Intelligence, Vol. 19, No.4,
pp. 302-3 14, Apr. 1997.
[5] Ahmad, F.; Mohamad, D.; “A Review on Fingerprint Classification
Techniques”, International Conference on computer Technology and
Development, ICCTD ’09, Vol.2, pp. 411-415, 2009.
[6] NIST special databases and software from the image group, available at
http://www.itl.nist.gov/iad/894.03/databases/defs/dbases.html.
[7] Signal Detection theory handout, available at, http://www-
psych.stanford.edu/~lera/psych115s/notes/signal/.
[8] Alnadabi, M.; Johnstone, S.; , "Speech/music discrimination by detection:
Assessment of time series events using ROC graphs," Systems, Signals
and Devices, 2009. SSD '09. 6th International Multi-Conference on , vol.,
no., pp.1-5, 23-26 March 2009
36
37 BIBLIOGRAPHY
[9] Tom Fawcett,”ROC Graphs: Notes and Practical Considerations for
References”, available at
http://home.comcast.net/~tom.fawcett/public_html/papers/ROC101.pdf.
[10] K.; Morita, A.; Aoki, T.; Higuchi, T.; Nakajima, H.; Kobayashi, K.; , "A
fingerprint recognition algorithm using phase-based image matching for
low-quality fingerprints," Image Processing, 2005. ICIP 2005. IEEE
International Conference on , vol.2, no., pp. II- 33-6, 11-14 Sept. 2005.
[11] MATLAB Documentation for using MEX-Files to call C/C++ and
Fortran Programs , available at
http://www.mathworks.se/access/helpdesk/help/techdoc/matlab_external/
f29502.html
[12] “Hand book for “Calling C and Fortran Programs from MATLAB”
available at
http://www.karenkopecky.net/Teaching/Cclass/MatlabCallsC.pdf.
[13] Asker M. Bazen, Gerben T.B. Verwaaijen, Sabih H. Gerez,Leo P.J.
Veelenturf and Berend Jan van der Zwaag ,” A Correlation-Based
Fingerprint Verification System”.
[14] Lavanya, B.N.; Raja, K.B.; Venugopal, K.R.; Patnaik, L.M.; , "Minutiae
Extraction in Fingerprint Using Gabor Filter Enhancement," Advances in
Computing, Control, & Telecommunication Technologies, 2009. ACT
'09. International Conference on , vol., no., pp.54-56, 28-29 Dec. 2009
[15] User's Guide to NIST Biometric Image Software (NBIS) available at,
http://www.nis.gov/cgi-bin//get_pdf.cgi?pub_id=51097
[16] User's Guide to Export Controlled Distribution of NIST Biometric
Image Software (NBIS-EC) available at,
http://fingerprint.nist.gov/NBIS/nbis_export_control.pdf.
[17] Maio, D.; Maltoni, D.; Cappelli, R.; Wayman, J.L.; Jain, A.K.; , .
"FVC2000: fingerprint verification competition," Pattern Analysis and
. Machine Intelligence, IEEE Transactions on , vol.24, no.3, pp.402-412, .
Mar 2002.

BIBLIOGRAPHY 38
[18] Muhammed Umer Munir, Dr. Muhammed Younus Javed "Fingerprint
Matching Using Gabor Filters".
[19] Anil K. Jain, Arun Ross and Salil Prabhakar “An Introduction to
Biometric Recognition,” Appeared in IEEE Transactions on Circuits and
Systems for Video Technology, Special Issue on Image- and Video-
Based Biometrics, Vol. 14, No. 1, January 2004.
[20] Dijana Petrovska-Delacrétaz, Gérard Chollet, Bernadette Dorizzi ;
“Guide to Biometric Reference Systems and Performance Evaluation”,
Springer-Verlag London Limited 2009, ISBN 978-1-84800-291-3.
Top Related