


Languages
Pages
Legal


Impact of Information Society on the Impact of Information Society on the Sustainable Development: Global and Sustainable Development: Global and
Regional AspectsRegional Aspects
Prof. M. Zgurovsky, National Technical University of UkraineProf. M. Zgurovsky, National Technical University of Ukraine “ “Kiev Polytechnic Institute”Kiev Polytechnic Institute”
www.ntu-kpi.kiev.ua e-mail: [email protected]
PlanPlan
1. The Concept of Sustainable Development1. The Concept of Sustainable Development
2. Calculations of the Index of Sustainable Development2. Calculations of the Index of Sustainable Development
3. Impact of Information Society on the Sustainable Development 3. Impact of Information Society on the Sustainable Development
4. Conclusions4. Conclusions

““System coordination of System coordination of economic, ecological economic, ecological and human development and human development in such a way that the in such a way that the quality and safety of quality and safety of life should not decrease life should not decrease from one generation from one generation to another. to another. The environmental The environmental conditions should conditions should not worsen and the social not worsen and the social progress should meet progress should meet the needs of every person.the needs of every person. ””
Came from: Vladimir Vernadsky (1922)
Fig.1. The Concept of sustainable development

Ecological
Ie= Ies = ESI
Economic
Iec= F(Ic,Ief)
SocialIs= F(Iq,Ihd,Iks)
Is
Ie
Iec
Fig.2. Global dimensions of sustainable development
Isd
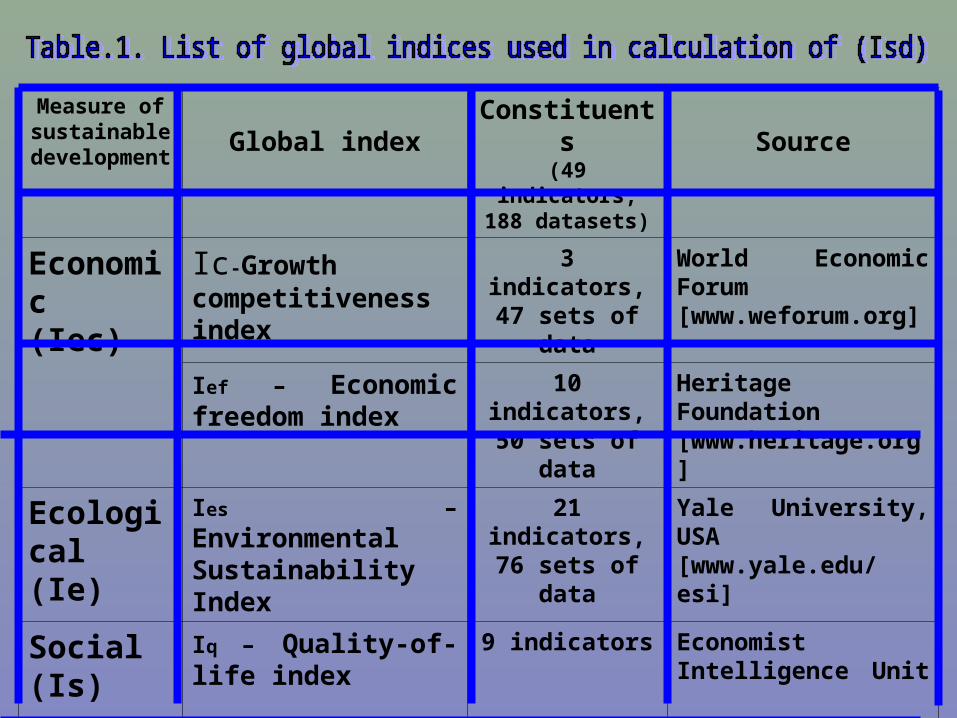
Measure of sustainable
development Global index
Constituents(49 indicators,188 datasets)
Source
Economic(Іec)
Ic-Growth competitiveness index
3 indicators,47 sets of data
World Economic Forum [www.weforum.org]
Ief – Economic freedom index
10 indicators,50 sets of data
Heritage Foundation [www.heritage.org]
Ecological(Іе)
Ies – Environmental Sustainability Index
21 indicators,76 sets of data
Yale University, USA[www.yale.edu/esi]
Social(Іs)
Іq – Quality-of-life index 9 indicators Economist Intelligence Unit [www.en.wikipedia.org]
Іhd – Human development index
3 indicators United Nation Development program[www.hdr.undp.org]
Iks – Knowledge society index
3 indicators,15 sets of data
UNDESA,[UN, NE.04.C.1.2005]
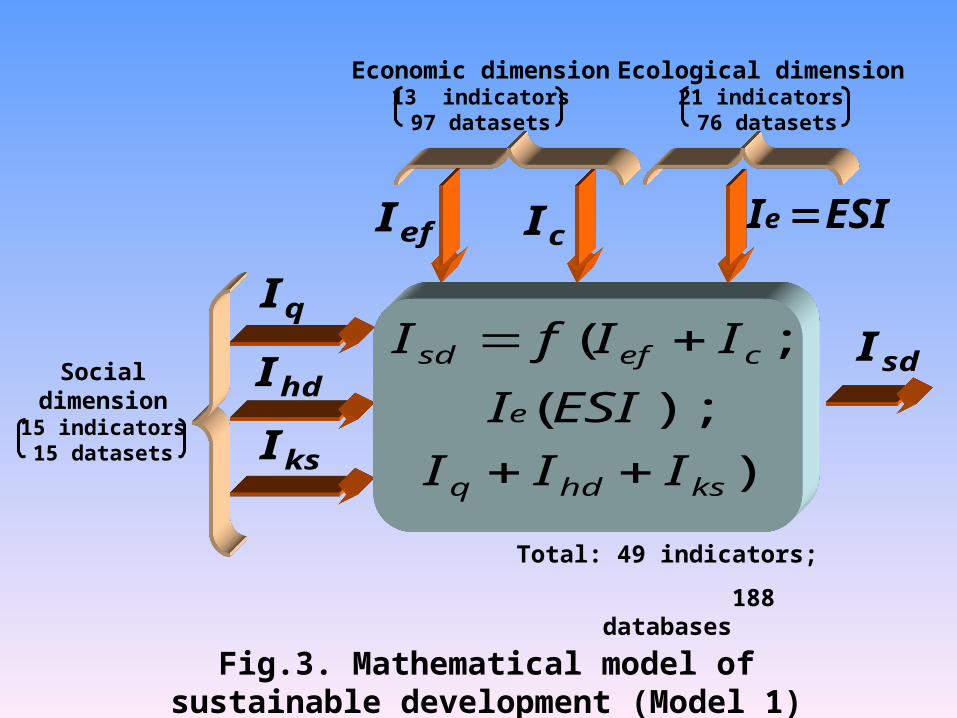
)
);(
;(
kshdq
e
cefsd
III
ESII
IIfI
qI
hdI
ksI
efI cI ESIIe
sdI
Total: 49 indicators;
188 databases
Fig.3. Mathematical model of sustainable development (Model 1)
Economic dimension13 indicators97 datasets
Ecological dimension21 indicators 76 datasets
Socialdimension15 indicators15 datasets

Ranking Country
GGP per capita by the
parity of purchasing
capacity (thous. dol.
USA)
Index of sustainable
development
Index of the
economic measure
Index of the ecological measure
Index of the social measure
1 Finland 29,650 0,786 0,567 0,751 0,802
2 Iceland 41,804 0,780 0,561 0,708 0,839
3 Sweden 30,590 0,774 0,538 0,717 0,84
4 Norway 39,590 0,755 0,488 0,734 0,829
5 Switzerland 33,580 0,738 0,538 0,637 0,82
6 Luxemburg 69,737 0,738 0,558 0,618 0,816
7 Denmark 32,490 0,731 0,563 0,582 0,828
8 Canada 34,150 0,720 0,525 0,644 0,777
9 Ireland 36,790 0,716 0,559 0,592 0,779
10 Australia 31,010 0,716 0,532 0,61 0,792
11 New Zealand 25,110 0,713 0,526 0,61 0,79
12 Austria 31,420 0,708 0,504 0,627 0,785
13 USA 41,529 0,695 0,562 0,53 0,779
14 Germany 28,250 0,687 0,51 0,57 0,777
15 The Netherlands 30,920 0,684 0,524 0,537 0,787

16 Japan 30,750 0,680 0,48 0,573 0,793
17 England 31,150 0,674 0,543 0,502 0,773
18 Estonia 14,800 0,662 0,533 0,582 0,658
19 Uruguay 8,869 0,647 0,382 0,718 0,659
20 Chile 12,120 0,642 0,511 0,536 0,678
21 France 30,640 0,641 0,438 0,552 0,754
22 Spain 25,370 0,626 0,455 0,488 0,758
23 Israel 21,310 0,623 0,454 0,509 0,725
24 Latvia 11,862 0,618 0,42 0,604 0,649
25 Belgium 30,660 0,615 0,468 0,444 0,755
26 Italy 27,960 0,613 0,411 0,501 0,759
27 Kosta Rika 9,000 0,607 0,372 0,596 0,685
28Czech Republic 17,600 0,602 0,459 0,466 0,703
29 Slovakia 15,513 0,601 0,428 0,528 0,673
30 Hungary 16,047 0,601 0,424 0,52 0,686
31 Croatia 11,870 0,596 0,367 0,595 0,661
32 Korea 23,360 0,591 0,444 0,43 0,729

33 Malaysia 10,450 0,590 0,413 0,54 0,643
34 Greece 22,340 0,586 0,392 0,501 0,703
35 Panama 6,760 0,583 0,363 0,577 0,646
36 Brazil 8,760 0,581 0,347 0,622 0,61
37 Columbia 7,330 0,565 0,35 0,589 0,597
38 Poland 12,825 0,559 0,401 0,45 0,667
39 Bulgaria 8,664 0,549 0,365 0,5 0,628
40 Mexico 10,000 0,546 0,373 0,462 0,649
41 Tunis 7,910 0,544 0,37 0,518 0,586
42 Bolivia 3,680 0,542 0,322 0,595 0,556
43 Romania 6.105 0.519 0.34 0.462 0.616
44 Russia 9.81 0.5.15 0.319 0.561 0.52
45 Moldova 2,280 0,506 0,33 0,512 0,529
46 Trinidad 11,720 0,500 0,391 0,363 0,599
47 Ukraine 6,500 0,485 0,319 0,447 0,554
48 Egypt 3,930 0,484 0,337 0,44 0,535

№ Description Weighting coefficients
А. Index of the knowledge society (Iks)
1 • Years of scooling 0.066
2 • Yong population 0.066
3 • Newspapers per 1000 pop. 0.066
4 • Internet users per 10000 pop. 0.066
5 • Main Phone Liners per 100 pop. 0.066
6 • Call Phones per 100 pop. 0.066
7 • R&D Expenditure (% of GDP) 0.066
8 • Pupils per teacher 0.066
9 • Gini Index 0.066
Qks=0.60
B. Growth Competetiveness Index (Ic)
10 • Call Phones per 100 pop. 0.050
11 • Internet users per 10000 pop. 0.050
12 • Internet hosts per 10000 pop. 0.050
13 • Main Phone Liners per 100 pop. 0.050
14 • Personal Computers per 100 pop. 0.050
Qc=0.25

Fig. 4. Estimation of the information society impact on sustainable development (Model 2)
)Ff(I issd )( ccksksis IQIQF
ksksIQ
cc IQ
Growth competitivenessindex (Ic)
Kno
wle
dge
soci
ety
inde
x (I
ks)

Ranking Country
Index of sust.
develop-ment (Іsd)
Index of economic
dimension (Іec)
Index of ecological dimension
(Іe)
Index of social
dimension(Іs)
Impact of IS on sust.
develop-ment %
1 Denmark 0.731 0.563 0.582 0.828 11.046
2 Japan 0.680 0.480 0.573 0.793 10.847
3 Great Britain 0.674 0.543 0.502 0.773 10.808
4 Germany 0.687 0.510 0.570 0.777 10.682
5 Israel 0.623 0.454 0.509 0.725 10.664
6 Netherlands 0.684 0.524 0.537 0.787 10.614
7 Belgium 0.615 0.468 0.444 0.755 10.606
8 Sweden 0.774 0.538 0.717 0.840 10.545
9 USA 0.695 0.562 0.530 0.779 10.496
10 France 0.641 0.438 0.552 0.754 10.343
11 Switzerland 0.737 0.538 0.637 0.820 10.298
12 Iceland 0.780 0.561 0.708 0.839 10.289

13 New Zealand 0.713 0.526 0.610 0.790 10.247
14 Austria 0.708 0.504 0.627 0.785 10.213
15 Czech Republic 0.602 0.459 0.466 0.703 10.210
16 Spain 0.626 0.455 0.488 0.758 10.149
17 Norway 0.755 0.488 0.734 0.829 10.128
18 Finland 0.786 0.567 0.751 0.802 9.968
19 Poland 0.559 0.401 0.450 0.667 9.892
20 Hungary 0.601 0.424 0.520 0.686 9.879
21 Luxemburg 0.735 0.557 0.618 0.815 9.833
22 Tunis 0.544 0.370 0.518 0.586 9.820
23 Italy 0.612 0.411 0.501 0.759 9.763
24 Malaysia 0.589 0.413 0.540 0.643 9.741
25 Slovakia 0.602 0.428 0.528 0.673 9.698
26 Australia 0.716 0.532 0.610 0.792 9.692
27 Canada 0.721 0.525 0.644 0.777 9.502
28 Romania 0.519 0.340 0.462 0.616 8.781
29 Egypt 0.482 0.337 0.440 0.528 9.399

30 Mexico 0.545 0.373 0.462 0.649 9.394
31 Costa Rikа 0.606 0.372 0.596 0.685 9.348
32 Greece 0.586 0.392 0.501 0.703 9.340
33 Estonia 0.662 0.533 0.582 0.658 9.296
34 Bulgaria 0.549 0.365 0.500 0.628 9.288
35 Chile 0.642 0.511 0.536 0.678 9.272
36 Latvia 0.618 0.420 0.604 0.649 9.183
37 Croatia 0.596 0.367 0.595 0.661 9.031
38 Moldova 0.506 0.330 0.512 0.529 8.996
39 Ukraine 0.486 0.319 0.447 0.554 8.996
40 Trinidad 0.500 0.391 0.363 0.599 8.955
41 Panama 0.583 0.363 0.577 0.646 8.928
42 Ireland 0.717 0.559 0.592 0.779 8.784
43 Russia 0.515 0.319 0.561 0.520 8.618
44 Uruguay 0.648 0.382 0.718 0.659 8.358
45 Columbia 0.566 0.350 0.589 0.597 8.189
46 Brazil 0.581 0.347 0.622 0.610 7.850

Ranking Country
Index of sustainable
development (Іsd)
Index of economic
dimension (Іec)
Index of ecological
dimens. (Іe)
Index of social
dimens.(Іs)
Impact of IS on
sustainable development
%
1 Denmark 0.731 0.563 0.582 0.828 11.046
2 Sweden 0.774 0.538 0.717 0.840 10.545
4 Switzerland 0.737 0.538 0.637 0.820 10.298
3 Iceland 0.780 0.561 0.708 0.839 10.289
5 Norway 0.755 0.488 0.734 0.829 10.128
7 Finland 0.786 0.567 0.751 0.802 9.968
6 Luxemburg 0.735 0.557 0.618 0.815 9.833
8 Australia 0.716 0.532 0.610 0.792 9.692
9 Canada 0.721 0.525 0.644 0.777 9.502
10 Ireland 0.717 0.559 0.592 0.779 8.784

Ranking Index of
sustainable development
(Іsd)
Index of economic
dimension (Іec)
Index of ecological dimension
(Іe)
Index of social
dimension (Іs)
Impact of IS on
sustainable development
%
1 Japan 0.680 0.480 0.573 0.793 10.847
2Great Britain 0.674 0.543 0.502 0.773 10.808
3 Germany 0.687 0.510 0.570 0.777 10.682
4 USA 0.695 0.562 0.530 0.779 10.496
5 France 0.641 0.438 0.552 0.754 10.343
6 Italy 0.612 0.411 0.501 0.759 9.763
7 Canada 0.721 0.525 0.644 0.777 9.502
8 Russia 0,515 0,319 0,561 0,520 6,360
Country

Ranking Country
Index of sustainable
development (Іsd)
Index of economic dimension (Іec)
Index of ecologic
al dimens.
(Іe)
Index of social
dimens.(Іs)
Impact of IS on
sustainab.develop.
(%)
1 Czech Republic 0.602 0.459 0.466 0.703 10.210
2 Poland 0.559 0.401 0.450 0.667 9.892
3 Slovak Republic 0.602 0.428 0.528 0.673 9.698
5 Estonia 0.662 0.533 0.582 0.658 9.296
6 Bulgaria 0.549 0.365 0.500 0.628 9.288
7 Latvia 0.618 0.420 0.604 0.649 9.183
8 Croatia 0.596 0.367 0.595 0.661 9.031
9 Moldova 0.506 0.330 0.512 0.529 8.996
10 Ukraine 0.486 0.319 0.447 0.554 8.996
4 Romania 0.519 0.340 0.462 0.616 9.498

Groups of countries
Average Impact
(%))
Correlation between Fis
and Isd
Correlation between
Corruption Perception
and Isd
1 2 3 4
46 countries 9,711 KFI=0,87 0,916
G8 10,132 KFI=0,783 0,833
Smart countries
10,008 KFI=0,737 0,707
Post Sov. Countries
9,409 KFI=0,985 0,904
;II6,6
I
I5,37 Impact
sd
is
sd
c
;yx
yx
Kxy
i
2i
i
2i
iii

Conclusions Conclusions (Fig. 5)(Fig. 5)
The new sustainable development measuring system The new sustainable development measuring system (metric) was worked out as a new tool for (metric) was worked out as a new tool for investigation. This tool allows to receive the investigation. This tool allows to receive the quantitative estimations of the sustainable quantitative estimations of the sustainable development process depending on the groups of development process depending on the groups of economic, ecological and social indicators and economic, ecological and social indicators and datasets.datasets.
The impact of information society on sustainable The impact of information society on sustainable development was studied on the global and regional development was studied on the global and regional scale based on the sustainable development scale based on the sustainable development mathematical model.mathematical model.
The created tool allows to develop the The created tool allows to develop the recommendations regarding the ways of improving recommendations regarding the ways of improving the standards of life quality and safety in particular the standards of life quality and safety in particular countries and regions of the world by the advance of countries and regions of the world by the advance of information society and competitive growth information society and competitive growth parameters. parameters.
Top Related