


Languages
Pages
Legal


Imagine the result
Tierra Solutions
Development of Correction Factors for Split Samples Using the Approach Developed by CSC Analytical1
Polychlorinated Biphenyls and Polycyclic Aromatic Hydrocarbons
CPG Low Resolution Coring Program Sediment Chemistry Data
July 26, 2011
1 CSC. 2010. Report on Suspected Causes of Disparities between the Results Produced by Columbia Analytical Services and AXYS Analytical Services in Analysis of Lower Passaic River Sediment Split Samples for Chlorinated Dibenzo-p-Dioxins and Dibenzofurans, and Development of a Conversion Factor to Adjust Results between the Two Laboratories, CSC Environmental Solutions and Interface, Inc., March 2010.
CSC. 2011. The Effect of Application of a Correction Factor on Chlorinated Dibenzo-p-Dioxins and Dibenzofurans Results Produced by Columbia Analytical Services for Lower Passaic River Sediment Samples, January 2011.

Development of Correction Factors for Split Samples Using the Approach Developed by CSC Analytical PCBs and PAHs CPG Low Resolution Coring Program Sediment Chemistry Data
Jacqueline Iannuzzi Senior Scientist/Statistician/Geologist
Prepared for:
Tierra Solutions
Prepared by:
ARCADIS U.S., Inc. 326 First Street Suite 200 Annapolis Maryland 21403 Tel 410 295 1205 Fax 410 295 1225
Our Ref.:
B0009988.0004.00001
Date:
July 26, 2011

c:\documents and settings\cliff\my documents\projects\prrp\reports\lrc data summary rept\epa oversight report\pcb-pah issue\20110726 pcb-pah splits analysis.docx i
Table of Contents
References 3
Tables
1 Geometric Means of 2008 Lower Passaic River TA KNOX/AXYS Ratios and Associated Confidence Intervals for PAHs 4
2 Geometric Means of 2008 Lower Passaic River TA KNOX/AXYS Ratios and Associated Confidence Intervals for PAHs by AXYS Method MLA-021 Revision 5
3 Geometric Means of 2008 Lower Passaic River TA KNOX/AXYS Ratios and Associated Confidence Intervals for Polychlorinated Biphenyls 6
4 Correction Factors for Polycyclic Aromatic Hydrocarbon Data if Calculated by Methodology in CSC Report for Dioxin Congeners 10
5 Correction Factors for Polychlorinated Biphenyls Data if Calculated by Methodology in CSC Report for Dioxin Congeners 11
Attachments
c:\documents and settings\cliff\my documents\projects\prrp\reports\lrc data summary rept\epa oversight report\pcb-pah issue\20110726 pcb-pah splits analysis.docx 1
Development of Correction Factors for Split Samples Using the Approach Developed by CSC Analytical PCBs and PAHs
CPG Low Resolution Coring Program Sediment Chemistry Data
A report developed by USEPA’s contractor (CSC, 2010) attempts to identify the cause of disparities between 30 split sample dioxin/furan results from the 2008 Lower Passaic River Low Resolution Coring (LPR LRC) Program. These samples were analyzed both by CPG’s contracted laboratory, Columbia Analytical Services (CAS) and by USEPA’s laboratory, AXYS Analytical Services (AXYS). In the CSC report, the geometric mean and 95% confidence intervals of the ratios of the CAS result values to those of AXYS were calculated and reported. The mean ratios included data for which both laboratories’ results were greater than their corresponding quantitation limits. In the discussion of these results the report makes the following statement:
“The individual congener-specific geometric means [of the ratios] ranged between 0.53 (2,3,7,8-TCDD) and 0.91 (1,2,3,7,8-PeCDF), with a median geometric mean of 0.71. For seven of the fourteen congeners [evaluated by CSC], the confidence interval did not include 1.0, thus indicating that the bias between laboratories was statistically significant at the 95% confidence level.” Note, CSC 2010 indicates that a total of only fourteen of the seventeen dioxin/furan target analyte congeners reported by each of the laboratories were evaluated. As stated, seven congeners were shown to have significant differences among laboratories, seven congeners were not shown to be significantly different as their confidence intervals did not include the value of 1.0 and three congners (1,2,3,7,8-pentachlorodibenzo-p-dioxin, 1,2,3,4,7,8-hexachlorodibenzo-p-dioxin, and 1,2,3,7,8,9-hexachlorodibenzofuran) were not evaluated since they were not reported by both laboratories at levels above their respective quantitation limits in the any of the samples.
Split samples collected during the LPR LRC were also analyzed for polycyclic aromatic hydrocarbons (PAHs) and polychlorinated biphenyls (PCBs)2. An analysis of the PAH and PCB data was conducted by Arcadis in a similar fashion to that described in the CSC, 2010 report for the dioxin/furan results. The PAH and PCB comparison data evaluation is described here.
As was the case with LPR LRC split samples analyzed for dioxins/furans, 30 samples were collected and split between 2 laboratories for PAH and PCB characterization. The
2 All analyses in this report are based upon data provided by the Cooperating Parties Group (CPG) and AXYS Analytical.

c:\documents and settings\cliff\my documents\projects\prrp\reports\lrc data summary rept\epa oversight report\pcb-pah issue\20110726 pcb-pah splits analysis.docx 2
Development of Correction Factors for Split Samples Using the Approach Developed by CSC Analytical PCBs and PAHs
CPG Low Resolution Coring Program Sediment Chemistry Data
PAH and PCB split samples collected by USEPA were analyzed by AXYS, however unlike split samples analyzed for dioxins/furans, the CPG PAH and PCB samples were analyzed by TestAmerica in Knoxville, Tennesse (TA KNOX).
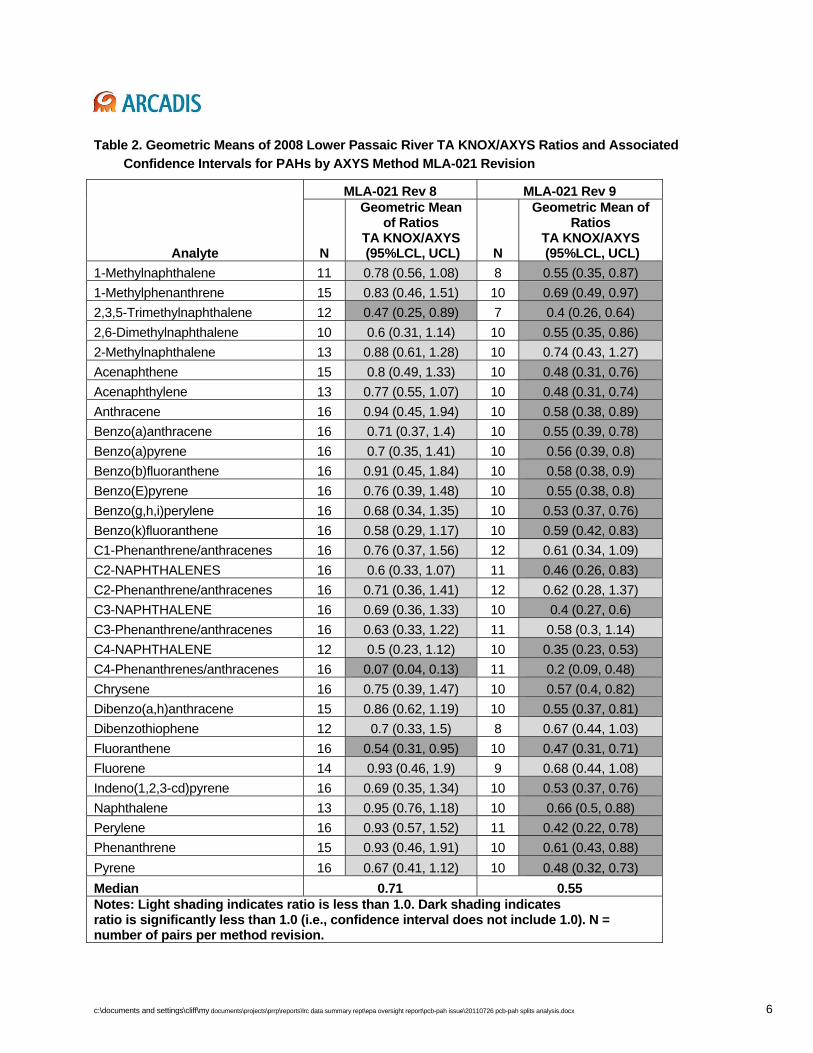
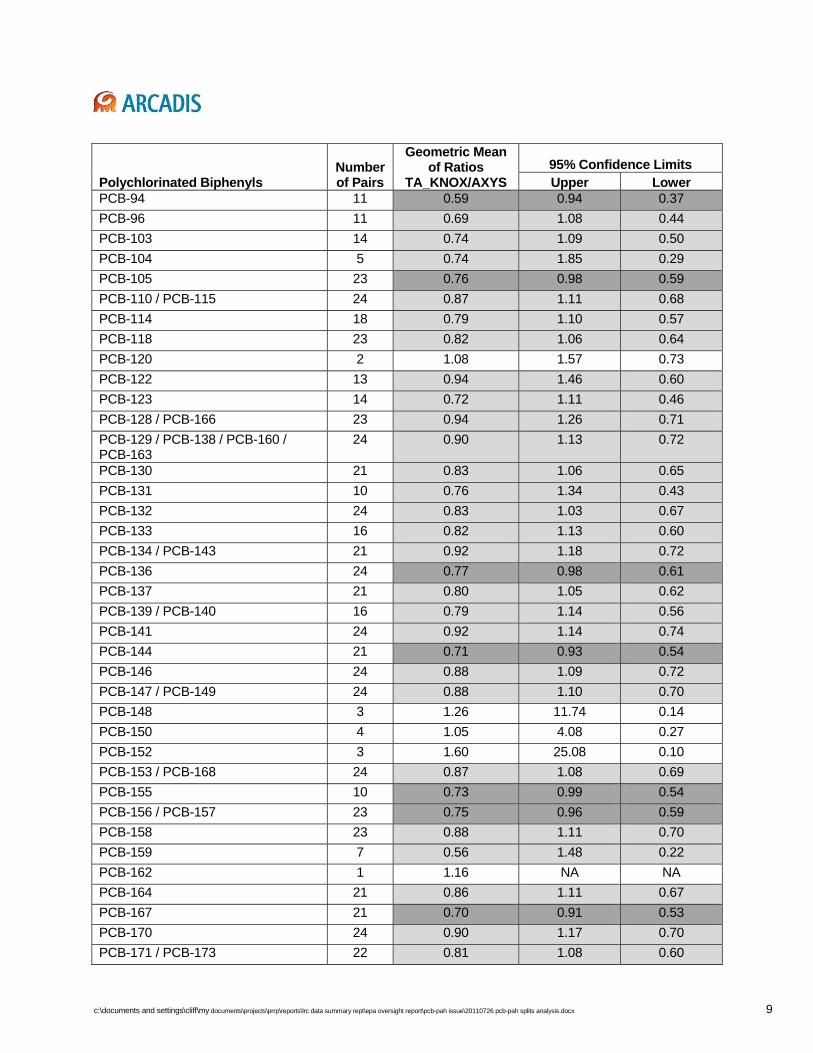
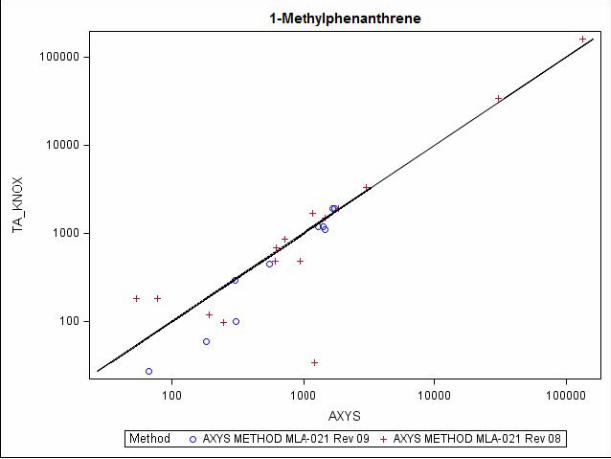
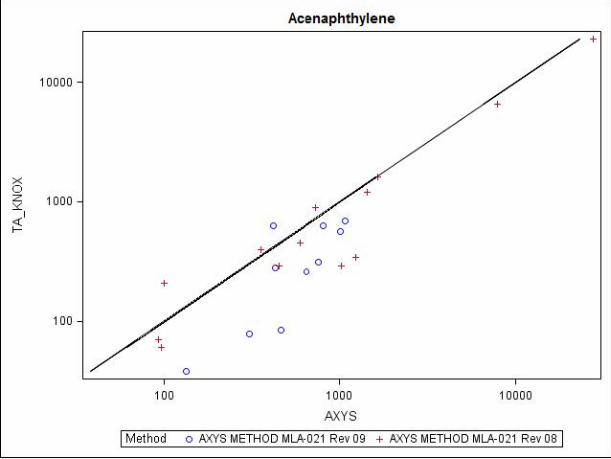
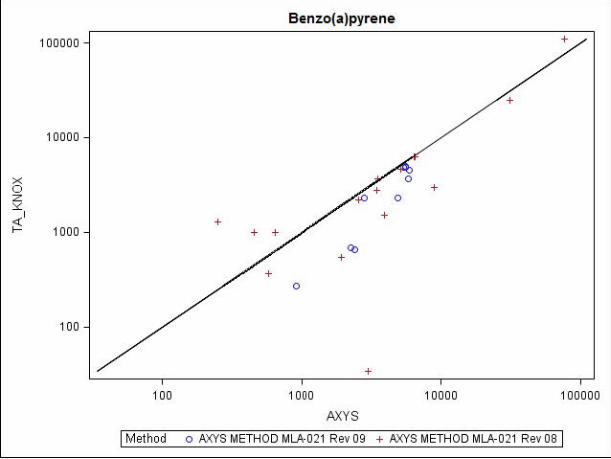
It should be noted also that AXYS used two methodologies for PAH analysis; some samples were analyzed by laboratory-specific standard operating procedure (SOP) Method MLA-021 Rev 8 and some by Method MLA-021 Rev 9. TA KNOX analyzed all samples using their laboratory-specific SOPID-0016. Note that TestAmerica Pittsburgh, PA also analyzed split samples for PAHs using the USEPA SW-846 analytical method 8270. The PAH results generated via USEPA SW-846 are not included in this comparison. After excluding paired results for which either laboratory reported a value below the quantitation limit, the geometric mean ratios (TA KNOX/AXYS) for all PAHs and PCBs (congeners and homologue groups) were calculated. Individual PAH geometric mean ratios ranged from 0.11 to 0.82 with a median of 0.66 (Table 1). Twenty of the 31 upper confidence limits were less than 1.0 indicating that for these analytes the mean ratio is significantly less than 1.0. To determine if there were differences in agreement between the two method revisions used by AXYS, the geometric mean ratios were also calculated separately by method (Table 2). For all analytes and both method revisions, geometric mean TA KNOX/AXYS ratios are less than 1.0. However, there are differences in significance among methods. For method revision 9, 25 out of 31 upper confidence limits were less than 1.0 (i.e, mean is significantly less than 1.0) while for method revision 8, only 3 upper confidence limits are less than 1.0. This would seem to indicate that the method revisions performed differently as compared to the TA KNOX methodology and that more bias is present in the revision 9 comparison. However, the confidence intervals of the geometric means for each analyte of each revision method overlap (Table 2), therefore, it is difficult to say with any certainty that the methods are in fact performing differently. Geometric mean ratios for the ten homologue groups ranged from 0.57 to 0.92 with a median of 0.80 (Table 3). Individual PCB congener geometric mean ratios ranged from 0.44 to 1.6 with a median of 0.81 (Table 3). Out of ten PCB homologue groups, ten geometric mean ratios were less than 1.0 and five were significantly less than 1.0. Out of 127 PCB congeners, 118 geometric mean ratios were less than 1.0 and 45 of the upper confidence limits were less than 1.0. Note, the total number of congeners evaluated for PCBs (127) represents the number of common target analyte results reported by both laboratories at a positive concentration above their respective quantitation limits in the same samples, excluding cases where identified analyte co-elutions were not identical. By the line of reasoning applied to the dioxin/furan results

c:\documents and settings\cliff\my documents\projects\prrp\reports\lrc data summary rept\epa oversight report\pcb-pah issue\20110726 pcb-pah splits analysis.docx 3
Development of Correction Factors for Split Samples Using the Approach Developed by CSC Analytical PCBs and PAHs
CPG Low Resolution Coring Program Sediment Chemistry Data
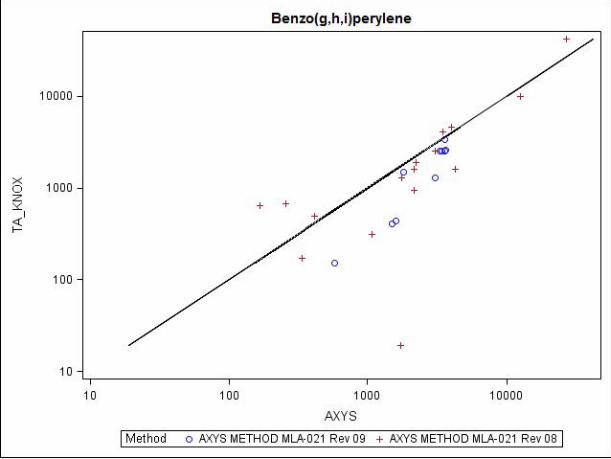
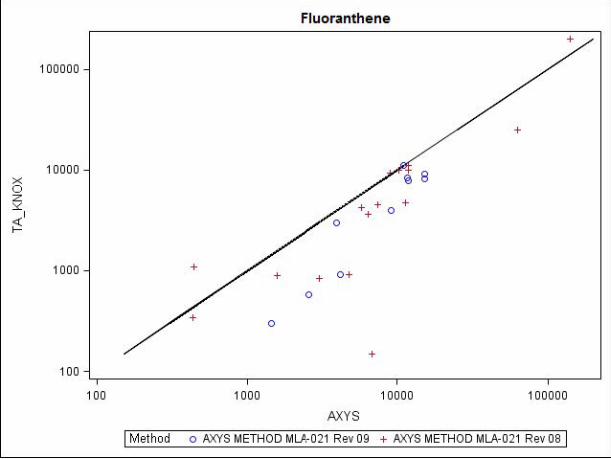
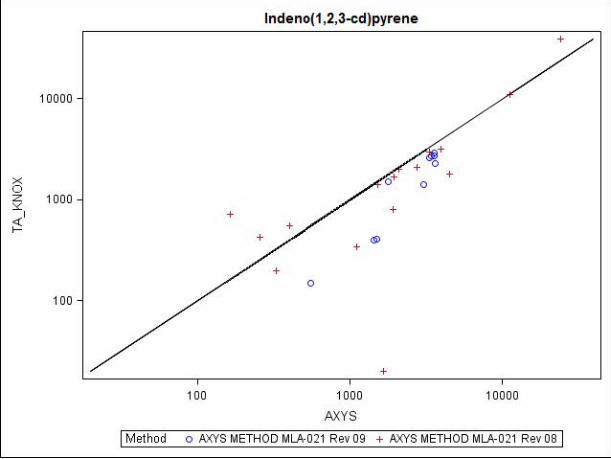
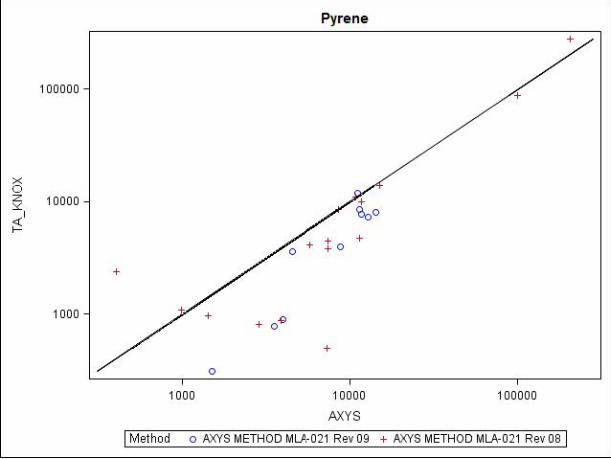
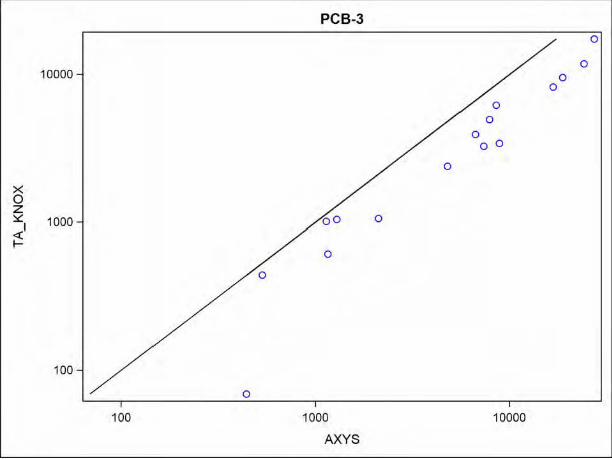
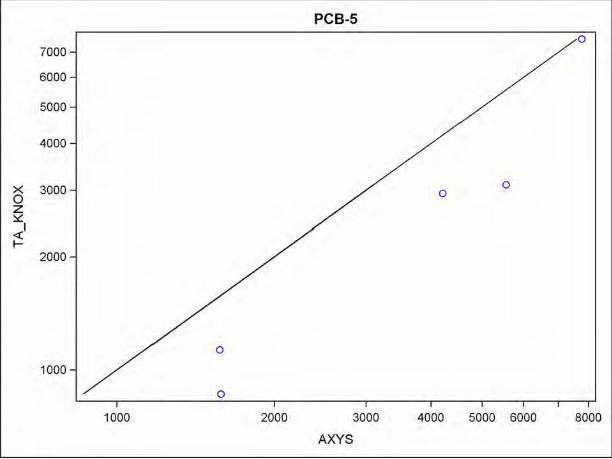
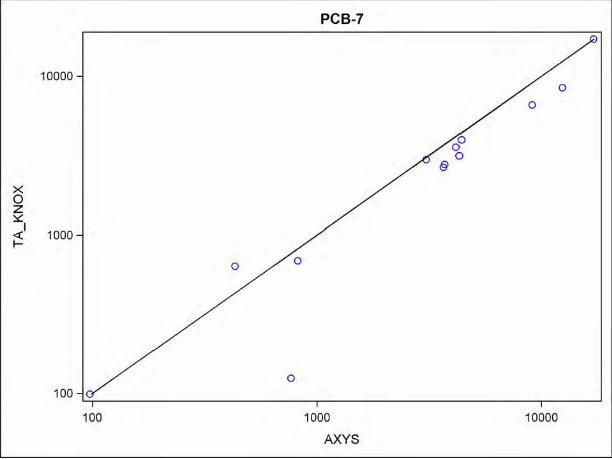
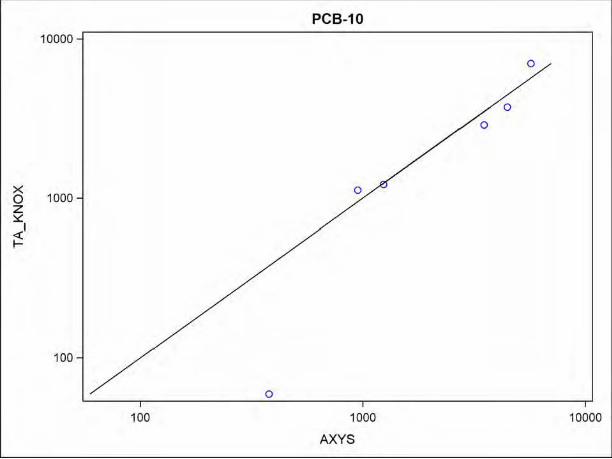
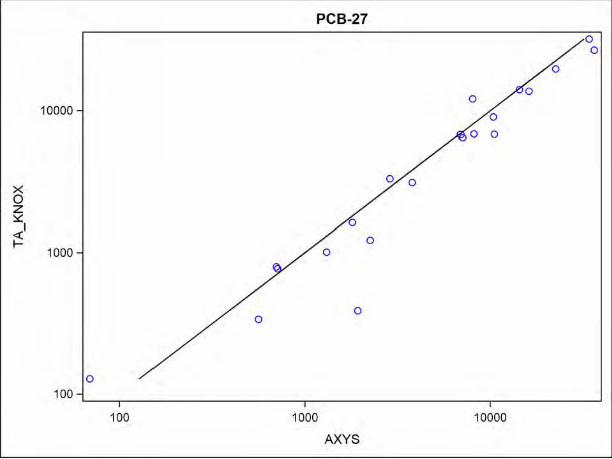
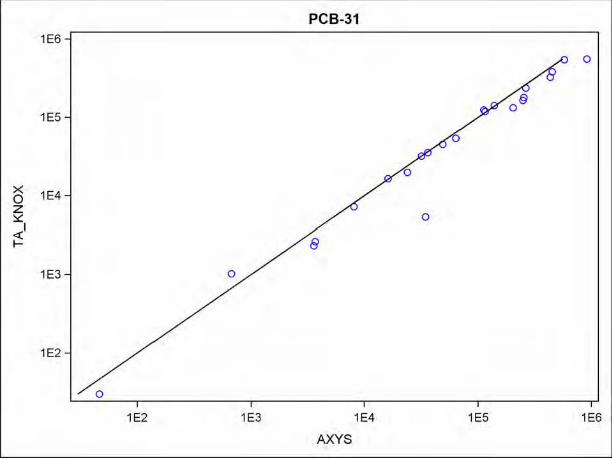
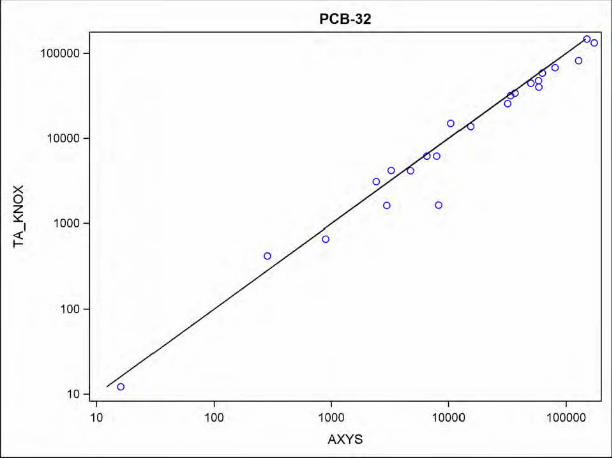
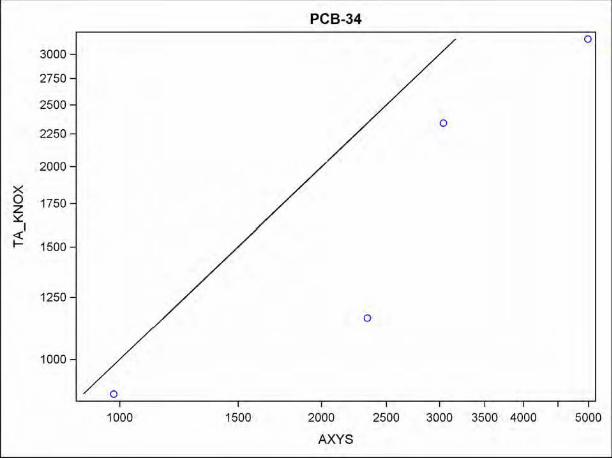
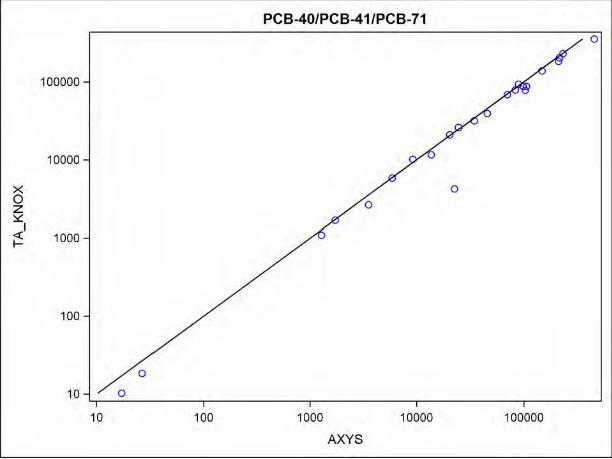
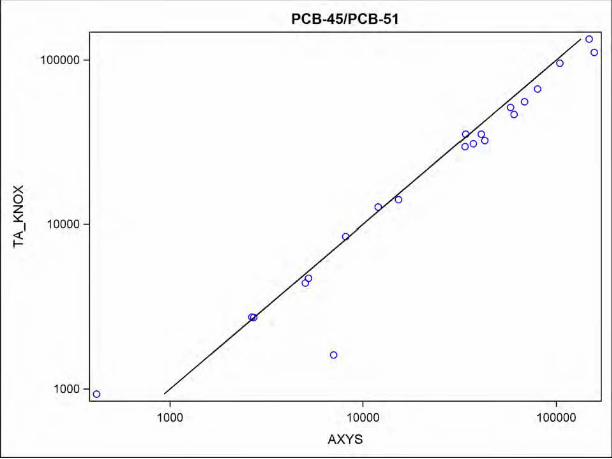
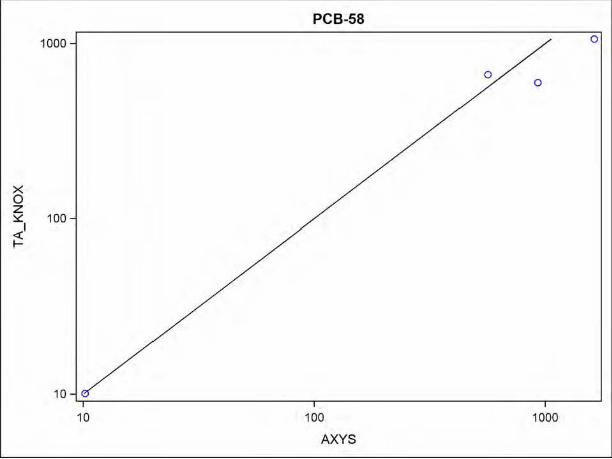
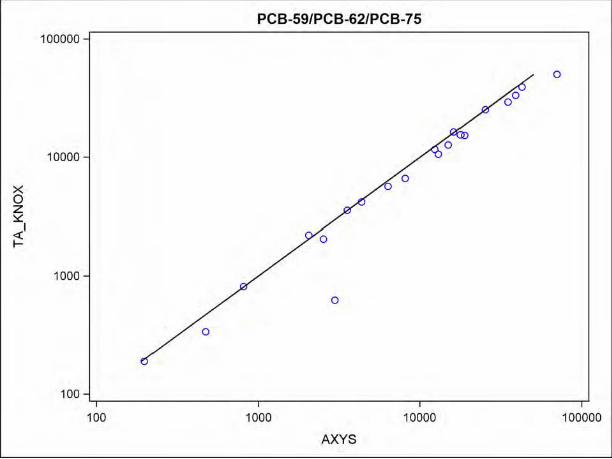
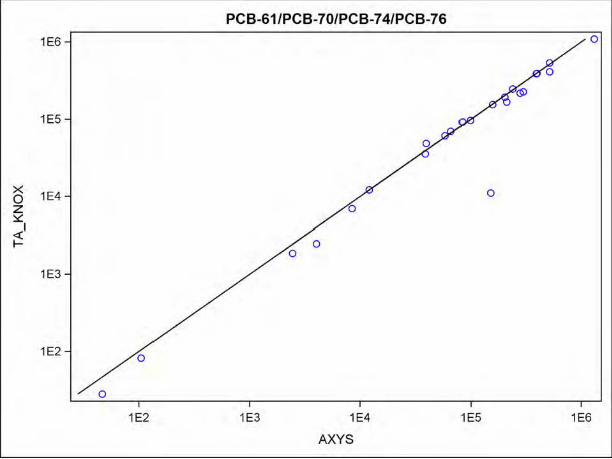
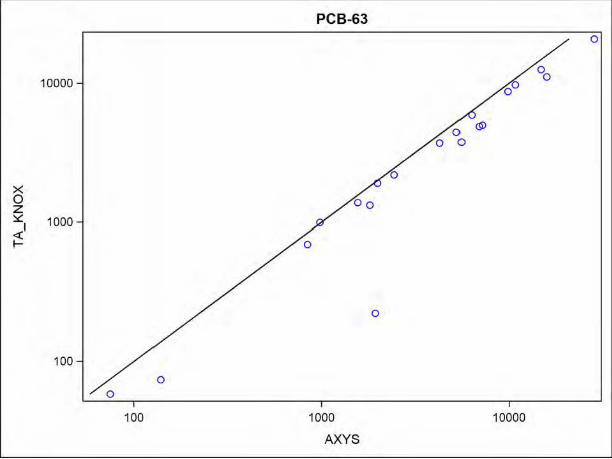
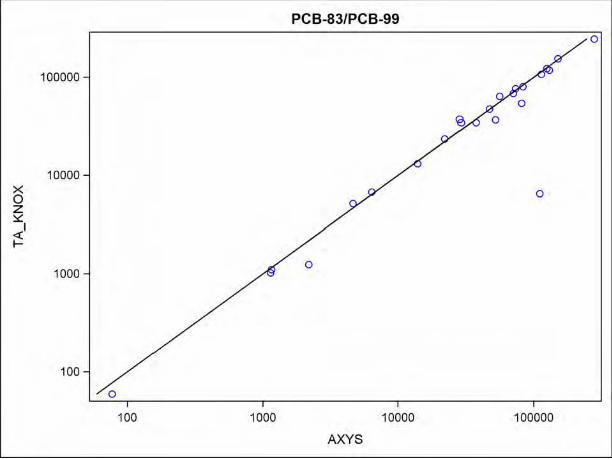
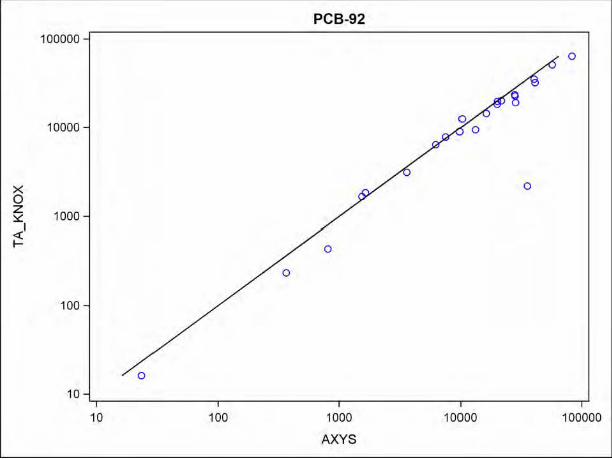
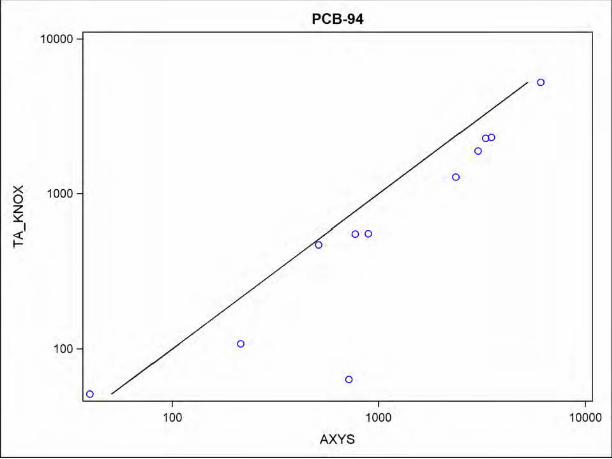
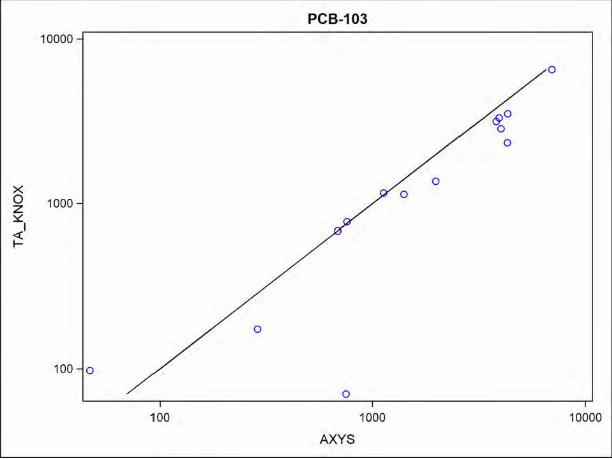
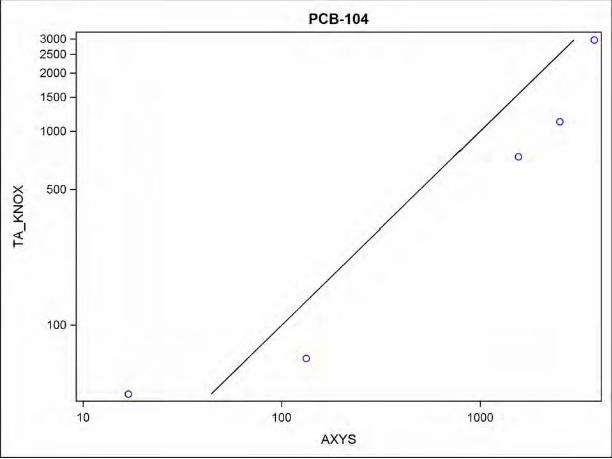
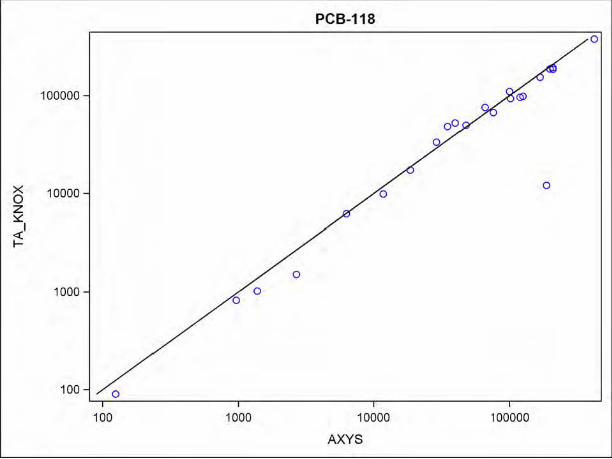
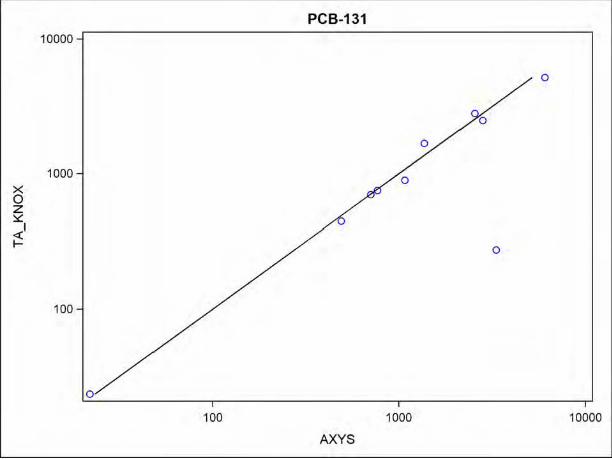
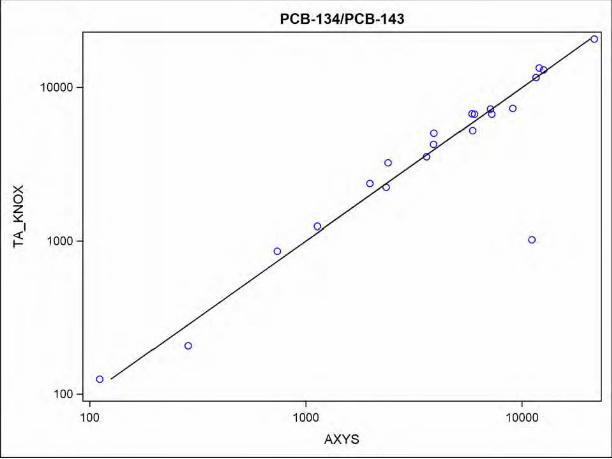
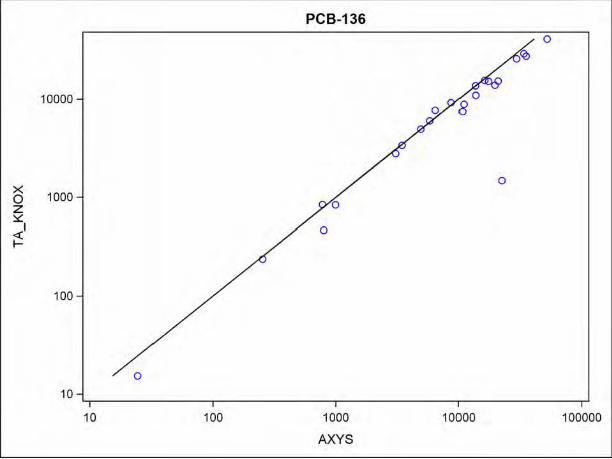
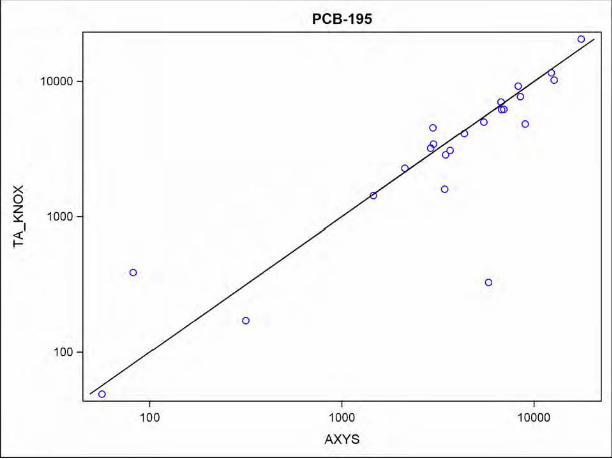
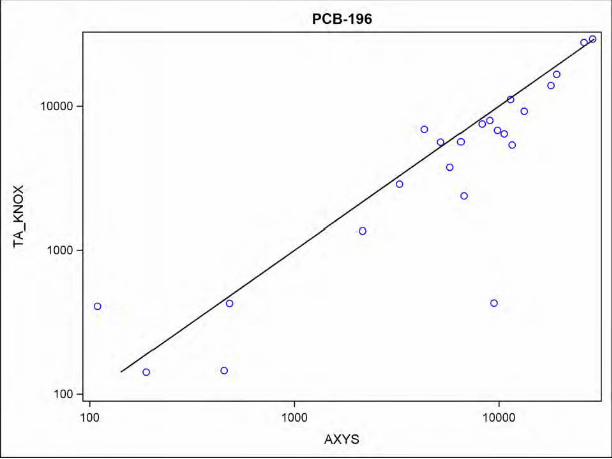
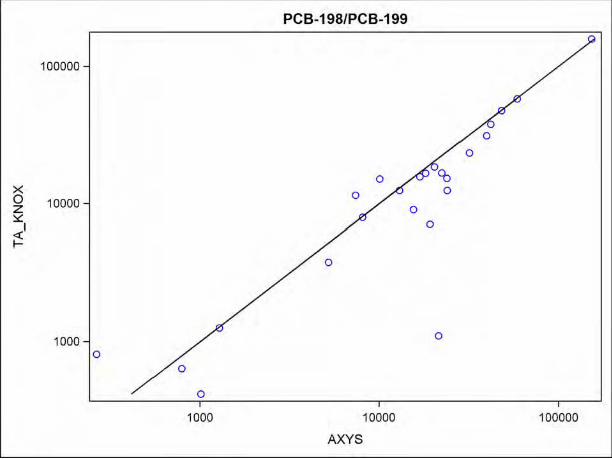
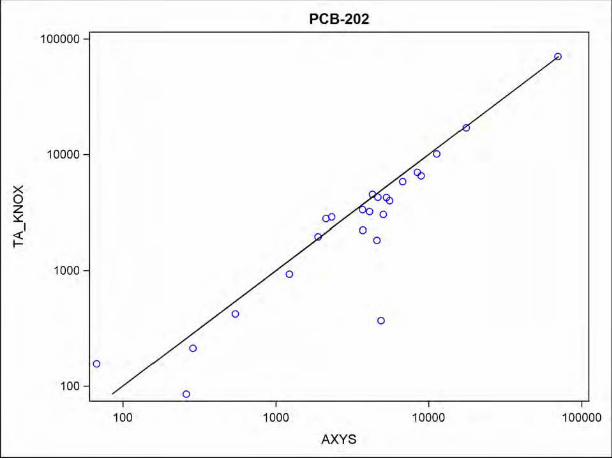
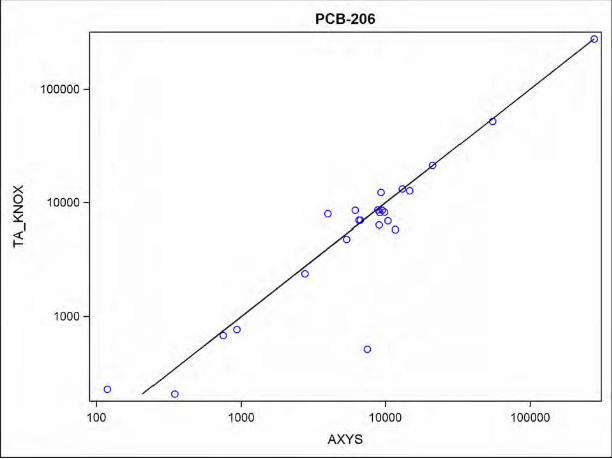
described above, bias would be indicated for both PAHs and PCBs. Agreement plots for each PAH and PCB analyte are presented in Attachments 1 and 2 respectively. Each point represents a sample plotted with respect to the concentration reported by each laboratory. The 1:1 line on the plot represents the line of perfect agreement. If the labs agree the points should generally fall along this line. Bias is indicated when most points fall above or below the 1:1 line. For PAHs, each result pair is identified by the AXYS method revision used.
A second report from CSC (2011) proposes correction factors be applied to the CAS dioxin/furan data set and concludes that the error introduced by applying a correction factor “would only be slight compared to an uncorrected result without the low bias.” The correction factors were calculated as the geometric mean AXYS/CAS ratios (results below quantitation limit excluded) and are to be multiplied by CAS dioxin/furan results above the quantitation limit. They range from 1.099 to 1.887 (median = 1.408). Using the same methodology, Arcadis has calculated similar correction factors for PAH and PCB data. PAH correction factors range from 1.21 to 9.11, with a median value of 1.52 (Table 4), not unlike the ranges reported for dioxin/furan congeners (CSC, 2011). For the ten PCB homologue groups, correction factors range from 1.08 to 1.75 with a median value of 1.26. Five of the ten correction factors are significantly greater than 1.0 (Table 5). Correction factors for PCB congeners range from 0.63 to 2.25 with a median value of 1.24 (Table 5). However, 118 of the 127 congeners have correction factors greater than 1.0, 50 significantly so. Of the eight congeners that have calculated correction factors less than or equal to 1.0, none are significantly less than 1.0 (i.e. all of the confidence intervals include 1). One congener has a calculated correction factor equal to 1, however this is based on only one sample pair.
The objective of this analysis of PAH and PCB split data is not to propose that correction factors be applied to TA KNOX results but to shed light on the fact that the geometric mean ratios of two other classes of chemicals, independent of the dioxin/furan analyses and independent of the CAS laboratory, point to bias when similar logic is applied. Split sample results for all constituents should be handled in a consistent manner and correction factors should not arbitrarily be applied to only one group of analytes.

c:\documents and settings\cliff\my documents\projects\prrp\reports\lrc data summary rept\epa oversight report\pcb-pah issue\20110726 pcb-pah splits analysis.docx 4
Development of Correction Factors for Split Samples Using the Approach Developed by CSC Analytical PCBs and PAHs
CPG Low Resolution Coring Program Sediment Chemistry Data
References
CSC, 2010. Report on Suspected Causes of Disparities between the Results Produced by Columbia Analytical Services and AXYS Analytical Services in Analysis of Lower Passaic River Sediment Split Samples for Chlorinated Dibenzo-p-Dioxins and Dibenzofurans, and Development of a Conversion Factor to Adjust Results between the Two Laboratories, CSC Environmental Solutions and Interface, Inc., March 2010.
CSC, 2011. The Effect of Application of a Correction Factor on Chlorinated Dibenzo-p-Dioxins and Dibenzofurans Results Produced by Columbia Analytical Services for Lower Passaic River Sediment Samples, January 2011.

c:\documents and settings\cliff\my documents\projects\prrp\reports\lrc data summary rept\epa oversight report\pcb-pah issue\20110726 pcb-pah splits analysis.docx 5
Table 1. Geometric Means of 2008 Lower Passaic River TA KNOX/AXYS Ratios and Associated Confidence Intervals for PAHs
Polycyclic Aromatic Hydrocarbons Number of Pairs
Geometric Mean of Ratios
TA KNOX/AXYS
95% Confidence Limits
Upper Lower 1-Methylnaphthalene 19 0.67 0.87 0.52 1-Methylphenanthrene 25 0.77 1.11 0.53 2,3,5-Trimethylnaphthalene 19 0.45 0.66 0.30 2,6-Dimethylnaphthalene 20 0.57 0.82 0.40 2-Methylnaphthalene 23 0.82 1.09 0.61 Acenaphthene 25 0.66 0.93 0.47 Acenaphthylene 23 0.62 0.81 0.48 Anthracene 26 0.78 1.24 0.49 Benzo(a)anthracene 26 0.65 0.98 0.43 Benzo(a)pyrene 26 0.64 0.99 0.42 Benzo(b)fluoranthene 26 0.76 1.20 0.49 Benzo(E)pyrene 26 0.67 1.02 0.44 Benzo(g,h,i)perylene 26 0.62 0.94 0.40 Benzo(k)fluoranthene 26 0.58 0.89 0.38 C1-Phenanthrene/anthracenes 28 0.69 1.09 0.44 C2-NAPHTHALENES 27 0.54 0.80 0.36 C2-Phenanthrene/anthracenes 28 0.67 1.09 0.41 C3-NAPHTHALENE 26 0.56 0.85 0.37 C3-Phenanthrene/anthracenes 27 0.61 0.95 0.39 C4-NAPHTHALENE 22 0.43 0.66 0.27 C4-Phenanthrenes/anthracenes 27 0.11 0.18 0.07 Chrysene 26 0.68 1.03 0.45 Dibenzo(a,h)anthracene 25 0.72 0.92 0.56 Dibenzothiophene 20 0.69 1.08 0.44 Fluoranthene 26 0.51 0.74 0.36 Fluorene 23 0.82 1.29 0.53 Indeno(1,2,3-cd)pyrene 26 0.62 0.94 0.41 Naphthalene 23 0.81 0.97 0.68 Perylene 27 0.67 0.995 0.45 Phenanthrene 25 0.79 1.22 0.51 Pyrene 26 0.59 0.83 0.42
Median 0.66 Notes: Light shading indicates ratio is less than 1.0. Dark shading indicates ratio is significantly less than 1.0 (i.e., confidence interval does not include 1.0). All result values reported as below the corresponding laboratory’s quantitation limit were excluded from calculations. TA KNOX results include only the methodology ID-0016.
c:\documents and settings\cliff\my documents\projects\prrp\reports\lrc data summary rept\epa oversight report\pcb-pah issue\20110726 pcb-pah splits analysis.docx 6
Table 2. Geometric Means of 2008 Lower Passaic River TA KNOX/AXYS Ratios and Associated Confidence Intervals for PAHs by AXYS Method MLA-021 Revision
Analyte
MLA-021 Rev 8 MLA-021 Rev 9
N
Geometric Mean of Ratios
TA KNOX/AXYS (95%LCL, UCL) N
Geometric Mean of Ratios
TA KNOX/AXYS (95%LCL, UCL)
1-Methylnaphthalene 11 0.78 (0.56, 1.08) 8 0.55 (0.35, 0.87) 1-Methylphenanthrene 15 0.83 (0.46, 1.51) 10 0.69 (0.49, 0.97) 2,3,5-Trimethylnaphthalene 12 0.47 (0.25, 0.89) 7 0.4 (0.26, 0.64) 2,6-Dimethylnaphthalene 10 0.6 (0.31, 1.14) 10 0.55 (0.35, 0.86) 2-Methylnaphthalene 13 0.88 (0.61, 1.28) 10 0.74 (0.43, 1.27) Acenaphthene 15 0.8 (0.49, 1.33) 10 0.48 (0.31, 0.76) Acenaphthylene 13 0.77 (0.55, 1.07) 10 0.48 (0.31, 0.74) Anthracene 16 0.94 (0.45, 1.94) 10 0.58 (0.38, 0.89) Benzo(a)anthracene 16 0.71 (0.37, 1.4) 10 0.55 (0.39, 0.78) Benzo(a)pyrene 16 0.7 (0.35, 1.41) 10 0.56 (0.39, 0.8) Benzo(b)fluoranthene 16 0.91 (0.45, 1.84) 10 0.58 (0.38, 0.9) Benzo(E)pyrene 16 0.76 (0.39, 1.48) 10 0.55 (0.38, 0.8) Benzo(g,h,i)perylene 16 0.68 (0.34, 1.35) 10 0.53 (0.37, 0.76) Benzo(k)fluoranthene 16 0.58 (0.29, 1.17) 10 0.59 (0.42, 0.83) C1-Phenanthrene/anthracenes 16 0.76 (0.37, 1.56) 12 0.61 (0.34, 1.09) C2-NAPHTHALENES 16 0.6 (0.33, 1.07) 11 0.46 (0.26, 0.83) C2-Phenanthrene/anthracenes 16 0.71 (0.36, 1.41) 12 0.62 (0.28, 1.37) C3-NAPHTHALENE 16 0.69 (0.36, 1.33) 10 0.4 (0.27, 0.6) C3-Phenanthrene/anthracenes 16 0.63 (0.33, 1.22) 11 0.58 (0.3, 1.14) C4-NAPHTHALENE 12 0.5 (0.23, 1.12) 10 0.35 (0.23, 0.53) C4-Phenanthrenes/anthracenes 16 0.07 (0.04, 0.13) 11 0.2 (0.09, 0.48) Chrysene 16 0.75 (0.39, 1.47) 10 0.57 (0.4, 0.82) Dibenzo(a,h)anthracene 15 0.86 (0.62, 1.19) 10 0.55 (0.37, 0.81) Dibenzothiophene 12 0.7 (0.33, 1.5) 8 0.67 (0.44, 1.03) Fluoranthene 16 0.54 (0.31, 0.95) 10 0.47 (0.31, 0.71) Fluorene 14 0.93 (0.46, 1.9) 9 0.68 (0.44, 1.08) Indeno(1,2,3-cd)pyrene 16 0.69 (0.35, 1.34) 10 0.53 (0.37, 0.76) Naphthalene 13 0.95 (0.76, 1.18) 10 0.66 (0.5, 0.88) Perylene 16 0.93 (0.57, 1.52) 11 0.42 (0.22, 0.78) Phenanthrene 15 0.93 (0.46, 1.91) 10 0.61 (0.43, 0.88) Pyrene 16 0.67 (0.41, 1.12) 10 0.48 (0.32, 0.73) Median 0.71 0.55 Notes: Light shading indicates ratio is less than 1.0. Dark shading indicates ratio is significantly less than 1.0 (i.e., confidence interval does not include 1.0). N = number of pairs per method revision.

c:\documents and settings\cliff\my documents\projects\prrp\reports\lrc data summary rept\epa oversight report\pcb-pah issue\20110726 pcb-pah splits analysis.docx 7
Table 3. Geometric Means of 2008 Lower Passaic River TA KNOX/AXYS Ratios and Associated Confidence Intervals for Polychlorinated Biphenyls
Polychlorinated Biphenyls Number of Pairs
Geometric Mean of Ratios
TA_KNOX/AXYS 95% Confidence Limits Upper Lower
Monochlorobiphenyl 20 0.57 0.72 0.45 Dichlorobiphenyl 24 0.69 0.80 0.59 Trichlorobiphenyl 25 0.78 0.91 0.66 Tetrachlorobiphenyl 26 0.81 0.97 0.67 Pentachlorobiphenyl 26 0.79 0.99 0.63 Hexachlorobiphenyl 26 0.82 1.02 0.66 Heptachlorobiphenyl 24 0.83 1.10 0.64 Octachlorobiphenyl 24 0.78 1.06 0.57 Nonachlorobiphenyl 24 0.81 1.04 0.62 Decachlorobiphenyl (PCB-209) 24 0.92 1.08 0.79
MEDIAN (Homologue Groups) 0.80 PCB-1 20 0.56 0.71 0.44 PCB-2 10 0.66 0.77 0.57 PCB-3 16 0.53 0.66 0.43 PCB-4 21 0.71 0.89 0.56 PCB-5 5 0.68 0.92 0.51 PCB-6 20 0.81 0.92 0.71 PCB-7 13 0.76 1.04 0.56 PCB-8 23 0.83 0.99 0.70 PCB-9 14 0.86 0.95 0.77 PCB-10 6 0.73 1.65 0.33 PCB-11 21 0.69 0.74 0.64 PCB-12 / PCB-13 20 0.65 0.73 0.58 PCB-15 23 0.62 0.71 0.53 PCB-16 23 0.84 1.02 0.69 PCB-17 23 0.86 1.04 0.71 PCB-18 / PCB-30 22 0.94 1.15 0.77 PCB-19 21 0.76 0.93 0.62 PCB-20 / PCB-28 23 0.77 0.91 0.65 PCB-21 / PCB-33 24 0.91 1.34 0.61 PCB-22 23 0.68 0.81 0.57 PCB-24 9 0.88 1.54 0.50 PCB-25 21 0.81 0.94 0.69 PCB-26 / PCB-29 22 0.74 0.87 0.63 PCB-27 21 0.85 1.03 0.70 PCB-31 23 0.79 0.95 0.66 PCB-32 23 0.84 0.99 0.70

c:\documents and settings\cliff\my documents\projects\prrp\reports\lrc data summary rept\epa oversight report\pcb-pah issue\20110726 pcb-pah splits analysis.docx 8
Polychlorinated Biphenyls Number of Pairs
Geometric Mean of Ratios
TA_KNOX/AXYS 95% Confidence Limits Upper Lower
PCB-34 4 0.68 1.03 0.45 PCB-35 17 0.63 0.77 0.51 PCB-37 23 0.68 0.80 0.58 PCB-39 6 0.65 0.84 0.50 PCB-40 / PCB-41 / PCB-71 24 0.83 0.96 0.72 PCB-42 22 0.88 1.05 0.75 PCB-44 / PCB-47 / PCB-65 25 0.85 1.03 0.70 PCB-45 / PCB-51 21 0.87 1.04 0.73 PCB-46 21 0.85 0.99 0.72 PCB-48 22 0.84 1.01 0.70 PCB-49 / PCB-69 24 0.88 1.06 0.74 PCB-50 / PCB-53 21 0.80 0.94 0.68 PCB-52 25 0.87 1.08 0.70 PCB-54 8 0.76 0.85 0.69 PCB-55 16 1.04 1.55 0.70 PCB-56 22 0.76 0.94 0.62 PCB-57 6 0.83 1.03 0.68 PCB-58 4 0.83 1.35 0.52 PCB-59 / PCB-62 / PCB-75 21 0.83 0.97 0.71 PCB-60 22 0.78 0.98 0.62 PCB-61 / PCB-70 / PCB-74 / PCB-76 24 0.80 1.01 0.64 PCB-63 20 0.73 0.90 0.59 PCB-64 23 0.82 0.99 0.68 PCB-66 25 0.82 0.99 0.69 PCB-67 19 0.81 0.98 0.66 PCB-68 8 0.88 1.08 0.72 PCB-72 13 0.87 1.06 0.72 PCB-77 21 0.68 0.82 0.57 PCB-79 8 0.44 0.98 0.20 PCB-82 22 0.87 1.12 0.68 PCB-83 / PCB-99 24 0.84 1.08 0.65 PCB-84 22 0.79 1.03 0.60 PCB-85 / PCB-116 / PCB-117 23 0.78 1.01 0.61 PCB-86 / PCB-87 / PCB-97 / PCB-119 / PCB-125
24 0.83 1.06 0.64
PCB-88 / PCB-91 23 0.79 0.999 0.62 PCB-89 12 0.67 1.02 0.44 PCB-90 / PCB-101 / PCB-113 24 0.83 1.06 0.65 PCB-92 23 0.77 0.98 0.60
c:\documents and settings\cliff\my documents\projects\prrp\reports\lrc data summary rept\epa oversight report\pcb-pah issue\20110726 pcb-pah splits analysis.docx 9
Polychlorinated Biphenyls Number of Pairs
Geometric Mean of Ratios
TA_KNOX/AXYS 95% Confidence Limits Upper Lower
PCB-94 11 0.59 0.94 0.37 PCB-96 11 0.69 1.08 0.44 PCB-103 14 0.74 1.09 0.50 PCB-104 5 0.74 1.85 0.29 PCB-105 23 0.76 0.98 0.59 PCB-110 / PCB-115 24 0.87 1.11 0.68 PCB-114 18 0.79 1.10 0.57 PCB-118 23 0.82 1.06 0.64 PCB-120 2 1.08 1.57 0.73 PCB-122 13 0.94 1.46 0.60 PCB-123 14 0.72 1.11 0.46 PCB-128 / PCB-166 23 0.94 1.26 0.71 PCB-129 / PCB-138 / PCB-160 / PCB-163
24 0.90 1.13 0.72
PCB-130 21 0.83 1.06 0.65 PCB-131 10 0.76 1.34 0.43 PCB-132 24 0.83 1.03 0.67 PCB-133 16 0.82 1.13 0.60 PCB-134 / PCB-143 21 0.92 1.18 0.72 PCB-136 24 0.77 0.98 0.61 PCB-137 21 0.80 1.05 0.62 PCB-139 / PCB-140 16 0.79 1.14 0.56 PCB-141 24 0.92 1.14 0.74 PCB-144 21 0.71 0.93 0.54 PCB-146 24 0.88 1.09 0.72 PCB-147 / PCB-149 24 0.88 1.10 0.70 PCB-148 3 1.26 11.74 0.14 PCB-150 4 1.05 4.08 0.27 PCB-152 3 1.60 25.08 0.10 PCB-153 / PCB-168 24 0.87 1.08 0.69 PCB-155 10 0.73 0.99 0.54 PCB-156 / PCB-157 23 0.75 0.96 0.59 PCB-158 23 0.88 1.11 0.70 PCB-159 7 0.56 1.48 0.22 PCB-162 1 1.16 NA NA PCB-164 21 0.86 1.11 0.67 PCB-167 21 0.70 0.91 0.53 PCB-170 24 0.90 1.17 0.70 PCB-171 / PCB-173 22 0.81 1.08 0.60

c:\documents and settings\cliff\my documents\projects\prrp\reports\lrc data summary rept\epa oversight report\pcb-pah issue\20110726 pcb-pah splits analysis.docx 10
Polychlorinated Biphenyls Number of Pairs
Geometric Mean of Ratios
TA_KNOX/AXYS 95% Confidence Limits Upper Lower
PCB-172 23 0.80 1.07 0.60 PCB-174 24 0.84 1.10 0.65 PCB-175 10 0.69 1.40 0.34 PCB-176 23 0.79 1.05 0.59 PCB-177 24 0.81 1.06 0.62 PCB-178 23 0.80 1.08 0.59 PCB-179 24 0.88 1.15 0.67 PCB-180 / PCB-193 24 0.86 1.14 0.65 PCB-182 1 1.02 NA NA PCB-183 / PCB-185 24 0.82 1.09 0.61 PCB-184 1 1.00 NA NA PCB-187 24 0.80 1.05 0.60 PCB-189 8 0.74 1.83 0.30 PCB-190 23 0.78 1.04 0.58 PCB-191 9 0.81 1.79 0.36 PCB-194 24 0.87 1.17 0.65 PCB-195 23 0.86 1.18 0.62 PCB-196 23 0.72 1.005 0.51 PCB-198 / PCB-199 24 0.77 1.04 0.57 PCB-202 24 0.75 0.98 0.58 PCB-203 24 0.74 1.02 0.54 PCB-205 8 1.10 1.97 0.61 PCB-206 24 0.86 1.11 0.66 PCB-207 12 0.68 1.24 0.37 PCB-208 20 0.71 0.95 0.53
Median (Congeners) 0.81 Notes: Light shading indicates ratio is less than 1.0. Dark shading indicates ratio is significantly less than 1.0 (i.e., confidence interval does not include 1.0). All result values reported as below the corresponding laboratory’s quantitation limit were excluded from calculations. Co-elutions that differed among laboratories were excluded as they are not comparable.

c:\documents and settings\cliff\my documents\projects\prrp\reports\lrc data summary rept\epa oversight report\pcb-pah issue\20110726 pcb-pah splits analysis.docx 11
Table 4. Correction Factors for Polycyclic Aromatic Hydrocarbon Data if Calculated by Methodology in CSC Report for Dioxin Congeners
Polycyclic Aromatic Hydrocarbons N
Correction Factor*: Geometric Mean
of Ratio AXYS/TA KNOX
95% Confidence Limits
Lower Upper 1-Methylnaphthalene 19 1.49 1.16 1.92 1-Methylphenanthrene 25 1.30 0.90 1.87 2,3,5-Trimethylnaphthalene 19 2.24 1.50 3.33 2,6-Dimethylnaphthalene 20 1.75 1.22 2.50 2-Methylnaphthalene 23 1.22 0.92 1.64 Acenaphthene 25 1.52 1.08 2.15 Acenaphthylene 23 1.60 1.23 2.09 Anthracene 26 1.28 0.81 2.03 Benzo(a)anthracene 26 1.54 1.02 2.34 Benzo(a)pyrene 26 1.56 1.01 2.39 Benzo(b)fluoranthene 26 1.31 0.83 2.05 Benzo(E)pyrene 26 1.49 0.98 2.26 Benzo(g,h,i)perylene 26 1.62 1.06 2.48 Benzo(k)fluoranthene 26 1.71 1.12 2.62 C1-Phenanthrene/anthracenes 28 1.45 0.92 2.28 C2-NAPHTHALENES 27 1.86 1.25 2.76 C2-Phenanthrene/anthracenes 28 1.50 0.92 2.44 C3-NAPHTHALENE 26 1.79 1.17 2.73 C3-Phenanthrene/anthracenes 27 1.63 1.05 2.54 C4-NAPHTHALENE 22 2.34 1.51 3.65 C4-Phenanthrenes/anthracenes 27 9.11 5.52 15.04 Chrysene 26 1.47 0.97 2.23 Dibenzo(a,h)anthracene 25 1.39 1.08 1.79 Dibenzothiophene 20 1.45 0.92 2.27 Fluoranthene 26 1.95 1.36 2.79 Fluorene 23 1.21 0.78 1.89 Indeno(1,2,3-cd)pyrene 26 1.60 1.06 2.42 Naphthalene 23 1.23 1.03 1.47 Perylene 27 1.49 1.00 2.21 Phenanthrene 25 1.27 0.82 1.96 Pyrene 26 1.69 1.21 2.37
Median 1.52 *Correction factors calculated using the same method as for dioxin/furan congeners in CSC, 2011. Light shading indicates correction factor is greater than 1.0. Dark shading indicates correction factor is significantly greater than 1.0 (i.e., confidence interval does not include 1.0).
c:\documents and settings\cliff\my documents\projects\prrp\reports\lrc data summary rept\epa oversight report\pcb-pah issue\20110726 pcb-pah splits analysis.docx 12
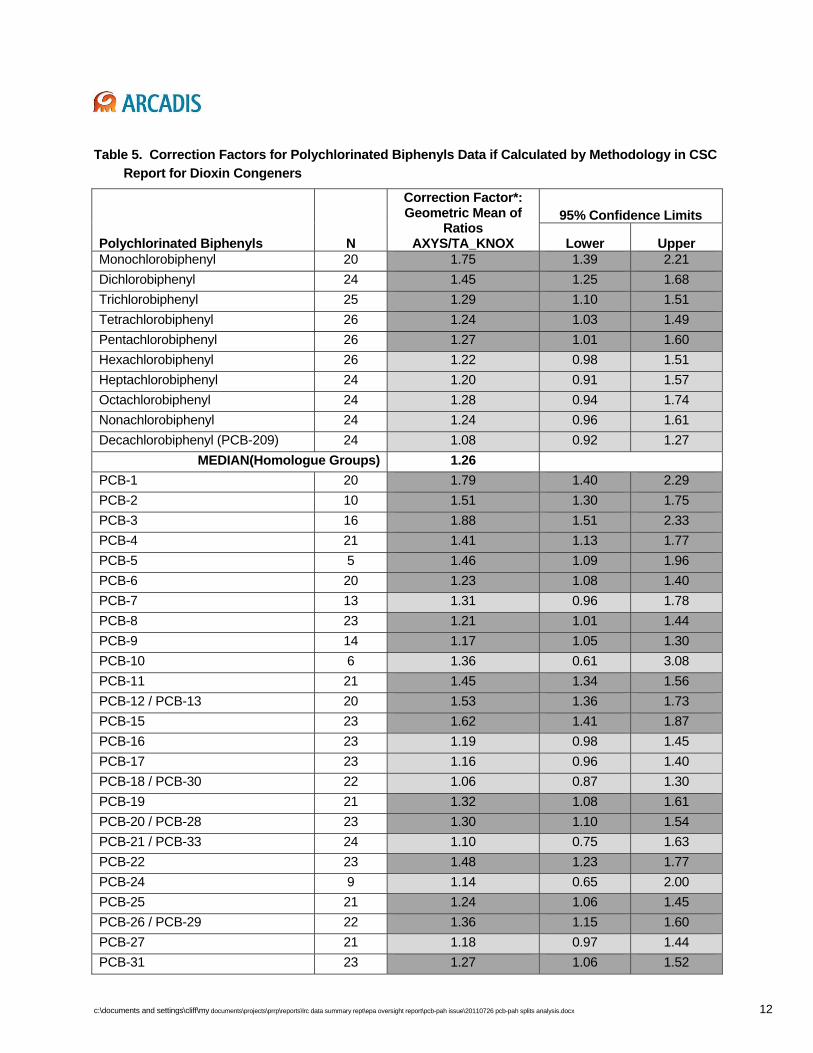
Table 5. Correction Factors for Polychlorinated Biphenyls Data if Calculated by Methodology in CSC Report for Dioxin Congeners
Polychlorinated Biphenyls N
Correction Factor*: Geometric Mean of
Ratios AXYS/TA_KNOX
95% Confidence Limits
Lower Upper Monochlorobiphenyl 20 1.75 1.39 2.21 Dichlorobiphenyl 24 1.45 1.25 1.68 Trichlorobiphenyl 25 1.29 1.10 1.51 Tetrachlorobiphenyl 26 1.24 1.03 1.49 Pentachlorobiphenyl 26 1.27 1.01 1.60 Hexachlorobiphenyl 26 1.22 0.98 1.51 Heptachlorobiphenyl 24 1.20 0.91 1.57 Octachlorobiphenyl 24 1.28 0.94 1.74 Nonachlorobiphenyl 24 1.24 0.96 1.61 Decachlorobiphenyl (PCB-209) 24 1.08 0.92 1.27
MEDIAN(Homologue Groups) 1.26 PCB-1 20 1.79 1.40 2.29 PCB-2 10 1.51 1.30 1.75 PCB-3 16 1.88 1.51 2.33 PCB-4 21 1.41 1.13 1.77 PCB-5 5 1.46 1.09 1.96 PCB-6 20 1.23 1.08 1.40 PCB-7 13 1.31 0.96 1.78 PCB-8 23 1.21 1.01 1.44 PCB-9 14 1.17 1.05 1.30 PCB-10 6 1.36 0.61 3.08 PCB-11 21 1.45 1.34 1.56 PCB-12 / PCB-13 20 1.53 1.36 1.73 PCB-15 23 1.62 1.41 1.87 PCB-16 23 1.19 0.98 1.45 PCB-17 23 1.16 0.96 1.40 PCB-18 / PCB-30 22 1.06 0.87 1.30 PCB-19 21 1.32 1.08 1.61 PCB-20 / PCB-28 23 1.30 1.10 1.54 PCB-21 / PCB-33 24 1.10 0.75 1.63 PCB-22 23 1.48 1.23 1.77 PCB-24 9 1.14 0.65 2.00 PCB-25 21 1.24 1.06 1.45 PCB-26 / PCB-29 22 1.36 1.15 1.60 PCB-27 21 1.18 0.97 1.44 PCB-31 23 1.27 1.06 1.52

c:\documents and settings\cliff\my documents\projects\prrp\reports\lrc data summary rept\epa oversight report\pcb-pah issue\20110726 pcb-pah splits analysis.docx 13
Polychlorinated Biphenyls N
Correction Factor*: Geometric Mean of
Ratios AXYS/TA_KNOX
95% Confidence Limits
Lower Upper PCB-32 23 1.20 1.01 1.42 PCB-34 4 1.46 0.97 2.20 PCB-35 17 1.59 1.31 1.95 PCB-37 23 1.46 1.24 1.72 PCB-39 6 1.55 1.19 2.00 PCB-40 / PCB-41 / PCB-71 24 1.20 1.04 1.40 PCB-42 22 1.13 0.96 1.34 PCB-44 / PCB-47 / PCB-65 25 1.18 0.97 1.43 PCB-45 / PCB-51 21 1.14 0.96 1.36 PCB-46 21 1.18 1.01 1.38 PCB-48 22 1.19 0.99 1.43 PCB-49 / PCB-69 24 1.13 0.94 1.36 PCB-50 / PCB-53 21 1.25 1.06 1.46 PCB-52 25 1.15 0.92 1.44 PCB-54 8 1.31 1.18 1.46 PCB-55 16 0.96 0.65 1.42 PCB-56 22 1.32 1.07 1.62 PCB-57 6 1.20 0.97 1.48 PCB-58 4 1.20 0.74 1.94 PCB-59 / PCB-62 / PCB-75 21 1.21 1.04 1.40 PCB-60 22 1.28 1.02 1.61 PCB-61 / PCB-70 / PCB-74 / PCB-76
24 1.25 0.99 1.57
PCB-63 20 1.38 1.11 1.71 PCB-64 23 1.21 1.01 1.46 PCB-66 25 1.21 1.01 1.45 PCB-67 19 1.24 1.02 1.51 PCB-68 8 1.13 0.92 1.39 PCB-72 13 1.15 0.94 1.39 PCB-77 21 1.46 1.22 1.76 PCB-79 8 2.25 1.02 4.97 PCB-82 22 1.15 0.89 1.48 PCB-83 / PCB-99 24 1.20 0.93 1.54 PCB-84 22 1.27 0.97 1.67 PCB-85 / PCB-116 / PCB-117 23 1.28 0.99 1.65 PCB-86 / PCB-87 / PCB-97 / PCB-119 / PCB-125
24 1.21 0.94 1.56
PCB-88 / PCB-91 23 1.27 1.001 1.62 PCB-89 12 1.50 0.98 2.29

c:\documents and settings\cliff\my documents\projects\prrp\reports\lrc data summary rept\epa oversight report\pcb-pah issue\20110726 pcb-pah splits analysis.docx 14
Polychlorinated Biphenyls N
Correction Factor*: Geometric Mean of
Ratios AXYS/TA_KNOX
95% Confidence Limits
Lower Upper PCB-90 / PCB-101 / PCB-113 24 1.21 0.95 1.55 PCB-92 23 1.31 1.02 1.68 PCB-94 11 1.69 1.07 2.67 PCB-96 11 1.46 0.93 2.29 PCB-103 14 1.35 0.92 2.00 PCB-104 5 1.36 0.54 3.40 PCB-105 23 1.32 1.02 1.69 PCB-110 / PCB-115 24 1.15 0.90 1.46 PCB-114 18 1.27 0.91 1.76 PCB-118 23 1.22 0.94 1.57 PCB-120 2 0.93 0.64 1.36 PCB-122 13 1.07 0.69 1.66 PCB-123 14 1.40 0.90 2.16 PCB-128 / PCB-166 23 1.06 0.79 1.42 PCB-129 / PCB-138 / PCB-160 / PCB-163
24 1.11 0.89 1.38
PCB-130 21 1.20 0.94 1.53 PCB-131 10 1.31 0.75 2.31 PCB-132 24 1.21 0.97 1.50 PCB-133 16 1.22 0.89 1.67 PCB-134 / PCB-143 21 1.08 0.84 1.39 PCB-136 24 1.29 1.02 1.63 PCB-137 21 1.24 0.95 1.62 PCB-139 / PCB-140 16 1.26 0.88 1.80 PCB-141 24 1.09 0.88 1.34 PCB-144 21 1.41 1.08 1.85 PCB-146 24 1.13 0.92 1.40 PCB-147 / PCB-149 24 1.14 0.91 1.43 PCB-148 3 0.79 0.09 7.34 PCB-150 4 0.95 0.25 3.71 PCB-152 3 0.63 0.04 9.83 PCB-153 / PCB-168 24 1.16 0.93 1.44 PCB-155 10 1.37 1.02 1.84 PCB-156 / PCB-157 23 1.34 1.05 1.71 PCB-158 23 1.13 0.90 1.43 PCB-159 7 1.77 0.68 4.65 PCB-162 1 0.87 NA NA PCB-164 21 1.16 0.90 1.48 PCB-167 21 1.43 1.10 1.87

c:\documents and settings\cliff\my documents\projects\prrp\reports\lrc data summary rept\epa oversight report\pcb-pah issue\20110726 pcb-pah splits analysis.docx 15
Polychlorinated Biphenyls N
Correction Factor*: Geometric Mean of
Ratios AXYS/TA_KNOX
95% Confidence Limits
Lower Upper PCB-170 24 1.11 0.85 1.44 PCB-171 / PCB-173 22 1.24 0.93 1.66 PCB-172 23 1.24 0.93 1.66 PCB-174 24 1.19 0.91 1.55 PCB-175 10 1.44 0.71 2.93 PCB-176 23 1.27 0.95 1.69 PCB-177 24 1.24 0.95 1.61 PCB-178 23 1.25 0.93 1.68 PCB-179 24 1.14 0.87 1.49 PCB-180 / PCB-193 24 1.17 0.88 1.55 PCB-182 1 0.98 NA NA PCB-183 / PCB-185 24 1.23 0.92 1.64 PCB-184 1 1.00 NA NA PCB-187 24 1.25 0.95 1.65 PCB-189 8 1.36 0.55 3.37 PCB-190 23 1.28 0.96 1.71 PCB-191 9 1.24 0.56 2.75 PCB-194 24 1.15 0.85 1.54 PCB-195 23 1.17 0.85 1.60 PCB-196 23 1.39 0.995 1.94 PCB-198 / PCB-199 24 1.30 0.96 1.77 PCB-202 24 1.33 1.02 1.72 PCB-203 24 1.35 0.98 1.85 PCB-205 8 0.91 0.51 1.64 PCB-206 24 1.17 0.90 1.52 PCB-207 12 1.47 0.81 2.69 PCB-208 20 1.41 1.06 1.88
Median (Congeners) 1.24 *Correction factors calculated using the same method as for dioxin/furan congeners in CSC, 2011. Light shading indicates correction factor is greater than 1.0. Dark shading indicates correction factor is significantly greater than 1.0 (i.e., confidence interval does not include 1.0).

Attachment 1
Log PAH Agreement Plots by Laboratory

100000
10000
X 0 z :.:: ~I f-'
1000
100
10
10 100
1-Methylnaphthalene
+ 0
1000
AXYS
10000 100000
I Method o tv<YS METHOD Ml.P.-021 Rev 09 + tv<YS METHOD Ml.A-021 Rev 08 I
100000
10000
6 z :.:: ~I f-' 1 000
100
1-Methylphenanthrene
100 1000 10000 100000
AXYS
I Method o tv<YS METHOD Ml.P.-021 Rev 09 + tv<YS METHOD Ml.A-021 Rev 08 I

10000
1000
X 0 z :.:: ~I f-'
100
10
10
+
+
100
2,3,5-Trimethylnaphthalene
:t
+
0
+ + 0
8 0 0
+
1000
AXYS
~
+
+
10000
I Method o tv<YS METHOD Ml.A-021 Rev 09 + tv<YS METHOD Ml.A-021 Rev 08 I
100000

10000
6 1000 z :.:: ~I f-'
100
10
10
0
0
0
100
2,6-Dimethylnaphthalene
0
1000
AXYS
+
+
+
10000 100000
I Method o tv<YS METHOD Ml.A-021 Rev 09 + tv<YS METHOD Ml.A-021 Rev 08 I

6 z :.::
100000
10000
~I 1000 f-'
100
10
10
+
100
2-Methylnaphthalene
1000
AXYS
10000 100000
I Method o tv<YS METHOD Ml.P.-021 Rev 09 + tv<YS METHOD Ml.A-021 Rev 08 I
+

6 z :.::
100000
10000
~I 1000 f-'
100
10
10
0
100
Acenaphthene
1000
AXYS
10000 100000
I Method o tv<YS METHOD Ml.P.-021 Rev 09 + tv<YS METHOD Ml.A-021 Rev 08 I
10000
6 2 1000 ~I f-'
100
0
100
Acenaphthylene
1000
AXYS
+
10000
I Method o tv<YS METHOD ML.A-021 Rev 09 + tv<YS METHOD Ml.A-021 Rev 08 I
+

Anthracene +
100000
10000 0
X 0 z :.:: ~I f-'
1000
+
100
+
100 1000 10000 100000
AXYS
I Method o tv<YS METHOD Ml.P.-021 Rev 09 + tv<YS METHOD Ml.A-021 Rev 08 I

Benzo(E)pyrene 100000
+
+ 10000
X 0 z :.:: ~I f-' 1000
+
100
+
100 1(00 10000 100000
AXYS
I Method o p;xys METHOD MLA-J21 Rev 09 + p;xys METHOD Ml.A-021 Rev oal

Benzo(a)anthracene
100000
+
10000
X 0 z :.:: + ~I f-'
1000
100
+
100 1000 10000 100000
AXYS
I Method o tv<YS METHOD Ml.P.-021 Rev 09 + tv<YS METHOD Ml.A-021 Rev 08 I
Benzo(a)pyrene
100000 +
+
10000
X 0 + z :.:: ~I f-' 1000
100
+
100 1000 10000 100000
AXYS
I Method o tv<YS METHOD ML.A-021 Rev 09 + tv<YS METHOD Ml.A-021 Rev 08 I

Benzo(b )fluoranthene 100000
+
10000
1000
100
+
100 1000 10000 100000
AXYS
I Method o p;xys METHOD MLA-J21 Rev 09 + p;xys METHOD Ml.A-021 Rev oal
10000
6 1000 z :.:: ~I f-'
100
10
10 100
Benzo(g,h,i)perylene
1000
AXYS
+
10000
I Method o tv<YS METHOD ML.A-021 Rev 09 + tv<YS METHOD Ml.A-021 Rev 08 I

100000
10000
1000
100
+
100
Benzo(k)fluoranthene
+ cP +
0
1000
AXYS
+
+
+
10000 100000
I Method o p;xys METHOD MLA-J21 Rev 09 + p;xys METHOD Ml.A-021 Rev oal

6 z :.::
1 E6
1 E5
1 E4
~~ 1E3 f-'
1 E2
1 E1 0
1 EO
0
1 E1
C1-Phenanthrene/anthracenes
1 E2 1 E3
AXYS
1 E4
+
+
1 E5
I Method o tv<YS METHOD Ml.A-021 Rev 09 + tv<YS METHOD Ml.A-021 Rev 08 I
+
1 E6

C2-NAPHTHALENES 1 E6
1 E5 +
1 E4
1 E3
1 E2
1 E1 ° L----,---------.---------.--------.---------.---------~
1 E1 1 E2 1E3 1 E4 1 E5 1 E6
AXYS
I Method o tv<YS METHOD Ml.A-021 Rev 09 + tv<YS METHOD Ml.A-021 Rev 08 I

100000
10000
X 0 z :.:: 1000 ~I f-'
100
0
10
0
10
C2-Phenanthrene/anthracenes
100 1000
AXYS
10000
+
100000
I Method o tv<YS METHOD Ml.P.-021 Rev 09 + tv<YS METHOD Ml.A-021 Rev 08 I

C3-NAPHTHALENE +
100000 +
10000 01-X 0 z :.:: ~I f-'
1000
100 +
0
100 1000 10000 100000
AXYS
I Method o tv<YS METHOD Ml.P.-021 Rev 09 + tv<YS METHOD Ml.A-021 Rev 08 I

100000
10000
1000
100
0 10
10
C3-Phenanthrene/anthracenes
100 1000
AXYS
+
+
+
10000 100000
I Method o tv<YS METHOD Ml.P.-021 Rev 09 + tv<YS METHOD Ml.A-021 Rev 08 I

C4-NAPHTHALENE 100000 +
+
10000 0+
X 0 z :.:: ~I f-' 1000
100
0
100 1000 10000 100000
AXYS
I Method o p;xys METHOD MI.JI-021 Rev 09 + p;xys METHOD Ml.A-021 Rev oa I

10000
1000
100
0
10
10
C4-Phenanthrenes/anthracenes
+
100
0
1000
AXYS
+
0 0 0
+ 0
0 + 0 + +
+
+
10000
+
100000
I Method o tv<YS METHOD ML.A-021 Rev 09 + tv<YS METHOD Ml.A-021 Rev 08 I
+

Chrysene
100000
10000
1000
100 +
100 1000 10000 100000
AXYS
I Method o tv<YS METHOD Ml.P.-021 Rev 09 + tv<YS METHOD Ml.A-021 Rev 08 I

10000
1000
+
100
0
100
Dibenzo(a,h)anthracene
+
1000
AXYS
+
10000
I Method o tv<YS METHOD ML.A-021 Rev 09 + tv<YS METHOD Ml.A-021 Rev 08 I
+

10000
1000
100
10
10
0
100
Dibenzothiophene
1000
AXYS
+
10000
I Method o tv<YS METHOD ML.A-021 Rev 09 + tv<YS METHOD Ml.A-021 Rev 08 I
+
Fluoranthene
100000
+
10000 8 X 0 z :.:: ~I f-'
1000
+
100
100 1000 10000 100000
AXYS
I Method o tv<YS METHOD Ml.P.-021 Rev 09 + tv<YS METHOD Ml.A-021 Rev 08 I

100000
10000
1000
100
10
10 100
Fluorene
1000
AXYS
10000 100000
I Method o tv<YS METHOD Ml.P.-021 Rev 09 + tv<YS METHOD Ml.A-021 Rev 08 I
10000
6 2 1000 ~I f-'
100
100
lndeno(1 ,2,3-cd)pyrene
1000
AXYS
+
+
10000
I Method o tv<YS METHOD ML.A-021 Rev 09 + tv<YS METHOD Ml.A-021 Rev 08 I

Naphthalene +
100000
10000
X 0 z :.:: 0 ~I f-' 1000
100
+
100 1000 10000 100000
AXYS
I Method o tv<YS METHOD Ml.P.-021 Rev 09 + tv<YS METHOD Ml.A-021 Rev 08 I

Perylene 10000
+
+
+ ~ 0 1000
+ 0
+
100
0
100 1000 10000
AXYS
I Method o tv<YS METHOD ML.A-021 Rev 09 + tv<YS METHOD Ml.A-021 Rev 08 I

1 E6
1 E5
6 2 1E4 ~I f-'
1 E3
1 E2
+
1 E2
0
1 E3
Phenanthrene
1 E4
AXYS
+
1 E5
I Method o tv<YS METHOD Ml.A-021 Rev 09 + tv<YS METHOD Ml.A-021 Rev 08 I
1 E6
100000
X 0 z 10000 :.:: ~I f-'
+
1000 + 0..,
0
1000
Pyrene
+
10000
AXYS
+
+
100000
I Method o tv<YS METHOD Ml.P.-021 Rev 09 + tv<YS METHOD Ml.A-021 Rev 08 I

Attachment 2
Log PCB Agreement Plots by Laboratory

X 0 z ~
<(I t-
10000
1000
100
0
100
Monochlorobiphenyl
0
1000 10000 100000
AXYS

1E6
1E5
X 0 1E4 z ~
<(I 1-
1E3
1E2
1E2 1E3
Dichlorobiphenyl
1E4
AXYS
1E5 1E6

X 0 z ~
1E6
1E5
<(I 1 E4 1-
1E3
1E2 1E3
Trichlorobiphenyl
0
1E4 1E5 1E6
AXYS

X 0 z ~
<(I I-
Tetrachlorobiphenyl 1E7
0
1E6
1E5
1E4
1E3
1E2 ,_----------~----------,-----------,-----------,------------r 1E2 1E3 1E4 1E5 1E6 1E7
AXYS

X 0 z ~
1E6
1E5
<(I 1 E4 r-
1E3
1E2
1E2 1E3
Pentachlorobiphenyl
1E4
AXYS
1E5
0
1E6

X 0
1E6
1E5
Z 1E4 ~
<(I I-
1E3
1E2
1E2 1E3
Hexachlorobiphenyl
1E4
AXYS
1E5
0
1E6

X 0 z ~
<(I I-
1E6
1E5
1E4
1E3
1E3 1E4
Heptachlorobiphenyl
1E5 1E6
AXYS

X 0 z ~
<(I I-
100000
10000
1000
0
1000
Octachlorobiphenyl
10000 100000
AXYS

X 0 z
100000
~ 10000 <(I 1-
1000
0
100 1000
Nonachlorobiphenyl
10000
AXYS
100000
X 0 z ~
<(I 1-
100000
10000
1000
100
100
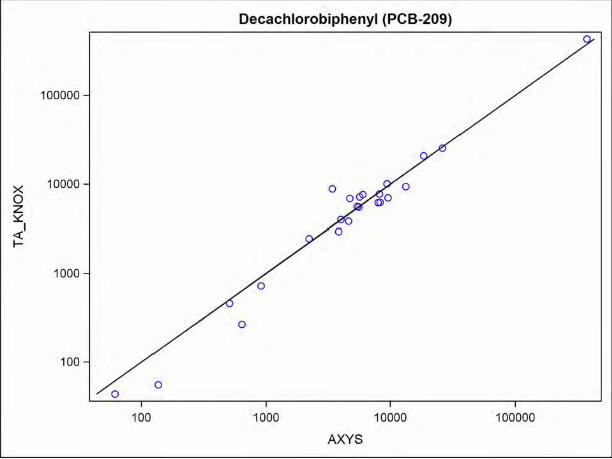
Decachlorobiphenyl (PCB-209)
1000 10000 100000
AXYS

10000
X 1000 0 z ~
<(I 1-
100
10
10 100
PCB-1
1000
AXYS
10000
0 0

10000
X 0 1000 z ~
<(I t-
100
0
100
PCB-2
1000
AXYS
0
0 0
0 0
10000
100
0
100 1000
AXYS
10000

X 0 z ~
<(I t-
100000
10000
1000
100
100
PCB-4
1000 10000 100000
AXYS
7000
6000
5000
4000
X 0
3000
z ~
<(I r-
2000
1000
1000 2000
PCB-5
3000
AXYS
0 0
4000 5000 6000
0
8000

100000
X
~ 10000 ~
<(I r-
1000
1000
PCB-6
10000
AXYS
0
100000
X 0 z ~
10000
<(' 1000 t-
100
0
100
0
PCB-7
1000
AXYS
10000

X 0 z ~
<(I 1-
100000
10000
1000
100
100
PCB-8
1000 10000 100000
AXYS

25000
20000
15000
10000
~ 5000 z ~
<(I r-
1000
0
1000
PCB-9
5000
AXYS
10000 15000 25000
10000
X 0 1000 z ~
<(I t-
100
0
100
PCB-10
0
1000
AXYS
0
0
10000

X 0 z ~
<(I 1-
100000
10000
1000
100
100 1000
PCB-11
10000
AXYS
100000
0 0

PCB-12/PCB-13
22500 0 0
17500
12500
10000
7500
5000 00 X 0
0 z ~ 0 <(I 2500 r-
0
1000 10000 100000
AXYS

X 0 z ~
100000
10000
<(' 1000 1-
100
100
PCB-15
1000 10000 100000
AXYS

X 0 z ~
100000
10000
<(' 1000 I-
100
10
10 100
PCB-16
1000
AXYS
10000 100000

X 0 z ~
100000
10000
<(' 1000 t-
100
10
10 100
PCB-17
1000
AXYS
10000 100000

X 0 z ~
<(I 1-
1E6
1E5
1E4
1E3
0
1E3
PCB-18/PCB-30
0
1E4 1E5 1E6
AXYS

X 0 z ~
<(I 1-
10000
1000
100
100 1000
PCB-19 0
10000 100000
AXYS

1E6
1E5
X 0 1E4 z ~
<(I 1-
1E3
1E2
1E2 1E3
PCB-20/PCB-28
1E4
AXYS
1E5 1E6

X 0 z ~
<(I ~
100000
10000
1000
100
10
10
PCB-21/PCB-33
100 1000 10000 100000
AXYS

~ z ~
100000
10000
<(I 1000 1-
100
10
10 100
PCB-22
1000
AXYS
10000 100000

10000 ~-----------~P~C~B~-2~4~-----====== 0
0
~ 1000 z ~
<(I t-
100
0
0
100
0
0
1000
AXYS
10000

X 0 z ~
<(I 1-
100000
10000
1000
0
100 1000
PCB-25
0
0
10000 100000
AXYS

X 0 z ~
<(I I-
100000
10000
1000
0
PCB-26/PCB-29
1000 10000 100000
AXYS
X 0 z ~
<(I I-
10000
1000
100 0
100
PCB-27
1000
AXYS
10000
0 0
PCB-31 1E6
0
1E5
~ 1E4 z ~
<(I I-
1E3
1E2
1E2 1E3 1E4 1E5 1E6
AXYS
X 0 z ~
<(I 1-
100000
10000
1000
100
10
10 100
PCB-32
1000
AXYS
10000 100000
3000
2750
2500
2250
2000
>< 0 1750 z ~
<(I r- 1500
1250
1000
0
1000 1500
PCB-34
2000
AXYS
2500
0
0
3000 3500 4000 5000

X 0 z ~
<(I t-
10000
1000
100
100
0
PCB-35
1000
AXYS
0
10000

X 0 z
100000
10000
~ 1000 <(I I-
100
10
10 100
PCB-37
1000
AXYS
10000
0
100000

X 0 z ~
<(I 1-
3000
2500
2000
1500
1000
500 0
1000
PCB-39
2000
AXYS
0
0
0
3000 4000 5000 7000
X 0 z ~
<(I t-
100000
10000
1000
100
10
10 100
PCB-40/PCB-41/PCB-71 0
1000 10000 100000
AXYS

X 0
100000
z 10000 ~
<(I 1-
1000
0
1000
PCB-42
10000
AXYS
0
100000

1E6
1E5
1E4 X 0 z ~
<(I I-
1E3
1E2
1E1
1 E1 1E2
PCB-44/PCB-47/PCB-65
0
1E3 1E4 1E5 1E6
AXYS
X 0 z ~
<(I 1-
100000
10000
PCB-45/PCB-51 0 0
1000 0 ~------,-------------------~--------------------~--~
1000 10000
AXYS
100000

X 0 z ~
<(I t-
10000
1000
100
100 1000
PCB-46 0
10000 100000
AXYS

X 0 z ~
<(I I-
100000
10000
1000
1000
PCB-48
10000
AXYS
0
100000

X 0 z ~
<(I t-
100000
10000
1000
100
100 1000
PCB-49/PCB-69 0
10000 100000
AXYS

100000
~ 10000 z ~
<(I 1-
1000
1000
PCB-50/PCB-53
10000
AXYS
0
100000

PCB-52 1E6
0
1E5
1E4
1E3
1E2
1E2 1E3 1E4 1E5 1E6
AXYS

10000
X ~ 1000 ~
<(I I-
100
100
PCB-54
1000
AXYS
0
0
10000

X 0 z ~
<(I 1-
10000
1000
100
100
PCB-55
1000 10000
AXYS

X 0 z ~
100000
<(I 10000 1-
1000
1000
PCB-56
10000
AXYS
0
100000

2750
2500
2250
2000
1750
1500 X 0 z ~ 1250 <(I f-
1000
750
0
500 1000
PCB-57
1500
AXYS
2000
0
0
0
2500 3000 3500
X 0 z
1000
~ 100 <(I ~
10
10
PCB-58
100
AXYS
0
0 0
1000
X 0 z ~
<(I I-
100000
10000
1000
100
100
PCB-59/PCB-62/PCB-75
0
1000 10000 100000
AXYS

PCB-60 0
100000
10000
X 0 z ~
<(I I-
1000 0
100
100 1000 10000 100000
AXYS
1E6
1E5
~ 1E4 z ~
<(I I-
1E3
1E2
1E2
PCB-61/PCB-70/PCB-74/PCB-76
1E3 1E4
AXYS
0
1E5 1E6
X 0 z
10000
~ 1000 <(I 1-
100
100
PCB-63
1000
AXYS
0
10000

X 0 z ~
100000
10000
<(I 1000 I-
100
10
10 100
PCB-64
1000
AXYS
10000
0
100000

X 0 z ~
<(I I-
1E6
1E5
1E4
1E3
1E2
1E1
1E1 1E2 1E3
PCB-66
0
1E4 1E5 1E6
AXYS

10000
X
~ 1000 ~
<(I 1-
100
100
PCB-67
1000
AXYS
10000
0 0

PCB-68 3500 0
2500
1500
1000
500
>< 0 z ~
<(I I-
0
70
0
10
10 70 500 1 000 1500 2500 4000
AXYS

PCB-72
3500
2500
1500
1000
500
X 0 z ~
<(I ~
70
0
10
10 100 1000
AXYS

X 0 z ~
<(I I-
10000
1000
100
100
PCB-77 0
1000 10000
AXYS

X 0 z ~
<(I I-
1000
100
10
PCB-79
10 100
AXYS
0
0
0
0
1000 10000

PCB-82 100000
10000
X 0 z ~
<(I I- 0
1000
100
100 1000 10000 100000
AXYS
X 0 z ~
<(I I-
100000
10000
1000
100
100 1000
PCB-83/PCB-99 0
10000 100000
AXYS

100000
X 10000 0 z ~
<(I 1-
1000
1000
PCB-84
10000
AXYS
0
100000

X 0
100000
10000
~ 1000 <(I I-
100
10
10 100
PCB-85/PCB-116/PCB-117
1000
AXYS
10000
0
100000

X 0 z ~
<(I 1-
100000
10000
1000
100
100
PCB-86/PCB-87/PCB-97/PCB-119/PCB-125 0
1000 10000 100000
AXYS

X 0
100000
10000
~ 1000 <(I I-
100
10
10 100
PCB-88/PCB-91
1000
AXYS
10000
0
100000

X 0 z ~
<(I 1-
10000
1000
100
100
PCB-89
0
1000 10000
AXYS

100000
~ 10000 z ~
<(I 1-
1000
100
100 1000
PCB-90/PCB-1 01/PCB-113
10000
AXYS
0
100000
X 0
100000
10000
~ 1000 <(I 1-
100
10
10 100
PCB-92
1000
AXYS
10000
0
100000
10000
~ 1000 z ~
<(I t-
100 0
0
100
PCB-94
00
0
1000
AXYS
0
Cf)
0
0
10000

X 0 z ~
<(I 1-
10000 ~-----------~P~C~B~-9~6~-----====== 0
1000
0 0
100 0
0
100 1000 10000
AXYS
10000 ~----------~P~C~B~-1~0~3-------======= 0
X ~ 1000 ~
<(I t-
100 0
0
100
0
1000
AXYS
0
10000
3000 2500 2000
1500
1000
>< 500 0 z ~
<(I ~
100
0
10 100
PCB-104 0
0
0
0
1000
AXYS

X 0 z ~
<(I 1-
100000
10000
1000
100
100 1000
PCB-105 0
10000 100000
AXYS

100000
X 0 10000 z ~
<(I 1-
1000
100
1E2 1E3
PCB-110/PCB-115
1E4
AXYS
1E5 1E6

PCB-114
10000
X 1000
0 z ~
<(I 1-
0
0
100
100 1000
AXYS
100000
~ 10000 z ~
<(I 1-
1000
100
100 1000
PCB-118
10000
AXYS
0
100000

900
850
800
~ 750 z ~
<(I ~
700
650
PCB-120 0
600 0 ~----~---------r--------~------~------~-------r------~
600 650 700 750 800 850 900
AXYS

PCB-122 10000
0
0
1000 0
X 0 z ~
<(I 1-
0
100
100 1000 10000
AXYS

X 0 z ~
<(I 1-
1oooo ~----------~~PC~~B::-1~2~3~-------====== 0
1000
0
100
0
100 1000 10000
AXYS

X 0 z ~
<(I 1-
100000
10000
1000
100
0
10 100
PCB-128/PCB-166
1000
AXYS
0
10000 100000

X 0 z ~
<(I 1-
100
PC B-129/PCB-138/PC B-160/PCB-163
1000 10000
AXYS
100000

PCB-130 0
10000
1000
100
100 1000 10000
AXYS
10000 ~----------~P~C~B~-1~3~1 _____ _::====== 0
1000 0
X 0 z ~
<(I t- 0
100
100 1000 10000
AXYS

X 0 z ~
<(I I-
100000
10000
1000
100
100 1000
PCB-132 0
10000 100000
AXYS

10000 ~----------~P~C~B~-1~3~3 _____ _::======
X 1000 0 z ~
<(I 1-
100
0
0
100
AXYS
0
0 0
0
1000 10000
X 0 z ~
10000
<(I t- 1000
100 0
100
PCB-1 34/PCB-143
1000 10000
AXYS
10000
~ 1000 z ~
<(I 1-
100
10
10 100
PCB-136
1000
AXYS
10000
0
100000

X 0 z ~
10000
<(I 1000 t-
100
0
100
PCB-137
1000
AXYS
0
10000

10000
X 0 1000 z ~
<(I 1-
100
0
100
PCB-139/PCB-140
0
0
0
1000 10000
AXYS

X 0 z ~
<(I ~
100000
10000
1000
100
100
PCB-141
1000
AXYS
10000 100000

X 0 z ~
10000
<(I 1000 1-
100
100
PCB-144
1000
AXYS
0
10000

X 0 z ~
10000
<(' 1000 1-
100
100
PCB-146 0
1000 10000 100000
AXYS

100000
X 10000 0 z ~
<(I I-
1000
100
100 1000
PCB-147/PCB-149 0
10000 100000
AXYS

1000
X 0 z ~ 100 <(I ~
10
0
10
PCB-148
100
AXYS
0
0
1000

800
600 500
400
300
200 X 0 z ~
<(I 1- 100
0
10
PCB-150
100
AXYS
0 0
1000
800 700 600
500
400
300
X 0 200 z ~
<(I t-
100
0
10
PCB-1 52
100
AXYS
0
0
1000

100000
X 10000 0 z ~
<(I I-
1000
100
100 1000
PC B-153/PC B-168 0
10000 100000
AXYS

X 0
100000
10000
~ 1000 <(I I-
100
10
10 100
PCB-155
1000
AXYS
10000
0
100000

10000
~ 1000 z ~
<(I t-
100
10
10 100
PCB-156/PCB-157
1000
AXYS
0
10000

10000
~ 1000 z ~
<(I t-
100
10
10 100
PCB-158
1000
AXYS
0
10000


~ ~ 1120 - 0
~I
980 1000 1020
PCB-162
1040
AXYS
1060 1080 1100 1120

X 0 z ~
<(I
10000
t- 1000
100
100 1000
PCB-164 0
10000
AXYS

10000
X 0 z ~ 1000 <(I t-
100 0
100
PCB-167
0
0
1000
AXYS
0

X 0 z ~
<(I I-
100000
10000
1000
100
100
PCB-170
1000 10000 100000
AXYS

10000
X 1000 0 z ~
<(I 1-
100
10
10
PCB-171/PCB-173
100 1000 10000
AXYS

X 0 z ~
<(I 1-
10000
1000
100
10
10
PCB-172
100 1000 10000
AXYS

X 0 z ~
<(I 1-
100000
10000
1000
100
100
PCB-174
1000 10000 100000
AXYS

>< 0 z ~
<(I r-
3000 2500 2000
1500
1000
500
100
0
10
PCB-175 0
0
100 1000
AXYS

X 0 z ~
<(I 1-
10000
1000
100
10
10
PCB-176 0
100 1000 10000
AXYS

X 0 z ~
<(I 1-
10000
1000
100
100
PCB-177
1000
AXYS
10000

X 0 z ~
<(I 1-
10000
1000
100
100
PCB-178
1000
AXYS
10000

X 0 z ~
<(I
10000
I- 1000
100
100
PCB-179
1000 10000
AXYS

100000
X
~ 10000 ~
<(I 1-
1000
1000
PC B-180/PC B-193
10000
AXYS
100000

~ ~ 400 0
~I
393 394 395
PCB-182
396 397 398 399 400
AXYS
X 0 z ~
<(I I-
100000
10000
1000
100
100
PCB-183/PCB-185
1000 10000 100000
AXYS
X 0 ~ 1380-
~I
PCB-184
0
1380
AXYS

X 0 z ~
<(I I-
100000
10000
1000
1000
PCB-187
10000 100000
AXYS


X 0 z ~
<(I t-
10000
1000
100
10
10
PCB-190
100 1000 10000
AXYS
PCB-191 4000
3000 2500 2000
1500
1000
X 0 0 z 500 ~
<(I ~
100
0
10 100 1000
AXYS

X 0 z ~
<(I 1-
100000
10000
1000 0
100
PCB-194
1000 10000 100000
AXYS
X 0
10000
~ 1000 <(I 1-
100
100
PCB-195
1000
AXYS
10000
X 0 z ~
<(I 1-
10000
1000
100
0
100
PCB-196
1000 10000
AXYS
100000
X ~ 10000 ~
<(I 1-
1000 0
PC B-198/PC B-199
1000 10000 100000
AXYS
X 0 z ~
<(I r-
100000
10000
1000
100
0
100
PCB-202
1000 10000 100000
AXYS

X 0 z ~
<(I 1-
100000
10000
1000
0
100
PCB-203
1000 10000 100000
AXYS

PCB-205
2000 0
1500 1250
1000
750 0
0 500
X 0 z ~
<(I ~ 250
0
10 100 1000
AXYS
100000
X ~ 10000 ~
<(I I-
1000
0
100
PCB-206
1000 10000 100000
AXYS

10000
X
~ 1000 ~
<(I 1-
100
0
10 100
PCB-207 0
0
0
1000 10000
AXYS

X 0 z ~
<(I t-
100000
10000
1000
100
100
PCB-208
1000 10000 100000
AXYS
Top Related