


Languages
Pages
Legal


CSEIT172115 | Received: 08 Feb 2017 | Accepted: 15 Feb 2017 | January-February-2017 [(2)1: 48-54 ]
International Journal of Scientific Research in Computer Science, Engineering and Information Technology
© 2017 IJSRCSEIT | Volume 2 | Issue 1 | ISSN : 2456-3307
48
Image Denoising using Bilateral Filter and Wavelet Thresholding Sirisha B., K. Dhilli, E. Govinda
Department ECE, Avanthi Institute of Engineering and Technology, Narsipatnam, Visakhapatanam, Andhra Pradesh,
India
ABSTRACT
In this work, a hybrid denoising algorithm which combines spatial domain bilateral filter and hybrid thresholding
function in the wavelet domain is being proposed. The wavelet transform is used to decompose the noisy image into
its different subbands namely LL, LH, HL, and HH. A two-stage spatial bilateral filter is applied. The first stage is
applied to the noisy image before wavelet decomposition. This stage will be called a pre-processing stage. The
second stage spatial bilateral filtering is applied on the low-frequency subband of the decomposed noisy image
namely subbands LL. This stage will tend to cancel or at least attenuate any residual low-frequency noise
components. The intermediate stage deal with high-frequency noise components by thresholding detail subbands
LH, HL, and HH using hybrid thresholding function. The performance of the proposed denoising algorithm will be
superior to that of the conventional denoising approach which may be proved after experimental analysis.
Keywords: Bilateral Filter, Wavelet Thresholding, Image Denoising
I. INTRODUCTION
Digital images play an important role in various
applications such as satellite television, medical
imagining, remote sensing, computer vision, pattern
recognition etc. While collecting the information from
the image sensors due to intrinsic (lens arrangement,
lens distortion factors) and extrinsic parameters
(atmosphere, human beings) of the camera device may
chance have occurred the noise in the image.
Furthermore, noise can be introduced by transmission
errors and compression. Therefore, image denoising is
a fundamental problem in the field of image
processing. It is necessary to apply an efficient
denoising technique to reduce the noise in the data.
Image denoising still remains a challenge for
researchers because noise removal introduces artefacts
and causes blurring of the images because of noise
modelling in images is greatly affected by capturing
devices, data transmission media, image quantization
and discrete sources of radiation. Different algorithms
are used depending on the noise model. Most of the
natural images are affected by Gaussian noise.This
project introduces a novel algorithm to reduce noise in
the image and evaluate the quality of the denoised
image in terms of quality parameters.
The basic idea behind this thesis is the estimation of the
uncorrupted image from the distorted or noisy image
and is also known as image denoising. There are
various techniques present to remove the noise from
the corrupted image. Selecting the appropriate method
plays a major role in getting the desired image. In this
paper, a study is made on the various denoising
algorithms like Gaussian/Bilateral filtering (GBF),
GBF with wavelet thresholding (Wavelet threshold
based GBF) and each technique is compared in terms
of its quality parameters like PSNR (Peak Signal to
Noise Ratio), IQI (Image Quality Index).
The rest of the work is presented as Section 2 deals
with detail description of various existing denoising
methods; Section 3 deals with the detail description of
proposed algorithms; Section 4 deals with the detail
description of results and discussions and Section 5
deals with the detail description of conclusion.

Volume 2 | Issue 1 | January-February-2017 | www.ijsrcseit.com 49
II. METHODS AND MATERIAL
A. Edge Preserving Filters
The main objective of image denoising is to remove the
noise from the degraded image without preserving the
image features like edges, details as much as possible.
B. Linear Filters
Linear filters are a well-known technique for removal
of Gaussian or additive noise image. Linear filters,
which consist of convolving the image with a constant
matrix to obtain a linear combination of neighbourhood
values. However, they can produce a blurred and
smoothed image with poor feature localisation and
incomplete noise suppression.
C. Gaussian Filter
Filters based on Gaussian functions are quite popular,
because their shapes are easily specified and both the
forward and inverse Fourier transforms of a Gaussian
function are realGaussian functions. Further, if the
frequency domain filter is narrower, the spatial domain
filter will be wider which attenuates the low
frequencies resulting in increased
smoothing/blurring.These Gaussian filters are typical
linear filters that have been widely used for image
denoising.
In Gaussian filters, weight of the pixels is given by
( )
( )
(1)
Gaussian filters assume that images have smooth
spatial variations and pixels in a neighbourhood have
close values, by averaging the pixel values over a local
neighbourhood suppresses noise while preserving
image features. However, this assumption fails at edges
where the spatial variations are not smooth. Due to that,
the Gaussian filter blurs the edges. To overcome this
problem we introduce a bilateral filter.
D. Bilateral Filter
The bilateral filter filtering the image in both range and
space domain.Bilateral filtering is a local, nonlinear
and non-iterative technique which considers both grey
level similarities and geometric closeness of the
neighbouring pixels.Mathematically,the bilateral filter
output at a pixel location ‘p’ is calculated as follows
( )
∑ (‖ ‖) (| ( ) ( )|) ( ) (2)
Where (‖ ‖) ‖ ‖
is a geometric
closeness function
(| ( ) ( )|) | ( ) ( )|
is a gray level
similarity function
W= Normalization constant
‖ ‖is the Euclidian distance between ‘p’ and ‘q’.
and 's’ is a spatial neighbourhood of ‘p’.
The two parameters and controls the behavior of
the bilateral filter. The optimal value is relatively
insensitive tonoise variancecompared to the optimal
value and is chosen based on the desired amount
oflow-pass filtering.A large blurs more, i.e., it
combines values from more distant image locations.
Also, if an image is scaled up or down, must be
adjusted accordingly in order toobtain equivalent
results.It appears that a good range for the value is
roughly [1.5 - 2.1]. On the other hand, the optimal
value changes significantly as the noise standard
deviation changes.
E. Gaussian Bilateral Filter And Wavelet
Thresholding
The proposed method of image denoising uses the
combination of Gaussian/Bilateral Filter and its
Method noise Thresholding using wavelets (G/BFMT)
and is shown in Figure 1. A difference between the
original image and its denoised image shows the noise
removed by the algorithm, is known as method noise.In
principle, the method noise should look like a noise.
Since even good quality images have some noise, it
makes sense to evaluate any denoising method that way,
w

Volume 2 | Issue 1 | January-February-2017 | www.ijsrcseit.com 50
Figure 1: Proposed image denoising algorithm
(3)
Where ‘An’ is the original image and is the output of
denoising operatorfor a input image ‘A’.
F. Gaussian/Bilateral Filter
The bilateral filter on the noisy image averages the
noise along with the image details while preserving
edges/sharp boundaries very well provided the standard
deviation of the noise is less than the edge contrast. In
the case of the Gaussian filter, its method noise is zero
inharmonic parts of the image and very large near
edges or texture, where the Laplacian can not be small.
As a consequence, the Gaussian convolution is optimal
in flat parts of the image bulges and texture is blurred.
To capture what is removed from the noisy image by
theGaussian/Bilateral filter, the definition of the
method noise is redefined as the difference between the
noisy image and its denoised image. Hence, Equation
(4.3) is rewritten as
(4)
Where I= A + Z is a noisy image obtained by
corrupting the original image ‘A’ by a whiteGaussian
noise ‘Z’ and is the output of Gaussian/Bilateral filter
for a input image I.
Since the Gaussian/Bilateral filter has removed the
noise as well as image details by averaging the pixels,
the method noise will consist of noise as well as image
details along with some edges. The method noise due
to Gaussian filtering will have more strong edges as
compared to that of bilateral filtering as the edges are
preserved by range filtering . So, the methodnoise
‘MN’ is a combination of image details ‘D’ and a white
Gaussian noise ‘N’ and is written as
(5)
Now the problem is to estimate the detail image ‘D’,
which has only the original image features and
edges/sharp boundaries that are removed by
Gaussian/Bilateral filter, as accurately as possible
according to some criteria and is added to the
Gaussian/Bilateral filtered image to get better
denoised image with details. In wavelet domain,
Equation (5) can be represented as
(6)
Where ‘Y’ is the noisy wavelet coefficient (method
noise), ‘W’ is the true wavelet coefficient(detail image)
and is independent Gaussian noise.
G. Wavelet Thresholding
In wavelet domain, the goal is to estimate the true
wavelet coefficient ’W’ from ‘Y’ by thresholding ‘Y’
with a proper value of threshold which minimises MSE
so that it can retain the original image features and
edges/sharp boundaries very well in the final denoised
image. The estimate of the true wavelet coefficient is
represented as and its wavelet reconstruction gives
an estimate of the detail image . The summation of
this detail image with theGaussian/Bilateral filtered

Volume 2 | Issue 1 | January-February-2017 | www.ijsrcseit.com 51
image will give the denoised image ‘B’, certainly
have more imagedetails and edges as compared with
Gaussian/Bilateral filtered image .
Wavelet thresholding adds power to the proposed
method as noise components can be eliminated better
in detail subbands of method noise. As BayesShrink
provides a better MSEperformance than SureShrink, it
is used in the proposed method to threshold the method
noisy wavelet coefficients. BayesShrink is also an
adaptive, data-driven thresholding strategy via soft-
thresholding which derives the threshold in a Bayesian
framework assuming a generalizedGaussian
distribution. This method is adaptive to each sub-band
because it depends on data-driven estimates of the
parameters. The threshold for a given subband derived
by minimizingBayesian risk and is given by
(7)
Where is the noise variance estimated from
subband by a robust median estimator givenby
(| |)
* + (8)
And is the variance of wavelet coefficients in that
subband, whose estimate is computedusing
(
) (9)
Where
∑
H. Quality Metrics
In this section, we will discuss various image quality
measurements to find out the quality of a denoised
image obtained from different restoration methods as
we discussed in chapter 4.
Mean Square Error (MSE)
The the mean square error is used as a part of the
digital image processing method to check for errors
.two MSEs are calculated and then compared to
determine the accuracy of an image. In statistics, the
mean squared error mean squared deviation (MSD) of
an estimator measures the average of the squares of the
error or deviation, that is, he difference between the
estimator and what is estimated.The difference occurs
because of randomness or because the estimator does
not account for information that could produce a more
accurate estimate.
Let f(x, y) and g (x, y) represents original image and
denoised image with a dimension M*N, then Mean
square error is given by
∑ ∑ ( ( ) ( ))
(10)
Peak Signal to Noise Ratio (PSNR)
PSNR is defined as the ratio between the maximum
possible power of a signal and the power of the
corrupting noise that affects the fidelity of its
representation because many signals have a very wide
dynamic range. PSNR is usually expressed in terms of
the logarithmic decibel scale. PSNR is most commonly
used to measure the quality of reconstruction of lossy
compression codecs(eg :for image compression).
Let f(x, y) and g (x, y) represents original image and
denoised image with a dimension M*N, then Peak
signal to noise ratio is given by
(
⁄ ) (11)
Image Quality Index (IQI)
Let f(x, y) and g (x, y) represents original image and
denoised image with a dimension M*M then Image
Quality Index (IQI) is given by
(
)[ ] (12)
Where
∑ and
∑
∑ ( )
and
∑ ( )
III. RESULTS AND DISCUSSION
In this section, we are going to discuss the simulation
results of various techniques like WT, BF, GF and
BFWT. Figure 2 represents the dataset for image
denoising with 512*512 resolution.

Volume 2 | Issue 1 | January-February-2017 | www.ijsrcseit.com 52
a) barbara
b) Penguins
c) siri
d) manvi
Figure 2 : Data Set for image denoising
Table 1 : Quality Parameters for various images using
GF
sigm
a
10 20 30 40 50
siri
PSN
R
28.96
85
22.21
57
18.76
00
16.37
44
14.60
85
IQI 0.980
8
0.935
5
0.881
9
0.832
0
0.789
3
manvi
PSN
R
28.13
09
22.14
39
18.72
48
16.38
83
14.66
08
IQI 0.981
1
0.943
8
0.903
5
0.863
1
0.825
8
barbar
a
PSN
R
28.13
06
22.13
86
18.71
05
16.37
44
14.65
18
IQI 0.988
3
0.957
0
0.914
7
0.870
8
0.830
9
Pengui
ns
PSN
R
28.22
53
22.29
84
18.87
97
16.51
44
14.75
46
IQI 0.983
0
0.956
0
0.926
7
0.891
9
0.862
2
Table 2 : Quality Parameters for various images using
BFWT
sigm
a
10 20 30 40 50
siri
PSN
R
31.04
38
27.43
43
25.32
81
23.69
65
22.35
39
IQI 0.989
4
0.977
5
0.963
9
0.948
6
0.931
2
manvi
PSN
R
33.62
28
29.80
53
27.13
30
25.08
41
23.45
25
IQI 0.994
2
0.986
4
0.976
0
0.963
9
0.950
8
barbar
a
PSN
R
34.76
87
30.44
46
27.49
58
25.31
35
23.61
66
IQI 0.996
8
0.992
5
0.985
7
0.976
7
0.965
6
Pengui
ns
PSN
R
31.91
13
28.13
19
25.79
82
24.03
57
22.59
42
IQI 0.992
4
0.984
0
0.974
7
0.961
5
0.952
5
By observing Table 6.1 and Table 6.2 and comparing
the quality parameters PSNR and IQI we can infer that
Bilateral Filter with the method of Wavelet
Thresholding provides better filtering compared to
Guided Filter.
Figure 3 represents the GF, BFWT filtering images of
siri, manvi and Barbara by using db8 wavelet with soft
thresholding.
a) Guided Filtering of siri Image
filtered image

Volume 2 | Issue 1 | January-February-2017 | www.ijsrcseit.com 53
b) BFWT of siri Image
c) Guided filtering of manvi image
d) BFWT of manvi image
e) Guided filtering of barbara image
f) BFWT of Barbara image
Figure 3 : GF and BFWT of different images
Table 3 : PSNR of GF and BFWT under different
wavelets for Penguins image
sigma 10 20 30 40 50
GF
28.225
3
22.298
4
18.879
7
16.514
4
14.754
6
BFW
T
Db8 31.911
3
28.131
9
25.793
5
24.035
7
22.594
2
Sym8 31.968
7
28.144
5
25.805
6
24.035
3
22.593
4
Db16 31.939
2
28.130
0
25.793
5
24.035
7
22.596
9
Coif5 31.973
1
28.128
0
25.791
0
24.033
4
22.595
8
Bior6.
8
32.085
0
28.131
7
25.702
7
23.867
2
22.393
9
Table 4 : IQIof GF and BFWT under different
wavelets for Penguins image
sigma 10 20 30 40 50
GF
0.983
0
0.956
0
0.926
7
0.891
9
0.862
2
BFW
T
Db8 0.992
4
0.984
0
0.974
7
0.961
5
0.952
5
Sym8 0.992
3
0.984
0
0.974
7
0.961
4
0.952
5
Db16 0.992
4
0.984
1
0.974
7
0.961
4
0.952
6
Coif5 0.992
3
0.983
9
0.974
6
0.961
3
0.952
5
Bior6.
8
0.992
4
0.983
8
0.973
9
0.960
2
0.950
6
Bilateral Filtering & Detail Thresholding
filtered image
Bilateral Filtering & Detail Thresholding
filtered image
Bilateral Filtering & Detail Thresholding
Volume 2 | Issue 1 | January-February-2017 | www.ijsrcseit.com 54
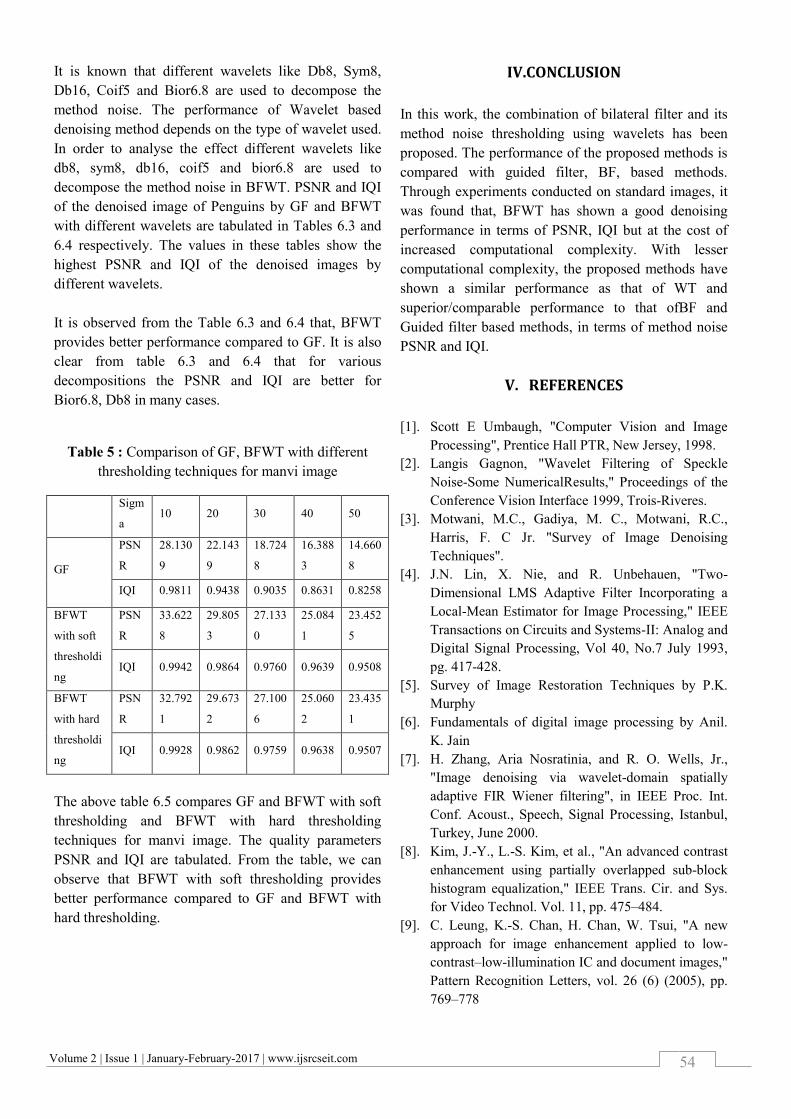
It is known that different wavelets like Db8, Sym8,
Db16, Coif5 and Bior6.8 are used to decompose the
method noise. The performance of Wavelet based
denoising method depends on the type of wavelet used.
In order to analyse the effect different wavelets like
db8, sym8, db16, coif5 and bior6.8 are used to
decompose the method noise in BFWT. PSNR and IQI
of the denoised image of Penguins by GF and BFWT
with different wavelets are tabulated in Tables 6.3 and
6.4 respectively. The values in these tables show the
highest PSNR and IQI of the denoised images by
different wavelets.
It is observed from the Table 6.3 and 6.4 that, BFWT
provides better performance compared to GF. It is also
clear from table 6.3 and 6.4 that for various
decompositions the PSNR and IQI are better for
Bior6.8, Db8 in many cases.
Table 5 : Comparison of GF, BFWT with different
thresholding techniques for manvi image
Sigm
a 10 20 30 40 50
GF
PSN
R
28.130
9
22.143
9
18.724
8
16.388
3
14.660
8
IQI 0.9811 0.9438 0.9035 0.8631 0.8258
BFWT
with soft
thresholdi
ng
PSN
R
33.622
8
29.805
3
27.133
0
25.084
1
23.452
5
IQI 0.9942 0.9864 0.9760 0.9639 0.9508
BFWT
with hard
thresholdi
ng
PSN
R
32.792
1
29.673
2
27.100
6
25.060
2
23.435
1
IQI 0.9928 0.9862 0.9759 0.9638 0.9507
The above table 6.5 compares GF and BFWT with soft
thresholding and BFWT with hard thresholding
techniques for manvi image. The quality parameters
PSNR and IQI are tabulated. From the table, we can
observe that BFWT with soft thresholding provides
better performance compared to GF and BFWT with
hard thresholding.
IV.CONCLUSION
In this work, the combination of bilateral filter and its
method noise thresholding using wavelets has been
proposed. The performance of the proposed methods is
compared with guided filter, BF, based methods.
Through experiments conducted on standard images, it
was found that, BFWT has shown a good denoising
performance in terms of PSNR, IQI but at the cost of
increased computational complexity. With lesser
computational complexity, the proposed methods have
shown a similar performance as that of WT and
superior/comparable performance to that ofBF and
Guided filter based methods, in terms of method noise
PSNR and IQI.
V. REFERENCES
[1]. Scott E Umbaugh, "Computer Vision and Image
Processing", Prentice Hall PTR, New Jersey, 1998.
[2]. Langis Gagnon, "Wavelet Filtering of Speckle
Noise-Some NumericalResults," Proceedings of the
Conference Vision Interface 1999, Trois-Riveres.
[3]. Motwani, M.C., Gadiya, M. C., Motwani, R.C.,
Harris, F. C Jr. "Survey of Image Denoising
Techniques".
[4]. J.N. Lin, X. Nie, and R. Unbehauen, "Two-
Dimensional LMS Adaptive Filter Incorporating a
Local-Mean Estimator for Image Processing," IEEE
Transactions on Circuits and Systems-II: Analog and
Digital Signal Processing, Vol 40, No.7 July 1993,
pg. 417-428.
[5]. Survey of Image Restoration Techniques by P.K.
Murphy
[6]. Fundamentals of digital image processing by Anil.
K. Jain
[7]. H. Zhang, Aria Nosratinia, and R. O. Wells, Jr.,
"Image denoising via wavelet-domain spatially
adaptive FIR Wiener filtering", in IEEE Proc. Int.
Conf. Acoust., Speech, Signal Processing, Istanbul,
Turkey, June 2000.
[8]. Kim, J.-Y., L.-S. Kim, et al., "An advanced contrast
enhancement using partially overlapped sub-block
histogram equalization," IEEE Trans. Cir. and Sys.
for Video Technol. Vol. 11, pp. 475–484.
[9]. C. Leung, K.-S. Chan, H. Chan, W. Tsui, "A new
approach for image enhancement applied to low-
contrast–low-illumination IC and document images,"
Pattern Recognition Letters, vol. 26 (6) (2005), pp.
769–778
Top Related