


Languages
Pages
Legal


RESEARCH ARTICLE
IL-7 Receptor Mutations and Steroid
Resistance in Pediatric T cell Acute
Lymphoblastic Leukemia: A Genome
Sequencing Study
Yunlei Li1☯, Jessica G. C. A. M. Buijs-Gladdines1,2☯, Kirsten Cante-Barrett1,2, Andrew P.
Stubbs3, Eric M. Vroegindeweij1,2, Willem K. Smits1,2, Ronald van Marion4, Winand N. M.
Dinjens4, Martin Horstmann5,6,7, Roland P. Kuiper2,8, Rogier C. Buijsman9, Guido J. R.
Zaman9, Peter J. van der Spek3, Rob Pieters1,2, Jules P. P. Meijerink1,2*
1 Department of Pediatric Oncology/Hematology, Erasmus Medical Center/Sophia Children’s Hospital,
Rotterdam, The Netherlands, 2 Princess Maxima Center for Pediatric Oncology, Utrecht, The Netherlands,
3 Department of Bioinformatics, Erasmus Medical Center, Rotterdam, The Netherlands, 4 Department of
Pathology, Erasmus Medical Center, Rotterdam, The Netherlands, 5 Research Institute Children’s Cancer
Center Hamburg, Hamburg, Germany, 6 Clinic of Pediatric Hematology and Oncology, University Medical
Center Hamburg-Eppendorf, Hamburg, Germany, 7 Co-operative Study Group for Childhood Acute
Lymphoblastic Leukemia, Hamburg, Germany, 8 Department of Human Genetics, Radboud University
Medical Center, Nijmegen, The Netherlands, 9 Netherlands Translational Research Center, Oss, The
Netherlands
☯ These authors contributed equally to this work.
Abstract
Background
Pediatric acute lymphoblastic leukemia (ALL) is the most common childhood cancer and the
leading cause of cancer-related mortality in children. T cell ALL (T-ALL) represents about
15% of pediatric ALL cases and is considered a high-risk disease. T-ALL is often associated
with resistance to treatment, including steroids, which are currently the cornerstone for treat-
ing ALL; moreover, initial steroid response strongly predicts survival and cure. However, the
cellular mechanisms underlying steroid resistance in T-ALL patients are poorly understood.
In this study, we combined various genomic datasets in order to identify candidate genetic
mechanisms underlying steroid resistance in children undergoing T-ALL treatment.
Methods and Findings
We performed whole genome sequencing on paired pre-treatment (diagnostic) and post-
treatment (remission) samples from 13 patients, and targeted exome sequencing of pre-
treatment samples from 69 additional T-ALL patients. We then integrated mutation data with
copy number data for 151 mutated genes, and this integrated dataset was tested for associ-
ations of mutations with clinical outcomes and in vitro drug response. Our analysis revealed
that mutations in JAK1 and KRAS, two genes encoding components of the interleukin 7
receptor (IL7R) signaling pathway, were associated with steroid resistance and poor out-
come. We then sequenced JAK1, KRAS, and other genes in this pathway, including IL7R,
PLOS Medicine | DOI:10.1371/journal.pmed.1002200 December 20, 2016 1 / 33
a11111
OPENACCESS
Citation: Li Y, Buijs-Gladdines JGCAM, Cante-
Barrett K, Stubbs AP, Vroegindeweij EM, Smits
WK, et al. (2016) IL-7 Receptor Mutations and
Steroid Resistance in Pediatric T cell Acute
Lymphoblastic Leukemia: A Genome Sequencing
Study. PLoS Med 13(12): e1002200. doi:10.1371/
journal.pmed.1002200
Academic Editor: Marc Ladanyi, MSKCC, UNITED
STATES
Received: August 3, 2016
Accepted: November 11, 2016
Published: December 20, 2016
Copyright: © 2016 Li et al. This is an open access
article distributed under the terms of the Creative
Commons Attribution License, which permits
unrestricted use, distribution, and reproduction in
any medium, provided the original author and
source are credited.
Data Availability Statement: All whole-genome
sequencing data, aligned to the human reference
genome (NCBI build 36), are available from the
European Nucleotide Archive database (http://
www.ebi.ac.uk/ena under accession numbers
ERS934791-ERS934816). All targeted-sequencing
data, aligned to the human reference genome
(NCBI build 37), are available from the European
Nucleotide Archive database (http://www.ebi.ac.uk/
ena under accession numbers ERS935731 -
ERS935812). All gene expression profiling data are
JAK3, NF1, NRAS, and AKT, in these 69 T-ALL patients and a further 77 T-ALL patients.
We identified mutations in 32% (47/146) of patients, the majority of whom had a specific
T-ALL subtype (early thymic progenitor ALL or TLX). Based on the outcomes of these
patients and their prednisolone responsiveness measured in vitro, we then confirmed that
these mutations were associated with both steroid resistance and poor outcome.
To explore how these mutations in IL7R signaling pathway genes cause steroid resis-
tance and subsequent poor outcome, we expressed wild-type and mutant IL7R signaling
molecules in two steroid-sensitive T-ALL cell lines (SUPT1 and P12 Ichikawa cells) using
inducible lentiviral expression constructs. We found that expressing mutant IL7R, JAK1, or
NRAS, or wild-type NRAS or AKT, specifically induced steroid resistance without affecting
sensitivity to vincristine or L-asparaginase. In contrast, wild-type IL7R, JAK1, and JAK3, as
well as mutant JAK3 and mutant AKT, had no effect. We then performed a functional study
to examine the mechanisms underlying steroid resistance and found that, rather than
changing the steroid receptor’s ability to activate downstream targets, steroid resistance
was associated with strong activation of MEK-ERK and AKT, downstream components of
the IL7R signaling pathway, thereby inducing a robust antiapoptotic response by upregulat-
ing MCL1 and BCLXL expression. Both the MEK-ERK and AKT pathways also inactivate
BIM, an essential molecule for steroid-induced cell death, and inhibit GSK3B, an important
regulator of proapoptotic BIM. Importantly, treating our cell lines with IL7R signaling inhibi-
tors restored steroid sensitivity. To address clinical relevance, we treated primary T-ALL
cells obtained from 11 patients with steroids either alone or in combination with IL7R signal-
ing inhibitors; we found that including a MEK, AKT, mTOR, or dual PI3K/mTOR inhibitor
strongly increased steroid-induced cell death. Therefore, combining these inhibitors with
steroid treatment may enhance steroid sensitivity in patients with ALL. The main limitation of
our study was the modest cohort size, owing to the very low incidence of T-ALL.
Conclusions
Using an unbiased sequencing approach, we found that specific mutations in IL7R signaling
molecules underlie steroid resistance in T-ALL. Future prospective clinical studies should
test the ability of inhibitors of MEK, AKT, mTOR, or PI3K/mTOR to restore or enhance ste-
roid sensitivity and improve clinical outcome.
Author Summary
Why Was This Study Done?
• Although modern treatment protocols have drastically increased the cure rate
among patients with T cell acute lymphoblastic leukemia (T-ALL), nearly 40% of
patients require the most aggressive treatment regimen, significantly increasing the
risk of harmful treatment effects later in life. These detrimental effects can include
growth defects, bone necrosis, heart failure, and an increased risk of developing sec-
ondary malignancies. Moreover, treatment outcome for relapsed T-ALL patients is
extremely poor.
IL7R Signaling Mutations Confer Steroid Resistance in T-ALL
PLOS Medicine | DOI:10.1371/journal.pmed.1002200 December 20, 2016 2 / 33
available from Gene Expression Omnibus (http://
www.ncbi.nlm.nih.gov/geo/ under accession
number GSE26713).
Funding: YL was funded by Stichting Kinderen
Kankervrij (https://www.kika.nl; KiKa-2010-082).
KC-B and WKS were funded by Stichting Kinderen
Kankervrij (https://www.kika.nl; KiKa-2008-029,
KiKa-2013-116). EMV was funded by KWF Kanker
Bestrijding (https://www.kwf.nl; EMCR-KWF-2010-
4691). The funders had no role in study design,
data collection and analysis, decision to publish, or
preparation of the manuscript.
Competing Interests: RCB and GJRZ are founders
and shareholders of Netherlands Translational
Research Center B.V. The other authors have
declared that no competing interests exist.
Abbreviations: aCGH, array comparative genomic
hybridization; ALL, acute lymphoblastic leukemia;
BCP-ALL, B cell precursor acute lymphoblastic
leukemia; CI, combination index; COALL, German
Co-operative Study Group for Childhood Acute
Lymphoblastic Leukemia; DCOG, Dutch Childhood
Oncology Group; ETP-ALL, early thymic progenitor
acute lymphoblastic leukemia; FNr, false negative
rate; FPr, false positive rate; INDEL, small insertion
or deletion; LOH, loss of heterozygosity; ROC,
receiver operating characteristic; SNV, single
nucleotide variant; SS, somatic score; T-ALL, T cell
acute lymphoblastic leukemia; TES, targeted
exome sequencing; TS, total score; WGS, whole
genome sequencing.
• Steroids are the cornerstone chemotherapeutic drug in the treatment of acute lym-
phoblastic leukemia (ALL), including T-ALL. However, steroid resistance is com-
mon among patients and is associated with poor outcome and an increased risk of
relapse.
• The mechanisms underlying steroid resistance in patients with ALL are poorly
understood.
• Therefore, we performed an unbiased, comprehensive genetic analysis of pediatric
T-ALL, as well as in vitro functional analyses to validate associations between the
identified mutations and steroid resistance.
What Did the Researchers Do and Find?
• We performed whole genome and targeted exome sequencing in patients with T-
ALL and identified mutations in 151 genes, many of which are involved in cytokine
signaling, transcriptional regulation, cell death, cell cycle, chromatin modification,
and cellular transport.
• Mutation data were integrated with changes in chromosomal copy number and were
correlated with the patients’ clinical features and underlying biological characteris-
tics. Mutations in the IL7R signaling components JAK1 and KRAS were correlated
with steroid resistance and poor outcome.
• Sequencing of IL7R signaling molecules in a larger pediatric T-ALL cohort revealed
mutations in 32% of patients.
• Expressing specific mutant and/or wild-type IL7R signaling molecules in two ste-
roid-sensitive T-ALL cell lines induced steroid resistance via robust downstream sig-
naling through MEK-ERK and AKT, thereby reducing steroid-induced apoptosis.
Moreover, treating these cells with inhibitors of IL7R signaling restored steroid
sensitivity.
• Primary T-ALL cells obtained from patients were treated with steroids either alone
or in combination with IL7R signaling inhibitors. We found that including these
inhibitors significantly enhanced steroid-induced cell death.
What Do These Findings Mean?
• These results should be tested further in prospective patient cohorts, to investigate
the possibility that including IL7R signaling inhibitors in treatment regimens could
restore or enhance steroid sensitivity in patients with ALL, thereby improving clini-
cal outcomes.
IL7R Signaling Mutations Confer Steroid Resistance in T-ALL
PLOS Medicine | DOI:10.1371/journal.pmed.1002200 December 20, 2016 3 / 33

Introduction
In children with acute lymphoblastic leukemia (ALL), response to therapy, including in vitro
or in vivo steroid response, is a strong predictor of survival and cure [1–3]. ALL can be classi-
fied as T cell ALL (T-ALL) or B cell precursor ALL (BCP-ALL): T-ALL, particularly, has a high
risk of relapse and is refractory to further treatment due to acquired therapy resistance. The
mechanisms that underlie steroid resistance are poorly understood. In contrast to cell lines,
which often harbor mutations and/or deletions in the steroid receptor NR3C1 [4], mutations
are relatively rare among patients with ALL [5,6]. Upon steroid binding, NR3C1 translocates
to the nucleus and drives the expression of target genes [7]. To date, steroid resistance has not
been associated with reduced NR3C1 expression, expression of NR3C1 splice variants [8–10],
or reduced expression of chaperone proteins [11,12]. Therefore, steroid resistance seems to be
independent of changes in the NR3C1 gene itself in most patients with steroid-resistant
T-ALL. Several mechanisms have been proposed to explain steroid resistance in T-ALL includ-
ing activation of AKT1, which phosphorylates serine 134 of NR3C1, thereby preventing
nuclear translocation [13]. Also, elevated MYB and BCL2 concentrations may promote sur-
vival following steroid treatment [14]. Activated NOTCH1 may confer steroid resistance by
repressing expression of NR3C1 and PTEN [15]. Mutations in RAS have been shown to be
associated with steroid resistance in BCP-ALL and are prevalent in relapsed patients [16–18].
Recently, CASP1 and its activator, NLRP3, were also shown to be associated with steroid resis-
tance in ALL [19].
In this study, we aimed to provide an unbiased and comprehensive analysis of the molecu-
lar mechanisms that drive T-ALL and to resolve the cellular mechanisms that underlie steroid
resistance. For this, we performed whole genome sequencing (WGS) and targeted exome
sequencing (TES) in diagnostic patient samples obtained from pediatric T-ALL patients.
Mutation data were integrated with copy number changes as determined by array comparative
genomic hybridization (aCGH) to capture the full complexity of genomic mutations in
T-ALL. Identification of steroid resistance mechanisms may provide therapeutic treatment
options to improve sensitivity to this cornerstone chemotherapeutic drug in ALL treatment,
improve cure rates, and help reduce detrimental late side effects of intensive treatment sched-
ules through dose reduction.
Methods
Study Outline
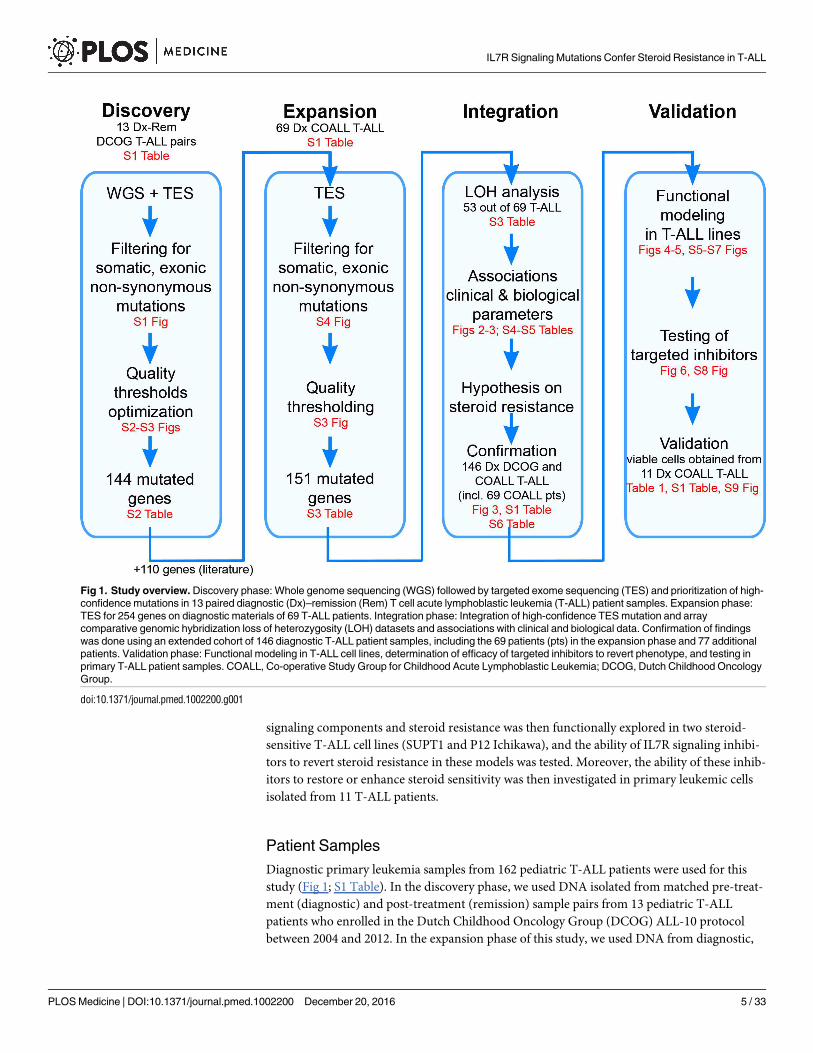
This study did not have a protocol or prospective analysis plan. An outline of this study is pro-
vided in Fig 1. Briefly, to obtain insight into the genetic landscape of pediatric T-ALL, we per-
formed WGS on paired diagnostic–remission samples from 13 patients covering all of the
most predominant genetic subtypes in T-ALL. Recurrence of identified mutations was then
established by applying a TES approach to a cohort of diagnostic samples from 69 well-charac-
terized pediatric T-ALL patients, and these mutation data were further integrated with copy
number data for mutant genes as obtained by aCGH. The mutation/aberration statuses of 151
genes that were identified were then correlated with the patients’ clinical features and underly-
ing biological characteristics including in vitro drug response, T-ALL subtype, and outcome.
We found that mutations in components (KRAS and JAK1) of the IL7R signaling pathway cor-
related with steroid resistance and poor outcome. We then used a PCR–Sanger sequencing
approach to identify mutations in other IL7R signaling components, including IL7R, JAK1,
JAK3, NF1, NRAS, KRAS, and AKT genes, in an expanded cohort of diagnostic patient samples
including these 69 patients and 77 additional T-ALL patients. The association between mutant
IL7R Signaling Mutations Confer Steroid Resistance in T-ALL
PLOS Medicine | DOI:10.1371/journal.pmed.1002200 December 20, 2016 4 / 33
signaling components and steroid resistance was then functionally explored in two steroid-
sensitive T-ALL cell lines (SUPT1 and P12 Ichikawa), and the ability of IL7R signaling inhibi-
tors to revert steroid resistance in these models was tested. Moreover, the ability of these inhib-
itors to restore or enhance steroid sensitivity was then investigated in primary leukemic cells
isolated from 11 T-ALL patients.
Patient Samples
Diagnostic primary leukemia samples from 162 pediatric T-ALL patients were used for this
study (Fig 1; S1 Table). In the discovery phase, we used DNA isolated from matched pre-treat-
ment (diagnostic) and post-treatment (remission) sample pairs from 13 pediatric T-ALL
patients who enrolled in the Dutch Childhood Oncology Group (DCOG) ALL-10 protocol
between 2004 and 2012. In the expansion phase of this study, we used DNA from diagnostic,
Fig 1. Study overview. Discovery phase: Whole genome sequencing (WGS) followed by targeted exome sequencing (TES) and prioritization of high-
confidence mutations in 13 paired diagnostic (Dx)–remission (Rem) T cell acute lymphoblastic leukemia (T-ALL) patient samples. Expansion phase:
TES for 254 genes on diagnostic materials of 69 T-ALL patients. Integration phase: Integration of high-confidence TES mutation and array
comparative genomic hybridization loss of heterozygosity (LOH) datasets and associations with clinical and biological data. Confirmation of findings
was done using an extended cohort of 146 diagnostic T-ALL patient samples, including the 69 patients (pts) in the expansion phase and 77 additional
patients. Validation phase: Functional modeling in T-ALL cell lines, determination of efficacy of targeted inhibitors to revert phenotype, and testing in
primary T-ALL patient samples. COALL, Co-operative Study Group for Childhood Acute Lymphoblastic Leukemia; DCOG, Dutch Childhood Oncology
Group.
doi:10.1371/journal.pmed.1002200.g001
IL7R Signaling Mutations Confer Steroid Resistance in T-ALL
PLOS Medicine | DOI:10.1371/journal.pmed.1002200 December 20, 2016 5 / 33

pre-treatment patient material from 69 patients who enrolled in the German Co-operative
Study Group for Childhood Acute Lymphoblastic Leukemia (COALL) protocol between 1997
and 2003 (COALL-97). Initial findings were then confirmed in a larger cohort of diagnostic,
pre-treatment T-ALL patient materials including DNA from the previously mentioned 69
COALL patients plus that of five additional patients who also enrolled in the COALL-97 proto-
col and 72 additional T-ALL patients who enrolled in the DCOG protocols ALL-7/8 (n = 30)
or ALL-9 (n = 42). Functional validation was done on viably frozen pre-treatment leukemia
cells from peripheral blood or bone marrow from eight of the 74 patients who enrolled in the
COALL-97 protocol (as mentioned above) plus two additional patients who enrolled in the
COALL-03 study and one patient who enrolled in the DCOG ALL-10 study. Median follow-
up for patients who enrolled in the DCOG ALL-7/8/9 (1988–2004) and COALL-97 protocols
was 67 and 52 mo, respectively. The patients’ parents or legal guardians provided informed
consent to use leftover diagnostic material for research with approval from the institutional
review board of the Erasmus MC Rotterdam and in accordance with the Declaration of Hel-
sinki. Leukemia cells were harvested from blood or bone marrow samples and enriched to a
purity of at least 90% as described previously [20].
Whole Genome Sequencing
Sequencing of 13 T-ALL tumor pairs in the discovery cohort (S1 and S2 Tables) was performed
at Complete Genomics (Mountain View, California) using unchained combinatorial probe-
anchor ligation chemistry on arrays of self-assembling DNA nanoballs producing 35-bp
paired-end reads [21]. The average gross mapping yield for the 26 genomes was 183 Gb. On
average 96.5% of the genome was called with 55× coverage or higher. Structural variants in the
whole-genome-sequenced DNA of the 13 patients were detected using Complete Genomics’
cgatools (version 2.0.2.17) and were compared to the NCBI reference genome build 37. For
this, junctions were identified that were not adjacent according to the reference sequence. Sub-
sequently, somatic junctions were discovered as junctions detected in the tumor samples that
were absent in the matching normal samples. Finally, we filtered for somatic high-confidence
junctions using the following criteria: (1) there are at least ten mate pairs in the discordant
reads cluster; (2) the de novo assembly of the junction is successful; (3) the junction exhibits
high mapping diversity, i.e., the distance between the first position of the left-most mate read
and the last position of the right-most mate read in the discordant reads cluster is more than
70 bp; (4) known underrepresented repeat sequences are not involved, e.g., ALR/Alpha; (5) the
variant is absent in dbSNP build 132; (6) the variant does not result from deletion events of
transposable elements (AluY and L1 subclasses); and (7) the variant is absent in 52 normal
genomes that served as the baseline reference set (ftp://ftp2.completegenomics.com/Baseline_
Genome_Set/SVBaseline/).
For mutation detection, reads were aligned to the NCBI build 36 reference genome by
applying a local de novo assembly approach, and variations were called using Complete Geno-
mics software v1.8 and v1.12. In each sample, 3.4 × 10⁶ single nucleotide variants (SNVs),
221.7 × 10³ small insertions, 234.5 × 10³ small deletions, and 77.3 × 10³ substitutions were
detected on average. For this study, we focused on tumor-specific, non-synonymous mutations
in exons, excluding sequence polymorphisms as present in NCBI dbSNP databases or the 1000
Genomes Project databases. This revealed 460 SNVs and 808 small insertions or deletions
(INDELs) (S1 Fig) in the exons of the 13 T-ALL patients in total. To optimize thresholds for
Complete Genomics quality parameters, we validated 46 mutations by PCR and Sanger
sequencing. We found two quality parameters informative to distinguish true from falsely
called mutations (S2A Fig). One is total score (TS), representing the confidence in the called
IL7R Signaling Mutations Confer Steroid Resistance in T-ALL
PLOS Medicine | DOI:10.1371/journal.pmed.1002200 December 20, 2016 6 / 33
mutation. The other is somatic score (SS), representing the confidence that the mutation is
present in the tumor and absent in the matched remission sample. These two scores were cal-
culated using Complete Genomics software v1.8 and v1.12 and CGA Tools 1.4.0. Based on the
receiver operating characteristic (ROC) curves (S2B Fig), SS� 0.1 and TS� 100 were used as
thresholds to reliably call somatic mutations with high confidence. Based on these thresholds,
137 genes were found to carry 178 high-confidence SNV or INDEL mutations (S1 Fig). The
WGS sequence data of 26 genomes, aligned to the human reference genome (NCBI build 36),
have been deposited in the European Nucleotide Archive with accession numbers
ERS934791–ERS934816.
PCR Amplification and Sanger Sequencing
PCR reactions were performed using 25–50 ng of genomic DNA, 300 nM primers, 200 μM
dNTPs, 2 mM MgCl2, and 1.25 units of AmpliTaq Gold (Applied Biosystems) in 1× PCR
Buffer II (Applied Biosystems) in a volume of 50 μl. PCR products were purified with the Milli-
pore Vacuum Manifold filter system and sequenced (BigDye Terminator v3.1 Cycle Sequenc-
ing Kit, Applied Biosystems) on the ABI PRISM 3130 DNA Analyzer (Applied Biosystems).
Targeted Exome Sequencing
To compare WGS with TES variant calling and to validate and determine quality parameters
for WGS and TES, respectively, we performed TES for 410 mutated genes as found by WGS in
the diagnostic samples of the 13 discovery cohort patients (S1 and S2 Tables). These genes
included all 137 genes with high-confidence mutations and 273 mutated genes that had lower
WGS quality scores.
Enrichment of exonic DNA sequences from genomic DNA was performed using Agilent
SureSelect MP4 arrays (2-Mb capture region, with>2× average coverage). Sequencing was
performed at ServiceXS. (Leiden, The Netherlands) using the Illumina HiSeq 2000 platform,
which produced 100-bp paired-end reads. Image analysis, base calling, and quality check were
performed using the Illumina data analysis pipeline RTA v1.13.48 and/or OLB v1.9 and
CASAVA v1.8.2. Prior to alignment, reads were filtered based on the following quality thresh-
olds: read trimming at Phred quality score 20 and minimal read length 36. The reads were
then aligned to the NCBI build 37 reference genome using a short read aligner based on Bur-
rows-Wheeler Transform [22] with a mismatch rate of 4%. SNV and INDEL mutations were
identified using a ServiceXS in-house pipeline based on Bayesian statistics with the following
thresholds: minimal coverage of 5× for INDELs and 10× for SNVs, with a minimal variant fre-
quency of 30%.
Mutations detected by both WGS and TES platforms can be regarded as true mutations
and hence helped to define the quality threshold parameters for the TES approach. More than
60% of predicted exonic, non-synonymous SNVs identified by TES had not been identified by
WGS (S3 Fig). Exploiting the overlapping mutations detected by both platforms, we trained a
one-class classifier to determine the quality parameter boundaries for mutation detection by
TES. The TES quality parameters include read depth and the variant overall quality score. For
SNV calling, we trained a Gaussian one-class classifier using ddtools [23] (S3A Fig). The per-
formance of the Gaussian classifier is presented by the ROC curve in S3B Fig. The boundary
was chosen to call mutations with a false negative rate (FNr) of 0.10, resulting in a false positive
rate (FPr) of 0.28. Given the distribution of the INDEL training set as shown in S3C Fig, a sim-
ple decision tree classifier for calling INDEL mutations was built that resulted in a FNr of 0.10
and a FPr of 0.63, confirming the low concordance of INDEL mutations by both platforms.
IL7R Signaling Mutations Confer Steroid Resistance in T-ALL
PLOS Medicine | DOI:10.1371/journal.pmed.1002200 December 20, 2016 7 / 33
To evaluate the recurrence of 137 high-confidence mutated genes and seven validated low-
confidence mutated genes as identified by WGS (S2 Table), we sequenced the diagnostic sam-
ples of 69 genetically and clinically well-annotated T-ALL patients by TES for these 144 genes,
together with an additional set of 110 genes that are recurrently mutated in leukemia [24,25]
(S1 and S3 Tables). The mean coverage by TES was 561×, and 89% of all captured exons were
covered by more than 100 reads. A stringent filtering strategy, as used for WGS (S4 Fig), was
then applied to the TES results. Polymorphisms present in an expanded panel of genetic varia-
tion databases (listed in the next section) were excluded, providing an effective filter to exclude
germline variants in the expanded cohort of 69 T-ALL patients for whom paired normal sam-
ples were not available [26]. The TES sequence data of the 13 discovery cohort patients and the
69 expansion cohort patients have been aligned to the human reference genome (NCBI build
37) and are deposited in the European Nucleotide Archive with accession numbers
ERS935731–ERS935812.
Genetic Variation Databases for TES
We increased the number of genetic variation databases to filter out polymorphisms from
the mutation dataset as determined by TES by including dbSNP [27] versions 130, 131, 132,
and 135; 1000 Genomes Project database [28] versions 2010 November and 2012 April; the
ESP6500 database (http://evs.gs.washington.edu/EVS/); the Core and Diversity Panels in
Huvariome [29], and an in-house dataset of 1,302 exomes from Radboud University Medical
Center, Nijmegen, The Netherlands [30]. In addition, we excluded mutations that were also
identified in the 13 remission samples by WGS. We retained mutations that represented poly-
morphisms according to the databases mentioned above when variations involving the same
amino acids were annotated in the COSMIC database. By applying stringent filtering against a
broad range of genetic variation databases, we aimed to remove as many germline variants as
possible. To segregate germline polymorphisms from somatic mutations in patient samples in
the absence of paired normal control samples, variations observed in thousands of unrelated
individuals provide an effective filter [26].
Copy Number Aberrations
We performed copy number analysis based on aCGH using SurePrint G3 Human CGH
2×400K arrays (Agilent Technologies) in diagnostic leukemia samples of 53 out of the 69
expansion cohort patients whose genomes were sequenced by TES (S3 Table). The array
images were processed to obtain the log10 ratio of red and green channel signals, after back-
ground correction and dye normalization using Agilent Feature Extraction software (version
10.5.1.1). The probe chromosomal locations were annotated using the NCBI reference genome
build 36. Afterwards, the log ratios were subjected to a noise-reduction algorithm, the Waves
aCGH Correction Algorithm [31], to reduce the wave artifact characterized by an undulating
aCGH profile along the chromosome. This algorithm corrects biases that are caused by differ-
ences in labeling intensities of DNA fragments, which depend on GC content and fragment
size as well as the hybridization efficiencies of labeled fragments to corresponding hybridiza-
tion probes on the array. Afterwards, the log10 ratios (L) were converted to copy number
(CN) as CN = 2 × 10L. Amplifications and deletions were then called if three consecutive
probe sets in a gene had a CN value beyond average CN ± 2 × the standard deviation of CN
of the corresponding probe sets among all samples.
IL7R Signaling Mutations Confer Steroid Resistance in T-ALL
PLOS Medicine | DOI:10.1371/journal.pmed.1002200 December 20, 2016 8 / 33
SNP Array Analysis
The allele-specific copy number of the diagnostic sample from patient #10793 was obtained
using Affymetrix SNP Array 6.0 with 680-bp median intermarker spacing. For this, 500 ng
of genomic DNA isolated from the diagnostic and remission samples was used as input. Raw
signal intensities were analyzed using Partek Genomics Suite. First, probe intensities were
adjusted for a number of properties that are correlated with intensity, including fragment
length, GC content, and other sequence-based hybridization bias. After quantile normaliza-
tion, paired analysis was performed to generate allele-specific copy numbers by comparing the
diagnostic sample to the remission sample.
Pathway Enrichment Analysis
Pathway enrichment analysis was performed on 127 genes that had mutations or copy number
aberrations in more than one patient sample in the expansion cohort. Two approaches were
applied. One used the Database for Annotation, Visualization and Integrated Discovery
(DAVID) v6.7. The functional annotation clustering reports of enriched biological pathways
and molecular functions annotated by Gene Ontology can be found in S4 Table. The other
approach used Ingenuity Pathway Analysis to identify enriched canonical pathways in these
127 recurrent genes. Default settings were applied except for setting the species to human only.
The p-values indicated are calculated using a two-sided Fisher’s exact test.
Gene Expression Profiling
The gene expression profiling dataset of the 117 pediatric T-ALL cases as produced by micro-
array [32] is available at GEO (http://www.ncbi.nlm.nih.gov/geo/) under accession number
GSE26713.
Statistical Tests
For the 69 COALL cohort samples in the expansion phase, we related the mutational statuses
and copy number aberrations in 151 genes (S3 Table) to three clinical/biological parameters:
T-ALL subtype (as defined previously [32]), in vitro prednisolone LC50 level, and survival out-
come. In these analyses, the presence of mutations (Mut), deletions (Del), amplifications (Amp),
and the combinations MutDel, MutAmp, or MutAber (i.e., mutations and/or copy number aber-
rations including deletions and amplifications) in each gene was tested against the clinical/bio-
logical parameters. Each gene with a specific feature (e.g., JAK1_Mut) was tested individually.
The features are binary (present/absent), which means multiple incidences of the same feature in
the same gene for the same patient sample are aggregated. For example, JAK1_Mut = “present”
in a patient sample means that there is at least one JAK1 mutation identified in the sample. Asso-
ciations between any of these six features and T-ALL subtype were calculated using Fisher’s
exact test. Associations with in vitro prednisolone LC50 were calculated using the Kruskal-Wallis
test. All p-values are two-sided. Associations with survival were calculated using the log-rank
test. For all test results, p-values were used to prioritize our hypotheses on associations and there-
fore remained nominal without multiple testing corrections. A threshold of nominal p< 0.05
was used to present findings that are potentially more relevant. Using this threshold, genes that
are associated with reduced drug sensitivity, poor event-free or relapse-free survival, or particular
T-ALL subtypes are summarized in S5 Table. Given the data availability of the patient samples
(S1 Table), the number of tests varies for different associations and is indicated in S5 Table.
In the integration phase, we validated the associations identified in the expansion phase.
For this, we performed PCR–Sanger sequencing for IL7R, JAK1, JAK3, NF1, NRAS, KRAS, and
IL7R Signaling Mutations Confer Steroid Resistance in T-ALL
PLOS Medicine | DOI:10.1371/journal.pmed.1002200 December 20, 2016 9 / 33

AKT genes (i.e., IL7R signaling pathway genes) in the confirmation cohort of 146 patients
comprising the 69 patients from the expansion phase and 77 additional pediatric T-ALL
patients. The presence of mutations in these genes as well as available information on genetic
aberrations affecting the PTEN gene were used to segregate patients into three groups, i.e.,
those with mutations in the IL7R signaling pathway, those with mutations in PTEN, and the
rest of the patients. Association between IL7R pathway mutations and T-ALL subtype was
tested by Fisher’s exact test. Association between IL7R pathway mutations and in vitro pred-
nisolone LC50 was tested by Kruskal-Wallis test in 97 patients for whom in vitro prednisolone
response data were available. Association between IL7R pathway mutations and survival was
tested using the log-rank test.
Gateway Cloning of Lentiviral Expression Vectors and Virus Production
Gateway multi-site recombination (Invitrogen) was used to simultaneously clone multiple
DNA fragments into our Gateway-adapted lentiviral pLEGO-iC2 destination vector (Addgene).
First, the parental pLEGO-iC2 vector was converted into a Gateway destination vector by
replacing the pSFFV-MCS-IRES-mCherry insert with the Gateway Cassette A. Cassette A, com-
prising the ccdB and chloramphenicol resistance genes flanked by attR recombination sites, was
amplified by PCR and cloned into the ApaI/PciI-digested pLEGO-iC2 vector. Lentiviral expres-
sion vectors were assembled using Gateway recombination of the lentiviral destination vector
with four synthetically synthesized entry vectors (Eurogentec): (1) attL1/attR5-flanked doxycy-
cline-inducible promoter (third generation, Clontech); (2) attL5/attL4-flanked human cDNA
sequence; (3) attR4/attR3-flanked DDK-tag followed by a stop codon, WPRE sequences, and a
constitutive pSFFV promoter; and (4) attL3/attL2-flanked TETon-T2A (Thosea asigna virus 2A
peptide)–puromycin resistance cassette or TETon-T2A-LNGFR (truncated or ΔNGFR)
reporter. LR-recombination reactions were performed according to the manufacturer’s instruc-
tions. For the shRNA experiments, PLKO.1-puro lentiviral shRNA constructs directed against
the human NR3C1 gene were selected from the MISSION T shRNA Library (Sigma-Aldrich).
For lentivirus production, HEK293T cells were transfected with lentiviral expression vector
DNA and pMD2.G (VSV-G), pMDLg/pRRE, and pRSV-REV support vectors (Addgene) using
X-tremeGENE HP DNA Transfection Reagent (Roche). Transfection was performed in
DMEM supplemented with 10% heat-inactivated fetal calf serum (FCS), 1× Glutamax, 1% peni-
cillin/streptomycin, and 0.25 μg/ml Fungizone, and the HEK293T cells were cultured overnight
in a humidified incubator at 37˚C and 5% CO2. Following transfection, lentivirus particles were
produced and collected in serum-free Opti-MEM1 (Thermo Fisher Scientific) for up to 48 h.
Culture medium containing lentiviral particles was collected, filtered through a 0.45 μM Minis-
art filter (Sartorius), and concentrated by centrifugation at 4˚C using a VIVASPIN 20 concen-
tration column (Sartorius). Viral particles were stored at −80˚C.
Generation of Cell Lines
Lentiviral transduction was used to obtain SUPT1 and P12 Ichikawa T-ALL cell lines contain-
ing a variety of expression vectors. For this, viral batches were serially diluted in 96-well plates
in a total volume of 50 μl of Opti-MEM1 medium, and 50,000 cells were added in Advanced
RPMI 1640 medium (Thermo Fisher Scientific) supplemented with 2% heat-inactivated FCS,
1× Glutamax, 1% penicillin/streptomycin, and 0.25 μg/ml Fungizone. Cells were incubated at
room temperature for 30 min on a gently shaking platform, and further incubated for several
hours in a humidified incubator at 37˚C and 5% CO2. For overnight incubation, FCS was
added to a final concentration of 10%, after which the medium was refreshed. The transduc-
tion efficiency was determined 4 d later. To avoid multiple integrations per cell, only cells that
IL7R Signaling Mutations Confer Steroid Resistance in T-ALL
PLOS Medicine | DOI:10.1371/journal.pmed.1002200 December 20, 2016 10 / 33
were transduced by optimal virus concentrations (maximal transduction rate of 50%) were
further cultured in bulk and enriched by selection in medium containing 1–2 μg/ml puromy-
cin. The bulk-selected cells were used for subsequent experiments.
Cytotoxicity Assays
Bulk transduced lines were maintained in culture medium at a concentration of 0.25–1.5 × 10⁶
cells/ml and refreshed twice weekly. To induce expression from the lentiviral vector, cells were
grown in the presence of 0.5 mg/ml doxycycline prior to the cytotoxicity testing. Cytotoxicity
was tested in the presence of a single concentration or a serial dilution of a variety of drugs or
inhibitors as indicated: prednisolone (15 mg/ml–0.007 μg/ml), L-asparaginase (100–0.032 IU/
ml), vincristine (2.5–0.10 ng/ml), 2 μM ruxolitinib (JAK1 inhibitor, Selleck Chem #S1378),
2 μM MK2206 (AKT inhibitor, Selleck Chem #S1078), 10 μM CI1040 (MEK inhibitor, Axon
Medchem #Axon 1368), and 2 μM CAS 667463-62-9 (GSK3 inhibitor IX, Santa Cruz Biotech-
nology #sc-202634). Cells were incubated for 72 or 96 h in a humidified incubator at 37˚C and
5% CO2 as specified in figure legends. Viable cell numbers were counted based on forward-
and side-scatter parameters using flow cytometry (MACSQuant, Miltenyi Biotec), and data
were analyzed using FlowJo software v10 (Treestar). Percent of viable cells after drug exposure
was normalized to the percentage of viable untreated control cells, whereas percent of viable
cells after exposure to a drug in combination with an inhibitor was normalized to the viability
of inhibitor-treated control cells. The selected concentration of the inhibitors was such that the
viability of inhibitor-treated control cells deviated not more than 20% compared to the viabil-
ity of untreated control cells. Graphs were made using Graphpad PRISM 6 software.
Western Blot Analysis and Antibodies
Primary antibodies used for Western blot detection of proteins were obtained from Cell Sig-
naling Technology, unless specified otherwise: phospho-AKT S473 (#9271), phospho-JAK1
(#3331), phospho-STAT5 (#9351), phospho-MEK1/2 (#9154), phospho-ERK1/2 (#4370),
phospho-mTOR S2448 (#2971), phospho-p70S6 Kinase T421/S424 (#9204), BAD (Abcam
#AB32455), phospho-BAD S136 (#4366), BIM (Abcam #AB15184), phospho-BIM S55
(#4550), phospho-BIM S69 (#4581), phospho-CREB S133 (#9198), phospho-ATF1 (#9198),
BCL2 (Santa Cruz Biotechnology #sc-130308), BCLXL (#2764), MCL1 (Sigma #HPA008455),
PUMA (Abcam #AB33906), cMYB (#12319), phospho-IKKab S176/S177 (#2978), phospho-
IKKab S176/S180 (#2697), GSK3AB (#5676), phospho-GSK3AB S21/9 (#9331), phospho-p38/
MAPK T180/Y182 (#4511), GCR (Santa Cruz Biotechnology #sc-1003), phospho-GCR S211
(Abcam #AB3579), DYKDDDDK Tag Antibody (#2368), CD127 (IL7R) (R&D Systems
#MAB306), RAS (Millipore #05–516), and β-actin (Abcam #AB6276). Following staining of
Western blots using IRDye fluorescent secondary antibodies, fluorescent intensities were
scanned and quantified using an Odyssey imager (LI-COR) and normalized to β-actin expres-
sion levels.
Inhibitor Testing and Curve Shift Synergy Experiments on Primary
T-ALL Patient Samples
Single drug or inhibitor cytotoxicity assays were carried out as described previously in 384-
well plates for 72 h [33]. Briefly, 10,000 primary T-ALL patient cells from viably frozen stocks
were plated in 45 μl of culture medium (Advanced RPMI 1640 medium [Thermo Fisher Scien-
tific] containing 20% heat-inactivated fetal bovine serum, 1× Glutamax, 1% penicillin/strepto-
mycin, 25 μg/ml gentamycin, and 0.25 μg/ml Fungizone) 2 h before drugs or inhibitors were
added. To determine the IC50, each drug or inhibitor was dissolved in 100% DMSO in
IL7R Signaling Mutations Confer Steroid Resistance in T-ALL
PLOS Medicine | DOI:10.1371/journal.pmed.1002200 December 20, 2016 11 / 33

approximately 10,000-fold the estimated IC50 concentration, diluted in a nine-point dilution
series in duplicate in DMSO, which was then 100-fold diluted in HEPES buffer (pH = 7.4). For
the assay, 5 μl of each single drug or compound dilution was added to the preplated cells in a
final concentration that ranged from 1 nM to 10,000 nM for all compounds in 0.1% DMSO.
As an indirect measure of total cell viability after 72 h of incubation, the intracellular ATP con-
tent was measured. The plates were cooled to room temperature, and the cells were incubated
with 25 μl of ATPlite 1step solution (PerkinElmer) per well. Luminescence was recorded on an
Envision multimode reader (PerkinElmer), and results were normalized to the measurements
of control wells containing only 0.1% DMSO. IC50 values were fitted manually by nonlinear
regression using XLfit5 software (IDBS). Maximum and minimum signals were locked, where
appropriate, to obtain the best fit as indicated by the F-test as implemented in XLfit5. If IC50
values did not fall within the tested concentration range, drugs or inhibitors were retested after
further dilution. For curve shift synergy experiments of drug–inhibitor combinations, inhibi-
tor stocks were diluted in DMSO on the day of the experiment to concentrations of 10,000
times their IC50 values, as determined in the single agent experiments. Single drug or inhibitor
dilutions as well as drug–inhibitor combination mixtures in 1:1, 4:1, and 1:4 ratios were pre-
pared, and diluted in DMSO into seven-point dose–response series in duplicate. Further dilu-
tion and addition to the cells was performed as described above. Because of the IC50
matching, all stock solutions and mixtures would be equipotent in the absence of synergy or
antagonism. For the single drug or inhibitor experiments, final assay concentrations were
between 10 and 0.01 times their IC50 values. For single drug or inhibitor curves, IC50 values
were fitted on the percent-effect data by nonlinear regression using XLfit5. To correct for
interassay variation, the IC50 values of the single agents in the synergy experiment were used
to calculate the synergy for the drug–inhibitor combination experiments. The combination
index (CI) as a quantitative measure of synergy for drug–inhibitor combinations [34] was cal-
culated as described previously [35]. CI values lower than 1.0 indicate synergy of drug–inhibi-
tor combinations; CI values lower than 0.3 indicate strong synergy. CI values higher than 1.5
indicate antagonistic effects of drug–inhibitor combinations.
Results
Whole Genome and Targeted Exome Sequencing of Pediatric T-ALL
Patient Samples
To determine the mutational landscape of pediatric T-ALL patients, we used an integrated
approach combining mutation data, copy number data, and clinical information obtained
from 82 pediatric T-ALL patients (Fig 1; S1 Table). First, we performed WGS on paired diag-
nostic–remission samples from 13 patients at Complete Genomics [21]. These patients covered
all known genetic subtypes including two early thymic progenitor ALL (ETP-ALL) cases; cases
harboring TLX3 (five cases), TLX1 (one case), NKX2-1 (one case), HOXA (one case), KTM2A/MLL (one ETP-ALL case), or TAL1 (one case) chromosomal rearrangements; and cases for
which driving oncogenic events remain unknown (three patients, including one ETP-ALL
case) [32]. Extensive filtering (S1 Fig) and first quality parameter optimization was performed
that was validated by PCR–Sanger sequencing (S2 Fig). We established the optimal quality
parameter thresholds for WGS analysis to robustly call high-confidence mutations as being
0.1 and 100 for SS and TS, respectively. We further confirmed these thresholds by TES using the
Illumina HiSeq 2000 platform of 410 genes from the diagnostic samples of these same 13 T-ALL
patients (S1 and S2 Tables). These genes included 137 genes containing 178 high-confidence
mutations (85 SNVs and 93 INDELs) and 273 genes containing 377 predicted low-confidence
mutations (139 SNVs and 238 INDELs). We confirmed 74 out of 85 (87%) high-confidence
IL7R Signaling Mutations Confer Steroid Resistance in T-ALL
PLOS Medicine | DOI:10.1371/journal.pmed.1002200 December 20, 2016 12 / 33
SNVs and two out of 93 (2%) high-confidence INDEL mutations, in contrast to seven out of
139 (5%) low-confidence SNVs and zero out of 238 low-confidence INDEL mutations. These
findings indicate that the chosen quality parameter thresholds for WGS were suitable to identify
high-confidence mutations. Moreover, the overlap between WGS and TES results was further
used to optimize the TES quality parameter threshold setting (S3 Fig).
In addition to mutations, we identified by WGS 185 somatic intrachromosomal breakpoint
junctions (average 14 per patient, range 5–25) and 40 interchromosomal breakpoint junctions
(average three per patient, range 2–11) that represented 183 predicted rearrangements including
78 deletions, 28 duplications, 16 inversions, 16 translocations, and 45 complex rearrangements
in these 13 patients (S2 Table). In all, 182 out of 225 chromosomal junctions had evidence for
inclusion of random nucleotides (average 18 nucleotides, range 1–221) that point to the involve-
ment of the RAG recombination machinery. This presence of random nucleotides was also the
case for most chromosomal junctions identified in the two ETP-ALL patients, both of whom
arrested at early thymic progenitor stages that precede RAG-mediated T cell receptor gene
recombination events. Breakpoints for known driving oncogenic rearrangements as predicted
using fluorescence in situ hybridization or real-time quantitative PCR were identified in ten out
of 13 T-ALL patients. We could not pinpoint any specific oncogene-driving event from the vari-
ous rearrangements identified in two out of three T-ALL cases for which driving oncogenic rear-
rangements were unknown (#9255 and #9343). One ETP-ALL patient (#10793) had evidence for
chromothripsis in Chromosomes 7 and 14 (Fig 2A). Breakpoints for deletions, insertions, dupli-
cations, complex rearrangements, and translocations were identified in both chromosomes that
flank areas of allelic losses or gains according to SNP-based microarray analysis (Fig 2B). Multi-
ple breakpoints were identified close to the HOXA gene cluster. Multiple clustered breakpoints
frequently affected TCRAD and BCL11B loci and pointed to a rather organized form of chromo-
thripsis in this particular patient rather than random reassembly of disintegrated chromosomal
segments as frequently observed in patients with chromothripsis [36].
The Mutational Landscape of T-ALL and Associations with Steroid
Resistance
We then expanded our mutation analysis by performing TES on a cohort of diagnostic samples
from 69 well-characterized pediatric T-ALL patients (Fig 1; S1 Table) [37]. In total, 254 genes
were sequenced at a mean coverage of 561×, including the 144 validated genes identified in the
discovery cohort and 110 additional selected genes that are frequently mutated in ALL (S3
Table) [24,25]. Following stringent filtering (S4 Fig), 401 mutations were identified in 151
genes (S3 Table). These mutations were then integrated with aCGH copy number data, which
were available for 53 out of 69 patients (S3 Table). The median number of genes harboring
mutations and/or copy number changes was six per patient (range 0–51). ETP-ALL patients
had more aberrations than other subtypes (p< 0.001, median 12, range 5–51) [32,38,39],
while TALLMO patients had fewer aberrations (p = 0.003, median 4, range 0–42). The median
number of aberrations in TLX and proliferative subtypes was 8.5 (range 4–10) and 6 (range
3–27), respectively. Sixty-six of the mutated genes have been previously identified in T-ALL,
and 83 mutated genes have been previously found in other types of leukemia or nonhemato-
poietic tumors. Two genes, RABL6 (a GTP-binding member of the Ras superfamily of small
GTPases) and IGHV3-64, have not previously been reported in mutated form in human can-
cer. Mutations mostly affected genes that are involved in cytokine signaling, transcription reg-
ulation, cell death, cell cycle, or chromatin modification or that encode transporters (Fig 2C;
S4 Table).
IL7R Signaling Mutations Confer Steroid Resistance in T-ALL
PLOS Medicine | DOI:10.1371/journal.pmed.1002200 December 20, 2016 13 / 33

Fig 2. Whole genome and targeted exome sequencing results for pediatric T-ALL patients at diagnosis. (A and B) Visualization of chromosomal
breakpoint junctions in diagnostic leukemia cells of ETP-ALL patient #10793. (A) Circos plot of somatic structural variations as detected in the diagnostic
sample (Dx) along with SNV densities (1-Mb window) and predicted LOH data as explained in the accompanying legend. Interchromosomal junctions are
displayed as red lines, and intrachromosomal junctions are displayed as grey lines. (B) Allele-specific copy number variations as determined by Affymetric
SNP Array analysis and multiple WGS-predicted chromosomal breakpoints as a consequence of chromothripsis affecting Chromosomes 7 and 14 are
displayed. In the copy number plots, black dots indicate the unsmoothed allele-specific copy numbers. Red dots are the smoothed maximal allele-specific
copy numbers using a sliding window of 30 SNP probes, while the green dots reflect the smoothed minimal allele-specific copy numbers. Chromosomal
breakpoint junctions are displayed for translocations (red arrows), inversions (blue arrows), deletions (green arrows), duplications (purple arrows), and
complex rearrangements (grey arrows). Affected (in black) and flanking (in grey) genes for the interchromosomal translocations are indicated. (C) Overview
IL7R Signaling Mutations Confer Steroid Resistance in T-ALL
PLOS Medicine | DOI:10.1371/journal.pmed.1002200 December 20, 2016 14 / 33
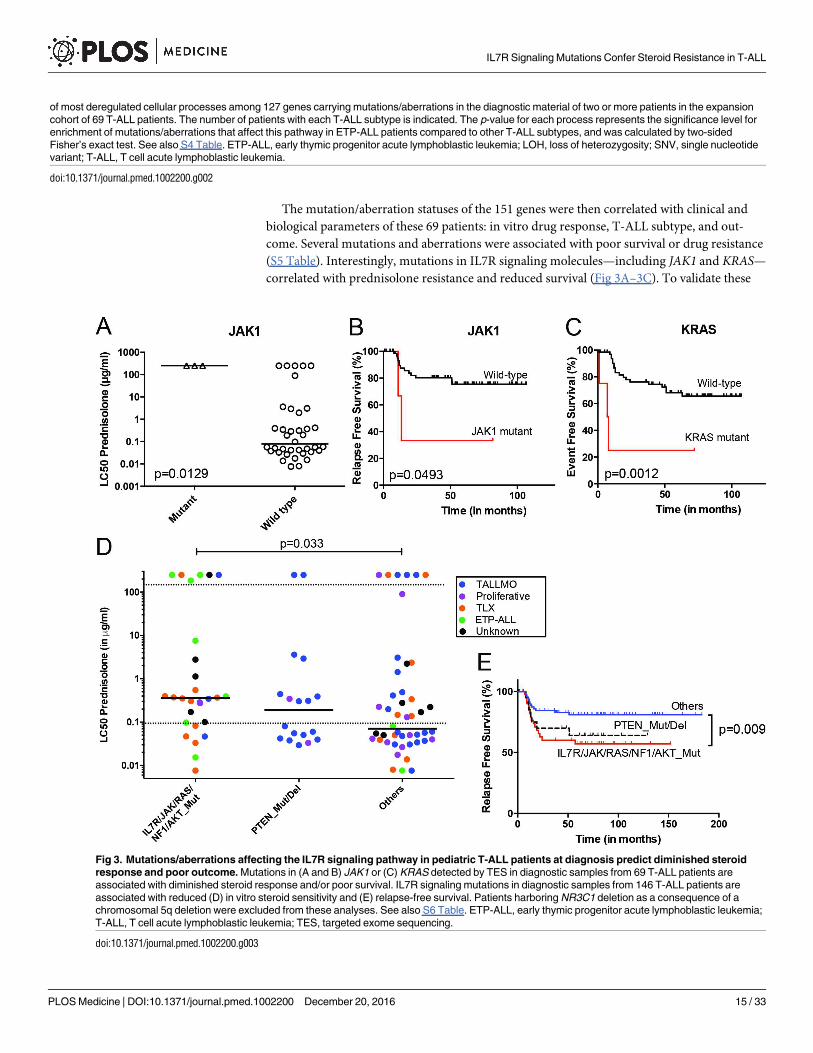
The mutation/aberration statuses of the 151 genes were then correlated with clinical and
biological parameters of these 69 patients: in vitro drug response, T-ALL subtype, and out-
come. Several mutations and aberrations were associated with poor survival or drug resistance
(S5 Table). Interestingly, mutations in IL7R signaling molecules—including JAK1 and KRAS—
correlated with prednisolone resistance and reduced survival (Fig 3A–3C). To validate these
of most deregulated cellular processes among 127 genes carrying mutations/aberrations in the diagnostic material of two or more patients in the expansion
cohort of 69 T-ALL patients. The number of patients with each T-ALL subtype is indicated. The p-value for each process represents the significance level for
enrichment of mutations/aberrations that affect this pathway in ETP-ALL patients compared to other T-ALL subtypes, and was calculated by two-sided
Fisher’s exact test. See also S4 Table. ETP-ALL, early thymic progenitor acute lymphoblastic leukemia; LOH, loss of heterozygosity; SNV, single nucleotide
variant; T-ALL, T cell acute lymphoblastic leukemia.
doi:10.1371/journal.pmed.1002200.g002
Fig 3. Mutations/aberrations affecting the IL7R signaling pathway in pediatric T-ALL patients at diagnosis predict diminished steroid
response and poor outcome. Mutations in (A and B) JAK1 or (C) KRAS detected by TES in diagnostic samples from 69 T-ALL patients are
associated with diminished steroid response and/or poor survival. IL7R signaling mutations in diagnostic samples from 146 T-ALL patients are
associated with reduced (D) in vitro steroid sensitivity and (E) relapse-free survival. Patients harboring NR3C1 deletion as a consequence of a
chromosomal 5q deletion were excluded from these analyses. See also S6 Table. ETP-ALL, early thymic progenitor acute lymphoblastic leukemia;
T-ALL, T cell acute lymphoblastic leukemia; TES, targeted exome sequencing.
doi:10.1371/journal.pmed.1002200.g003
IL7R Signaling Mutations Confer Steroid Resistance in T-ALL
PLOS Medicine | DOI:10.1371/journal.pmed.1002200 December 20, 2016 15 / 33

associations, we expanded our mutation analyses by PCR–Sanger sequencing to the IL7R,
JAK1, JAK3, NF1, NRAS, KRAS, and AKT genes in the diagnostic samples of these 69 patients
and 77 additional T-ALL patients. Mutations were identified in 47 out of 146 patients (32%)
and were associated with the ETP-ALL and TLX subtypes (p< 0.001; see S1 and S6 Tables for
details). In vitro prednisolone response data on these diagnostic samples were available for 97
patients, and in 28 out of 97 cases IL7R signaling mutations were associated with steroid resis-
tance (p = 0.033; Fig 3D; S6 Table). These patients also had a significantly worse outcome than
patients lacking these mutations (p = 0.009; Fig 3E). Inactivating events in PTEN in 18 out of
97 patients are associated with the TALLMO subtype [20,40], and these patients had predniso-
lone sensitivity levels that were similar to those of patients lacking IL7R signaling or PTENmutations. These data therefore suggest a potential relationship between IL7R signaling muta-
tions and steroid resistance.
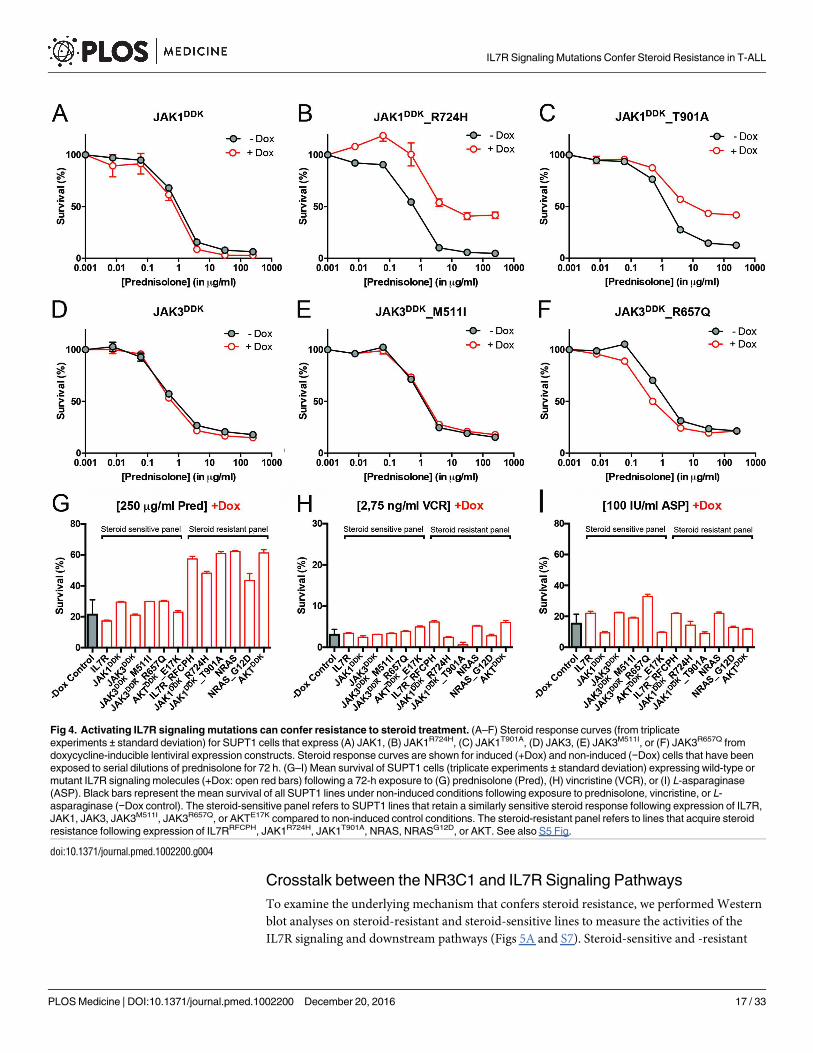
Mutations in IL7R Signaling Molecules Confer Steroid Resistance
To functionally explore whether IL7R signaling mutations may drive steroid resistance, we
tested whether expression of mutant IL7R signaling molecules—versus their wild-type coun-
terparts—can confer steroid resistance in two steroid-sensitive T-ALL lines, namely SUPT1
and P12 Ichikawa. All mutant signaling molecules expressed from doxycycline-inducible
expression constructs—including IL7RRFCPH, JAK1R724H, JAK1T901A, JAK3M511I, JAK3R657Q,
NRASG12D, and AKTE17K—were able to trigger IL3-independent growth in Ba/F3 cells, in con-
trast to their wild-type isoforms, confirming that these mutations can transform cells [41]. In
SUPT1 and P12 Ichikawa T-ALL backgrounds, expression of the cysteine mutant IL7RRFCPH
conferred steroid resistance, while the wild-type IL7R and the non-cysteine IL7RGPSL mutant
receptors did not (S5 Fig). Both mutant JAK1 molecules—but not wild-type JAK1—conferred
steroid resistance (Fig 4A–4C). Surprisingly, JAK3 mutations did not confer resistance (Fig 4E
and 4F), while expression of wild-type NRAS, NRASG12D, and wild-type AKT strongly con-
ferred resistance to steroids (Figs 4G and S5). Although AKTE17K behaves as an activating
mutant [42] that supports IL3-independent growth in Ba/F3 cells [41], it did not confer steroid
resistance in SUPT1 or P12 Ichikawa cells. We therefore denoted bulk lines that expressed
IL7RRFCPH, JAK1R724H, JAK1T901A, NRASG12D, or wild-type NRAS or AKT as the “steroid-
resistant panel,” whereas lines that expressed wild-type IL7R, JAK1, or JAK3 or mutant
JAK3M511I, JAK3R657Q, or AKTE17K as the “steroid-sensitive panel.” The expression of particu-
lar (mutant) IL7R signaling molecules specifically affected steroid response since all lines dis-
played comparable sensitivities to vincristine and L-asparaginase treatments (Figs 4H, 4I and
S5).
IL7R Signaling Mutations Do Not Affect the Function of NR3C1
We next investigated whether the expression of IL7R signaling molecules that give rise to ste-
roid resistance affects nuclear shuttling of the steroid receptor NR3C1, rendering it incapable
of activating downstream target genes upon steroid exposure. We found no difference among
steroid-resistant and steroid-sensitive lines in their abilities to activate NR3C1 target genes fol-
lowing steroid exposure, including NR3C1, TSC22D3/GILZ,BCC3/PUMA, KLF13, BCL2L11/BIM and FKBP5 (S6 Fig). Therefore, the steroid resistance provoked by expression of mutant
IL7R, JAK1, or NRAS molecules, or wild-type NRAS or AKT, is independent of the NR3C1
response following steroid exposure.
IL7R Signaling Mutations Confer Steroid Resistance in T-ALL
PLOS Medicine | DOI:10.1371/journal.pmed.1002200 December 20, 2016 16 / 33
Crosstalk between the NR3C1 and IL7R Signaling Pathways
To examine the underlying mechanism that confers steroid resistance, we performed Western
blot analyses on steroid-resistant and steroid-sensitive lines to measure the activities of the
IL7R signaling and downstream pathways (Figs 5A and S7). Steroid-sensitive and -resistant
Fig 4. Activating IL7R signaling mutations can confer resistance to steroid treatment. (A–F) Steroid response curves (from triplicate
experiments ± standard deviation) for SUPT1 cells that express (A) JAK1, (B) JAK1R724H, (C) JAK1T901A, (D) JAK3, (E) JAK3M511I, or (F) JAK3R657Q from
doxycycline-inducible lentiviral expression constructs. Steroid response curves are shown for induced (+Dox) and non-induced (−Dox) cells that have been
exposed to serial dilutions of prednisolone for 72 h. (G–I) Mean survival of SUPT1 cells (triplicate experiments ± standard deviation) expressing wild-type or
mutant IL7R signaling molecules (+Dox: open red bars) following a 72-h exposure to (G) prednisolone (Pred), (H) vincristine (VCR), or (I) L-asparaginase
(ASP). Black bars represent the mean survival of all SUPT1 lines under non-induced conditions following exposure to prednisolone, vincristine, or L-
asparaginase (−Dox control). The steroid-sensitive panel refers to SUPT1 lines that retain a similarly sensitive steroid response following expression of IL7R,
JAK1, JAK3, JAK3M511I, JAK3R657Q, or AKTE17K compared to non-induced control conditions. The steroid-resistant panel refers to lines that acquire steroid
resistance following expression of IL7RRFCPH, JAK1R724H, JAK1T901A, NRAS, NRASG12D, or AKT. See also S5 Fig.
doi:10.1371/journal.pmed.1002200.g004
IL7R Signaling Mutations Confer Steroid Resistance in T-ALL
PLOS Medicine | DOI:10.1371/journal.pmed.1002200 December 20, 2016 17 / 33

IL7R Signaling Mutations Confer Steroid Resistance in T-ALL
PLOS Medicine | DOI:10.1371/journal.pmed.1002200 December 20, 2016 18 / 33
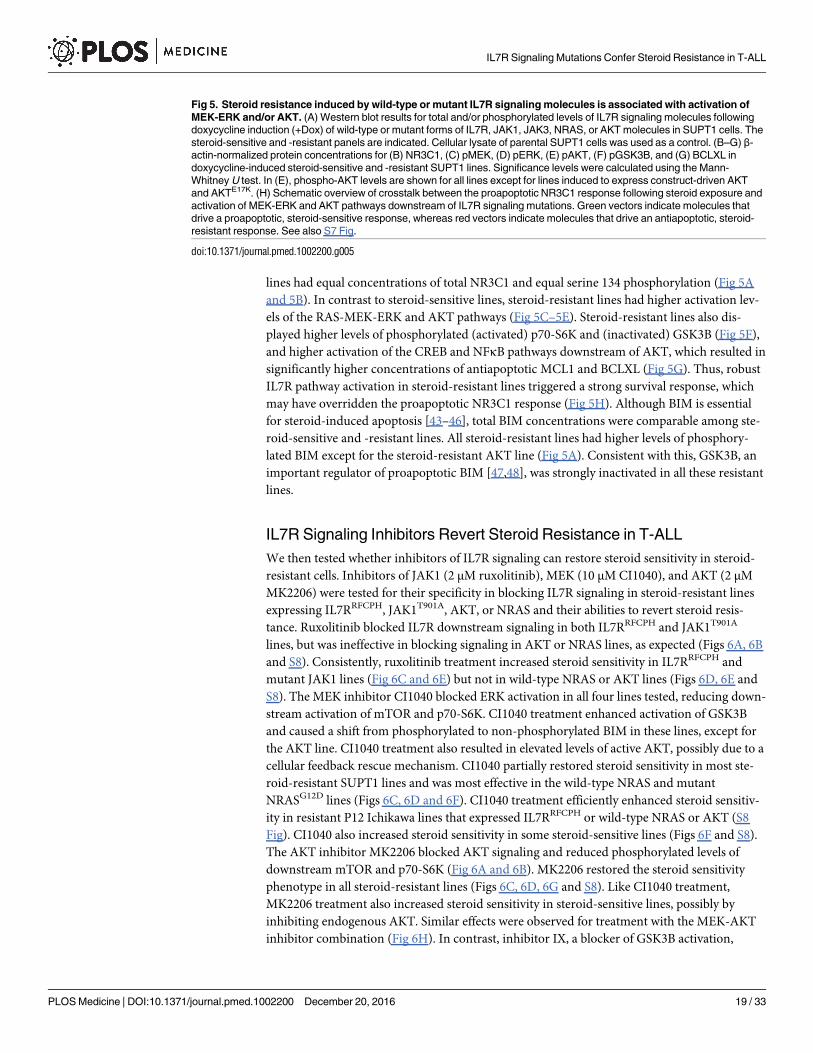
lines had equal concentrations of total NR3C1 and equal serine 134 phosphorylation (Fig 5A
and 5B). In contrast to steroid-sensitive lines, steroid-resistant lines had higher activation lev-
els of the RAS-MEK-ERK and AKT pathways (Fig 5C–5E). Steroid-resistant lines also dis-
played higher levels of phosphorylated (activated) p70-S6K and (inactivated) GSK3B (Fig 5F),
and higher activation of the CREB and NFκB pathways downstream of AKT, which resulted in
significantly higher concentrations of antiapoptotic MCL1 and BCLXL (Fig 5G). Thus, robust
IL7R pathway activation in steroid-resistant lines triggered a strong survival response, which
may have overridden the proapoptotic NR3C1 response (Fig 5H). Although BIM is essential
for steroid-induced apoptosis [43–46], total BIM concentrations were comparable among ste-
roid-sensitive and -resistant lines. All steroid-resistant lines had higher levels of phosphory-
lated BIM except for the steroid-resistant AKT line (Fig 5A). Consistent with this, GSK3B, an
important regulator of proapoptotic BIM [47,48], was strongly inactivated in all these resistant
lines.
IL7R Signaling Inhibitors Revert Steroid Resistance in T-ALL
We then tested whether inhibitors of IL7R signaling can restore steroid sensitivity in steroid-
resistant cells. Inhibitors of JAK1 (2 μM ruxolitinib), MEK (10 μM CI1040), and AKT (2 μM
MK2206) were tested for their specificity in blocking IL7R signaling in steroid-resistant lines
expressing IL7RRFCPH, JAK1T901A, AKT, or NRAS and their abilities to revert steroid resis-
tance. Ruxolitinib blocked IL7R downstream signaling in both IL7RRFCPH and JAK1T901A
lines, but was ineffective in blocking signaling in AKT or NRAS lines, as expected (Figs 6A, 6B
and S8). Consistently, ruxolitinib treatment increased steroid sensitivity in IL7RRFCPH and
mutant JAK1 lines (Fig 6C and 6E) but not in wild-type NRAS or AKT lines (Figs 6D, 6E and
S8). The MEK inhibitor CI1040 blocked ERK activation in all four lines tested, reducing down-
stream activation of mTOR and p70-S6K. CI1040 treatment enhanced activation of GSK3B
and caused a shift from phosphorylated to non-phosphorylated BIM in these lines, except for
the AKT line. CI1040 treatment also resulted in elevated levels of active AKT, possibly due to a
cellular feedback rescue mechanism. CI1040 partially restored steroid sensitivity in most ste-
roid-resistant SUPT1 lines and was most effective in the wild-type NRAS and mutant
NRASG12D lines (Figs 6C, 6D and 6F). CI1040 treatment efficiently enhanced steroid sensitiv-
ity in resistant P12 Ichikawa lines that expressed IL7RRFCPH or wild-type NRAS or AKT (S8
Fig). CI1040 also increased steroid sensitivity in some steroid-sensitive lines (Figs 6F and S8).
The AKT inhibitor MK2206 blocked AKT signaling and reduced phosphorylated levels of
downstream mTOR and p70-S6K (Fig 6A and 6B). MK2206 restored the steroid sensitivity
phenotype in all steroid-resistant lines (Figs 6C, 6D, 6G and S8). Like CI1040 treatment,
MK2206 treatment also increased steroid sensitivity in steroid-sensitive lines, possibly by
inhibiting endogenous AKT. Similar effects were observed for treatment with the MEK-AKT
inhibitor combination (Fig 6H). In contrast, inhibitor IX, a blocker of GSK3B activation,
Fig 5. Steroid resistance induced by wild-type or mutant IL7R signaling molecules is associated with activation of
MEK-ERK and/or AKT. (A) Western blot results for total and/or phosphorylated levels of IL7R signaling molecules following
doxycycline induction (+Dox) of wild-type or mutant forms of IL7R, JAK1, JAK3, NRAS, or AKT molecules in SUPT1 cells. The
steroid-sensitive and -resistant panels are indicated. Cellular lysate of parental SUPT1 cells was used as a control. (B–G) β-
actin-normalized protein concentrations for (B) NR3C1, (C) pMEK, (D) pERK, (E) pAKT, (F) pGSK3B, and (G) BCLXL in
doxycycline-induced steroid-sensitive and -resistant SUPT1 lines. Significance levels were calculated using the Mann-
Whitney U test. In (E), phospho-AKT levels are shown for all lines except for lines induced to express construct-driven AKT
and AKTE17K. (H) Schematic overview of crosstalk between the proapoptotic NR3C1 response following steroid exposure and
activation of MEK-ERK and AKT pathways downstream of IL7R signaling mutations. Green vectors indicate molecules that
drive a proapoptotic, steroid-sensitive response, whereas red vectors indicate molecules that drive an antiapoptotic, steroid-
resistant response. See also S7 Fig.
doi:10.1371/journal.pmed.1002200.g005
IL7R Signaling Mutations Confer Steroid Resistance in T-ALL
PLOS Medicine | DOI:10.1371/journal.pmed.1002200 December 20, 2016 19 / 33

IL7R Signaling Mutations Confer Steroid Resistance in T-ALL
PLOS Medicine | DOI:10.1371/journal.pmed.1002200 December 20, 2016 20 / 33

provoked resistance in the majority of steroid-sensitive lines as well as some steroid-resistant
lines (Fig 6I), providing further evidence that GSK3B is a key regulator of steroid
responsiveness.
We then further tested whether clinically relevant inhibitors of the IL7R signaling pathway
affected the prednisolone sensitivity of primary leukemia cells isolated from 11 pediatric
T-ALL patients at diagnosis (Tables 1 and S1). Leukemia cells were incubated with serial dilu-
tions of prednisolone or single inhibitors as well as their combinations at different ratios based
on estimated IC50 concentrations. The level of synergism was determined by calculating the
CI for serial dilutions of three drug–inhibitor combination mixtures (1:1; 1:4, and 4:1) at effec-
tive doses that were lethal for 50% (ED50) or 75% (ED75) of the leukemia cells (S9 Fig). Three
out of 11 patients harbored IL7R mutations, whereas one patient had a KRAS mutation. Leuke-
mic cells from four other patients did not harbor mutations in IL7R signaling components but
had other mutations, whereas the mutation status of three additional patients was unknown
(Table 1). These 11 patient samples differed in their responses to prednisolone based on their
IC50 values or the percentage of total responding cells (Table 1), and patients #2911 and
#10110 were refractory to steroid treatment. Surprisingly, in contrast to previous results on
cell lines, the JAK inhibitor ruxolitinib had no effect on the prednisolone response in the eight
T-ALL patient samples for which CI values could be calculated. Treatment with the MEK
inhibitor AZD6244 or trametinib synergistically enhanced prednisolone responsiveness in 5/9
and 9/10 patient samples, respectively. Neither inhibitor enhanced steroid responsiveness in
the leukemia cells from steroid-resistant patient #2911, whereas trametinib synergistically
enhanced the prednisolone response in leukemia cells from steroid-resistant patient #2322.
AKT inhibitor MK2206 synergistically enhanced prednisolone sensitivity in leukemia cells
from 8/11 patients, while mTOR inhibitors AZD8055 and everolimus acted synergistically
when combined with prednisolone in 10/11 and 8/8 patient samples, respectively, including
both steroid-resistant patients. The PI3K inhibitor NVPBEZ235 synergistically enhanced pred-
nisolone sensitivity in 10/11 patient samples.
Discussion
Here, we report the identification of mutations in IL7R signaling molecules in 32% of pedi-
atric patients with T-ALL. These mutations are associated with reduced steroid sensitivity
and poor clinical outcome. In addition, we provide functional evidence that these muta-
tions reduce steroid-induced cell death by activating the downstream signaling pathways
MEK-ERK and AKT. Activation of these pathways causes (1) upregulation of the antiapop-
totic proteins MCL1 and BCLXL; (2) inactivation of the proapoptotic protein BIM, an
essential component in steroid-induced cell death; and (3) inactivation of GSK3B, a key
Fig 6. Reversal of steroid resistance by IL7R signaling inhibitors. Activity status of IL7R signaling molecules by
Western blot analysis in SUPT1 cells expressing (A) JAK1T901A or (B) wild-type AKT that are exposed to ruxolitinib (2 μM),
CI1040 (10 μM), MK2206 (2 μM), or the CI1040/MK2206 combination for 24 h compared to non-induced and doxycycline-
induced controls. (C and D) SUPT1 or P12 Ichikawa (D, middle panel) T cell acute lymphoblastic leukemia cell response
curves following 72-h exposure to serial dilutions of prednisolone (triplicate experiments ± standard deviation) without (−Dox,
grey circles) or with (+Dox, open red circles) induction of (C) IL7RRFCPH or (D) AKT. The effect of 2 μM ruxolitinib (left
panels), 10 μM CI1040 (middle panels), and 2 μM MK2206 (right panels) on the steroid response under doxycycline-induced
conditions are shown (open blue triangles). (E–I) Mean survival (triplicate experiments ± standard deviation) of SUPT1 lines
expressing wild-type or mutant IL7R signaling molecules following 72-h treatment with prednisolone (250 μg/ml) in the
absence (open red bars) or presence (open blue bars) of (E) ruxolitinib, (F) CI1040, (G) MK2206, (H) the combination of
CI1040/MK2206, or (I) GSK3 inhibitor IX. Steroid-sensitive and -resistant panels are indicated. For each experiment, the
mean survival for all non-induced (−Dox) SUPT1 lines that are exposed to prednisolone (red, grey-filled bar) or prednisolone
plus inhibitor (blue, grey-filled bar) is shown as a control. See also S8 Fig. Dox, doxycycline; inh., inhibitor; Pred,
prednisolone; Rux, ruxolitinib.
doi:10.1371/journal.pmed.1002200.g006
IL7R Signaling Mutations Confer Steroid Resistance in T-ALL
PLOS Medicine | DOI:10.1371/journal.pmed.1002200 December 20, 2016 21 / 33

Table 1. MEK and PI3K/AKT pathway inhibitors enhance the steroid response of primary T-ALL patient samples.
Patient Chemotherapy Inhibitor CI ± SD Synergy Level
Drug IC50 [nM] (Maximum
Effect)
Compound Target IC50 [nM] (Maximum
Effect)
ED50 ED75
T-ALL #9858 (TLX3tr, p16/p15DEL/DEL; mutations in IL7R, NRAS, NOTCH1 [HD domain], WT1, BCL11B, CDH9, STIL)
Prednisolone 18 (80%) Ruxolitinib JAK1 205 (<20%) 1.40* NA No synergy
Prednisolone 17 (77%) AZD6244 MEK1/2 71 (76%) 0.61 ± 0.04 0.13 ± 0.04 Synergy/strong
synergy
Prednisolone 14 (73%) Trametinib MEK1/2 11 (79%) 0.86 ± 0.27 0.26 ± 0.18 Strong synergy
Prednisolone 18 (74%) MK2206 AKT 60 (27%) 0.98 ± 0.36 NA No synergy
Prednisolone 12 (74%) AZD8055 mTOR 288 (74%) 0.67 ± 0.14 NA Synergy
Prednisolone 17 (75%) Everolimus mTOR 12,614 (<20%) 0.61* <0.10* Synergy/strong
Synergy
Prednisolone 14 (72%) NVPBEZ235 mTOR/
PI3K
322 (59%) 0.98 ± 0.19 NA No synergy
T-ALL #1570 (HOXA, mutations in IL7R, NOTCH1 [JM domain], FREM2, RUNX1)
Prednisolone 25 (65%) Ruxolitinib JAK1 58 (<20%) 1.49 ± 0.74 NA No synergy
Prednisolone 36 (73%) AZD6244 MEK1/2 647 (40%) 0.57 ± 0.50 NA No synergy
Prednisolone 19 (53%) Trametinib MEK1/2 49 (24%) 0.46 ± 0.16 NA Synergy
Prednisolone 20 (63%) MK2206 AKT 464 (39%) 1.12 ± 0.62 NA No synergy
Prednisolone 29 (82%) AZD8055 mTOR 22 (<20%) 0.55* NA Synergy
Prednisolone 21 (62%) Everolimus mTOR 72 (<20%) 0.85* NA Synergy
Prednisolone 57 (79%) NVPBEZ235 mTOR/
PI3K
728 (69%) 0.54 ± 0.06 0.39 ± 0.42 Synergy
T-ALL #2911 (HOXAr [Inv(7)], p16/p15DEL/DEL; mutations in IL7R, NOTCH1 [PEST domain], WT1, ZNF717)
Prednisolone 9,007 (<20%) Ruxolitinib JAK1 5,323 (59%) 1.65 ± 0.28 NA No synergy
Prednisolone 425 (<20%) AZD6244 MEK1/2 246 (58%) 0.61 ± 0.59 NA No synergy
Prednisolone 90 (<20%) Trametinib MEK1/2 81 (75%) 0.90 ± 0.25 NA No synergy
Prednisolone 154 (<20%) MK2206 AKT 239 (51%) 0.22 ± 0.07 NA Strong synergy
Prednisolone 104 (<20%) AZD8055 mTOR 251 (64%) 0.44 ± 0.09 NA Synergy
Prednisolone 560 (<20%) Everolimus mTOR 68 (51%) NA NA NA
Prednisolone >10,000 (<20%) NVPBEZ235 mTOR/
PI3K
362 (71%) 0.30 ± 0.05 NA Synergy
ETP-ALL #491 (MEF2Ctr, NR3C1DEL, mutations in KRAS, NOTCH1 [HD/PEST domains], ADAMTS5, ALK, CDH8, DNM2, FAM171A1, NCOA2,
NOTCH1, NOTCH3, NOTCH4, NUMA1, PTCH1, SETD2, SYK, TP53BP1)
Prednisolone 120 (87%) Ruxolitinib JAK1 ND (<20%) NA NA NA
Prednisolone 80 (70%) AZD6244 MEK1/2 141 (41%) 0.29 ± 0.13 <0.10* Strong synergy
Prednisolone 105 (67%) Trametinib MEK1/2 13 (24%) 0.33 ± 0.17 NA Synergy
Prednisolone 123 (61%) MK2206 AKT ND (<20%) 0.70* NA Synergy
Prednisolone 78 (82%) AZD8055 mTOR ND (<20%) 1.41* NA No synergy
Prednisolone 61 (76%) Everolimus mTOR ND (<20%) 0.79* 0.41* Synergy
Prednisolone 95 (62%) NVPBEZ235 mTOR/
PI3K
ND (<20%) 0.60* NA Synergy
T-ALL #1032 (TALLMO-like, p16/p15GL/DEL; mutations in PTEN, KIF14, NCOA1, TET2)
Prednisolone 38 (91%) Ruxolitinib JAK1 ND (<20%) 1.12* 1.08* No synergy
Prednisolone 41 (89%) AZD6244 MEK1/2 259 (18%) 0.70 ± 0.08 0.88 ± 0.05 Synergy
Prednisolone 40 (89%) Trametinib MEK1/2 50 (25%) 0.65 ± 0.05 0.79 ± 0.16 Synergy
Prednisolone 37 (87%) MK2206 AKT 520 (81%) 0.96 ± 0.09 0.70 ± 0.11 Synergy
Prednisolone 39 (91%) AZD8055 mTOR 61 (68%) 0.98 ± 0.13 0.58 ± 0.21 Synergy
Prednisolone 36 (89%) Everolimus mTOR 11 (51%) 0.46 ± 0.01 0.84 ± 0.08 Synergy
(Continued )
IL7R Signaling Mutations Confer Steroid Resistance in T-ALL
PLOS Medicine | DOI:10.1371/journal.pmed.1002200 December 20, 2016 22 / 33

Table 1. (Continued)
Patient Chemotherapy Inhibitor CI ± SD Synergy Level
Drug IC50 [nM] (Maximum
Effect)
Compound Target IC50 [nM] (Maximum
Effect)
ED50 ED75
Prednisolone 38 (89%) NVPBEZ235 mTOR/
PI3K
134 (64%) 1.24 ± 0.04 0.63 ± 0.32 Synergy
T-ALL #1815 (TALLMO-like, MYBdup, P16DEL/DEL; mutations in NOTCH1 [JM domain], CACNA1E, NR3C1, ZNF717)
Prednisolone 108 (52%) Ruxolitinib JAK1 ND (<20%) 1.39* NA No synergy
Prednisolone 116 (59%) AZD6244 MEK1/2 151 (53%) 0.13 ± 0.03 <0.10 Strong synergy
Prednisolone 141 (50%) Trametinib MEK1/2 23 (53%) 0.16 ± 0.07 <0.10* Strong synergy
Prednisolone 119 (52%) MK2206 AKT 165 (50%) 0.19 ± 0.07 <0.10* Strong synergy
Prednisolone 173 (68%) AZD8055 mTOR 52 (58%) 0.41 ± 0.06 <0.10 Synergy/strong
synergy
Prednisolone 120 (59%) Everolimus mTOR 11 (36%) 0.25 ± 0.06 NA Strong synergy
Prednisolone 138 (53%) NVPBEZ235 mTOR/
PI3K
196 (57%) 0.79 ± 0.05 <0.10 Synergy/strong
synergy
T-ALL #2322 (LMO2tr, p16DEL/DEL; mutations in NOTCH1 [HD domain], CACNA2D4, KCNMA1, STAM)
Prednisolone 122 (27%) Ruxolitinib JAK1 ND (<20%) NA NA NA
Prednisolone 49 (28%) AZD6244 MEK1/2 223 (48%) NA NA NA
Prednisolone ND (<20%) Trametinib MEK1/2 87 (465) <0.10 NA Strong synergy
Prednisolone 86 (13%) MK2206 AKT 504 (58%) 0.10 ± 0.02 <0.10* Strong synergy
Prednisolone 107 (30%) AZD8055 mTOR 90 (57%) 0.46 ± 0.15 <0.10 Synergy/strong
synergy
Prednisolone ND Everolimus mTOR ND ND ND ND
Prednisolone 73 (21%) NVPBEZ235 mTOR/
PI3K
337 (92%) 0.52 ± 0.14 0.59 ± 0.29 Synergy
T-ALL #10110 (LMO2r [del11(p12;p13)], p16/p15DEL/DEL; mutations in NOTCH1 [HD domain], FBXW7, ACAN, ATRX, DNM2, RPL10)
Prednisolone 28 (84%) Ruxolitinib JAK1 122 (79%) 1.12 ± 0.11 0.82 ± 0.25 No synergy
Prednisolone ND AZD6244 MEK1/2 ND ND ND ND
Prednisolone ND Trametinib MEK1/2 ND ND ND ND
Prednisolone 39 (67%) MK2206 AKT 4,035 (72%) 0.95 ± 0.13 <0.10* Strong synergy
Prednisolone 40 (86%) AZD8055 mTOR 84 (72%) 0.96 ± 0.01 0.65 ± 0.25 Synergy
Prednisolone 43 (92%) Everolimus mTOR 14 (54%) 0.70 ± 0.17 0.53 ± 0.16 Synergy
Prednisolone 35 (74%) NVPBEZ235 mTOR/
PI3K
186 (50%) 1.21 ± 0.17 <0.10 Strong synergy
T-ALL #3594 (TLX3tr)
Prednisolone 46 (55%) Ruxolitinib JAK1 ND (<20%) 1.55* NA No synergy
Prednisolone 63 (65%) AZD6244 MEK1/2 79 (72%) 0.38 ± 0.03 <0.10* Synergy/strong
synergy
Prednisolone 60 (62%) Trametinib MEK1/2 16 (76%) 0.46 ± 0.12 <0.10 Synergy/strong
synergy
Prednisolone 45 (52%) MK2206 AKT 2,029 (100%) 0.78 ± 0.09 0.32 ± 0.20 Synergy
Prednisolone 48 (63%) AZD8055 mTOR 142 (60%) 0.78 ± 0.31 <0.10 Strong synergy
Prednisolone 62 (66) Everolimus mTOR ND (<20%) 0.41* <0.10* Strong synergy
Prednisolone 36 (49%) NVPBEZ235 mTOR/
PI3K
326 (69%) 0.64 ± 0.43 <0.10 Strong synergy
T-ALL #4992 (SIL-TAL1)
Prednisolone 60 (94%) Ruxolitinib JAK1 2,384 (38%) 0.85 ± 0.18 1.00 ± 0.11 No synergy
Prednisolone 50 (90%) AZD6244 MEK1/2 99 (45%) 0.43 ± 0.20 0.44 ± 0.14 Synergy
Prednisolone 63 (93%) Trametinib MEK1/2 61 (42%) 0.49 ± 0.15 0.54 ± 0.13 Synergy
Prednisolone 112 (87%) MK2206 AKT 723 (54%) 0.55 ± 0.13 0.49 ± 0.15 Synergy
(Continued )
IL7R Signaling Mutations Confer Steroid Resistance in T-ALL
PLOS Medicine | DOI:10.1371/journal.pmed.1002200 December 20, 2016 23 / 33

regulator of BIM. Importantly, in cell lines and primary patient samples, inhibitors of IL7R
signaling restored and enhanced steroid sensitivity, respectively.
WGS is a powerful technique used to identify breakpoint junctions of chromosomal rear-
rangements that result in the activation of oncogenes or create fusion proteins. It validated
chromosomal translocations in all ten patients that were predicted by fluorescence in situ
hybridization or other techniques, and led to the identification of various chromosomal rear-
rangements that had not been previously identified in T-ALL. Pediatric T-ALL patients on
average have three (range 0–11) interchromosomal and 14 (range 5–25) intrachromosomal
junctions as a consequence of translocations, inversions, deletions, duplications, or complex
rearrangements. Multiple and clustered chromosomal junctions were identified in two
patients that provided evidence for chromothripsis of Chromosomes 7 and 14 (ETP-ALL
patient #10793) or Chromosomes 1 and 5 (proliferative T-ALL patient #10943). Most intra-
and interchromosomal junctions, including those found in ETP-ALL patients, contain inser-
tions of non-template-derived nucleotides, which strongly implies the involvement of the
RAG1/2-mediated recombination machinery in these rearrangements.
Based on the WGS data for 13 patients and TES data from an expanded cohort of 69 T-ALL
cases that were integrated with LOH data, we identified 151 mutated genes, of which two
genes had not been observed before in human cancer (RABL6 and IGHV3-64). Integrating this
dataset with clinical and biological parameters identified IL7R signaling mutations as being
associated with steroid resistance in pediatric T-ALL patients; these mutations may serve as
biomarkers for reduced steroid response. Mutations affecting the IL7R signaling pathway and
Table 1. (Continued)
Patient Chemotherapy Inhibitor CI ± SD Synergy Level
Drug IC50 [nM] (Maximum
Effect)
Compound Target IC50 [nM] (Maximum
Effect)
ED50 ED75
Prednisolone 44 (96%) AZD8055 mTOR 14 (57%) 1.02 ± 0.13 0.60 ± 0.17 Synergy
Prednisolone 38 (91%) Everolimus mTOR 2 (50%) 0.34 ± 0.07 0.67 ± 0.05 Synergy
Prednisolone 103 (84%) NVPBEZ235 mTOR/
PI3K
496 (52%) 0.61 ± 0.22 0.44 ± 0.19 Synergy
T-ALL #9791 (Unknown)
Prednisolone 79 (45%) Ruxolitinib JAK1 ND (<20%) NA NA NA
Prednisolone 59 (38%) AZD6244 MEK1/2 188 (48%) NA NA Synergy
Prednisolone 50 (40%) Trametinib MEK1/2 217 (76%) 0.11 ± 0.08 NA Strong synergy
Prednisolone 56 (41%) MK2206 AKT 59 (59%) 0.81 ± 0.36 NA No synergy
Prednisolone 60 (43%) AZD8055 mTOR 91 (90%) 0.54 ± 0.18 0.41 ± 0.11 Synergy
Prednisolone 40 (44%) Everolimus mTOR 1 (50%) NA NA NA
Prednisolone 41 (46%) NVPBEZ235 mTOR/
PI3K
148 (89%) 0.60 ± 0.31 0.61 ± 0.13 Synergy
Rearrangements and mutations for patients are indicated. IC50 value is the inhibitory concentration of prednisolone or inhibitor at which 50% of total
responding (in percent, between parentheses) leukemic cells died following 72 h of exposure. Based on IC50 values, synergy experiments were performed
for prednisolone–inhibitor combinations at 1:1, 4:1, and 1:4 ratios. Mean CI values as a measure of cytotoxic synergy are indicated at effective dose levels
ED50 and ED75 (including SD for triplicate experiments) for prednisolone–inhibitor combinations compared to single prednisolone or inhibitor response
curves. For further details see also S9 Fig. CI = 1.00: additive effect; CI < 1.00: synergy; CI < 0.30: strong synergy; CI > 1.50: antagonism; synergy and
strong synergy CI values given in bold.
*SD not given for CI values that were calculated on fewer than three prednisolone–inhibitor combinations.
CI, combination index; ETP-ALL, early thymic progenitor acute lymphoblastic leukemia; NA, not applicable; ND, not determined; ND (<20%), IC50 not
determined when tested inhibitor had an efficacy < 20%; SD, standard deviation; T-ALL, T cell acute lymphoblastic leukemia.
doi:10.1371/journal.pmed.1002200.t001
IL7R Signaling Mutations Confer Steroid Resistance in T-ALL
PLOS Medicine | DOI:10.1371/journal.pmed.1002200 December 20, 2016 24 / 33

downstream AKT and MEK-ERK pathways were also associated with decreased relapse-free
survival for pediatric T-ALL patients who had received DCOG or COALL treatment. Little is
known about the prognostic significance of mutations in the IL7R-JAK/STAT pathway in
T-ALL [49], and various studies have failed to demonstrate adverse effects for pediatric T-ALL
patients harboring IL7R or IL7R/JAK mutations [50–52]. Our results are in line with the poor
prognosis for patients with JAK1 mutations originally reported for adult T-ALL [53] and with
the poor prognosis for patients with NRAS/KRAS mutations reported for adult T-ALL patients
treated in the GRAALL-2003 and GRAALL-2005 trials [54]. One explanation for varying
results among studies may be that mutation rates for individual signaling components are low.
To the best of our knowledge, no study has performed a comprehensive analysis of the prog-
nostic significance of the full spectrum of IL7R signaling mutations in T-ALL before. These
signaling mutations affect 32% of T-ALL patients, and are most recurrent in ETP-ALL patients
([40,52] and this study) and patients with the TLX subtype of T-ALL, which mostly harbors
HOXA-activating aberrations or TLX3 translocations [32].
Functional validation experiments in two T-ALL cell lines demonstrated that mutated IL7R
signaling molecules robustly activate the downstream molecules AKT and MEK-ERK, thereby
inducing steroid resistance. These include mutations in IL7R and JAK1, but not JAK3. Muta-
tions in JAK3 only modestly activate signaling, presumably due to their dependence on JAK1[55]. The IL7R signaling mutations do not affect NR3C1 signaling directly, including its
nuclear translocation or its ability to transactivate target genes upon steroid exposure. These
findings are consistent with our previous finding that steroid treatment activates NR3C1 target
genes similarly between steroid-sensitive and steroid-resistant ALL patients [56], supporting
the notion that resistance mechanisms are downstream—or independent—of steroid-induced
NR3C1 transactivation. We found no evidence of differential NR3C1 serine 134 phosphoryla-
tion between the steroid-sensitive and steroid-resistant groups (NR3C1 serine 134 is phos-
phorylated by AKT and prevents nuclear translocation of NR3C1) [13]. We did not find
increased MYB or BCL2 concentrations, previously proposed as steroid-resistance mecha-
nisms in select xenograft ALL models [14].
Our data suggest that the NR3C1-driven proapoptotic response is reduced by an AKT/
MEK-ERK-driven antiapoptotic response resulting in steroid resistance. AKT drives the
expression of antiapoptotic MCL1 and BCLXL. In our resistant panel of cell lines, high
MEK-ERK signaling was associated with the presence of phosphorylated (and inactivated)
GSK3B and BIM, which are essential for steroid-induced death [43–46]. BIM is phosphory-
lated by ERK [57,58], and, in line with this, BIM was not phosphorylated in steroid-resistant
lines upon treatment with the MEK inhibitor CI1040. GSK3B is an important regulator of
proapoptotic BIM [48] and may prevent phosphorylation of BIM, thereby preserving steroid
responsiveness. In addition to activated MEK-ERK, AKT can phosphorylate and inhibit
GSK3B, as observed in the steroid-resistant panel of cell lines. Therefore, GSK3B may play an
important role in the regulation of steroid responsiveness in general. Consistent with this, the
GSK3B inhibitor IX strongly provoked steroid resistance in most steroid-sensitive cell lines.
Our data therefore suggest that any cellular mechanism that may activate MEK-ERK and AKT
can lead to steroid resistance in T-ALL, and may explain some steroid-resistant T-ALL cases
that lack apparent IL7R signaling or NR3C1 mutations. The recently described NR3C1 cleav-
age by CASP1 might provide an alternative explanation for steroid resistance [19].
The finding that steroid resistance arises from activated MEK-ERK and AKT suggests that
a therapeutic regime combining steroids with MEK, AKT, or mTOR inhibitors may increase
steroid responsiveness. Importantly, these inhibitors might also increase the steroid response
in steroid-sensitive patients. Interestingly, even though three of our patient samples harbored
IL7R mutations, we found no proof of the effectiveness of ruxolitinib to reverse steroid
IL7R Signaling Mutations Confer Steroid Resistance in T-ALL
PLOS Medicine | DOI:10.1371/journal.pmed.1002200 December 20, 2016 25 / 33

resistance. This may possibly be due to a lack of cellular proliferation during in vitro drug sen-
sitivity testing, and implies that dormant leukemic stem cells are not killed by ruxolitinib. Rux-
olitinib has demonstrated some effectiveness in treating ETP-ALL in xenograft models [59,60],
although a major effect was not achieved.
Our finding may also be highly relevant to BCP-ALL patients—who often have mutations
in IL7R signaling molecules [61,62]—although this remains to be proven. High levels of AKT
activity have been associated with steroid resistance and poor outcome in BCP-ALL [63].
Mutations in NRAS and KRAS are common in ALL and are associated with steroid resistance,
central nervous system involvement, and poor outcome [16,17]; these mutations are preferen-
tially acquired at relapse [18]. Connectivity mapping based on expression profiles of steroid-
resistant ALL [64] suggests that mTOR inhibitors restore steroid sensitivity by reducing the
levels of antiapoptotic MCL1 [65,66].
One possible limitation of our study is the relatively small cohort size. However, given the
extremely low incidence of T-ALL (approximately 15 new patients identified in the Nether-
lands each year), it was not feasible to obtain larger numbers of clinically and biologically doc-
umented patient samples. A second limitation is that we were unable to obtain data regarding
the effectiveness of inhibiting IL7R signaling inhibitors in vivo with respect to restoring steroid
sensitivity in primary leukemic cells, e.g., using patient-derived T-ALL xenograft mouse mod-
els. In this respect, it is important to note that a recent preclinical study found that the PI3K/
mTOR inhibitor NVPBEZ235 enhanced steroid sensitivity in a T-ALL xenograft model [67].
In conclusion, we provide evidence that steroid resistance in pediatric T-ALL patients is
associated with mutations in IL7R signaling molecules. Because treatment success and clinical
outcome are highly dependent upon steroid sensitivity in this setting, our findings suggest that
small-molecule inhibitors of MEK, PI3K, AKT, and/or mTOR should be tested in order to
restore or enhance steroid sensitivity in patients with ALL.
Supporting Information
S1 Fig. Filtering procedure for the WGS dataset from 13 pairs of diagnostic–remission
patient samples. The filtering flowcharts to obtain candidate high-confidence somatic pro-
tein-altering SNVs (A) and INDELs (B) detected by WGS in 13 tumors are shown. INDEL,
small insertion or deletion; SNV, single nucleotide variant; WGS, whole genome sequencing.
(TIF)
S2 Fig. WGS quality threshold optimization by PCR–Sanger sequencing. (A) Scatterplot of
somatic score (SS) versus total score (TS) for 46 mutations detected by WGS in 13 tumors and
validated by PCR–Sanger sequencing. Mutations detected by PCR–Sanger sequencing only in
the tumor and not in the remission sample are called true positives (TP, in green). Otherwise
they are called false positives (FP, in red). The mutations that were not sequenced by PCR–
Sanger sequencing are in grey. The entire space is divided into four quadrants using the
thresholds SS = 0.1 and TS = 100, among which quadrant I is enriched for true positives. The
different types of mutations are given by shape. del, small deletion; ins, small insertion; sub,
small substitution; snv, single nucleotide variant. (B) Receiver operating characteristic (ROC)
curves using SS and TS separately and jointly for 46 WGS mutations validated by PCR–Sanger
sequencing. Three data points are marked where SS = 0.1 and TS = 100, separately and jointly.
(TIF)
S3 Fig. TES quality threshold optimization exploiting the mutations detected by both TES
and WGS in 13 tumor samples. (A) The training set and the classifier boundary for reliably
detecting SNVs by TES. A mutation is called true positive (TP) if the exact mutation was
IL7R Signaling Mutations Confer Steroid Resistance in T-ALL
PLOS Medicine | DOI:10.1371/journal.pmed.1002200 December 20, 2016 26 / 33

found by both WGS and TES in the same patient sample. A mutation is called false positive
(FP) if it was detected by TES, but not by WGS. The training set contains 570 exonic non-syn-
onymous SNVs detected by TES in 13 tumor samples from the discovery cohort: 218 TP SNVs
(green) versus 352 FP SNVs (red). The Gaussian one-class classifier boundary in blue results
in false negative rate (FNr) = 0.10 and false positive rate (FPr) = 0.28. (B) The ROC curve of
the Gaussian one-class classifier on the training set containing 570 TES SNVs from 13 tumor
samples. The chosen boundary is indicated by the green circle on the curve, which has
FNr = 0.10 and FPr = 0.28. (C) The training set and the classifier boundary for reliably detect-
ing INDELs by TES. The training set contains 52 exonic non-synonymous INDELs detected
by TES in 13 tumor samples from the discovery cohort: 11 TP INDELs (green) versus 41 FP
INDELs (red). The classifier boundary in blue results in FNr = 0.10 and FPr = 0.63.
(TIF)
S4 Fig. Filtering procedure for the TES dataset from 69 diagnostic patient samples. The fil-
tering flowchart to obtain reliable somatic protein-altering SNVs (A) and INDELs (B) detected
by targeted exome sequencing (TES) for 254 genes in 69 tumors is shown.
(TIF)
S5 Fig. Activating IL7R signaling mutations confer steroid resistance. (A–C) Steroid
response curves for steroid-sensitive SUPT1 cells that contain (A) IL7R, (B) non-cysteine
mutant IL7RGPSL or (C) cysteine mutant IL7RRFCPH doxycycline-inducible lentiviral expres-
sion constructs. Steroid response curves are shown for induced (+Dox) or non-induced
(−Dox) cells that have been exposed to serial dilutions (250–0.007 μg/ml) of prednisolone for
72 h. (D–F) Steroid response curves for steroid-sensitive P12 Ichikawa cells that contain (D)
wild-type IL7R, (E) AKTE17K or (F) wild-type AKT expression constructs. (G–I) Mean survival
of P12 Ichikawa cells expressing wild-type or mutant IL7R signaling molecules (+Dox: open
red bars) following a 72-h exposure to indicated concentrations of (G) prednisolone, (H) vin-
cristine, or (I) L-asparaginase. Black bars represent the mean survival of all non-induced P12
Ichikawa lines following exposure to prednisolone, vincristine, or L-asparaginase (−Dox con-
trol). The steroid-sensitive panel refers to P12 Ichikawa lines that retain an equally sensitive
steroid response compared to non-induced control conditions, whereas the steroid-resistant
panel refers to lines that acquire steroid resistance. All data are from triplicate experiments
and are represented as mean ± standard deviation.
(TIF)
S6 Fig. IL7R signaling mutations do not affect the transactivation potential of NR3C1.
GAPDH-normalized relative expression levels of (A) NR3C1 (B) TSC22D3/GILZ, (C) BCC3/PUMA, (D) KLF13, (E) BCL2L11/BIM, and (F) FKBP5 by real-time quantitative PCR in
SUPT1 cell lines. Expression is displayed for all non-induced clones in the absence (−Dox,
open black circles) or presence (−Dox, grey-filled black circles) of prednisolone, as well as for
doxycycline-induced lines of the steroid-sensitive and -resistant panels in the absence (+Dox,
open red circles) or presence (+Dox, grey-filled red circles) of prednisolone. Black bars indi-
cate median expression levels.
(TIF)
S7 Fig. Steroid resistance induced by wild-type or mutant IL7R signaling molecules is asso-
ciated with activation of MEK-ERK and/or AKT. (A) Western blot results of total and/or
phosphorylated levels of IL7R signaling molecules following induction (+Dox) of wild-type or
mutant forms of IL7R, JAK1, JAK3, NRAS, and AKT molecules in SUPT1 cells. The steroid-
sensitive and -resistant panels are indicated. Parental SUPT1 cells serve as a control. (B–N)
Protein concentrations (as determined by β-actin-normalized band intensities) of (B)
IL7R Signaling Mutations Confer Steroid Resistance in T-ALL
PLOS Medicine | DOI:10.1371/journal.pmed.1002200 December 20, 2016 27 / 33

phospho-S134 NR3C1, (C) total RAS, (D) total PUMA, (E) total BAD, (F) phospho-BAD, (G)
the phospho-GSK3B versus phospho-GSK3A ratio, (H) total BIM, (I) total BCL2, (J) phospho-
CREB, (K) phospho-ATF1, (L) total MCL1, (M) phospho-p38, and (N) total cMYB in doxycy-
cline-induced steroid-sensitive and -resistant SUPT1 lines. Significance levels were determined
using the Mann-Whitney U test. Note that the total RAS levels in (C) are shown for all lines
except RAS and NRASG12D.
(TIF)
S8 Fig. Reversal of steroid resistance by IL7R signaling inhibitors. (A) Activation status of
IL7R signaling molecules by Western blot of SUPT1 cells expressing NRAS that were exposed
to ruxolitinib (2 μM), CI1040 (10 μM), MK2206 (2 μM), or the CI1040/MK2206 combination
for 24 h compared to non-induced and doxycycline-induced controls. (B–H) SUPT1 or P12
Ichikawa response curves to serial dilutions of prednisolone (250–0.007 μg/ml, 72 h exposure)
without (−Dox, grey circles) or with (+Dox, open red circles) induction of (B) JAK1R724H,
(C–E) NRAS, (F) IL7R, or (G and H) cysteine mutant IL7RRFCPH. The effect of (C, F, and G)
2 μM ruxolitinib, (D) 10 μM CI1040, or (E and H) 2 μM MK2206 on the steroid response
under doxycycline-induced conditions is shown by open blue triangles. (I–K) Survival of P12
Ichikawa lines expressing wild-type or mutant IL7R signaling molecules following 72 h of
treatment with 250 μg/ml prednisolone in the absence (open red bars) or presence (open blue
bars) of the following inhibitors: (I) ruxolitinib, (J) CI1040, or (K) MK2206. The steroid-sensi-
tive and -resistant panels are indicated. For each experiment, the mean survival percentage for
all non-induced (+Dox) P12 Ichikawa lines following exposure to prednisolone (red, grey-
filled bar) and prednisolone plus inhibitor (blue, grey-filled bar) is shown as a control. The sur-
vival of induced lines following exposure to steroids and inhibitors has been corrected for the
cytotoxic effects of the inhibitors under non-induced control conditions. All data in (B–K) are
from triplicate experiments and are represented as mean ± standard deviation.
(TIF)
S9 Fig. Schematic overview of synergy experiments. (A) Single drug (i.e., prednisolone) or
compound response curves for patient primary leukemic cells exposed to a 1–10,000 nM range
of drug or inhibitor as indicated. IC50 values correspond to the drug or inhibitor concentra-
tions at which 50% of responding cells have died within 72 h of exposure. (B) IC50 values as
used for the synergy experiments for indicated prednisolone–inhibitor combinations. These
experiments were performed for serial dilutions of prednisolone–inhibitor mixtures in a 1:1
ratio (the 100 dilution equals [0.5 × IC50 prednisolone] + [0.5 × IC50 inhibitor]), a 1:4 ratio
(the 100 dilution equals [0.2 × IC50 prednisolone] + [0.8 × IC50 inhibitor]), and a 4:1 ratio
(the 100 dilution equals [0.8 × IC50 prednisolone] + [0.2 × IC50 inhibitor]). (C) Combination
index (CI) as a measure for synergism or antagonism for each prednisolone–inhibitor combi-
nation mixture as calculated at the effective dose levels ED50 and ED75 (at which 50% and
75%, respectively, of the leukemic cells have died within 72 h of exposure) compared to the
corresponding single prednisolone and inhibitor response curves (for which the 100 dilution
equals the IC50 concentration of prednisolone or inhibitor). CI = 1.0 indicates additive effects;
CI < 1.0, synergistic effects; CI < 0.3, strong synergistic effects; and CI > 1.5, antagonistic
effects. When CI = 0.1, the prednisolone–inhibitor combination achieves a similar cytotoxic
effect at 10-fold lower concentrations than estimated from the prednisolone or inhibitor single
response curves.
(TIF)
IL7R Signaling Mutations Confer Steroid Resistance in T-ALL
PLOS Medicine | DOI:10.1371/journal.pmed.1002200 December 20, 2016 28 / 33

S1 Table. Summary of T-ALL patients included in this study. Treatment protocols and avail-
able genomic and transcriptomic data are indicated.
(XLSX)
S2 Table. Discovery cohort of diagnostic–remission samples of 13 pediatric T-ALL patients
for whole genome sequencing.
(XLSX)
S3 Table. Expansion cohort for targeted exome sequencing: additional 69 COALL-97/03
pediatric T-ALL cohort diagnostic samples.
(XLSX)
S4 Table. Biological pathway enrichment analysis of 127 recurrently mutated genes in the
expansion cohort.
(XLSX)
S5 Table. Association between mutations/aberrations and poor outcome, drug resistance,
and T-ALL subtype with nominal p< 0.05 in the cohort of 69 T-ALL patients in the expan-
sion phase.
(XLSX)
S6 Table. Overview of mutations and aberrations in IL7R signaling pathway genes in 146
pediatric T-ALL patients.
(XLSX)
Acknowledgments
We wish to thank the patients (and their parents) for participating in this study. We thank Jer-
oen de Roos and Jelle Dylus (Netherlands Translational Research Center) and Dirk Geerts for
experimental support, and Prof. Hans Clevers for helpful discussions and critically reading the
manuscript.
Author Contributions
Conceptualization: JPPM.
Data curation: YL JGCAMB-G WKS JPPM.
Formal analysis: YL JGCAMB-G KC-B APS EMV WKS MH RPK RCB GJRZ PJvdS JPPM.
Funding acquisition: JPPM.
Investigation: YL JGCAMB-G KC-B EMV WKS RvM WNMD RCB GJRZ JPPM.
Methodology: YL JGCAMB-G KC-B EMV WKS RCB GJRZ RP JPPM.
Project administration: JPPM.
Software: YL.
Supervision: RP JPPM.
Validation: YL JGCAMB-G WKS JPPM.
Visualization: YL JGCAMB-G JPPM.
Writing – original draft: YL RP JPPM.
IL7R Signaling Mutations Confer Steroid Resistance in T-ALL
PLOS Medicine | DOI:10.1371/journal.pmed.1002200 December 20, 2016 29 / 33
Writing – review & editing: YL JGCAMB-G KC-B APS EMV WKS RvM WNMD MH RPK
RCB GJRZ PJvdS RP JPPM.
References1. Inaba H, Pui CH. Glucocorticoid use in acute lymphoblastic leukaemia. Lancet Oncol. 2010; 11
(11):1096–106. doi: 10.1016/S1470-2045(10)70114-5 PMID: 20947430
2. Lauten M, Stanulla M, Zimmermann M, Welte K, Riehm H, Schrappe M. Clinical outcome of patients
with childhood acute lymphoblastic leukaemia and an initial leukaemic blood blast count of less than
1000 per microliter. Klin Padiatr. 2001; 213(4):169–74. doi: 10.1055/s-2001-16848 PMID: 11528550
3. Pieters R, Huismans DR, Loonen AH, Hahlen K, van der Does-van den Berg A, van Wering ER, et al.
Relation of cellular drug resistance to long-term clinical outcome in childhood acute lymphoblastic leu-
kaemia. Lancet. 1991; 338(8764):399–403. PMID: 1678081
4. Schlossmacher G, Stevens A, White A. Glucocorticoid receptor-mediated apoptosis: mechanisms of
resistance in cancer cells. J Endocrinol. 2011; 211(1):17–25. doi: 10.1530/JOE-11-0135 PMID:
21602312
5. Irving JA, Minto L, Bailey S, Hall AG. Loss of heterozygosity and somatic mutations of the glucocorticoid
receptor gene are rarely found at relapse in pediatric acute lymphoblastic leukemia but may occur in a
subpopulation early in the disease course. Cancer Res. 2005; 65(21):9712–8. doi: 10.1158/0008-5472.
CAN-05-1227 PMID: 16266991
6. Tissing WJ, Meijerink JP, den Boer ML, Brinkhof B, van Rossum EF, van Wering ER, et al. Genetic vari-
ations in the glucocorticoid receptor gene are not related to glucocorticoid resistance in childhood acute
lymphoblastic leukemia. Clin Cancer Res. 2005; 11(16):6050–6. doi: 10.1158/1078-0432.CCR-04-
2097 PMID: 16115950
7. Kfir-Erenfeld S, Sionov RV, Spokoini R, Cohen O, Yefenof E. Protein kinase networks regulating gluco-
corticoid-induced apoptosis of hematopoietic cancer cells: fundamental aspects and practical consider-
ations. Leuk Lymphoma. 2010; 51(11):1968–2005. doi: 10.3109/10428194.2010.506570 PMID:
20849387
8. Lauten M, Cario G, Asgedom G, Welte K, Schrappe M. Protein expression of the glucocorticoid receptor
in childhood acute lymphoblastic leukemia. Haematologica. 2003; 88(11):1253–8. PMID: 14607754
9. Haarman EG, Kaspers GJ, Pieters R, Rottier MM, Veerman AJ. Glucocorticoid receptor alpha, beta
and gamma expression vs in vitro glucocorticod resistance in childhood leukemia. Leukemia. 2004; 18
(3):530–7. doi: 10.1038/sj.leu.2403225 PMID: 14724649
10. Tissing WJ, Lauten M, Meijerink JP, den Boer ML, Koper JW, Sonneveld P, et al. Expression of the glu-
cocorticoid receptor and its isoforms in relation to glucocorticoid resistance in childhood acute lympho-
cytic leukemia. Haematologica. 2005; 90(9):1279–81. PMID: 16154856
11. Lauten M, Beger C, Gerdes K, Asgedom G, Kardinal C, Welte K, et al. Expression of heat-shock protein
90 in glucocorticoid-sensitive and -resistant childhood acute lymphoblastic leukaemia. Leukemia. 2003;
17(8):1551–6 doi: 10.1038/sj.leu.2403027 PMID: 12886242
12. Tissing WJ, Meijerink JP, den Boer ML, Brinkhof B, Pieters R. mRNA expression levels of (co)chaper-
one molecules of the glucocorticoid receptor are not involved in glucocorticoid resistance in pediatric
ALL. Leukemia. 2005; 19(5):727–33. doi: 10.1038/sj.leu.2403681 PMID: 15759037
13. Piovan E, Yu J, Tosello V, Herranz D, Ambesi-Impiombato A, Da Silva AC, et al. Direct reversal of glu-
cocorticoid resistance by AKT inhibition in acute lymphoblastic leukemia. Cancer Cell. 2013; 24(6):766–
76. doi: 10.1016/j.ccr.2013.10.022 PMID: 24291004
14. Jing D, Bhadri VA, Beck D, Thoms JA, Yakob NA, Wong JW, et al. Opposing regulation of BIM and
BCL2 controls glucocorticoid-induced apoptosis of pediatric acute lymphoblastic leukemia cells. Blood.
2015; 125(2):273–83. doi: 10.1182/blood-2014-05-576470 PMID: 25336632
15. Real PJ, Tosello V, Palomero T, Castillo M, Hernando E, de Stanchina E, et al. Gamma-secretase inhib-
itors reverse glucocorticoid resistance in T cell acute lymphoblastic leukemia. Nat Med. 2009; 15(1):50–
8. doi: 10.1038/nm.1900 PMID: 19098907
16. Aries IM, van den Dungen RE, Koudijs MJ, Cuppen E, Voest E, Molenaar JJ, et al. Towards personal-
ized therapy in pediatric acute lymphoblastic leukemia: RAS mutations and prednisolone resistance.
Haematologica. 2015; 100(4):e132–6. doi: 10.3324/haematol.2014.112995 PMID: 25480501
17. Driessen EM, van Roon EH, Spijkers-Hagelstein JA, Schneider P, de Lorenzo P, Valsecchi MG, et al.
Frequencies and prognostic impact of RAS mutations in MLL-rearranged acute lymphoblastic leukemia
in infants. Haematologica. 2013; 98(6):937–44. doi: 10.3324/haematol.2012.067983 PMID: 23403319
IL7R Signaling Mutations Confer Steroid Resistance in T-ALL
PLOS Medicine | DOI:10.1371/journal.pmed.1002200 December 20, 2016 30 / 33
18. Irving J, Matheson E, Minto L, Blair H, Case M, Halsey C, et al. Ras pathway mutations are prevalent in
relapsed childhood acute lymphoblastic leukemia and confer sensitivity to MEK inhibition. Blood. 2014;
124(23):3420–30. doi: 10.1182/blood-2014-04-531871 PMID: 25253770
19. Paugh SW, Bonten EJ, Savic D, Ramsey LB, Thierfelder WE, Gurung P, et al. NALP3 inflammasome
upregulation and CASP1 cleavage of the glucocorticoid receptor cause glucocorticoid resistance in leu-
kemia cells. Nat Genet. 2015; 47(6):607–14. doi: 10.1038/ng.3283 PMID: 25938942
20. Zuurbier L, Petricoin EF 3rd, Vuerhard MJ, Calvert V, Kooi C, Buijs-Gladdines JG, et al. The signifi-
cance of PTEN and AKT aberrations in pediatric T-cell acute lymphoblastic leukemia. Haematologica.
2012; 97(9):1405–13. doi: 10.3324/haematol.2011.059030 PMID: 22491738
21. Drmanac R, Sparks AB, Callow MJ, Halpern AL, Burns NL, Kermani BG, et al. Human genome
sequencing using unchained base reads on self-assembling DNA nanoarrays. Science. 2010; 327
(5961):78–81. doi: 10.1126/science.1181498 PMID: 19892942
22. Li H, Durbin R. Fast and accurate short read alignment with Burrows-Wheeler transform. Bioinformatics.
2009; 25(14):1754–60. doi: 10.1093/bioinformatics/btp324 PMID: 19451168
23. Taylor A, Steinberg J, Andrews TS, Webber C. GeneNet Toolbox for MATLAB: a flexible platform for
the analysis of gene connectivity in biological networks. Bioinformatics. 2015; 31(3):442–4. doi: 10.
1093/bioinformatics/btu669 PMID: 25319962
24. Bamford S, Dawson E, Forbes S, Clements J, Pettett R, Dogan A, et al. The COSMIC (Catalogue of
Somatic Mutations in Cancer) database and website. Br J Cancer. 2004; 91(2):355–8. doi: 10.1038/sj.
bjc.6601894 PMID: 15188009
25. Van Vlierberghe P, Pieters R, Beverloo HB, Meijerink JP. Molecular-genetic insights in paediatric T-cell
acute lymphoblastic leukaemia. Br J Haematol. 2008; 143(2):153–68. doi: 10.1111/j.1365-2141.2008.
07314.x PMID: 18691165
26. Kumar A, White TA, MacKenzie AP, Clegg N, Lee C, Dumpit RF, et al. Exome sequencing identifies a
spectrum of mutation frequencies in advanced and lethal prostate cancers. Proc Natl Acad Sci U S A.
2011; 108(41):17087–92. doi: 10.1073/pnas.1108745108 PMID: 21949389
27. Sherry ST, Ward MH, Kholodov M, Baker J, Phan L, Smigielski EM, et al. dbSNP: the NCBI database of
genetic variation. Nucleic Acids Res. 2001; 29(1):308–11. PMID: 11125122
28. 1000 Genomes Project Consortium, Abecasis GR, Auton A, Brooks LD, DePristo MA, Durbin RM, et al.
An integrated map of genetic variation from 1,092 human genomes. Nature. 2012; 491(7422):56–65.
doi: 10.1038/nature11632 PMID: 23128226
29. Stubbs A, McClellan EA, Horsman S, Hiltemann SD, Palli I, Nouwens S, et al. Huvariome: a web server
resource of whole genome next-generation sequencing allelic frequencies to aid in pathological candi-
date gene selection. J Clin Bioinforma. 2012; 2(1):19. doi: 10.1186/2043-9113-2-19 PMID: 23164068
30. Vissers LE, de Ligt J, Gilissen C, Janssen I, Steehouwer M, de Vries P, et al. A de novo paradigm for
mental retardation. Nat Genet. 2010; 42(12):1109–12. doi: 10.1038/ng.712 PMID: 21076407
31. Lepretre F, Villenet C, Quief S, Nibourel O, Jacquemin C, Troussard X, et al. Waved aCGH: to smooth
or not to smooth. Nucleic Acids Res. 2010; 38(7):e94. doi: 10.1093/nar/gkp1215 PMID: 20071741
32. Homminga I, Pieters R, Langerak AW, de Rooi JJ, Stubbs A, Verstegen M, et al. Integrated transcript
and genome analyses reveal NKX2-1 and MEF2C as potential oncogenes in T cell acute lymphoblastic
leukemia. Cancer Cell. 2011; 19(4):484–97. doi: 10.1016/j.ccr.2011.02.008 PMID: 21481790
33. Uitdehaag JC, de Roos JA, van Doornmalen AM, Prinsen MB, de Man J, Tanizawa Y, et al. Comparison
of the cancer gene targeting and biochemical selectivities of all targeted kinase inhibitors approved for
clinical use. PLoS ONE. 2014; 9(3):e92146. doi: 10.1371/journal.pone.0092146 PMID: 24651269
34. Chou TC. Drug combination studies and their synergy quantification using the Chou-Talalay method.
Cancer Res. 2010; 70(2):440–6. doi: 10.1158/0008-5472.CAN-09-1947 PMID: 20068163
35. Uitdehaag JC, de Roos JA, van Doornmalen AM, Prinsen MB, Spijkers-Hagelstein JA, de Vetter JR,
et al. Selective targeting of CTNBB1-, KRAS- or MYC-driven cell growth by combinations of existing
drugs. PLoS ONE. 2015; 10(5):e0125021. doi: 10.1371/journal.pone.0125021 PMID: 26018524
36. Korbel JO, Campbell PJ. Criteria for inference of chromothripsis in cancer genomes. Cell. 2013; 152
(6):1226–36. doi: 10.1016/j.cell.2013.02.023 PMID: 23498933
37. Escherich G, Troger A, Gobel U, Graubner U, Pekrun A, Jorch N, et al. The long-term impact of in vitro
drug sensitivity on risk stratification and treatment outcome in acute lymphoblastic leukemia of child-
hood (CoALL 06–97). Haematologica. 2011; 96(6):854–62. doi: 10.3324/haematol.2010.039735 PMID:
21330320
38. Coustan-Smith E, Mullighan CG, Onciu M, Behm FG, Raimondi SC, Pei D, et al. Early T-cell precursor
leukaemia: a subtype of very high-risk acute lymphoblastic leukaemia. Lancet Oncol. 2009; 10(2):147–
56. doi: 10.1016/S1470-2045(08)70314-0 PMID: 19147408
IL7R Signaling Mutations Confer Steroid Resistance in T-ALL
PLOS Medicine | DOI:10.1371/journal.pmed.1002200 December 20, 2016 31 / 33
39. Zuurbier L, Gutierrez A, Mullighan CG, Cante-Barrett K, Gevaert O, De Rooi J, et al. Immature MEF2C-
dysregulated T-ALL patients have an ETP-ALL gene signature and typically have non-rearranged T-cell
receptors. Haematologica. 2014; 99:94–102. doi: 10.3324/haematol.2013.090233 PMID: 23975177
40. Mendes RD, Sarmento LM, Cante-Barrett K, Zuurbier L, Buijs-Gladdines JG, Povoa V, et al. PTEN
microdeletions in T-cell acute lymphoblastic leukemia are caused by illegitimate RAG-mediated recom-
bination events. Blood. 2014; 124:567–78. doi: 10.1182/blood-2014-03-562751 PMID: 24904117
41. Cante-Barrett K, Spijkers-Hagelstein JA, Buijs-Gladdines JG, Uitdehaag JC, Smits WK, van der Zwet J,
et al. MEK and PI3K-AKT inhibitors synergistically block activated IL7 receptor signaling in T-cell acute
lymphoblastic leukemia. Leukemia. 2016; 30(9):1832–43. doi: 10.1038/leu.2016.83 PMID: 27174491
42. Carpten JD, Faber AL, Horn C, Donoho GP, Briggs SL, Robbins CM, et al. A transforming mutation in
the pleckstrin homology domain of AKT1 in cancer. Nature. 2007; 448(7152):439–44. doi: 10.1038/
nature05933 PMID: 17611497
43. Abrams MT, Robertson NM, Yoon K, Wickstrom E. Inhibition of glucocorticoid-induced apoptosis by tar-
geting the major splice variants of BIM mRNA with small interfering RNA and short hairpin RNA. J Biol
Chem. 2004; 279(53):55809–17. doi: 10.1074/jbc.M411767200 PMID: 15509554
44. Erlacher M, Michalak EM, Kelly PN, Labi V, Niederegger H, Coultas L, et al. BH3-only proteins Puma
and Bim are rate-limiting for gamma-radiation- and glucocorticoid-induced apoptosis of lymphoid cells
in vivo. Blood. 2005; 106(13):4131–8. doi: 10.1182/blood-2005-04-1595 PMID: 16118324
45. Lu J, Quearry B, Harada H. p38-MAP kinase activation followed by BIM induction is essential for gluco-
corticoid-induced apoptosis in lymphoblastic leukemia cells. FEBS Lett. 2006; 580(14):3539–44. doi:
10.1016/j.febslet.2006.05.031 PMID: 16730715
46. Villunger A, Michalak EM, Coultas L, Mullauer F, Bock G, Ausserlechner MJ, et al. p53- and drug-
induced apoptotic responses mediated by BH3-only proteins puma and noxa. Science. 2003; 302
(5647):1036–8. doi: 10.1126/science.1090072 PMID: 14500851
47. Puthalakath H, Huang DC, O’Reilly LA, King SM, Strasser A. The proapoptotic activity of the Bcl-2 fam-
ily member Bim is regulated by interaction with the dynein motor complex. Mol Cell. 1999; 3(3):287–96.
PMID: 10198631
48. Spokoini R, Kfir-Erenfeld S, Yefenof E, Sionov RV. Glycogen synthase kinase-3 plays a central role in
mediating glucocorticoid-induced apoptosis. Mol Endocrinol. 2010; 24(6):1136–50. doi: 10.1210/me.
2009-0466 PMID: 20371704
49. Cramer SD, Aplan PD, Durum SK. Therapeutic targeting of IL-7Ralpha signaling pathways in ALL treat-
ment. Blood. 2016; 128(4):473–8. doi: 10.1182/blood-2016-03-679209 PMID: 27268088
50. Asnafi V, Le Noir S, Lhermitte L, Gardin C, Legrand F, Vallantin X, et al. JAK1 mutations are not fre-
quent events in adult T-ALL: a GRAALL study. Br J Haematol. 2010; 148(1):178–9. doi: 10.1111/j.1365-
2141.2009.07912.x PMID: 19764985
51. Vicente C, Schwab C, Broux M, Geerdens E, Degryse S, Demeyer S, et al. Targeted sequencing identi-
fies associations between IL7R-JAK mutations and epigenetic modulators in T-cell acute lymphoblastic
leukemia. Haematologica. 2015; 100(10):1301–10. doi: 10.3324/haematol.2015.130179 PMID:
26206799
52. Zenatti PP, Ribeiro D, Li W, Zuurbier L, Silva MC, Paganin M, et al. Oncogenic IL7R gain-of-function
mutations in childhood T-cell acute lymphoblastic leukemia. Nat Genet. 2011; 43(10):932–9. doi: 10.
1038/ng.924 PMID: 21892159
53. Flex E, Petrangeli V, Stella L, Chiaretti S, Hornakova T, Knoops L, et al. Somatically acquired JAK1
mutations in adult acute lymphoblastic leukemia. J Exp Med. 2008; 205(4):751–8. doi: 10.1084/jem.
20072182 PMID: 18362173
54. Trinquand A, Tanguy-Schmidt A, Ben Abdelali R, Lambert J, Beldjord K, Lengline E, et al. Toward a
NOTCH1/FBXW7/RAS/PTEN-based oncogenetic risk classification of adult T-cell acute lymphoblastic
leukemia: a Group for Research in Adult Acute Lymphoblastic Leukemia study. J Clin Oncol. 2013; 31
(34):4333–42. doi: 10.1200/JCO.2012.48.5292 PMID: 24166518
55. Degryse S, de Bock CE, Cox L, Demeyer S, Gielen O, Mentens N, et al. JAK3 mutants transform
hematopoietic cells through JAK1 activation, causing T-cell acute lymphoblastic leukemia in a mouse
model. Blood. 2014; 124(20):3092–100. doi: 10.1182/blood-2014-04-566687 PMID: 25193870
56. Tissing WJ, den Boer ML, Meijerink JP, Menezes RX, Swagemakers S, van der Spek PJ, et al. Geno-
mewide identification of prednisolone-responsive genes in acute lymphoblastic leukemia cells. Blood.
2007; 109(9):3929–35. doi: 10.1182/blood-2006-11-056366 PMID: 17218380
57. Ley R, Balmanno K, Hadfield K, Weston C, Cook SJ. Activation of the ERK1/2 signaling pathway pro-
motes phosphorylation and proteasome-dependent degradation of the BH3-only protein, Bim. J Biol
Chem. 2003; 278(21):18811–6. doi: 10.1074/jbc.M301010200 PMID: 12646560
IL7R Signaling Mutations Confer Steroid Resistance in T-ALL
PLOS Medicine | DOI:10.1371/journal.pmed.1002200 December 20, 2016 32 / 33
58. Luciano F, Jacquel A, Colosetti P, Herrant M, Cagnol S, Pages G, et al. Phosphorylation of Bim-EL by
Erk1/2 on serine 69 promotes its degradation via the proteasome pathway and regulates its proapopto-
tic function. Oncogene. 2003; 22(43):6785–93. doi: 10.1038/sj.onc.1206792 PMID: 14555991
59. Maude SL, Dolai S, Delgado-Martin C, Vincent T, Robbins A, Selvanathan A, et al. Efficacy of JAK/
STAT pathway inhibition in murine xenograft models of early T-cell precursor (ETP) acute lymphoblastic
leukemia. Blood. 2015; 125(11):1759–67. doi: 10.1182/blood-2014-06-580480 PMID: 25645356
60. Treanor LM, Zhou S, Janke L, Churchman ML, Ma Z, Lu T, et al. Interleukin-7 receptor mutants initiate
early T cell precursor leukemia in murine thymocyte progenitors with multipotent potential. J Exp Med.
2014; 211(4):701–13. doi: 10.1084/jem.20122727 PMID: 24687960
61. Mullighan CG. Genome sequencing of lymphoid malignancies. Blood. 2013; 122(24):3899–907. doi:
10.1182/blood-2013-08-460311 PMID: 24041576
62. Roberts KG, Mullighan CG. Genomics in acute lymphoblastic leukaemia: insights and treatment impli-
cations. Nat Rev Clin Oncol. 2015; 12(6):344–57. doi: 10.1038/nrclinonc.2015.38 PMID: 25781572
63. Morishita N, Tsukahara H, Chayama K, Ishida T, Washio K, Miyamura T, et al. Activation of Akt is asso-
ciated with poor prognosis and chemotherapeutic resistance in pediatric B-precursor acute lymphoblas-
tic leukemia. Pediatr Blood Cancer. 2012; 59(1):83–9. doi: 10.1002/pbc.24034 PMID: 22183914
64. Holleman A, Cheok MH, den Boer ML, Yang W, Veerman AJ, Kazemier KM, et al. Gene-expression
patterns in drug-resistant acute lymphoblastic leukemia cells and response to treatment. N Engl J Med.
2004; 351(6):533–42. doi: 10.1056/NEJMoa033513 PMID: 15295046
65. Stam RW, Den Boer ML, Schneider P, de Boer J, Hagelstein J, Valsecchi MG, et al. Association of
high-level MCL-1 expression with in vitro and in vivo prednisone resistance in MLL-rearranged infant
acute lymphoblastic leukemia. Blood. 2010; 115(5):1018–25. doi: 10.1182/blood-2009-02-205963
PMID: 19965632
66. Wei G, Twomey D, Lamb J, Schlis K, Agarwal J, Stam RW, et al. Gene expression-based chemical
genomics identifies rapamycin as a modulator of MCL1 and glucocorticoid resistance. Cancer Cell.
2006; 10(4):331–42. doi: 10.1016/j.ccr.2006.09.006 PMID: 17010674
67. Hall CP, Reynolds CP, Kang MH. Modulation of glucocorticoid resistance in pediatric T-cell acute lym-
phoblastic leukemia by increasing BIM expression with the PI3K/mTOR inhibitor BEZ235. Clin Cancer
Res. 2016; 22(3):621–32. doi: 10.1158/1078-0432.CCR-15-0114 PMID: 26080839
IL7R Signaling Mutations Confer Steroid Resistance in T-ALL
PLOS Medicine | DOI:10.1371/journal.pmed.1002200 December 20, 2016 33 / 33
Top Related